Historical Swing High-Low Gann IndicatorThe Historical Swing High-Low Gann Indicator is a powerful tool designed to track and visualize key market swing points over time. This indicator identifies significant swing highs and lows within a specified time frame and draws connecting lines between these points, allowing traders to observe the natural ebb and flow of the market.
What sets this indicator apart is its ability to maintain all previously drawn swing lines, creating a comprehensive historical view of market movements. Additionally, the indicator projects Gann-style lines from the most recent swing highs and lows, providing traders with potential future support and resistance levels based on the geometric progression of price action.
Features:
Swing Detection: Automatically detects significant swing highs and lows over a user-defined period (default is 3 hours).
Persistent Historical Lines: Keeps all previously drawn lines, offering a complete visual history of the market's swing points.
Gann-Style Projections: Draws forward-looking lines from the latest swing points to help predict possible future market levels.
Customizable Parameters: Allows users to adjust the swing detection period to suit different trading styles and time frames.
This indicator is ideal for traders who rely on price action, support and resistance levels, and Gann theory for their analysis. Whether used in isolation or as part of a broader strategy, the Historical Swing High-Low Gann Indicator provides valuable insights into the market's behavior over time.
Titik Pivot

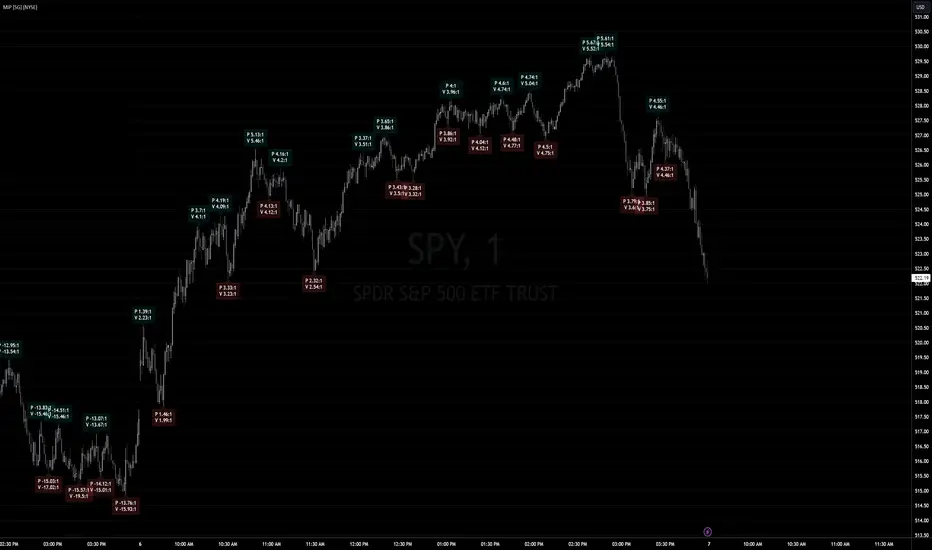
Market Internal Pivots by SyntaxGeekThis indicator combines simple pivot detection with market breadth ratios.
The thought was to show market breadth strength or weakness where price was making potential pivots.
Lookback can be adjusted and currently it supports NYSE and NASDAQ market breadth.
Configuration is limited given the simplicity but live breadth printout can be displayed at current candle.
Max label count is at 500 but the indicator makes use of the visible chart library and will redraw old pivot labels when scrolling back, up to 500.
Considering that market breadth data is only available during RTH, do not expect data during ETH sessions. I've only tested this up to 1hr timeframe so I can't guarantee higher timeframes will present correctly.
Feel free to leave feedback, happy trading!
WMA Trend and Growth Rate IndicatorThe "WMA Trend and Growth Rate Indicator" is a powerful tool for analyzing market trends and momentum. By understanding its components and how to configure it, traders of all levels can leverage this indicator to enhance their trading strategies. Experiment with the settings and integrate it into your analysis to gain valuable insights into market movements.
Indicator Components
WMA Length : The length of the WMA. This controls how many periods are included in the calculation.
Start : The starting value for accumulation levels.
End : The ending value for accumulation levels.
Key Concepts
Weighted Moving Average (WMA): A type of moving average that gives more weight to recent price data, making it more responsive to recent price changes.
Growth Rate : Measures how much the WMA has increased or decreased over a specified period, expressed as a percentage.
Accumulation and Distribution Levels : Zones where buying (accumulation) or selling (distribution) pressure is expected.
Configuring the Inputs
WMA Length : Adjust this value to change the sensitivity of the WMA. A smaller value makes the WMA more sensitive to recent price changes, while a larger value smooths out the data more.
Start and End : Adjust these values to define the range for accumulation and distribution levels. The indicator will automatically adjust the colors based on whether the Start value is higher or lower than the End value.
Interpreting the Plots
WMAT Line : The main trend line that shows the direction and strength of the trend.
Growth Index : Shows the growth rate of the WMAT.
Accumulation Levels : Indicated by lines and fill colors, showing potential zones to increase positions.
Distribution Levels : Indicated by lines and fill colors, showing potential zones to decrease positions.
The indicator checks if "Start" is greater than "End". Based on this check, it assigns colors to the accumulation and distribution levels. This color scheme helps traders visually distinguish between areas of potential buying and selling zones.

Trendline Cross CountThe Trendline Cross Count indicator is an innovative technical analysis tool that revolutionizes the way traders interact with trendlines. This cutting-edge indicator doesn't just identify trendlines - it quantifies their impact on price action in real-time, providing traders with unprecedented insight into market structure.
Core Functionality:
Trendline Cross Quantification:
At the heart of this indicator is its ability to display the actual number of trendlines being crossed by the current price. The algorithm doesn't just count intersections; it evaluates the significance of each trendline, weighing factors such as trendline duration, number of touch points, and historical reliability.
Dynamic Trendline Generation:
The indicator employs an advanced pivot-based trendline detection system. It continuously scans the chart for significant pivot points and constructs trendlines based on these pivots. The innovation lies in its ability to adapt to changing market conditions, constantly updating its trendline library.
Confluence Analysis:
By tracking multiple trendlines simultaneously, the indicator provides a real-time measure of trendline confluence. This allows traders to identify areas where multiple significant trendlines converge, potentially signaling powerful support or resistance levels.
Key Inputs and Their Significance:
Trendline Source:
This input allows traders to select the price data used for trendline analysis. While the default is the closing price, the flexibility to choose other price points enables traders to tailor the analysis to their specific trading style or market preferences.
Pivot Size:
This crucial parameter defines the lookback period for identifying pivot points. The default value of 3 strikes a balance between sensitivity and reliability, but adjusting this value can dramatically alter the indicator's behavior. Lower values increase sensitivity but may introduce noise, while higher values provide more stable, long-term trendlines.
Pivot Sequence:
This innovative feature allows traders to focus on specific market structures. Options include:
"LL" (Lower Lows): Focuses on downtrends
"HH" (Higher Highs): Emphasizes uptrends
"Any": Provides a comprehensive view of all trendlines
What Makes It Unique:
The Trendline Cross Count indicator stands out due to several groundbreaking features:
Quantitative Trendline Analysis:
While most indicators simply draw trendlines, this tool quantifies their impact, providing a numerical representation of market structure complexity.
Adaptive Pivot Detection:
The indicator's ability to dynamically adjust its pivot detection based on market volatility ensures relevance across all market conditions.
Sequence-Based Filtering:
The unique pivot sequence option allows traders to focus on specific trend types, a feature not found in conventional trendline tools.
Real-Time Confluence Measurement:
By providing a live count of intersecting trendlines, traders gain instant insight into potential support and resistance strength.
Significance Algorithm:
Not all trendlines are created equal. This indicator employs an algorithm to weigh the importance of each trendline, ensuring that the cross count reflects truly significant levels.
This indicator represents a significant advancement in trendline analysis, offering insights that are not readily available through traditional methods. Its ability to quantify trendline interactions in real-time provides traders with a unique edge in understanding market structure and potential price movements. The Trendline Cross Count indicator is not just a tool, but a gateway to a new dimension of technical analysis.

Multiple Divergences [UAlgo]🔶 Description:
"Multiple Divergences " is providing insights into potential divergences across multiple indicators. Divergence, a concept in technical analysis, occurs when the price of an asset diverges from the direction of an accompanying indicator, suggesting a possible reversal or continuation in the price trend.
🔶 Key Features:
Customizable Divergence Settings: Users can adjust parameters such as the minimum number of divergences required to display labels, pivot lookback periods, and plot options for various types of divergences (regular or hidden) and bullish/bearish labels.
Multiple Technical Indicators: The script supports a wide range of popular indicators, including MACD, RSI, Stochastic, CCI, Momentum, OBV, DMI Oscillator, VWmacd, Chaikin Money Flow, Money Flow Index, and Awesome Oscillator. You can choose any of the above-mentioned technical indicators for which you want to capture divergences.
🔶 Purpose of Using Multiple Technical Indicators
In the complex and volatile world of trading, relying on a single indicator can provide an incomplete or misleading picture of market conditions. Different technical indicators analyze various aspects of price movement, volume, and momentum, offering unique insights that can complement each other. By utilizing multiple indicators, traders can cross-verify signals, reduce false positives, and increase the reliability of their trading decisions.
Identifying divergences across multiple indicators further enhances this reliability, as a divergence spotted in several indicators simultaneously is a stronger signal than one found in isolation. This comprehensive approach helps traders to anticipate potential market turning points with greater confidence and precision.
By integrating multiple technical indicators and meticulously tracking their divergences, this script aims traders with a robust tool for navigating the complexities of financial markets.
🔶 How to Obtain Divergences
Regular Bullish Divergence:
This occurs when the price makes a new lower low compared to a previous pivot low, indicating a downward trend. Simultaneously, the selected oscillator makes a higher low compared to its previous pivot low, indicating a potential upward momentum. This divergence suggests that, despite the falling price, the underlying momentum is strengthening, potentially signaling a reversal to an upward trend.
Regular Bearish Divergence:
This happens when the price makes a new higher high compared to a previous pivot high, indicating an upward trend. Concurrently, the selected oscillator makes a lower high compared to its previous pivot high, indicating weakening momentum. This divergence suggests that, despite the rising price, the underlying momentum is weakening, potentially signaling a reversal to a downward trend.
Example for Regular Bullish and Regular Bearish Divergences (Minimum Divergenes Count to Display = 3, All Selected):
Hidden Bullish Divergence:
Hidden bullish divergence is observed when the price makes a higher low compared to a previous pivot low, indicating an upward trend. At the same time, the oscillator makes a lower low compared to its previous pivot low, indicating a potential strengthening momentum. This condition suggests that the underlying strength of the upward trend is intact, despite the oscillator indicating otherwise.
Hidden Bearish Divergence:
This occurs when the price makes a lower high compared to a previous pivot high, indicating a downward trend. Simultaneously, the oscillator makes a higher high compared to its previous pivot high, indicating a potential weakening momentum. This divergence suggests that the underlying weakness of the downward trend is intact, despite the oscillator indicating otherwise.
Divergence Labeling: The script dynamically generates labels on the chart to visually highlight detected divergences based on user-defined criteria. (E.g. "5 Regular Bullish Divs." , "1 Hidden Bearish Div")
🔶 Disclaimer:
Use with Caution: This indicator is provided for educational and informational purposes only and should not be considered as financial advice. Users should exercise caution and perform their own analysis before making trading decisions based on the indicator's signals.
Not Financial Advice: The information provided by this indicator does not constitute financial advice, and the creator (UAlgo) shall not be held responsible for any trading losses incurred as a result of using this indicator.
Backtesting Recommended: Traders are encouraged to backtest the indicator thoroughly on historical data before using it in live trading to assess its performance and suitability for their trading strategies.
Risk Management: Trading involves inherent risks, and users should implement proper risk management strategies, including but not limited to stop-loss orders and position sizing, to mitigate potential losses.
No Guarantees: The accuracy and reliability of the indicator's signals cannot be guaranteed, as they are based on historical price data and past performance may not be indicative of future results.

Liquidity Swings & SweepsThis Pine script indicator is designed to create a visual representation liquidity as identified by swing Highs/Lows along with an indication of the liquidity level that was swept, optionally rating the strength of the sweep based on time & price.
Relevance:
Liquidity levels & sweeps are crucial for many SMC/ICT setups and can indicate a point at which the price changes direction or may re-trace in an opposite direction to provide additional liquidity for continued move in the original direction. Additionally, liquidity levels may provide targets for setups, as price action will often seek to take out those levels as they main contain many buy/sell stops.
How It Works:
The indicator tracks all swing points, as identified using user-defined strength of the swing. Once a swing is formed that meets the criteria, it is represented by a horizontal line starting at the price of the current swing until the last bar on the chart. While the swing is valid, this line will continue to be extended until the swing is invalid or a new swing is formed. Upon identifying a new swing, the indicator then scans the earlier swings in the same direction looking for a point of greatest liquidity that was taken by the current swing. This level is then denoted by dashed horizontal line, connecting earlier swing point to the current. At the same time any liquidity zones between the two swings are automatically removed from the chart if they had previously been rendered on the chart. If the setting to enable scan for maximum liquidity is enabled, then while looking back, the indicator will look for lowest low or highest high that was taken by the current swing point, which may not be a swing itself, however, is a lowest/highest price point taken (mitigated) by the current swing, which in many cases will be better price then then the one represented by previous swing. If the option to render sweep label is enabled, the sweep line will also be completed by a label, that will score the sweep and a tooltip showing the details of the level swept and the time it took to sweep it. The score explained further in configurability section ranks the strength of the sweep based on time and is complemented by price (difference in price between the two liquidity levels).
Configurability:
A user may configure the strength of the swing using both left/right strength (number of bars) as well as optionally instruct the indicator to seek the lowest/highest price point which may not be previous swing that was taken out by newly formed swing.
From appearance perspective liquidity level colors & line width presenting the liquidity/swing can be configured. There is also an option to render the liquidity sweep label that will generate an icon-based rating of the liquidity sweep and a tooltip that provides details on the scope of the swing, which includes liquidity level swept and when it was formed along with the time it took to sweep the liquidity.
Rating is of sweeps is primarily based on time with a secondary reference to price
💥- Best rating, very strong sweep with an hourly or better liquidity sweep
🔥- Second rating, strong sweep with 15 – 59 minute liquidity sweep, or 5+ minute sweep of 10+ points
✅- Third rating, ok sweep with 5 - 15 minute liquidity sweep, or lower-time-frame sweep of 10+ points
❄️ - Weakest sweep, with liquidity of 5 or less minutes swept
What makes this indicator different:
Designed with high performance in mind, to reduce impact on chart render time.
Only keeps valid liquidity levels & sweeps on the chart
Automatically removes previously taken liquidity levels
Ranks liquidity sweeps to indicate strength of the sweep

Pivot Point Profile [LuxAlgo]The Pivot Point Profile indicator groups and displays data accumulated from previous pivot points, providing a comprehensive method for prioritizing and displaying areas of interest directly given by swing highs and lows.
Users have access to common settings present in other profile-type indicators.
🔶 USAGE
The Pivot Point Profile is particularly helpful in identifying highly active reversal zones that have been visited multiple times by price. Because of this, we could generally expect these areas to serve as future points of interest, often acting as support or resistance when re-visited.
The profile displays data associated with both Pivot Highs and Pivot Lows. Each row consists of pivot high and pivot low counts side-by-side, forming the total width of the row.
By analyzing the row as a whole, we can gain a better understanding of WHERE to look for interactions.
By analyzing the pivot counts independently, we can gain a better understanding of WHAT to expect when returning to these areas.
For example:
If a row in the profile contains entirely Pivot Lows, this could be seen as an indication to look for buyers to hold that level for a continuation upwards. A break of this level could be interpreted as a lack of interest from previous buyers at this level, indicating a further move down.
🔹 Concentrated Areas
Each row in the profile displays the current count of high pivots and low pivots within the selected lookback. The largest count for each pivot direction is identified as a "Concentrated Area (CA)", these CAs are highlighted over the chart with a line displaying the average of all pivots within that CA. The CA Average is the average of all pivot points (in the majority direction) within the given row.
These can hold more importance as potential support/resistance areas.
Note: The CA Threshold can be manually adjusted to highlight all rows based on a user-selected value.
🔶 DETAILS
🔹 Calculation
The idea behind the Pivot Point Profile is a new analysis method for pivot points, taking the idea of a volume profile and adapting it to display pivot points instead of volume. By using this data, in theory, we should be able to better prioritize zones to anticipate reversals, as well as identify key levels to watch for buyer & seller interactions to use as confirmations in direction.
The (vertical) width of each row is the product of the script's "Row Size", this is the number of rows that the profile will consist of. With a max of 250, the profile can be decently granular. That being said, A more granular profile will have fewer overlapping pivot points. By decreasing the row size (Using fewer rows in the profile) you will increase the tolerance for grouping pivot points. Potentially leading to a more comprehensive Profile. Inversely, By reducing the tolerance for grouping, you will better visualize only similar highs and lows but may have noisier data to sift through.
The Profile is calculated based on a "Lookback" parameter, using only the lookback amount of previous high and low pivots to calculate the profile. Configuring this parameter alongside "Pivot Length", will allow for great control over the frame of reference of the profile.
Note: This indicator is capable of utilizing the full chart history of pivot points, this can be done by enabling the "Use Full Chart History" setting, this will cause the script will calculate from everything it has access to on your current chart.
🔹 Display
The Pivot Point Profile display can be customized to fit a various range of chart styles and visual needs. The specific settings to adjust these can be located in the "Profile Display" Section of the User Inputs.
Profile Width: Sets the Left to Right Width of the Profile. This is the maximum width that the profile will occupy and will scale to fit within this width.
Profile Offset: Sets the distance of the Profile's Axis from the current chart candle. This moves the entire profile left and right to enable to user to set the distance between the profile and the current candle.
Direction: Changes the display direction of the profile, allowing for "Left", "Right", or "Center" display styles.
🔶 SETTINGS
🔹 Pivot Point Parameters
Pivot Type: Choose between "Fractal Pivots" or "SMC Structure" to use as the basis for pivots.
Length: Sets the length for the pivot calculations.
🔹 Profile Calculations Parameters
Lookback: Sets the number of pivots to calculate within, in increments of high and low pairs. (Setting this to 1 = 1 Pivot High & 1 Pivot Low)
Use Full Chart History: Disregards the set lookback and instead uses all available chart data to calculate from.
Row Size: Sets the total number of rows to calculate the profile with.
🔹 Profile Display
Profile Width: Sets the max left & right width (in bars) that the profile will occupy.
Profile Offset: Sets the distance of the profile axis from the last chart bar.
Direction: Sets the display direction
🔹 Concentrated Areas
Highlight CAs: Extends the rows left from concentrated areas.
CA Threshold: Manually set the threshold for determining concentrated areas, when disabled, only the largest rows will be displayed.
CA Averages: Toggles the concentrated area averages for each pivot direction.
Note: CA Averages can be displayed independently without CA Highlights being displayed, and vice versa.

KillZones + ACD Fisher [TradingFinder] Sessions + Reversal Level🔵 Introduction
🟣 ACD Method
"The Logical Trader" opens with a thorough exploration of the ACD Methodology, which focuses on pinpointing particular price levels associated with the opening range.
This approach enables traders to establish reference points for their trades, using "A" and "C" points as entry markers. Additionally, the book covers the concept of the "Pivot Range" and how integrating it with the ACD method can help maximize position size while minimizing risk.
🟣 Session
The forex market is operational 24 hours a day, five days a week, closing only on Saturdays and Sundays. Typically, traders prefer to concentrate on one specific forex trading session rather than attempting to trade around the clock.
Trading sessions are defined time periods when a particular financial market is active, allowing for the execution of trades.
The most crucial trading sessions within the 24-hour cycle are the Asia, London, and New York sessions, as these are when substantial money flows and liquidity enter the market.
🟣 Kill Zone
Traders in financial markets earn profits by capitalizing on the difference between their buy/sell prices and the prevailing market prices.
Traders vary in their trading timelines.Some traders engage in daily or even hourly trading, necessitating activity during periods with optimal trading volumes and notable price movements.
Kill zones refer to parts of a session characterized by higher trading volumes and increased price volatility compared to the rest of the session.
🔵 How to Use
🟣 Session Times
The "Asia Session" comprises two parts: "Sydney" and "Tokyo." This session begins at 23:00 and ends at 06:00 UTC. The "Asia KillZone" starts at 23:00 and ends at 03:55 UTC.
The "London Session" includes "Frankfurt" and "London," starting at 07:00 and ending at 14:25 UTC. The "London KillZone" runs from 07:00 to 09:55 UTC.
The "New York" session starts at 14:30 and ends at 19:25 UTC, with the "New York am KillZone" beginning at 14:30 and ending at 22:55 UTC.
🟣 ACD Methodology
The ACD strategy is versatile, applicable to various markets such as stocks, commodities, and forex, providing clear buy and sell signals to set price targets and stop losses.
This strategy operates on the premise that the opening range of trades holds statistical significance daily, suggesting that initial market movements impact the market's behavior throughout the day.
Known as a breakout strategy, the ACD method thrives in volatile or strongly trending markets like crude oil and stocks.
Some key rules for employing the ACD strategy include :
Utilize points A and C as critical reference points, continually monitoring these during trades as they act as entry and exit markers.
Analyze daily and multi-day pivot ranges to understand market trends. Prices above the pivots indicate an upward trend, while prices below signal a downward trend.
In forex trading, the ACD strategy can be implemented using the ACD indicator, a technical tool that gauges the market's supply and demand balance. By evaluating trading volume and price, this indicator assists traders in identifying trend strength and optimal entry and exit points.
To effectively use the ACD indicator, consider the following :
Identifying robust trends: The ACD indicator can help pinpoint strong, consistent market trends.
Determining entry and exit points: ACD generates buy and sell signals to optimize trade timing.
Bullish Setup :
When the "A up" line is breached, it’s wise to wait briefly to confirm it’s not a "Fake Breakout" and that the price stabilizes above this line.
Upon entering the trade, the most effective stop loss is positioned below the "A down" line. It's advisable to backtest this to ensure the best outcomes. The recommended reward-to-risk ratio for this strategy is 1, which should also be verified through backtesting.
Bearish Setup :
When the "A down" line is breached, it’s prudent to wait briefly to ensure it’s not a "Fake Breakout" and that the price stabilizes below this line.
Upon entering the trade, the most effective stop loss is positioned above the "A up" line. Backtesting is recommended to confirm the best results. The recommended reward-to-risk ratio for this strategy is 1, which should also be validated through backtesting.
Advantages of Combining Kill Zone and ACD Method in Market Analysis :
Precise Trade Timing : Integrating the Kill Zone strategy with the ACD Method enhances precision in trade entries and exits. The ACD Method identifies key points for trading, while the Kill Zone focuses on high-activity periods, together ensuring optimal timing for trades.
Better Trend Identification : The ACD Method’s pivot ranges help spot market trends, and when combined with the Kill Zone’s emphasis on periods of significant price movement, traders can more effectively identify and follow strong market trends.
Maximized Profits and Minimized Risks : The ACD Method's structured approach to setting price targets and stop losses, coupled with the Kill Zone's high-volume trading periods, helps maximize profit potential while reducing risk.
Robust Risk Management : Combining these methods provides a comprehensive risk management strategy, strategically placing stop losses and protecting capital during volatile periods.
Versatility Across Markets : Both methods are applicable to various markets, including stocks, commodities, and forex, offering flexibility and adaptability in different trading environments.
Enhanced Confidence : Using the combined insights of the Kill Zone and ACD Method, traders gain confidence in their decision-making process, reducing emotional trading and improving consistency.
By merging the Kill Zone’s focus on trading volumes and the ACD Method’s structured breakout strategy, traders benefit from a synergistic approach that enhances precision, trend identification, and risk management across multiple markets.

ICT KillZones + Pivot Points [TradingFinder] Support/Resistance 🟣 Introduction
Pivot Points are critical levels on a price chart where trading activity is notably high. These points are derived from the prior day's price data and serve as key reference markers for traders' decision-making processes.
Types of Pivot Points :
Floor
Woodie
Camarilla
Fibonacci
🔵 Floor Pivot Points
Widely utilized in technical analysis, floor pivot points are essential in identifying support and resistance levels. The central pivot point (PP) acts as the primary level, suggesting the trend's likely direction.
The additional resistance levels (R1, R2, R3) and support levels (S1, S2, S3) offer further insight into potential trend reversals or continuations.
🔵 Camarilla Pivot Points
Featuring eight distinct levels, Camarilla pivot points closely correspond with support and resistance, making them highly effective for setting stop-loss orders and profit targets.
🔵 Woodie Pivot Points
Similar to floor pivot points, Woodie pivot points differ by placing greater emphasis on the closing price, often resulting in different pivot levels compared to the floor method.
🔵 Fibonacci Pivot Points
Fibonacci pivot points combine the standard floor pivot points with Fibonacci retracement levels applied to the previous trading period's range. Common retracement levels used are 38.2%, 61.8%, and 100%.
🟣 Sessions
Financial markets are divided into specific time segments, known as sessions, each with unique characteristics and activity levels. These sessions are active at different times throughout the day.
The primary sessions in financial markets include :
Asian Session
European Session
New York Session
The timing of these major sessions in UTC is as follows :
Asian Session: 23:00 to 06:00
European Session: 07:00 to 14:25
New York Session: 14:30 to 22:55
🟣 Kill Zones
Kill zones are periods within a session marked by heightened trading activity. During these times, trading volume surges and price movements become more pronounced.
The timing of the major kill zones in UTC is :
Asian Kill Zone: 23:00 to 03:55
European Kill Zone: 07:00 to 09:55
New York Kill Zone: 14:30 to 16:55
Combining kill zones and pivot points in financial market analysis provides several advantages :
Enhanced Market Sentiment Analysis : Aligns key price levels with high-activity periods for a clearer market sentiment.
Improved Timing for Trade Entries and Exits : Helps better time trades based on when price movements are most likely.
Higher Probability of Successful Trades : Increases the accuracy of predicting market movements and placing profitable trades.
Strategic Stop-Loss and Profit Target Placement : Allows for precise risk management by strategically setting stop-loss and profit targets.
Versatility Across Different Time Frames : Effective in both short and long time frames, suitable for various trading strategies.
Enhanced Trend Identification and Confirmation : Confirms trends using both pivot levels and high-activity periods, ensuring stronger trend validation.
In essence, this integrated approach enhances decision-making, optimizes trading performance, and improves risk management.
🟣 How to Use
🔵 Two Approaches to Trading Pivot Points
There are two main strategies for trading pivot points: utilizing "pivot point breakouts" and "price reversals."
🔵 Pivot Point Breakout
When the price breaks through pivot lines, it signals a shift in market sentiment to the trader. In the case of an upward breakout, where the price crosses these pivot lines, a trader might enter a long position, placing their stop-loss just below the pivot point (P).
Conversely, if the price breaks downward, a short position can be initiated below the pivot point. When using the pivot point breakout strategy, the first and second support levels can serve as profit targets in an upward trend. In a downward trend, these roles are filled by the first and second resistance levels.
🔵 Price Reversal
An alternative method involves waiting for the price to reverse at the support and resistance levels. To implement this strategy, traders should take positions opposite to the prevailing trend as the price rebounds from the pivot point.
While this tool is commonly used in higher time frames, it tends to produce better results in shorter time frames, such as 1-hour, 30-minute, and 15-minute intervals.
Three Strategies for Trading the Kill Zone
There are three principal strategies for trading within the kill zone :
Kill Zone Hunt
Breakout and Pullback to Kill Zone
Trading in the Trend of the Kill Zone
🔵 Kill Zone Hunt
This strategy involves waiting until the kill zone concludes and its high and low lines are established. If the price reaches one of these lines within the same session and is strongly rejected, a trade can be executed.
🔵 Breakout and Pullback to Kill Zone
In this approach, once the kill zone ends and its high and low lines stabilize, a trade can be made if the price breaks one of these lines decisively within the same session and then pulls back to that level.
🔵 Trading in the Trend of the Kill Zone
Kill zones are characterized by high trading volumes and strong trends. Therefore, trades can be placed in the direction of the prevailing trend. For instance, if an upward trend dominates this area, a buy trade can be entered when the price reaches a demand order block.

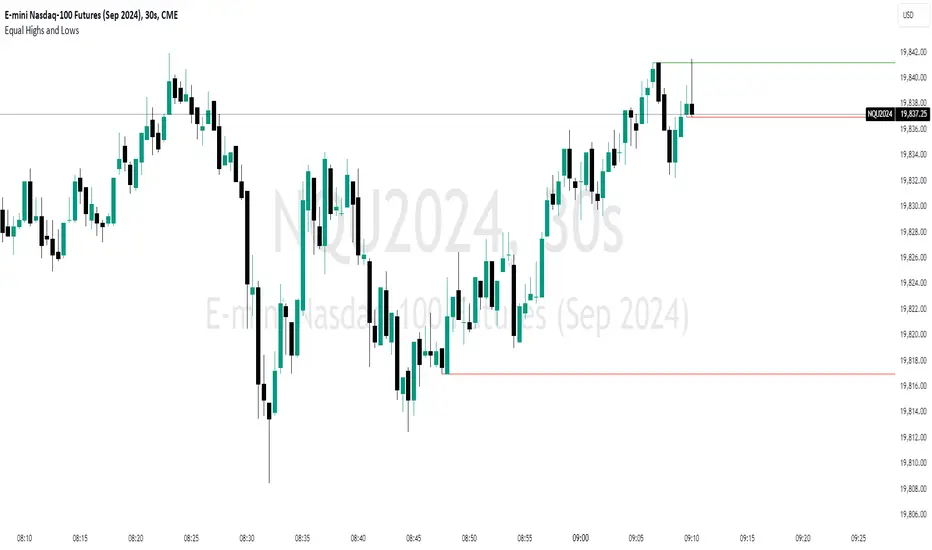
Equal Highs and LowsDescription:
The ‘Equal Highs and Lows’ indicator is a technical analysis tool that marks identical price levels on a trading chart using the current time-frame, assisting traders in identifying potential support and resistance zones or liquidity draws. It creates a horizontal line connecting points where the price has created equal highs and lows within a specified lookback period. Unique to this tool, it maintains a clean chart by removing the line once the price surpasses the equal highs or falls below the equal lows, ensuring only the currently relevant equal highs and lows are highlighted.
Features:
Customization Options: Users can adjust the appearance of the lines (color, width, and style) to match their chart setup or preferences. Users can also choose to extend the lines marking the equal highs/lows to the right of the chart making the equal high/low levels more easier to visualize.
User-Defined Lookback Length: The number of bars to look back for finding equal highs and lows can be set by the user, allowing for flexibility in different market conditions.
How It Works:
The indicator meticulously scans the chart over a user-specified lookback duration, identifying bars with matching high or low values that have not been mitigated on the current chat timeframe, thereby constructing an index of equal values. It subsequently connects these equal values on the chart with a line. While this intuitive indicator does not forecast future market trends, it emphasizes significant price levels derived from historical data.
Usage:
Identifying Support and Resistance: The lines drawn by the indicator can be used to identify potential support and resistance zones and/or draws of liquidity, which are crucial for making informed trading decisions.
Strategy Development: Traders can incorporate the visual cues provided by the indicator into their trading strategies, using them as one of the factors for entry or exit decisions.
Originality:
This indicator presents a distinctive method for pinpointing and illustrating equal highs and lows, granting traders a crucial insight into key price levels. It stands apart from conventional indicators by offering extensive personalization and employing a novel approach to augment chart analysis. Uniquely, it retains only unmitigated equal high/low levels on the chart, automatically discarding mitigated price levels once the price has reached that level.
Conclusion:
The "Equal Highs and Lows" indicator is a practical tool for traders looking to enhance their chart analysis with visual cues of significant price levels. Its customization options and innovative approach make it a valuable addition to the trading toolkit, suitable for various trading styles and strategies.
Pivot Points Level [TradingFinder] 4 Methods + Reversal lines🔵 Introduction
"Pivot Points" are places on the price chart where buyers and sellers are most active. Pivot points are calculated based on the previous day's price data and serve as reference points for traders to make decisions.
Types of Pivot Points :
Floor
Woodie
Camarilla
Fibonacci
🟣 Floor Pivot Points
Floor pivot points are widely used in technical analysis. The central pivot point (PP) serves as the main level of support or resistance, indicating the potential direction of the trend.
The first to third levels of resistance (R1, R2, R3) and support (S1, S2, S3) provide additional signals for potential trend reversals or continuations.
Floor Pivot Points Formula :
Pivot Point (PP): (H + L + C) / 3
First Resistance (R1): (2 * P) - L
Second Resistance (R2): P + H - L
Third Resistance (R3): H + 2 * (P - L)
First Support (S1): (2 * P) - H
Second Support (S2): P - H + L
Third Support (S3): L - 2 * (H - P)
🟣 Camarilla Pivot Points
Camarilla pivot points include eight levels that closely align with support and resistance. These points are particularly useful for setting stop-loss and profit targets.
Camarilla Pivot Points Formula :
Fourth Resistance (R4): (H - L) * 1.1 / 2 + C
Third Resistance (R3): (H - L) * 1.1 / 4 + C
Second Resistance (R2): (H - L) * 1.1 / 6 + C
First Resistance (R1): (H - L) * 1.1 / 12 + C
First Support (S1): C - (H - L) * 1.1 / 12
Second Support (S2): C - (H - L) * 1.1 / 6
Third Support (S3): C - (H - L) * 1.1 / 4
Fourth Support (S4): C - (H - L) * 1.1 / 2
🟣 Woodie Pivot Points
Woodie pivot points are similar to floor pivot points but place more emphasis on the closing price. This method often results in different pivot levels than the floor method.
Woodie Pivot Points Formula :
Pivot Point (PP): (H + L + 2 * C) / 4
First Resistance (R1): (2 * P) - L
Second Resistance (R2): P + H - L
First Support (S1): (2 * P) - H
Second Support (S2): P - H + L
🟣 Fibonacci Pivot Points
Fibonacci pivot points use the standard floor pivot points and then apply Fibonacci retracement levels to the range of the previous trading period. The common retracement levels used are 38.2%, 61.8%, and 100%.
Fibonacci Pivot Points Formula :
Pivot Point (PP): (H + L + C) / 3
Third Resistance (R3): PP + ((H - L) * 1.000)
Second Resistance (R2): PP + ((H - L) * 0.618)
First Resistance (R1): PP + ((H - L) * 0.382)
First Support (S1): PP - ((H - L) * 0.382)
Second Support (S2): PP - ((H - L) * 0.618)
Third Support (S3): PP - ((H - L) * 1.000)
These pivot point calculations help traders identify potential support and resistance levels, enabling more informed decision-making in their trading strategies.
🔵 How to Use
🟣 Two Methods for Trading Pivot Points
There are two primary methods for trading pivot points: trading with "pivot point breakouts" and trading with "price reversals."
🟣 Pivot Point Breakout
A breakout through pivot lines provides a significant signal to the trader, indicating a change in market sentiment. When an upward breakout occurs and the price crosses these lines, a trader can enter a long position and place their stop-loss below the pivot point (P).
Similarly, if a downward breakout happens, a short order can be placed below the pivot point.
When trading with pivot point breakouts, if the upward trend breaks, the first and second support levels can be the trader's profit targets. In a downward trend, the first and second resistance levels will serve this role.
🟣 Price Reversal
Another method for trading pivot points is waiting for the price to reverse from the support and resistance levels. To execute this strategy, one should trade in the opposite direction of the trend as the price reverses from the pivot point.
It's worth noting that although traders use this tool in higher time frames, it yields better results in shorter time frames such as one-hour, 30-minute, and 15-minute intervals.

Pivot Points - [RealFact]Description:
The Pivot Points indicator is a powerful tool for identifying potential support and resistance levels based on previous price action. It calculates key pivot levels (P), along with support (S1, S2) and resistance (R1, R2) levels, which are used to forecast potential turning points in the market.
Key Features:
Pivot Calculation: Based on the previous period's high, low, and close prices.
Support and Resistance Levels: Three support (S1, S2) and three resistance (R1, R2) levels.
Customizable Timeframes: Applicable to various timeframes including daily, weekly, and monthly charts.
Visual Representation: Levels are clearly plotted on the chart, making it easy to identify key areas.
Trading Strategies: Useful for breakout, reversal, and trend-following strategies.
How to Use:
Identify Key Levels: Use the pivot point (P) to determine the general market trend.
Support and Resistance: Look for price reactions at S1, S2, R1 and R2 to find potential entry and exit points.
Combine with Other Indicators: Enhance analysis by combining with other technical indicators such as Moving Averages, RSI, or MACD.
Formula:
Pivot Point (P) = (High + Low + Close) / 3
Support 1 (S1) = 2P - High
Resistance 1 (R1) = 2P - Low
Support 2 (S2) = P - (High - Low)
Resistance 2 (R2) = P + (High - Low)
Best Practices:
Confirm with Volume: Look for volume confirmation when price approaches pivot levels.
Avoid False Breakouts: Be cautious of false breakouts and use other indicators to confirm price moves.

Fundur - Easy ZonesFundur Easy Zones Trading Indicator
The Fundur Easy Zones trading indicator is designed to simplify market analysis by visually marking critical trading zones. This tool helps traders identify optimal buy and sell areas based on historical price action, making it easier to make informed trading decisions.
Calculation Methodology
The Easy Zones indicator employs pivot point calculations combined with price action analysis and the Average True Range (ATR) to determine key trading zones. These zones are calculated by analyzing market volatility and price movements within each timeframe, allowing the identification of significant discount and premium levels.
Pivot Points: The indicator calculates pivot points based on the average of high, low, and close prices from previous periods. These pivot points serve as the foundational levels from which discount and premium zones are derived.
Price Action Analysis: Historical price data is scrutinized to identify patterns and behaviors that signify potential reversal points. This analysis helps in pinpointing zones where the market is likely to experience significant support (discount) or resistance (premium).
Average True Range (ATR): ATR is used to measure market volatility. By incorporating ATR into the calculations, the indicator adjusts the zone boundaries to reflect current market conditions, ensuring that the zones remain relevant and accurate. Higher ATR values indicate greater volatility and wider zones, while lower ATR values result in narrower zones.
Discount and Premium Levels: Based on the pivot points and ATR, the indicator calculates various tiers of discount and premium levels. These tiers (D1, D2, D3 for discounts and P1, P2, P3 for premiums) represent increasing levels of price deviation from the mean, providing traders with clear entry and exit points.
Features Overview
Zones Settings:
Zones History Length: Adjust the number of historical zones displayed on the chart to analyze past price behavior.
Levels Line Width: Customize the thickness of the zone lines for better visibility.
Structure Settings:
Show Fair Value: Display the fair value zone, providing a visual reference for equilibrium price levels. The fair value is calculated based on the median price over the selected period.
DP (Discount and Premium) Settings:
Enable Discount and Premium Levels: Activate the display of critical buy (discount) and sell (premium) zones. These zones are determined using price deviation analysis from the mean, identifying significant discount (support) and premium (resistance) levels.
Tiered Levels: Visualize up to three levels of discount and premium zones, each with specific target prices (TP1, TP2, TP3), representing different levels of price deviation significance.
Highlight Buy and Sell Zones:
Enable Background: Highlight the background of buy and sell zones for enhanced clarity.
Label Settings:
Enable All Labels: Ensure all labels are visible for quick reference.
Show Descriptive Title: Display titles for each zone, making it easier to understand the context.
Show Take Profit Targets (TP): Clearly mark take profit targets within each zone.
Show Price: Display price levels for each zone for precise entry and exit points.
Symbols Settings:
Fair Value, Premium, and Discount Indicators: Customize symbols to represent gaining or losing fair value, premium, and discount levels, enhancing visual cues for market sentiment.
How to Use the Easy Zones Indicator
Identifying Entry Points:
Use the Discount Zones to identify optimal buy areas. The levels (D1, D2, D3) represent increasing levels of discount, with D1 being the least discounted and D3 the most.
Place buy orders at or near these zones to take advantage of potential price reversals.
Identifying Exit Points:
Use the Premium Zones to identify optimal sell areas. The levels (P1, P2, P3) represent increasing levels of premium, with P1 being the least and P3 the highest.
Place sell orders at or near these zones to maximize profits on upward price movements.
Using Fair Value:
The Fair Value Zone provides a balanced price level where the market is likely to return. Use this as a reference point for setting realistic entry and exit targets.
Strategic Planning:
Combine Discount and Premium Zones with the Fair Value Zone to create a strategic trading plan.
Monitor the zones for price reactions and adjust your trading strategy accordingly.
Best Practices
Historical Analysis:
Regularly review historical price actions within the marked zones to understand market behavior.
Customization:
Adjust the settings to suit your trading style and market conditions. Experiment with different zone lengths and line widths for optimal clarity.
Risk Management:
Always use stop-loss orders in conjunction with the identified zones to manage risk effectively.
By integrating the Fundur Easy Zones indicator into your trading strategy, you can enhance your market analysis, make more informed decisions, and ultimately improve your trading performance.

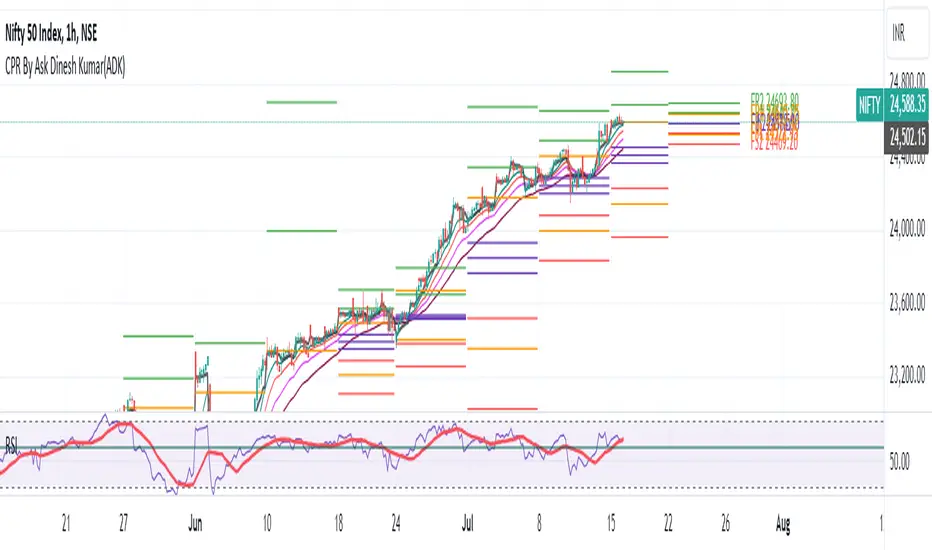
CPR By Ask Dinesh Kumar(ADK)Simple CPR Indicator to increase probability of profitable trades:
The Central Pivot Range (CPR) is a trading tool used by traders to identify potential support and resistance levels in the market. Here's a simplified explanation of how traders can potentially profit using the Central Pivot Range with 10 lines:
1. *Understanding CPR*: CPR consists of three lines: the pivot point (PP), upper resistance level (R1), and lower support level (S1). Additionally, traders often add five more of profitable tradeslines above and below the PP to create a 10-line CPR.
2. *Identify Trend*: Determine the prevailing market trend. If the market is bullish, traders will look for buying opportunities near support levels. If the market is bearish, they'll seek selling opportunities near resistance levels.
3. *Entry Points*: Look for entry points near the support (S1) or resistance (R1) levels within the CPR. These levels can act as potential turning points where price may reverse.
4. *Risk Management*: Set stop-loss orders to manage risk. Stop-loss orders should be placed slightly below support levels for long positions and slightly above resistance levels for short positions.
5. *Profit Targets*: Determine profit targets based on the distance between entry point and the next support or resistance level. Some traders use a risk-reward ratio to ensure potential profits outweigh potential losses.
6. *Confirmation*: Use additional technical indicators or price action patterns to confirm potential entry or exit points within the CPR.
7. *Monitor Price Action*: Continuously monitor price action around the CPR levels. Traders should be prepared to adjust their positions if price breaks through support or resistance levels convincingly.
8. *Trade Management*: Once in a trade, actively manage it by adjusting stop-loss orders, trailing stops, or taking partial profits as price moves in the desired direction.
9. *Market Conditions*: Consider broader market conditions, such as economic indicators, geopolitical events, or news releases, which can impact price movements and the effectiveness of CPR.
10. *Practice and Analysis*: Practice using CPR on historical price charts and analyze past trades to refine strategies and improve decision-making skills.
Remember, trading involves risks, and no strategy guarantees profits. It's essential to thoroughly understand the concepts behind CPR and practice disciplined risk management to increase the likelihood of successful trades.
How does central pivot range work:
Sure here's a concise explanation of how the Central Pivot Range (CPR) works in 10 points:
1. *Calculation*: CPR is calculated using the previous day's high (H), low (L), and close (C) prices.
2. *Pivot Point (PP)*: The central point of CPR is the average of the previous day's high, low, and close prices: PP = (H + L + C) / 3.
3. *Upper Resistance Levels (R1, R2, R3)*: These are potential price levels above the pivot point where resistance may occur. They are calculated by adding a multiple of the range (H - L) to the pivot point: R1 = (2 * PP) - L, R2 = PP + (H - L), R3 = PP + 2 * (H - L).
4. *Lower Support Levels (S1, S2, S3)*: These are potential price levels below the pivot point where support may occur. They are calculated similarly to resistance levels but subtracting multiples of the range from the pivot point: S1 = (2 * PP) - H, S2 = PP - (H - L), S3 = PP - 2 * (H - L).
5. *Trading Signals*: Traders use CPR to identify potential support and resistance levels where price may reverse or stall.
6. *Range Bound Markets*: In range-bound markets, traders may buy near support levels (S1, S2, S3) and sell near resistance levels (R1, R2, R3).
7. *Breakout Trading*: When price breaks through a CPR level convincingly, it may indicate a potential trend continuation or reversal, providing breakout trading opportunities.
8. *Volume and Momentum*: Traders often look for confirmation from volume and momentum indicators when price approaches CPR levels.
9. *Intraday Trading*: CPR can be applied to intraday timeframes as well, providing shorter-term traders with potential trading levels for the day.
10. *Dynamic Indicator*: CPR is dynamic and recalculates daily based on new price data, allowing traders to adapt their strategies to current market conditions.
Understanding how to interpret CPR levels and integrate them into a trading strategy can help traders identify potential entry and exit points in the market.
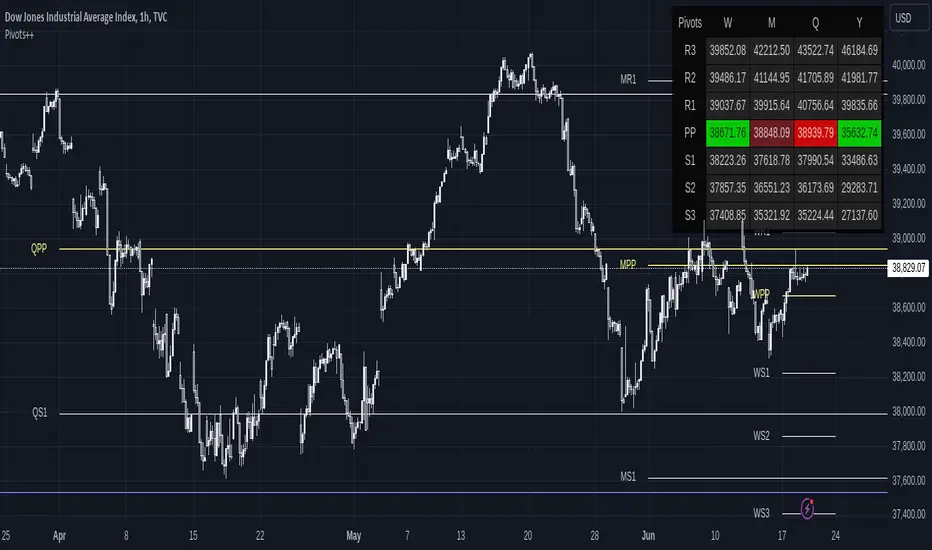
Pivot Points ++The Pivot Points is a classical indicator that aims to assess the Location in which a market is trading and infer hints about its directional movement. Its concept idea has been evolving along the XX century, tracing back to traders like Jesse Livermore, Nicholas Darvis, William O’Neil and Mark Minervini.
This is a Leading Indicator which computes a series of key levels that might act as Support and Resistance over the selected time frame period.
This version of the Pivot Points delivers a convenient way to visualize its information. It’s been designed for it to be useful to a variety of trading styles: from the ones that use it to detect reversal points, to the ones that gauge the market at a single glance.
HOW TO READ THE PIVOT POINTS
Pivot Points set a series of price levels which remain constant through the time period (which could be: daily, weekly, monthly, yearly or multi-yearly).
At the beginning of a new time period, it calculates the main Pivot Point Level (PP), and depending on the type, it can compute up to 5 Support Levels (S1 to S5) and 5 Resistance Levels (R1 to R5).
Being such a universal indicator, there exist many ways of reading the Pivot Levels. Now, let’s see some common uses of the indicator.
Warning: Please don’t rely on a single indicator to make your trading decisions, but rather integrate it into a coherent system combining it with complementary signals.
Support and Resistance : This is a straightforward approach. Each Pivot Level may act as Support or Resistance. For instance the level S1 initially behaves as Support. As price gets closer, one may observe that the level is being respected and price bounces around the level. Or in case it would get broken, then it would automatically shift its role into a Resistance Level.
Mood Gauge : One can quickly gauge the mood of the market by seeing where price stands in relation to the Main Pivot Point Level (PP). Above the Pivot point is generally interpreted as bullish, whilst standing below implies a bearish tone.
Stop Loss and Profit Levels : When entering on a trade, one can use the Pivot Levels to set the Stop Loss behind it, or set the Take Profit in an area surrounding it.
Agreement with Fibonacci Retracements or Expansions : One can combine the power of these 2 leading indicators in search for Agreement areas where to find both a significant Pivot Level and a Relevant Fibonacci Level.
Volume or Volatility Squeezes : Some traders focus on the Pivot Levels in combination with Volume or Volatility readings, in order to anticipate turning points or continuation legs.
WHY WOULD YOU BE INTERESTED IN THIS INDICATOR?
Pivot Points ++ has been designed to address the needs of dedicated traders. Let’s review its main features.
Display up to 9 sets of Pivot Points simultaneously
Long term view: As an analyst and as a trader, being able to display many sets of Pivot Points simultaneously is of great advantage when assessing long term views on the market.
Pivot Levels clearly Identified: Each set of Pivot Points get clearly identified with a prefaced letter indicating its time frame, i.e. Yearly Pivot Point appears as YPP and Monthly Pivot Resistance 1 appears as MR1 .
Minimalistic coloring: The Main Pivot Levels are highlighted in color to stand out, yet the intention of the indicator is to be as minimalistic and keep the chart as clean as possible.
Display Pivots as a Panel
Panel View: Display the Pivot Points’ information in the way that better suits your charting style. In addition to displaying the lines over the price chart, the indicator allows displaying the data on a Panel. The Panel view can be used together with the Line view, or it can be used in isolation.
Fully customizable: Its location, size and its design parameters can be customized through the Settings tab.
Common sense formatting: It displays a column for each of the selected time frames, and a row for each of the selected Pivot Levels. When a Pivot Level displays in colors, it means that price is currently trading above (green) or below (red) that level. Moreover, when the current price is trading just near the Pivot Level, the color shifts to Dark Red when it’s acting as a Resistance, and Dark Green when it acts as Support.
Keep your Chart Clean!
Disciplined traders keep their charts clean. One needs proper focus to trade in the zone.
Please check how the chart on the left looks compared to the one on the right. Both display exactly the same Pivot Points.
The chart on the left contributes to a more minimalistic display of information, as for when a trader wishes to quickly check where the price is trading in relation to the Pivot Points. Moreover, the chart on the right has the advantage to display clearly the Reversals and Price Reactions in relation to the Pivot Points. The decision is yours.
Show only Pivots Relevant to the Current Time Frame
The sets of Pivot Points belonging to time frames Below or Near the current Time Frame get hidden to prevent overcrowding the chart with lines. Nevertheless, this feature can be disabled through the Settings tab.
These are the preset Time Frames:
Intraday/Scalping: Those operating on time frames below 1H will be able to see the whole range of Pivot Levels.
1H: Traders operating on 1-Hour Charts display Pivots from Weekly and above. Daily Pivot Points get hidden.
4H: On 4-Hour Charts, Monthly Pivots and above get displayed. Weekly Pivot Points get hidden.
D: On Daily Charts, Quarterly Pivots and above get displayed. Monthly Pivot Points get hidden.
W: On Weekly Charts, Yearly Pivots and above get displayed. Quarterly Pivot Points get hidden.
M: On Monthly Charts, Tri-Yearly Pivots and above get displayed. Yearly and Bi-Yearly Pivot Points get hidden.
3M and 12M: Above Monthly Charts, only Decennial Pivots get displayed. All the rest get hidden.
Good Looking right off the box
It looks good: The indicator will look just fine on most of the charts. It displays well on dark themed charts and on light themed charts. No need to mess up with the coloring of the indicator for it to display properly.
Fully customizable: Nevertheless, you can easily override the defaults and customize the Colors and Line Styles for each Pivot Level.
Displays True on Heikin Ashi Charts
That’s good news for scalpers, because Pivot Points get computed correctly even when being displayed over Heiken Ashi charts.
SETTINGS
Now let’s dive into the settings of this indicator.
Display : It allows to enable/disable the display of the following:
Lines and Panel : Switch on/off the general view of the Lines over the chart or the Panel.
Pivot, R1 to R5, S1 to S5 : Select which Pivot Levels will be displayed.
Labels and Price : It applies only to Lines. Allows to select which information to display near the Pivot Level, and whether to place it right or left of the line.
Auto Hide Pivots from Near Time Frames : By default it hides the sets of Pivot Points from time frames near the current one. Disabling this one allows to display all the Pivot Points from higher time frames, regardless whether they are near.
Move Pivots to the Right : This selection moves all the current Pivot Points to the Right Hand Side of the Chart, in order to keep the main area of the chart clean of lines. This setting allows customizing the how far to the right from the last candle (Offset) and how wide to draw the levels (Width).
Pivots : It sets up the conditions for each of the 9 sets of Pivot Levels. It includes the following:
General checkmark : Allows displaying or hiding that set of Pivots.
Time Frame : Select the time frame for which the Pivot Point will be computed.
Type : Select the type of Pivot Point: Traditional, Fibonacci, Woodie, Classic, DM or Camarilla.
Lines : Enable/Disable the display of this Pivot as Lines over the chart.
Panel : Enable/Disable the display of this Pivot in the Panel.
Panel Display : It allows customizing the position of the Panel. It includes the following:
Vertical Position : Top, Middle or Bottom of the chart.
Horizontal Position : Left, Center or Right of the chart.
Size of the Panel : Auto, Huge, Large, Normal, Small or Tiny.
Parameters : It applies only to the Line View. It includes the following:
Pivots Back : By default the indicator only shows the current Pivot Levels, but it can display up to 10 past instances of each pivot.
Support and Resistance Price Reference : It allows to specify which price should it take into account to define a Pivot Level acting as Support or Resistance.
Support and Resistance % Area : It defines the size of the zone around each Pivot Level in which it acts as Support or Resistance.
Theming Panel : It applies only to the Panel View. It allows customizing every color used in the Panel.
Theming Pivot #1 to #9 : It applies only to the Line View. It includes the following:
Thickness : Customize the line thickness for all the lines within that set of Pivot Points.
Style : Customize the line style for all the lines within that set of Pivot Points. It can be drawn as a Solid, Dotted or Dashed line.
Colors : Customize the color for each Pivot Level.
Pivot Points with MID LevelsThis indicator shows the Standard Pivot Points level based on daily values that can act as support and resistance. It is used by a variety of traders around the world. You can select which time frame Pivot Point Levels you'd like. Daily, weekly etc... Perfect for swing trading or day trading.
Pivot Points- Shows 3 levels of resistance, the Pivot Point and 3 levels of support
(R3, R2, R1, PIVOT POINT, S1, S2, S3
MID Levels- The MID levels are 50% retracement from the pivot point level above it and below
Example- R3, MID, R2, MID, R1, MID, PIVOT POINT, MID, S1, MID, S2, MID, S3
With this indicator you will also have the option to show the Previous days High and Low that are also important levels. On gap up/down days it is always interesting to see if price will close the gap, hence the important level to note.
PDH= Previous Days High
PDL= Previous Days Low
I have added a feature that you can now select specific color to each level and the line style for each level to help understand which levels are being show by personal needs.
Happy Trading

TrendzonesHi all!
This indicator plots trendlines. These lines are not plotted as traditional lines, but are instead zones. This is useful if you think that trend lines are more of an area of importance than a line.
It does so by finding pivots and connecting two of them if they have not been broken (more about that later) in-between the pivots.
These trend zones can be used as support/resistance that the price can react to.
• The first trendline is drawn between the high/low of the first and second pivot.
• The second trendline's first point is at the open/close of the pivot (either the first pivot or the second one) that has the smallest difference between the high/low and the nearest open/close. The same difference (between the high/low and the open/close) is then subtracted from the other pivot's high/low. This creates a point at the other pivot bar. A trendline is then drawn between the points.
This creates two trendlines and a zone between the two trendlines. This zone is the one kept and is shown by the script.
You can define the pivot lengths used to find trend zones (defaults to 3/3). You can also define the number of pivots to look back for, to find trend zones and the number of active zones, both of these defaults to 3. You can also choose to let the script create new zones based on time ("Oldest") or the zone that is furthest away in price, this defaults to be based on time but it can be useful for letting the script remove the one which is furthest away in price. Another useful setting is the one called "Cross source". This defines the price that has to cross the trend zone to make it invalid (broken). This defaults to "Close", i.e. the bar has to close on the "wrong side" of the trend zone.
The current zones are shown with an extension to the right, but you can also choose to keep the previous lines (without extension). Please note that kept zones are only the ones that are broken, not the replaced ones. I.e. the zones that are kept are the ones that are crossed by the user defined "cross source" (defaults to the closing/current price of the bar).
Hope this makes sense, let me know if you have any questions.
Best of trading luck!

Z-score Volume by SkreepanDescription:
This indicator calculates the Z-score of the trading volume over a specified period. The Z-score is a statistical measure that describes a value's relation to the mean of a group of values. In this context, it shows how far the current volume is from the average volume in terms of standard deviations.
Inputs:
ROC Length: The period used to calculate the Rate of Change (ROC) of the source price. Default is 9.
Source: The data series to calculate the ROC. Default is the closing price.
Period: The number of bars used to calculate the moving average and standard deviation of the volume. Default is 56.
Volume Z-Score Threshold: The threshold for the Z-score above which specific conditions will trigger visual markers. Default is 3.0.
Conditions:
A visual marker (triangle) is plotted on the chart when the following conditions are met:
1. The Volume Z-Score is greater than the specified threshold.
2. The open price is greater than the close price (indicating a bearish candle).
3. The ROC is less than -2.0 (indicating a significant downward movement).
Visualizations:
Markers are plotted on the chart when the conditions are met to highlight significant volume spikes under bearish conditions with strong downward price movement.
Note:
This indicator works by detecting anomalous volumes. When such volumes occur, it is considered a good signal to buy. The indicator performs well on 3-minute and 5-minute timeframes, but if you see a signal on the hourly timeframe, it serves as good confirmation on smaller timeframes. This indicator only works for buy signals.
If this indicator has been helpful to you, please leave a comment!

[r380]Bear & Bull Pivot Signal Indicator_(Lite))Bear & Bull Pivot Signal Indicator
Overview:
The Bear & Bull Multi Pivot Signal Indicator is a comprehensive trading tool designed to identify potential market reversal points and trend changes. This indicator combines multiple technical analysis strategies such as RSI, MACD, and pivot points to generate reliable signals. By overlapping these signals, the indicator increases the possibility of accurate trend predictions, providing traders with valuable insights for informed decision-making.
"This indicator is primarily optimized for Bitcoin on a 15-minute timeframe and is recommended for short-term trading. Reliability on other timeframes is not guaranteed."
Key Features:
Bear and Bull Signals: Clearly indicate potential market reversal points using bear and bull emojis.
Support and Resistance Signals: Indicated with sun and snowflake emojis to show critical price levels.
Overheat Cooldown Pivot: Detects market exhaustion points to signal potential reversals.
Settings:
RSI Settings: Adjust the RSI period and thresholds to match your trading strategy. Default values are optimized for short-term trading.
MACD Settings: The MACD settings are pre-configured but can be customized if needed.
Visual Settings: If excessive signals cause visual discomfort, you can selectively enable or disable features in the visual settings.
Signal Descriptions:
🐻 Bear Signal: Indicates a potential high point where the market may reverse downwards. Combines RSI and MACD conditions to provide a reliable overbought signal. When accompanied by high volume, it can indicate a strong resistance level.
🐮 Bull Signal: Indicates a potential low point where the market may reverse upwards. Uses both RSI and MACD conditions to highlight oversold situations. When accompanied by high volume, it can indicate a strong support level.
❄️ Resistance Signal: Shows a resistance level where the price has difficulty moving higher. When the price crosses below this level, it signals a potential downward movement. Combined with high volume, it can signify robust resistance.
☀️ Support Signal: Shows a support level where the price has difficulty moving lower. When the price crosses above this level, it signals a potential upward movement. Combined with high volume, it can signify strong support.
Detailed Explanation:
This indicator is not simply a combination of multiple indicators but is designed to increase the probability of detecting potential trend reversal signals by using multiple signals. If signals only appear when multiple conditions are met, how many trades can we make in a year? Because there is no 100% certainty in any situation, we need to use various signals to construct our strategy and proceed with trading. For example, if only one signal appears, the reliability of the trend reversal signal is somewhat weak, so we can strategize by betting only a portion of the capital. If multiple signals appear simultaneously, we can consider it a highly reliable trend reversal signal and increase the betting amount and stop loss accordingly. The essence of this indicator, in my view, is not to blindly trade based on signals but to use it as an auxiliary tool for strategic decision-making.
RSI (Relative Strength Index), MACD, and Stochastic RSI: By using various indicators to confirm trend reversal signals, bear and bull emojis are included. If the RSI reaches an oversold zone and then drops by a certain amount, while the MACD turns negative and the Stochastic RSI makes a gold or dead cross, the bear and bull signals are activated.
Pivot Points: Calculated based on the high, low, and close prices over a specific lookback period. These points are used to determine support and resistance levels. Pivot points provide a framework for assessing market sentiment and potential reversal zones. The values calculated this way activate the sun and snowflake signals.
The Overheat Cooldown Pivot: captures moments when the market shows signs of exhaustion, particularly when overbought or oversold conditions are accompanied by a drop in volume. This helps traders anticipate market turning points more effectively. These signals appear as red or green triangles indicating potential reversals. Although similar to the bear and bull signals in detecting market cool-off points, these signals rely on volume and may have slightly lower reliability.
Practical Application:
By using this indicator, traders can strategically adjust their bet sizes based on the reliability of the signals. When multiple signals coincide, it indicates a higher probability of a trend reversal, allowing for larger position sizes. Conversely, when signals occur independently, it suggests a lower probability, warranting smaller position sizes. This approach enables traders to manage their risk effectively and capitalize on high-probability trading opportunities without excessively reducing trading frequency.
Trading Method:
The basic setup is for Bitcoin on a 15-minute timeframe, and short-term trading is recommended by the creator. Upon signal activation, if only one signal appears, verify the volume and support/resistance lines, calculate the risk-reward ratio, and enter a position with a low betting ratio. If three signals activate simultaneously, enter a position with a higher betting ratio.
Reliability Order:
🐻🐮 > ❄️☀️ > 🔻🔺 (replacing green triangle emojis)
This indicator provides a powerful method for detecting multiple potential market reversals and trend continuations.
Note: Have realistic expectations and understand the limitations of technical analysis tools. This indicator is a tool to assist in your trading decisions and not a guaranteed prediction of market movements.
Warning! Do not trade solely based on this indicator.
Additionally, if you find the settings lacking, feel free to adjust them yourself! Thank you!
Korean Version
곰돌이와 송아지 멀티 피봇 시그널 인디케이터
개요:
곰돌이와 송아지 멀티 피봇 시그널 인디케이터는 잠재적 시장 반전 지점과 추세 변화를 식별하기 위해 설계된 종합 거래 도구입니다. 이 인디케이터는 RSI, MACD, 피봇 포인트 등의 여러 기술 분석 전략을 결합하여 신뢰할 수 있는 신호를 생성합니다. 이러한 신호들을 중첩함으로써 정확한 추세 예측의 가능성을 높여, 트레이더가 정보를 기반으로 결정을 내리는 데 유용한 통찰력을 제공합니다.
기본적으로 비트코인 15분봉을 기준으로 하며 매매 방법은 단타를 권장합니다. 다른 타임프레임에서의 신뢰는 보장 하지 않습니다.
주요 기능:
곰돌이와 송아지 신호: 시장의 잠재적 반전 지점을 곰돌이와 송아지 이모지로 명확하게 표시합니다.
지지 및 저항 신호: 중요한 가격 수준을 나타내기 위해 태양과 눈송이 이모지로 표시합니다.
오버히트 쿨다운 피봇: 시장 피로 지점을 감지하여 잠재적 반전 신호를 제공합니다.
세팅방법:
RSI 설정: RSI 기간과 임계값을 조정하여 자신의 거래 전략에 맞춥니다. 기본값은 단기 거래에 최적화되어 있습니다.
MACD 설정: MACD 설정은 미리 구성되어 있으며, 필요에 따라 사용자 정의가 가능합니다.
비쥬얼 세팅: 과도한 시그널 때문에 눈이 아프시다면 비쥬얼세팅에서 선택적으로 기능들을 켜거나 끌 수 있으니 참고하세요.
신호 설명:
🐻 곰돌이 신호: 시장이 하락할 가능성이 있는 고점을 나타냅니다. RSI와 MACD 조건을 결합하여 신뢰할 수 있는 과매수 신호를 제공합니다. 높은 거래량과 함께 나타나면 강한 저항 수준을 나타낼 수 있습니다.
🐮 송아지 신호: 시장이 상승할 가능성이 있는 저점을 나타냅니다. RSI와 MACD 조건을 사용하여 과매도 상황을 강조합니다. 높은 거래량과 함께 나타나면 강한 지지 수준을 나타낼 수 있습니다.
❄️ 저항 신호: 가격이 더 이상 상승하기 어려운 저항 수준을 나타냅니다. 가격이 이 수준 아래로 하락하면 잠재적 하락 움직임을 신호합니다. 높은 거래량과 함께 나타나면 강력한 저항을 의미할 수 있습니다.
☀️ 지지 신호: 가격이 더 이상 하락하기 어려운 지지 수준을 나타냅니다. 가격이 이 수준 위로 상승하면 잠재적 상승 움직임을 신호합니다. 높은 거래량과 함께 나타나면 강한 지지를 의미할 수 있습니다.
상세 설명:
이 인디케이터는 여러 인디케이터를 단순히 결합한 것이 아니라, 여러가지 시그널들을 사용해서 잠재적 추세전환 신호 감지 확률을 높이는 것에 목적이 있습니다. 단순히 여러가지 조건들이 중첩되었을때만 신호가 뜬다면 우리는 1년에 몇번이나 매매를 할 수 있을까요. 모든경우에 100% 라는 경우가 없기때문에 우리는 다양한 신호들을 활용하여 전략을 구성하고 매매를 진행 해야합니다. 예를들어 1개의 시그널만 뜬다면 추세전환 신호의 신뢰도가 다소 약하기 때문에 시드의 일부 금액만 배팅 하는 식으로 전략을 구성 할 수도 있고, 만약 여러가지 시그널들이 충접적으로 뜬다면 신뢰도 높은 추세전환의 신호로 인식하여 배팅금액을 높이고 스탑로스를 높게 잡는 방향으로 전략을 구성 할 수 있습니다. 단순히 맹목적으로 시그널이 떳다고 매매하는것이 아닌 보조 신호로써의 기능, 이것이 내가 생각하는 인디케이터의 역할이자 본질 이라고 생각합니다.
RSI (상대 강도 지수)와 MACD, 스토캐스틱 RSI: 여러가지 지표들을 기반으로 추세 반전의 신호를 확인 할 수 있는 곰돌이와 송아지를 넣었습니다. RSI 가 과매도 구간에 도달한 이후일정 수치 이상 하락하는 동시에 MACD가 음수로 변하고 스토캐스틱 RSI가 골드, 데드 크로스가 된다면 곰돌이와 송아지 신호가 활성화 됩니다.
피봇 포인트: 특정 되돌아보기 기간 동안의 최고, 최저, 종가를 기반으로 계산됩니다. 이 포인트는 지지 및 저항 수준을 결정하는 데 사용됩니다. 피봇 포인트는 시장 심리와 잠재적 반전 영역을 평가하는 프레임워크를 제공합니다. 이렇게 계산된 값을 기반으로 눈송이와 해 신호가 활성화 됩니다.
오버히트 쿨다운 피봇: 는 과매수 또는 과매도 상태에서 거래량이 감소할 때 시장 피로 지점을 포착하여 잠재적 반전 지점을 신호합니다. 이러한 피로 지점을 식별함으로써 인디케이터는 트레이더가 시장의 전환점을 보다 효과적으로 예측할 수 있도록 돕습니다. 그렇게 추세 반전의 신호로 녹색 또는 붉은색 삼각형 시그널이 뜹니다. 과열된 시장이 냉각되는 포인트를 찾는점에서는 곰돌이 송아지 신호와 비슷하지만 거래량을 기반으로 하고 있기 때문에 명백히 다른 시그널이며 신뢰도는 약간 낮을 수도 있습니다
실용적 적용:
이 인디케이터를 사용함으로써, 트레이더는 신호의 신뢰도에 따라 베팅 크기를 전략적으로 조정할 수 있습니다. 여러 신호가 동시에 나타날 때, 이는 추세 반전의 가능성이 높음을 나타내며, 더 큰 포지션 크기를 허용합니다. 반대로, 신호가 독립적으로 발생할 때는 낮은 가능성을 나타내므로 작은 포지션 크기가 적합합니다. 이 접근 방식은 트레이더가 효과적으로 리스크를 관리하고 높은 확률의 거래 기회를 활용하면서 거래 빈도를 과도하게 줄이는 것을 방지할 수 있게 합니다.
매매방법:
기본적인 세팅은 비트코인 15분 타임프레임이며 제작자는 단타를 추천합니다. 포지션 진입시 시그널이 1개가 뜬다면 거래량과 지지와 저항라인을 확인하고 손익비를 계산후 낮은 배팅 비율로 포지션에 진입합니다. 만약에 3개의 시그널이 동시에 활성화 된다면 보다 높은 비율로 포지션에 진입합니다.
신뢰도 순서:
]🐻🐮 > ❄️☀️ > 🔻🔺(초록 삼각이모지가 없기때문에 이것으로 대체)
이 지표는 여러 잠재적인 시장 반전 및 추세 지속성을 감지하는 강력한 방법을 제공합니다.
참고: 현실적인 기대를 가지고 기술 분석 도구의 한계를 이해하십시오. 이 지표는 시장 움직임을 보장하는 예측이 아니라 거래 결정을 돕기 위한 도구입니다.
경고! 절대 이 지표만을 가지고 매매하지 마십쇼.
추가적으로 제작자는 지표 세팅에 허접이라 꼬우면 당신이 세팅하십쇼! 감사합니다!

Pivot PointsPivot points are technical indicators used in financial markets (such as stocks, forex, or commodities) to identify potential turning points in price movement. They provide reference levels based on the previous day’s price action.
How to use the Pivot Points indicator
Traders use pivot points to identify significant price levels where the market may reverse or consolidate.
PP, S1, and R1 are considered primary levels, while S2 and R2 are secondary levels.
R3, R4, R5, S3, S4 and S5 are considered more extreme levels and we normally don't see price action trade near these levels on a typical day. This indicator calculates those extreme levels to help on days with extreme price action.
Pivot points can be calculated for different timeframes (daily, weekly, monthly, quarterly, 6-months and yearly).
Pivot points calculated using the daily timeframe is a popular chose among day traders traders who trade intraday timeframes.
Trading Strategies
Bounce Strategy:
Buy near support (S1 or S2) if the price bounces off these levels.
Sell near resistance (R1 or R2) if the price reverses from these levels.
Breakout Strategy:
If the price breaks above R1, consider a long position.
If the price breaks below S1, consider a short position.
Profit targets:
If in a long trade and price hits R1, you take some profit.
If in a short trade and price hits S1, you take some profit.
Combine pivot points with other technical indicators (e.g., moving averages, candlestick patterns) for confirmation. Remember that pivot points are just one tool among many, and their effectiveness varies across different markets and timeframes. Always practice risk management and consider the overall market context when using pivot points in your trading decisions.

Weighted Moving Range with Trend Signals (WMR-TS)Weighted Moving Range with Trend Signals (WMR-TS)
Technical analysis involves analyzing statistical trends from trading activity , such as price movement and volume, to make trading decisions. Technical indicators are mathematical calculations based on the price, volume, or open interest of a security or contract. They are used by traders to analyze price movements and predict future market behavior. The WMR-TS indicator combines weighted moving averages and range calculations to identify key trading levels and generate buy/sell signals. It dynamically adjusts to market conditions, offering traders insights into potential support, resistance, and trend reversal points. Key levels are color-coded for quick interpretation. It utilizes weighted moving averages (WMA) and range calculations to determine these levels, making it a robust tool for both trending and ranging markets.
SUMMARY
Parameters :
WMA Length : Determines the length for the primary weighted moving average.
Highest High Length : Sets the period for calculating the highest high.
Lowest Low Length : Sets the period for calculating the lowest low.
Range Corrector : Adjusts the range calculation slightly for fine-tuning.
Top Level : Multiplier for determining the top level from the calculated range.
Bottom Level : Multiplier for determining the bottom level from the calculated range.
Levels Visibility : Sets how many recent bars will display the levels.
Trading Zones :
Short Area : Highlighted zone indicating potential shorting opportunities.
Long Area : Highlighted zone indicating potential buying opportunities.
The Levels :
Wave (Yellow): Midpoint of the calculated range, adjusted by WMA.
Top Level (Red): Calculated upper boundary of the trading range.
Sell Level (Pink): Intermediate sell level.
Resistance Level (Magenta): Immediate resistance level.
Support Level (Cyan): Immediate support level.
Buy Level (Light Green): Intermediate buy level.
Bottom Level (Dark Green): Calculated lower boundary of the trading range.
Interpreting the Signals :
Hammer Signal : Red circles above bars indicate potential sell signals.
Rocket Signal : Green circles below bars indicate potential buy signals.
KEY CONCEPTS
Highest High and Lowest Low :
These values represent the highest high ( HH ) and lowest low ( LL ) over a specified number of periods.
Support Level :
This is the lower boundary of the trading range. It is a price level where demand is strong enough to prevent the price from falling further. As the price approaches the support level, it is likely to bounce back up.
Resistance Level :
This is the upper boundary of the trading range. It is a price level where supply is strong enough to prevent the price from rising further. As the price approaches the resistance level, it is likely to pull back down.
THE USE OF MULTIPLIERS :
The script uses several multipliers to adjust and fine-tune the calculated support and resistance levels, as well as to control the range and sensitivity of these levels. Here is a detailed explanation of these multipliers and their purpose:
Range Corrector : This multiplier adjusts the calculated high ( H ) and low ( L ) levels, adding flexibility to how these levels are positioned relative to the highest high and lowest low. It ranges from -1 to 1 , with a default value of 0 . The use of positive values increase the range, making the calculated levels further apart. Thus, using negative values decrease the range, bringing the calculated levels closer together.
Top Level : This multiplier adjusts the distance of the top level from the calculated high H ) level. It fluctuates from 0 to 2 , with a default value of 0.382 . Higher values will push the top level further above the high level, while lower values will bring it closer.
Bottom Level : This multiplier adjusts the distance of the bottom support level from the calculated low support level. Ranging from 0 to 2, with a default value of 0.214, the higher values will push the bottom level further below the low level, while lower values will bring it closer.
The script plots the support and resistance levels on the chart, allowing traders to visualize the trading range. Color-coded zones are used to indicate areas where buying or selling opportunities may arise based on the current price relative to the trading range. A trading range refers to the area between a price's support and resistance levels over a specific period of time. Within this range, the price of the security fluctuates up and down but does not break out above the resistance or below the support. Support and resistance levels to make trading decisions. Buying near the support level and selling near the resistance level is a common strategy. When the price moves above the resistance level, it is called a breakout . A breakout often indicates that the price may start a new upward trend . Conversely, when the price moves below the support level, it is called a breakdown . A breakdown often indicates that the price may start a new downward trend . By understanding and utilizing trading ranges, traders can make more informed decisions, optimize their trading strategies, and manage risk more effectively.
Understanding Moving Averages
A moving average (MA) is a widely used technical indicator that helps smooth out price data by creating a constantly updated average price. The main purpose of using a moving average is to identify the direction of the trend and to reduce the "noise" of random price fluctuations. The Weighted Moving Average ( WMA ) assigns different weights to each period, with more recent periods typically given more weight. A 10-day WMA might give the most recent day a weight of 10, the second most recent day a weight of 9, and so on. It is useful for traders who want to emphasize recent price data more than older data. When the price is above the moving average, it suggests an Bullish trend . A Bearish Trend is expected to take place when the price is below the moving average. Understanding the price reactions around these levels can be used to make trading decisions.
APPLYING CONCEPTS
Support and Resistance Calculations in the Script :
The script calculates dynamic support and resistance levels using weighted moving averages ( WMA s) and the highest high and lowest low over specified periods. Buy ( Rocket ) and sell ( Hammer ) signals are generated based on the crossing of the price with calculated top and bottom levels.These signals help traders identify potential entry and exit points within the trading range .
Weighted Moving Average (WMA) Application in the Script
This script calculates a special trendWMA using the close price that helps in creating a more dynamic moving average that considers both high and low price actions. This modified WMA is used in conjunction with highest high and lowest low values over specified periods to calculate dynamic support and resistance levels.
Explanation of the Levels in the Script
By understanding these levels, traders can make more informed decisions about where to enter and exit trades, manage risk, and anticipate potential market movements. The script incorporates several key levels levels that traders can use to better anticipate price movements and make more informed trading decisions. Leveraging the principles of Fibonacci retracement ratios ( 23.6%, 38.2%, 50%, 61.8%, and 100% ) to identify key support and resistance zones can also serve for gauging the overall market sentiment.
Top Level and Sell Leve l: Used to identify potential resistance zones where the price may reverse or pause.
Support Level and Buy Level : Used to identify potential support zones where the price may bounce.
Upper and Lower Pivot Values : Serve as intermediate levels for possible price retracements or extensions within the trading range.
Wave Level : Indicates the central trend direction, which can be useful for gauging the overall market sentiment.
Alerts are a crucial part of the script as they notify traders of potential buy and sell signals based on predefined conditions. There are two main alerts: one for a " Hammer " signal (sell condition) and one for a " Rocket " signal (buy condition).
Adjust the input parameters to fit your trading style and the specific asset being analyzed. Shorter lengths may be more responsive to price changes but can produce more false signals , while longer lengths provide smoother signals but may lag . Always backtest the indicator on historical data to understand its behavior and performance. Also remember that different markets may require different parameter settings for optimal performance.
Keep in mind that by nature like all moving averages, WMAs lag behind price action. This means that signals may be delayed. The indicator performs differently in various market conditions. Always consider the overall market context when interpreting signals.
Adjusting parameters like the range corrector and visibility can help tailor the indicator to specific market conditions or trading strategies, improving its effectiveness. The script uses the calculated levels to plot lines and fill zones on the chart, helping traders visualize potential support, resistance, and trend reversal points. The use of multipliers allows for dynamic adjustment of these levels, making the indicator flexible and adaptable to different market conditions.
I think traders can make more informed decisions about where to enter and exit trades, manage risk, and anticipate potential market movements following this code. Stay safe and always remember that market is always changing. Use this tool if you want, please stay informed and plan safe trades,
D.

Quarterly DFR [Dango]Introducing the Defining Range Indicator, a powerful tool designed to help traders identify and understand the important levels of highs, lows, and equilibrium within a selected quarterly cycle. This innovative script provides valuable insights into the key price levels that are likely to elicit a strong reaction in the market, enabling traders to make more informed decisions and enhance their trading strategies.
Key Features:
Identifies and displays the defining high, low, and equilibrium levels based on the selected quarterly cycle
Utilizes advanced algorithms to analyze price action and determine the most significant levels
Provides a visual representation of the defining range on the chart, making it easy for traders to identify potential support, resistance, and pivot points
Enables traders to backtest and understand how price has reacted to these levels in the past
How It Works:
The Defining Range Indicator employs a sophisticated algorithm to analyze price action within the selected quarterly cycle. By examining the price behavior and patterns within this timeframe, the script determines the most significant high, low, and equilibrium levels that are likely to influence future price movements.
The indicator takes into account various factors, such as price momentum, volatility, and volume, to identify the key levels that define the range. These levels are then visually represented on the chart, providing traders with a clear picture of the important price points to watch.
The Defining Range Indicator works in the following steps:
Quarterly Cycle Selection: Traders select the desired quarterly cycle timeframe (90-minute, daily, weekly, monthly, or yearly) to focus the analysis on.
High and Low Identification: The script analyzes the price action within the selected quarterly cycle to determine the most significant high and low points. These levels are considered the defining high and low of the range.
Equilibrium Calculation: The indicator calculates the equilibrium level, which represents the midpoint between the defining high and low. This level is considered a potential pivot point where price may find balance or reverse direction.
Visual Representation: The defining high, low, and equilibrium levels are plotted on the chart, providing traders with a clear visual representation of the key price levels to monitor.
Expected Usage:
The Defining Range Indicator is designed to help traders gain a better understanding of the important price levels within a selected quarterly cycle. By identifying the defining high, low, and equilibrium, traders can make more informed decisions and enhance their trading strategies.
Support and Resistance Identification: The defining high and low levels act as potential support and resistance areas. Traders can use these levels to plan their trades, set entry and exit points, and manage risk effectively.
Pivot Point Trading: The equilibrium level represents a potential pivot point where price may find balance or change direction. Traders can watch for price behavior around this level to identify potential trading opportunities.
Backtesting and Historical Analysis: The Defining Range Indicator enables traders to backtest their strategies and understand how price has reacted to the defining levels in the past. By analyzing historical price action, traders can gain valuable insights into the effectiveness of their trading approach and make necessary adjustments.
Confluence and Confirmation: Traders can use the Defining Range Indicator in conjunction with other technical analysis tools, such as the Quarterly High and Low Indicator or the Quarterly Cycles Indicator, to confirm trade setups and increase confidence in their trading decisions.
Risk Management: By understanding the location of the defining high, low, and equilibrium levels, traders can make more informed decisions about stop-loss placement and position sizing. Setting stop-losses beyond these key levels can help mitigate the risk of getting stopped out prematurely due to short-term price fluctuations.
Limitations and Disclaimer:
While the Defining Range Indicator is a valuable tool, it should not be used in isolation. Traders should combine the insights gained from this indicator with other forms of analysis, risk management, and sound trading psychology to develop a well-rounded and effective trading approach.
Please note that the indicator's accuracy may be impacted by extreme market volatility or unusual events, and the defining levels should not be relied upon in isolation. As with any trading tool, individual results may vary, and past performance does not guarantee future outcomes. Traders should always exercise caution, use appropriate risk management techniques, and continuously educate themselves to adapt to changing market conditions.
This indicator is provided for educational purposes only and should not be considered financial advice. Always conduct your own due diligence and consult with a financial professional before making any trading decisions.
Privacy of Code:
The underlying logic and specific calculations used in the Defining Range Indicator's algorithm are proprietary and not disclosed to protect the intellectual property of the script. The methods used to identify the defining high, low, and equilibrium levels are the result of extensive research, testing, and refinement. By keeping these details confidential, the script maintains its competitive edge and ensures the protection of its intellectual property.
To be Used in Pair with Quarterly Cycle Indicator

Quarterly H/L [Dango]Introducing the Quarterly High and Low Indicator, a powerful and original tool designed to enhance your understanding of price action by identifying key turning points within quarterly cycles. This innovative script accurately determines the most significant highs and lows in each quarter, providing valuable insights for traders.
Key Features:
- Identifies and displays quarterly highs and lows on 90-minute, daily, weekly, monthly, and yearly timeframes
- Employs advanced algorithms and a deep understanding of cycle theory to precisely pinpoint key turning points
- Accounts for subtle nuances in price action and market dynamics
- Intended to be used in conjunction with the Quarterly Cycles Indicator for further confluence
How It Works:
The Quarterly High and Low Indicator utilizes a proprietary algorithm to meticulously analyze price action within each quarter. This advanced formula takes into account multiple factors, such as price momentum, volatility, and volume, to accurately identify the most significant high and low points.
The script employs a multi-step process to determine the quarterly highs and lows:
1. Cycle Isolation: The indicator first isolates the price action within each quarter, focusing on the specific time frame being analyzed (90-minute, daily, weekly, monthly, or yearly).
2. Momentum Analysis: The script then analyzes the price momentum within each quarter, identifying periods of strong bullish or bearish sentiment. This helps to narrow down potential high and low points.
3. Volatility and Volume Confirmation: To further refine the identification of key turning points, the indicator assesses the volatility and volume characteristics surrounding potential highs and lows. Significant changes in volatility and volume often accompany important price reversals.
4. Proprietary Scoring System: The algorithm assigns scores to each potential high and low point based on a proprietary scoring system. This system takes into account the confluence of momentum, volatility, and volume factors to determine the most significant turning points within each quarter.
The Quarterly High and Low Indicator visually represents these key turning points on the chart, enabling traders to easily identify potential support and resistance levels, trend reversals, and optimal entry and exit points. By focusing on the most significant price levels within each quarter, the indicator helps traders cut through the noise and make more informed trading decisions.
Expected Usage:
The Quarterly High and Low Indicator is designed to be a valuable tool for traders seeking to gain a deeper understanding of price action and market dynamics. By mapping out the most significant high and low points within each quarter, the indicator provides users with key levels to watch for potential trend reversals, support, and resistance.
1. Identifying Pivots and Reversals: The quarterly highs and lows identified by the indicator serve as critical levels where price is more likely to pivot or reverse. Traders can use these levels to anticipate potential trend changes and adjust their trading strategies accordingly.
2. Backtesting and Historical Analysis: The indicator enables traders to analyze historical price action and assess how the market has reacted to quarterly high and low levels in the past. By backtesting their strategies using these key levels, traders can gain valuable insights into the effectiveness of their approach and make data-driven refinements.
3. Support and Resistance: Quarterly highs and lows often act as significant support and resistance levels. Traders can use the indicator to identify these key areas and plan their trades around them. For example, if price approaches a quarterly high, traders may watch for potential selling pressure and consider taking profits or initiating short positions.
4. Confirmation and Confluence: The Quarterly High and Low Indicator can be used in conjunction with other technical analysis tools to confirm trade setups and increase confidence in trading decisions. When multiple indicators or analysis techniques align with the quarterly highs and lows, it provides a stronger signal for potential trade entry or exit points.
5. Risk Management: By understanding the location of quarterly highs and lows, traders can make more informed decisions about stop-loss placement and position sizing. Setting stop-losses beyond these key levels can help mitigate the risk of getting stopped out prematurely due to short-term price fluctuations.
6. Combining with the Quarterly Cycles Indicator: The Quarterly High and Low Indicator is intended to be used alongside the Quarterly Cycles Indicator for further confluence and validation. By analyzing the relationship between the identified quarterly highs and lows and the underlying quarterly cycles, traders can gain a more comprehensive understanding of market dynamics and potential turning points. When the quarterly highs and lows align with the key phases of the quarterly cycles, it provides a stronger signal for potential trend changes and trading opportunities.
Incorporating the Quarterly High and Low Indicator into a trading strategy, along with the Quarterly Cycles Indicator, allows traders to develop a more comprehensive understanding of price action and make better-informed decisions. By backtesting and analyzing how price reacts around these key levels and cycles, traders can refine their approach and potentially improve their trading outcomes.
Limitations and Disclaimer:
While the Quarterly High and Low Indicator is a powerful tool, it should not be used in isolation. Traders should combine the insights gained from this indicator with other forms of analysis, such as the Quarterly Cycles Indicator, fundamental analysis, risk management, and sound trading psychology, to develop a well-rounded and effective trading approach.
Please note that the indicator's accuracy may be impacted by extreme market volatility or unusual events, and quarterly highs and lows should not be relied upon in isolation. As with any trading tool, individual results may vary, and past performance does not guarantee future outcomes. Traders should always exercise caution, use appropriate risk management techniques, and continuously educate themselves to adapt to changing market conditions.
This indicator is provided for educational purposes only and should not be considered financial advice. Always conduct your own due diligence and consult with a financial professional before making any trading decisions.
Privacy of Code:
The underlying logic and specific calculations used in the proprietary algorithm are not disclosed to protect the intellectual property of the script. The advanced formula and scoring system used to identify quarterly highs and lows are the result of extensive research, testing, and refinement. By keeping these details confidential, the script maintains its competitive edge and ensures the protection of its intellectual property.
