Quickfingers Luc's Base Breaking Strategy v2.5 - 3Commas EditionIntroduction
The strategy attempts to implement a popular price action strategy by Luc Thomas (a.k.a. Quickfingers Luc) typically referred to as a QFL base-breaking strategy specifically for the 3Commas platform. The Input settings have been redesigned to match the same inputs as the 3Commas My Bot Settings page. Only the "Deal Start Condition" section will echo the required QFL-related settings found in the original Quickfingers Luc's Base Breaking Strategy v2.5 to successfully implement the strategy.
The strategy revolves around price action movements that reveal “bases”, which are price levels of support that have a significant, rapid price surges called “bounces”. Once a base is revealed, the base price level is used as reference to implement multiple entries below the base using a layering technique of dollar-cost averaging to place multiple limit orders at various price levels below the base price. As price action breaks below the base price, the limit orders will be filled, and the take profit, breakeven and stop loss prices will be recalculated.
How is it original and useful?
This strategy is unique in that the strategy version fully supports the TradingView backtester, which will enable you to perform experiments with various settings to evaluate performance using the historical chart data. The study version implements the "Start Deal" and "Close Deal" alerts for you to integrate with 3Comma's "Trading View Custom Signal" start condition. Both script versions will provide the same configuration abilities. The following list is a brief description of its usefulness:
The ability to define the QFL base confirmation settings, including volume analysis.
The ability to define your preferred layering strategy of either dollar-cost averaging (DCA) or grid-like layers along with precise layer placement.
The ability to define your trading parameters like take profit and stop loss offsets, exchange commission rates, trading start time, and position size multiplication for each layer.
The ability to define flexible trade eligibility rules that can use other chart indicators, like RSI or EMA, to exclude the selection of base prices for trading.
The ability to set the visibility & color theme of the detailed statistics from the chart history pertaining to trading sessions started and closed, session durations, win rate, price action drops and bounces, as well as layer utilization.
How does it compare to other scripts in the Public Library?
The strategy offers a very detailed, comprehensive settings to implement the QFL base-breaking strategy ion 3Commas. The strategy version leverages the full features of the TradingView backtester to provide informative, detailed performance measurements surrounding this unique trading strategy. The study version will implement the latest alert framework called "Any Alert() Function" where you can create a single alert to handle multiple events, which include:
Deal Start
Deal Close
What does it do and how does it do it?
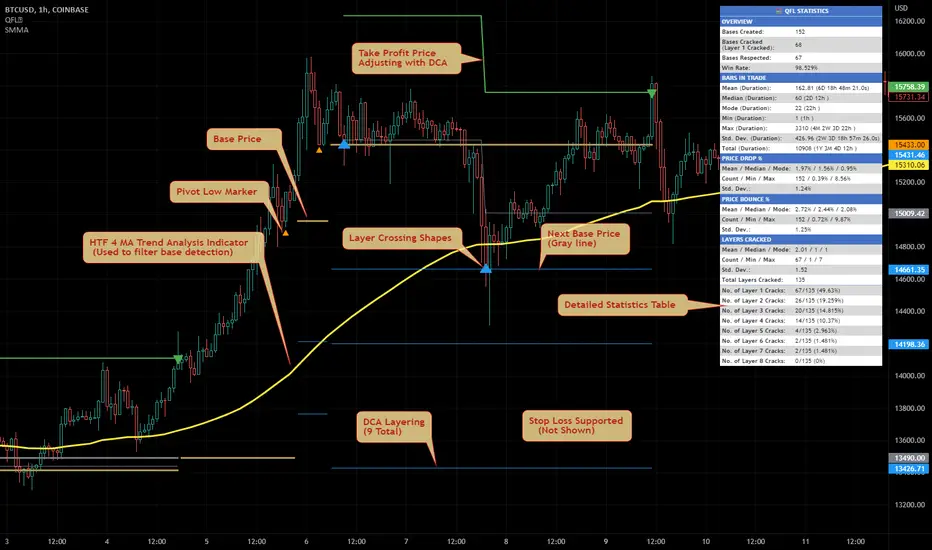
The strategy can be applied to any chart at any time frame, but the minimum should be no lower than 10 minutes. When applied to the chart for the first time, the default settings will work to render base price levels in orange and 8 DCA layers in thin blue lines. As you scroll through the chart's history you should see price action crossing the DCA layers, denoted with blue triangles, and a green take-profit line will render with green triangle denoting the crossing. Lastly, when a deal session begins upon the crossing of the first layer, the indicator will continue to identify base price levels, but the color of the price lines will be gray. When the trade session concludes upon the crossing of the take profit line, the indicator will switch the most recent base price line from gray to orange to make it active and eligible for trading.
As price action develops, the indicator will use the "Base Confirmation Settings" to look back by counting the number of bars to the left and right of a pivot low point, measure the price drops and bounces, and volume amounts to validate that they are within the specified values. If so, the indicator will draw an orange triangle beneath the candle bar to denote it as the pivot low point and begin rendering the orange line as the base price. The DCA layers will be calculated and offset relative to the base price using thin blue lines.
Optionally, the breakeven price line will be drawn to help visualize the true breakeven price which takes into consideration the exchange fees being applied. Base line, take profit, stop loss and DCA layer crossings will be denoted with colorful shapes to help visually recognize the events on the chart.
The volume is validated only at the pivot low candle. It will measure the volume against the moving average to determine base confirmation. A volume factor of 1 will mean that the volume must be at least the same value as the moving average value. A volume factor of 2 means it must be twice the moving average value.
Lastly, a table of statistics is positioned to the upper-right corner of the chart that summarize all the events that have taken place since the indicator began simulating deal sessions from the chart's history.
Strategy Results
The default settings are designed to define a "weak" QFL base to ensure that the indicator will render chart elements when first loaded as well as to allow the backtester to gather order executions and display performance summary. The strategy version is using $10,000 initial capital, a commission rate of 0.1% for both entries and exits, and a 1 tick slippage setting. It is also using 3.4881% of the equity for the Base Order Size, 4.7097% of equity for the first Safety Order Size. The Maximum Safety Trade Count is 7 with a Safety Order Volume Scale of 1.35, and a take profit of 5% with no stop loss. All other settings are defaults.
It is recommended that the indicator be "tuned" for your specific market in order to best implement the QFL trading strategy and obtain better desirable results. You do so by using the statistics table and observe the Mean Price Drop and Bounce values to learn what the indicator is detecting when it measures from the pivot low points. Using this information, you can adjust the Base Confirmation Settings accordingly, along with any volume specifications you require, to configure the indicator for the chart.
Always keep in mind that past performance may not be indicative of future results. Settings that seem favorable for one market may be found to be disastrous in another. Therefore, do take the time needed to understand how the settings will behave with the given chart symbol.
Enjoy! 😊👍
How to obtain access to the script?
You have two choices:
Use the "Website" link below to obtain access to this indicator, or
Send us a private message (PM) in TradingView itself.
Titik Pivot

Quickfingers Luc's Base Breaking Indicator v2.5Introduction
The indicator attempts to implement a popular price action strategy by Luc Thomas (a.k.a. Quickfingers Luc) typically referred to as a QFL base-breaking strategy. The strategy revolves around price action movements that reveal “bases”, which are price levels of support that have a significant, rapid price surges called “bounces”. Once a base is revealed, the base price level is used as reference to implement multiple entries below the base using a layering technique of dollar-cost averaging to place multiple limit orders at various price levels below the base price. As price action breaks below the base price, the limit orders will be filled, and the take profit, breakeven and stop loss prices will be recalculated.
How is it original and useful?
This indicator is unique in that the strategy version fully supports the TradingView backtester, which will enable you to perform experiments with various settings to evaluate performance using the historical chart data. The study version implements numerous custom alerts for you to build TradingView notifications around specific price action events and stay informed with market activity in real-time. Both script versions will provide the same configuration abilities where you can define:
Base confirmation settings, including volume analysis.
Your preferred layering strategy of either Dollar-cost averaging (DCA) or grid-like layers along with precise layer placement.
Your trading parameters like take profit and stop loss offsets, exchange commission rates, trading start time, and position size multiplication for each layer.
Flexible trade eligibility rules that can use other chart indicators, like RSI or EMA, to exclude the selection of base prices for trading.
The visibility of detailed statistics from the chart history pertaining to trading sessions started and closed, session durations, win rate, price action drops and bounces, as well as layer utilization.
How does it compare to other scripts in the Public Library?
The indicator offers a very detailed, comprehensive settings to address all types of markets found on TradingView where you can implement the QFL base-breaking strategy. The strategy version can be considered the first of its kind on TradingView to leverage the backtester to provide informative, detailed performance measurements surrounding this unique trading strategy. The study version will contain numerous custom alerts to aid in your notification preferences and stay informed on the indicator's activities:
Base Created
Base Cracked
Base Respected
Any Layer Cracked
Layer 1 Cracked
Layer 2 Cracked
Layer 3 Cracked
Layer 4 Cracked
Layer 5 Cracked
Layer 6 Cracked
Layer 7 Cracked
Layer 8 Cracked
Layer 9 Cracked
Layer 1 Respected
Layer 2 Respected
Layer 3 Respected
Layer 4 Respected
Layer 5 Respected
Layer 6 Respected
Layer 7 Respected
Layer 8 Respected
Take Profit Crossed
Stop Loss Crossed
What does it do and how does it do it?
It is recommended that you start with a chart that is on an hourly timeframe with the "Scale Price Chart Only" chart setting enabled. When applied to the chart for the first time, the default settings will work to render base price levels in orange and 8 DCA layers in blue using a Fibonacci-like sequence for the deviation offset relative to the base price. As you scroll through the chart's history you should see price action crossing the DCA layers, denoted with blue triangles, and a green take-profit line will render with green triangle denoting the crossing. Lastly, when a trade session begins upon the crossing of the first layer, the indicator will continue to identify base price levels, but the color of the price lines will be gray. When the trade session concludes upon the crossing of the take profit line, the indicator will switch the most recent base price line from gray to orange to make it active and eligible for trading.
As price action develops, the indicator will use the "Base Confirmation Settings" to look back by counting the number of bars to the left and right of a pivot low point, measure the price drops and bounces, and volume amounts to validate that they are within the specified values. If so, the indicator will draw an orange triangle beneath the candle bar to denote it as the pivot low point and begin rendering the orange line as the base price. The DCA layers will be calculated and offset relative to the base price using thin blue lines.
Optionally, the breakeven price line will be drawn to help visualize the true breakeven price which takes into consideration the exchange fees being applied. Base line, take profit, stop loss and DCA layer crossings will be denoted with colorful shapes to help visually recognize the events on the chart.
The volume is validated only at the pivot low candle. It will measure the volume against the moving average to determine base confirmation. A volume factor of 1 will mean that the volume must be at least the same value as the moving average value. A volume factor of 2 means it must be twice the moving average value.
Lastly, the very last bar will render a table of statistics that summarize all the events that have taken place since the indicator began simulating trading sessions from the chart's history.
Strategy Results
The default settings are designed to define a "weak" QFL base to ensure that the indicator will render chart elements when first loaded as well as to allow the backtester to gather order executions and display performance summary. The strategy version is using $10,000 initial capital, a commission rate of 0.1% for both entries and exits, and a 1 tick slippage setting. It is also using 3.4887% of the equity with a Position Size Multiplier of 1.35, using 8 total DCA layers, and a take profit of 5% with no stop loss. All other settings are defaults.
It is recommended that the indicator be "tuned" for your specific market in order to best implement the QFL trading strategy and obtain better desirable results. You do so by using the statistics table and observe the Mean Price Drop and Bounce values to learn what the indicator is detecting when it measures from the pivot low points. Using this information, you can adjust the Base Confirmation Settings accordingly, along with any volume specifications you require, to configure the indicator for the chart.
Always keep in mind that past performance may not be indicative of future results. Settings that seem favorable for one market may be found to be disastrous in another. Therefore, do take the time needed to understand how the settings will behave with the given chart symbol.
Enjoy! 😊👍
How to obtain access to the script?
You have two choices:
Use the "Website" link below to obtain access to this indicator, or
Send us a private message (PM) in TradingView itself.
Quickfingers Luc's Base Breaking Strategy v2.5Introduction
The strategy attempts to implement a popular price action strategy by Luc Thomas (a.k.a. Quickfingers Luc) typically referred to as a QFL base-breaking strategy. The strategy revolves around price action movements that reveal “bases”, which are price levels of support that have a significant, rapid price surges called “bounces”. Once a base is revealed, the base price level is used as reference to implement multiple entries below the base using a layering technique of dollar-cost averaging to place multiple limit orders at various price levels below the base price. As price action breaks below the base price, the limit orders will be filled, and the take profit, breakeven and stop loss prices will be recalculated.
How is it original and useful?
This strategy is unique in that the strategy version fully supports the TradingView backtester, which will enable you to perform experiments with various settings to evaluate performance using the historical chart data. The study version implements numerous custom alerts for you to build TradingView notifications around specific price action events and stay informed with market activity in real-time. Both script versions will provide the same configuration abilities where you can define:
Base confirmation settings, including volume analysis.
Your preferred layering strategy of either Dollar-cost averaging (DCA) or grid-like layers along with precise layer placement.
Your trading parameters like take profit and stop loss offsets, exchange commission rates, trading start time, and position size multiplication for each layer.
Flexible trade eligibility rules that can use other chart indicators, like RSI or EMA, to exclude the selection of base prices for trading.
The visibility of detailed statistics from the chart history pertaining to trading sessions started and closed, session durations, win rate, price action drops and bounces, as well as layer utilization.
How does it compare to other scripts in the Public Library?
The strategy offers a very detailed, comprehensive settings to address all types of markets found on TradingView where you can implement the QFL base-breaking strategy. The strategy version can be considered the first of its kind on TradingView to leverage the backtester to provide informative, detailed performance measurements surrounding this unique trading strategy. The study version will contain numerous custom alerts to aid in your notification preferences and stay informed on the indicator's activities:
Base Created
Base Cracked
Base Respected
Any Layer Cracked
Layer 1 Cracked
Layer 2 Cracked
Layer 3 Cracked
Layer 4 Cracked
Layer 5 Cracked
Layer 6 Cracked
Layer 7 Cracked
Layer 8 Cracked
Layer 9 Cracked
Layer 1 Respected
Layer 2 Respected
Layer 3 Respected
Layer 4 Respected
Layer 5 Respected
Layer 6 Respected
Layer 7 Respected
Layer 8 Respected
Take Profit Crossed
Stop Loss Crossed
What does it do and how does it do it?
It is recommended that you start with a chart that is on an hourly timeframe with the "Scale Price Chart Only" chart setting enabled. When applied to the chart for the first time, the default settings will work to render base price levels in orange and 8 DCA layers in blue using a Fibonacci-like sequence for the deviation offset relative to the base price. As you scroll through the chart's history you should see price action crossing the DCA layers, denoted with blue triangles, and a green take-profit line will render with green triangle denoting the crossing. Lastly, when a trade session begins upon the crossing of the first layer, the indicator will continue to identify base price levels, but the color of the price lines will be gray. When the trade session concludes upon the crossing of the take profit line, the indicator will switch the most recent base price line from gray to orange to make it active and eligible for trading.
As price action develops, the indicator will use the "Base Confirmation Settings" to look back by counting the number of bars to the left and right of a pivot low point, measure the price drops and bounces, and volume amounts to validate that they are within the specified values. If so, the indicator will draw an orange triangle beneath the candle bar to denote it as the pivot low point and begin rendering the orange line as the base price. The DCA layers will be calculated and offset relative to the base price using thin blue lines.
Optionally, the breakeven price line will be drawn to help visualize the true breakeven price which takes into consideration the exchange fees being applied. Base line, take profit, stop loss and DCA layer crossings will be denoted with colorful shapes to help visually recognize the events on the chart.
The volume is validated only at the pivot low candle. It will measure the volume against the moving average to determine base confirmation. A volume factor of 1 will mean that the volume must be at least the same value as the moving average value. A volume factor of 2 means it must be twice the moving average value.
Lastly, the very last bar will render a table of statistics that summarize all the events that have taken place since the indicator began simulating trading sessions from the chart's history.
Strategy Results
The default settings are designed to define a "weak" QFL base to ensure that the indicator will render chart elements when first loaded as well as to allow the backtester to gather order executions and display performance summary. The strategy version is using $10,000 initial capital, a commission rate of 0.1% for both entries and exits, and a 1 tick slippage setting. It is also using 3.4887% of the equity with a Position Size Multiplier of 1.35, using 8 total DCA layers, and a take profit of 5% with no stop loss. All other settings are defaults.
It is recommended that the indicator be "tuned" for your specific market in order to best implement the QFL trading strategy and obtain better desirable results. You do so by using the statistics table and observe the Mean Price Drop and Bounce values to learn what the indicator is detecting when it measures from the pivot low points. Using this information, you can adjust the Base Confirmation Settings accordingly, along with any volume specifications you require, to configure the indicator for the chart.
Always keep in mind that past performance may not be indicative of future results. Settings that seem favorable for one market may be found to be disastrous in another. Therefore, do take the time needed to understand how the settings will behave with the given chart symbol.
Enjoy! 😊👍
How to obtain access to the script?
You have two choices:
Use the "Website" link below to obtain access to this indicator, or
Send us a private message (PM) in TradingView itself.

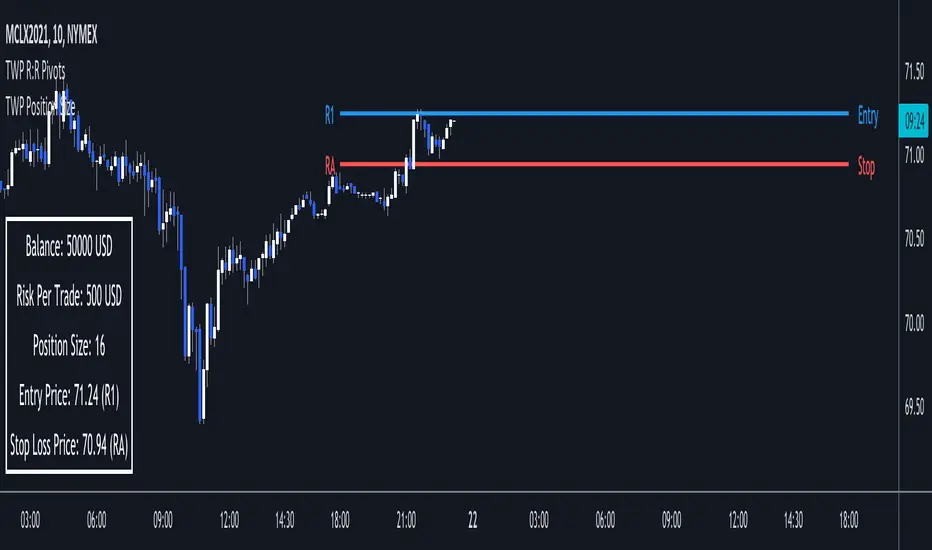
TWP Position Size Display█ OVERVIEW
Proper position sizing can significant alter your returns from a positive or negative perspective. Being aware of how much size you should put on per trade can help you in the heat of the trading moment and from blowing your account. This script sheds light on that by displaying your account balance, risk per trade, proper position size per trade relative to the pivot point entry level, entry & stop loss price levels and adjoining pivot point labels. This is a companion tool to be used in conjunction with the Automatic Risk to Reward Pivots and/or Standard Fibonacci Pivot Points.
█ FEATURES
1 — Trade Settings
• Trade bias - long or short
• Entry choice - static or dynamic
• Manual entry choice
2 — Account Settings
• Account Balance
• Account leverage
• Account currency
3 — Risk Settings
• Risk per trade (%)
4 — Text
• Size selection
• Color selection
5 — Display
• Frame color selection
• Display position selection
█ HOW TO USE
• Start your trading session by entering in your account balance into the setting and update after every trade it completed
• Set your risk per trade %
• You are ready to trade in a risk adjusted manner
█ NOTES
• The power of this tool is in its persistent placement on the screen. It is key to know where your account is at. This limit can be played with when dealing with larger values. For instance lets say your daily risk is 100k well you don't want to blow all of that in a day so you can set your risk higher than the usual retailer and still stay within your risk limits.
• The risk to reward pivots is the battery pack behind the indicator because the risk % is based on the trade setups from the pivot points.
TWP Higher Timeframe Pivot Points█ OVERVIEW
This script displays the nearest support and resistance fibonacci pivot point levels from the higher reference timeframes -- weekly, monthly, and yearly levels. When trading it is always been helpful for me to be aware of significant price levels of the players participating on larger timeframes. HTF pivot points are a great tool for finding confluence and/or gaining extra conviction on your trades. This is a companion tool to be used in conjunction with the Standard Fibonacci Pivot Points .
█ CONCEPTS
Pivot points are a technical indicator / calculation that can be used to determine the overall trend of the market or determine the level that price may face support or resistance. At the same time it can lead to confirmation of the overall trend when price travels through support or resistance lines continuously.
The pivot point is the average of the high, low, and closing price of the previous time window - Day, Week, Month, Year.
The going belief is that if price is trading above the pivot point (P) then there is a bullish sentiment and trading below the pivot point (P) is a bearish sentiment.
Pivot points can be calculated a multitude of ways but the way I am using it here is using the fibonacci method. See the calculations below.
Note: Tooltips are added for each lines label that display the calculation used.
Default Ratios + Matching Labels:
pivot point = (high + low + close) / 3
support lines = pivot - (prevhigh - prevlow) * 0.236
resistance lines = pivot - (prevhigh - prevlow) * 0.236
38.2% - S1/R1
61.8% - S2/R2
100% - S3/R3
Additional (Mid) Ratios + Matching Labels:
23.6% - SA/RA
50% - SB /RB
76.4% - SC / RC
127.2% - S4/R4
141.4% - S5/R5
161.8% - S6/R6
200% - S7/R7
█ FEATURES
1 — Line Extension - Left, Right, Both, None
2 — Pivot Levels for Week, Month, and Year Pivot Points
• Show line
• Show label
• Line color
• Line style
█ HOW TO USE
• As mentioned earlier it best used along with the Standard Fibonacci Pivot Points to find levels of potential confluence where you believe may be key support, resistance, or a potential inflection point in price action.
█ LIMITATIONS
• Depending on the chart and the amount of data it naturally pulls back, the yearly fibonacci pivot point levels may not show
• Pivot points may be found useful for some and not for others
• There is no assurance that price will stop at, reverse, or reach a specific pivot level

Pivot Points on SR linesAnalyzing price movements for a few years taught me one thing - markets always reverse bouncing off some horizontal Support/Resistance level. The only exception to this rule is when market pops new ATH (All Time High), which certainly happened in so-called "price discovery" run - this asset has never been in this space before, so no Support/Resistance could have been formed, while the rally had to stop at some point anyway.
In all other cases, analyzing past market movements, you will be able to find a place where the market reversed or gathered before. The difficulty is to understand (or guess?) from which S/R level market will reverse right now, because there are many of them. Even if this is probably not possible to make such guess correctly and always, it is good to know when potential reversal shown by whatever indicator you're using happened on SR line or in the middle of nowhere. That last case would turn out to be fake to your worst regrets. Ability to filter-out all those fake pivots is a value my indicator delivers.
Example? It is very often considered an entry signal when Stochastic %K and %D lines cross each other, especially in overbought/oversold area. It could work quite well in sideways markets, but when a trend begins, Stochastic would report CONSECUTIVE counter-trend signals, draining your trading balance to zero quickly. But this trend took place in price-discovery area (not necessarily when going for the new ATH ), so all those counter-trend signals happened not at S/R levels. Hence, they should be ignored.
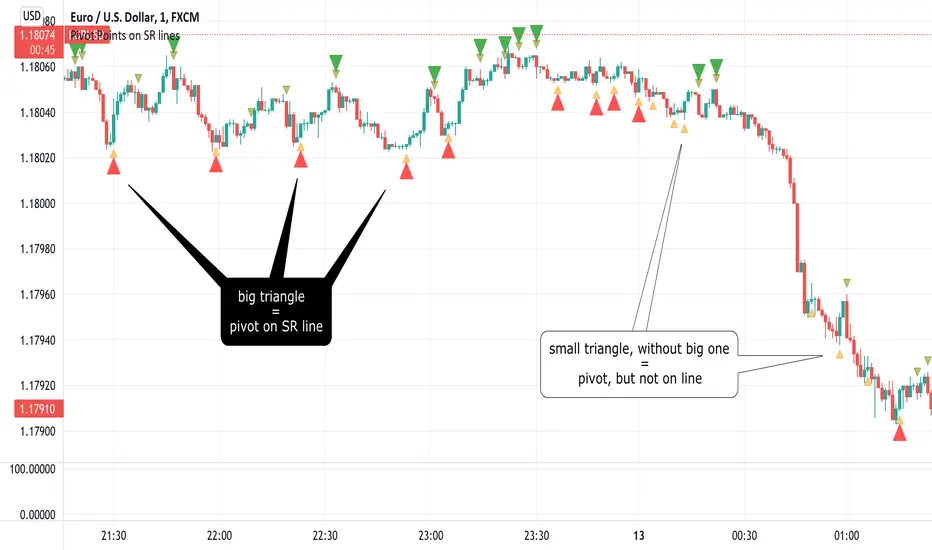
Big triangles mark pivot point which happened on the S/R line. Small triangles - in the middle of nowhere.
How good is it? I compared it with one of my previous scripts, the "PivotPoints with Momentum confirmation" (), this new script confirms only 1/3 of pivots in the old script on 1m EURUSD chart. Filtering out 2/3 of potentially bad entries is a good result, I'd say :)
This script also fires alerts - alert is triggered as soon as PivotPoint is noticed, on a candle close.
I strongly recommend NOT using it not using this indicator as a standalone indicator. There is so much information you should take into consideration as well - market bias, volume , higher timeframe trend... To make it convenient to join PivotPoints information with other indicators, I have "exported" one plot so you can include it in your own - just use input.source in your own code to have it return 1 for PivotLow ( aka Long entry) and -1 for PivotHigh ( aka Short entry).
Pivot Points on SR lines DEMOAnalyzing price movements for a few years taught me one thing - markets always reverse bouncing off some horizontal Support/Resistance level. The only exception to this rule is when market pops new ATH (All Time High), which certainly happened in so-called "price discovery" run - this asset has never been in this space before, so no Support/Resistance could have been formed, while the rally had to stop at some point anyway.
In all other cases, analyzing past market movements, you will be able to find a place where the market reversed or gathered before. The difficulty is to understand (or guess?) from which S/R level market will reverse right now, because there are many of them. Even if this is probably not possible to make such guess correctly and always, it is good to know when potential reversal shown by whatever indicator you're using happened on SR line or in the middle of nowhere. That last case would turn out to be fake to your worst regrets. Ability to filter-out all those fake pivots is a value my indicator delivers.
Example? It is very often considered an entry signal when Stochastic %K and %D lines cross each other, especially in overbought/oversold area. It could work quite well in sideways markets, but when a trend begins, Stochastic would report CONSECUTIVE counter-trend signals, draining your trading balance to zero quickly. But this trend took place in price-discovery area (not necessarily when going for the new ATH ), so all those counter-trend signals happened not at S/R levels. Hence, they should be ignored.
Big triangles mark pivot point which happened on the S/R line. Small triangles - in the middle of nowhere.
How good is it? I compared it with one of my previous scripts, the "PivotPoints with Momentum confirmation" (), this new script confirms only 1/3 of pivots in the old script on 1m EURUSD chart. Filtering out 2/3 of potentially bad entries is a good result, I'd say :)
This script also fires alerts - alert is triggered as soon as PivotPoint is noticed, on a candle close.
I strongly recommend NOT using it not using this indicator as a standalone indicator. There is so much information you should take into consideration as well - market bias, volume , higher timeframe trend... To make it convenient to join PivotPoints information with other indicators, I have "exported" one plot so you can include it in your own - just use input.source in your own code to have it return 1 for PivotLow ( aka Long entry) and -1 for PivotHigh ( aka Short entry).

RSI Centered PivotsJust a simple RSI central pivot strategy I made for a friend.
Backtested on BYBIT:BTCUSD, 155m.
DISCLAIMER : Please do your own research into anything you use before using it to trade.

Posty PivotsIndicator plots anticipated support/resistance areas based on prior day price action and includes breakout/breakdown targets.
This work is an original interpretation of Camarilla Pivots as well as the techniques taught by Pivot Boss.
As with everything context along with price action is crucial when trading potential reversal zones.
This indicator is used for intraday trading.

Pivot Reversal Strategy + alerts via TradingConnector to indicesSoftware part of algotrading is simpler than you think. TradingView is a great place to do this actually. To present it, I'm publishing each of the default strategies you can find in Pinescript editor's "built-in" list with slight modification - I'm only adding 2 lines of code, which will trigger alerts, ready to be forwarded to your broker via TradingConnector and instantly executed there. Alerts added in this script: 14 and 22.
How it works:
1. TradingView alert fires.
2. TradingConnector catches it and forwards to MetaTrader4/5 you got from your broker.
3. Trade gets executed inside MetaTrader within 1 second of fired alert.
When configuring alert, make sure to select "alert() function calls only" in CreateAlert popup. One alert per ticker is required.
Adding stop-loss, take-profit, trailing-stop, break-even or executing pending orders is also possible. These topics have been covered in other example posts.
This routing works for Forex, indices, stocks, crypto - anything your broker offers via their MetaTrader4 or 5.
Disclaimer: This concept is presented for educational purposes only. Profitable results of trading this strategy are not guaranteed even if the backtest suggests so. By no means this post can be considered a trading advice. You trade at your own risk.
If you are thinking to execute this particular strategy, make sure to find the instrument, settings and timeframe which you like most. You can do this by your own research only.

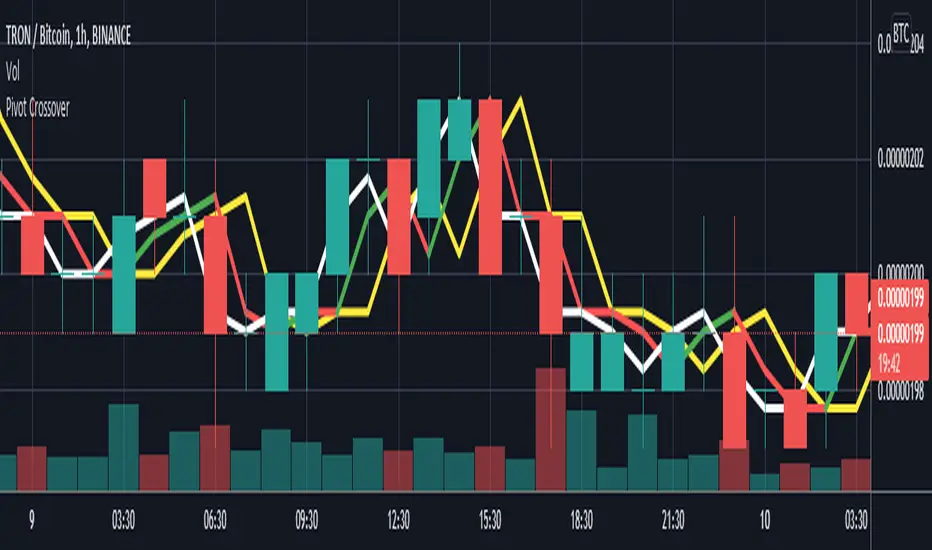
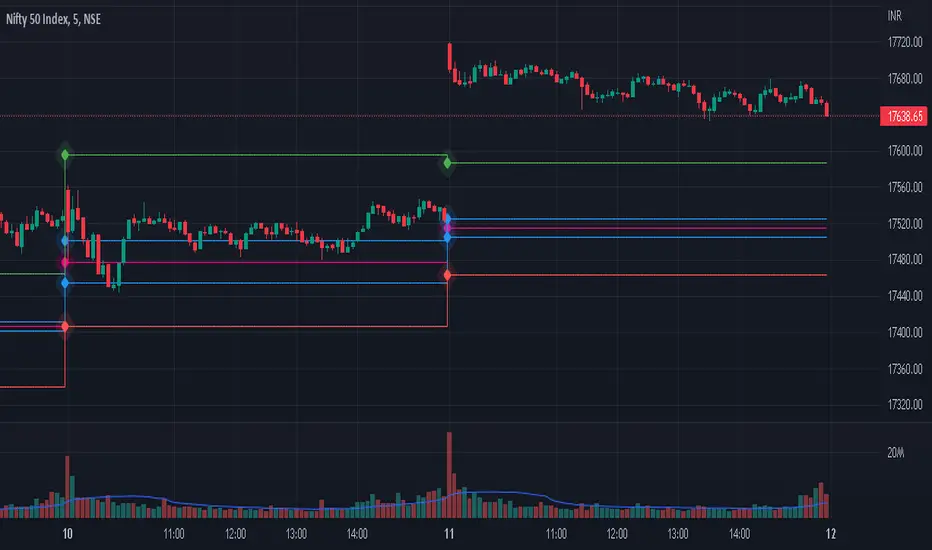
Pivot CrossoverThis indicator work on pivot point crossover. In this indicator use three pivot point
White color line is Pivot point for current bar.
Green/Red color line is Pivot point for last bar.
Yellow color line is Pivot point for 2nd last bar.
For long
if last pivot crossover above 2nd last pivot then go long
if current pivot crossover below last pivot then exit long
For short
if last pivot crossover below 2nd last pivot then go short
if last pivot crossover above last pivot then exit short
[FN] Strategy - Store Level on ConditionThis is a function that you can use in strategies. Not a strategy in and of itself.
Example thumbnail is showing the function applied to a strategy.
Oftentimes, I am asked a question regarding how to hold a variable at a specific, constant level over a conditional period of time. This question is always asked in a very long convoluted way like "I want the strategy to know what the high of the last pivot was while I'm in a long." or some other variation of wanting a script to remember something from prior bars.
This function is designed to store a price or some numeric level on the bar that your conditional (bool) statements determine that it should be stored. In this construct, you would set conditional statement(s) to flip the 'hold condition' to be true on the next bar, then hold that value until either the "hold condition" is no longer true or the initial conditions trigger again, causing an update to the level that you want to capture.
You still have to come up with the logic for the start condition and hold condition on your own, but I've provided an example that should give you an idea of how to accomplish this and customize/deploy the function for your purposes.
The function will return 'na' when neither the start condition nor hold condition are true. There's multiple ways to implement this and variations on how the level is chosen. I've written extensive notes in the script to guide you through the logic behind the function. My hope is that it will be useful to those trying to build strategies or anyone attempting to get their script to remember a level under given conditions.
In the thumbnail example, the take profit level is defined at the beginning of the trade and held until the take profit order executes. The order execution is a separate matter. However, storing the take-profit level at a static value is key to telling the strategy.exit() function what price to execute a limit exit order at.
Example: strategy.exit("Exit Long", from_entry = "long", qty_percent = 100, limit = stored_value)
Let me know how it works out for you and if I can be of any assistance.
Note: Strategy results are mainly derived from the fact that the strategy is long-only, the NQ only goes up, and there is no stop loss in place. So don't ask for the specific strategy, because unless you're trading a single contract with a $500,000 account, you'll probably get liquidated using this strategy as it is presented.

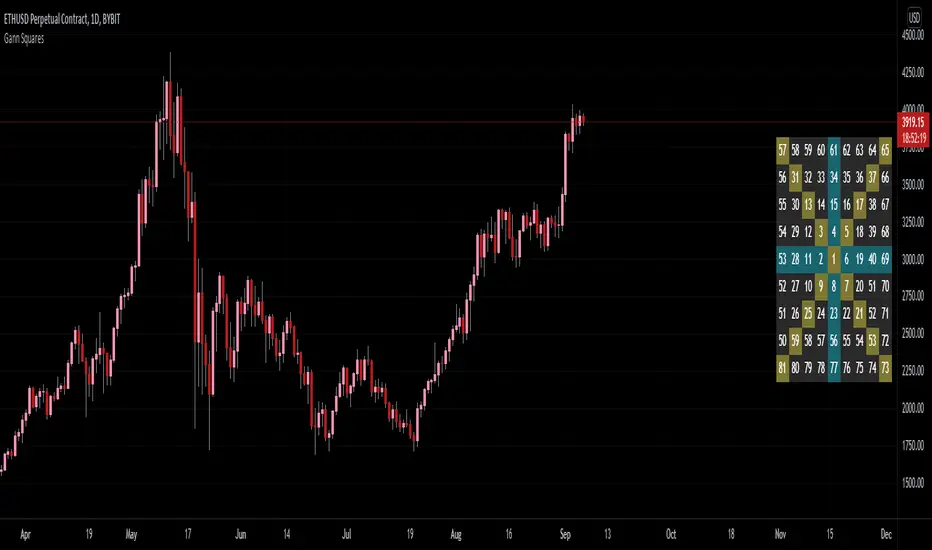
Gann Square of 9Gann's Square's are some of the best known tools created by Gann. His most well known square was his Square of 9.
The reason for this was because of the symmetry 9 had with itself. Gann was able to balance both price and time with this symmetry.
- 9 is the last single-digit and largest number
- You can add anything to 9 and it will give you a natural number
- (9 + 3 = 12); 1 + 2 = 3... (9 + 9 = 18); 1 + 8 = 9... etc.
- Multiplying any number by 9 will have the natural number be 9
- (9 * 6 = 54); 5 + 4 = 9... (9 * 3 = 27); 2 + 7 = 9... etc.
For these reason, Gann claimed that 9 has everything within itself.
Here I have created an on-chart square of 9 including the cardinal and ordinal cross points colored. In the settings you are able to customize the starting value of the table as well as the period movement. In most cases, 81 is not high enough to be useful in charting cases, so I'd recommend printing out your own Gann Square of 9 that goes as high as you need it to go.
THIS IS NOT TRADING ADVICE ; please use your own technical analysis before making any decisions based off of public indicators. Learn more about Gann's Squares before attempting to use them as this script was not meant to give you answers, only the table.
CPR by WsrWe recommend some preconditions for Intraday Trading Strategy with CPR (Central Pivot Range)
Rules For BUY Setup with CPR
1) Today's Pivot Level Should be higher than Previous Day's Pivot Level
2) The previous day's close should be near day's high.
Rules For SELL Setup with CPR
1) Today's Pivot Level Should be lower than Previous Day's Pivot Level
2) The previous day's close should be near day low.
CPR or central pivot range is the best tool available for the trader to see the price base indicator. You can use this tool i.e CPR (central pivot range) to check the price indicator in the stock market. You know the price of shares sometimes goes up or sometimes goes down in the stock market. So it will be best to stay updated and know it before the time the share market/stock market fall or rises.
MTF Order Block FinderAn Order Block is a special type of pivot point that satisfies the following requirement:
A Bull/Bear candle followed by X consecutive candles in the opposite direction.
Order Blocks are interesting areas that are frequently revisited and can be treated as Support/Resistance levels.
Often, you can see explosive price rejection of these areas via long wicks, high volume, and rapid price change.
Features
Choose from two themes:
- LIGHT: a classic Red and Green representing Bearish and Bullish OBs, respectively
- DARK: a clean Blue and White scheme
Choose from two drawing styles:
- LINE: three lines representing the High, Low, and Mid price levels of the OB candle
- BOX: a bounded area similar to the "rectangle" tool
Chose a custom timeframe:
- From 1 Minute (useful for Seconds interval) up to 1 Month
Note, this setting is experimental and choosing a timeframe that is extraordinarily large may not function properly.
Filter order blocks with two settings:
- Number of consecutive bars
- Minimum % change of the potential OB bar (default 0.25%)
Keep your charts clean and show only relevant OBs
- Maximum number of Bullish zones to show
- Maximum number of Bearish zones to show
FAQ
Q: How do I trade with this indicator?
A:Personally, I use a fast entry indicator to confirm Long/Short position when price is rejected. I set my SL and TP based on the current Zone and the next one, if available.
Q: Does this repaint?
A:Yes and this is okay! The "Bear" and "Bull" signals are not meant for taking positions, only showing which candle reveals the Order Block. The Zone is much more useful to us and can result in several successful trades in the near future when treated as a support/resistance area.
Q What's the winrate?
A:Hard to say - this isn't a standalone strategy and I haven't been able to properly backtest it quite yet.

Trend lines + Pivot Levels + Candlestick PatternsThis is a pure PRICE ACTION indicator that will show you possible trend lines, pivot lines and candlestick patterns at once.
it has been designed to determine upper and lower trend lines in the chart and you can set candlestick patterns on them with alerts!
it means that you add the indicator to the chart and set the alert and done!
whenever a pinbar or engulf or breakout(in both directions) happens, you will be notified by alerts.
you also have pivot lines on the chart by this indicator. you can set the candlesticks on pivots instead of trend lines, so if you are a fan of support and resistance you can have this one, it depends on you.
all of the pivots and trend lines and also the candle sticks are customizable, so you can exactly select the pinbar, engulfing or breakout candle that matches with your mindset. for example you can set a pinbar that long shadow is 4 times or 3 times greater than the body, it's on you.
you can also customize trendlines or pivot lines, if you are scalper you can set it to small trend lines and if you are day trader or long term trader you can set it to the number that fits with your strategy.
trends and pivots will be updated automatically and there is no need to set it every time.
Be PROFITABLE!
$kMagician /*

[CP]Pivot Boss Candlestick Scanner - No Repainting This indicator is based on the high probability candlestick patterns described in the ’Secrets of a Pivot Boss’ book.
The indicator does not suffer from repainting.
I have kept this indicator open source, so that you can take this indicator and design a complete trading system around it.
Although the patterns have some statistical edge in the markets, blindly using them as Buy/Sell Indicators will certainly result in a heavy loss.
I like some of these setups more than others, and I have listed them in the order of my likeness.
The first one I like the most, the last one, I like the least.
The patterns are universal and work well in both intraday, daily and even larger timeframes.
Signals in the example charts are manually marked by,
Hammer - profitable short signal
Rocket - profitable long signal
X - unprofitable long or short signal
GENERAL USER INPUTS:
These settings exist as the indicator uses ‘Labels’ to mark the patterns and Pine Script limits a maximum of 500 labels on a chart.
If you want to go back in the past and check how the indicator was doing, set the Start and End dates both and check the ’Use the date range above to mark the Candlestick Setups?’ option.
EXTREME REVERSAL SETUP:
This is by far my favorite setup in the lot. Classic Mean Reversion setup.
The logic, as explained in the book, goes like this,
1. The first bar of the pattern is about two times larger than the average size of the candles in the lookback period.
2. The body of the first bar of the pattern should encompass more than 50 percent of the bar’s total range, but usually not more than 85 percent.
3. The second bar of the pattern opposes the first.
The setup works extremely well in high beta stocks like Vedanta VEDL.
Feel free to play with the settings in order to better align this pattern with your favorite stock.
Check out the examples below,
No indicator is perfect, failed patterns are marked with an X.
OUTSIDE REVERSAL SETUP:
My second favorite setup, it is quite good at catching intraday trends.
Here’s the logic,
1. The engulfing bar of a bullish outside reversal setup has a low that is below the prior bar’s low and a close that is above the prior bar’s high. Reverse the conditions for bearish outside reversal.
2. The engulfing bar is usually 5 to 25 percent larger than the size of the average bar in the lookback period.
Settings for this pattern simply reflect these conditions. Feel free to modify them as you wish.
The pattern is pretty powerful and will sometimes help you catch literally all the highs and lows of the market, as shown in the examples of Vedanta VEDL and RELIANCE stocks below.
As usual, this pattern is not PERFECT either.
DOJI REVERSAL SETUP:
Doji candles signify market indecision and this pattern tries to profit off these market conditions.
Logic:
1. The open and close price of the doji should fall within 10 percent of each other, as measured by the total range of the candlestick.
2. For a bullish doji, the high of the doji candlestick should be below the ten-period simple moving average. Vice-versa for bearish.
3. For a bullish doji setup, one of the two bars following the doji must close above the high of the doji. Vice-versa for bearish.
Feel free to modify the settings and optimize according to the stock you are trading.
Don't optimize too much :)
This pattern works brilliantly well on larger intraday timeframes, like 15m/30m/60m.
This pattern also has a higher propensity to give false indications than the two described above.
Doji reversal typically helps to catch larger trend reversals. Check out the examples below from RELIANCE and NIFTY charts,
Note that the RELIANCE chart below is the same as shown for the Outside Reversal Setup above, notice the confluence of Outside
Reversal and Doji Reversal on the 31st August.
Confluence of patterns usually increases the probability of success.
RELIANCE 15m Chart - Pattern can catch nice trends on higher timeframes
NIFTY 15m Chart
WICK REVERSAL SETUP:
This pattern tries to capture candlesticks with large wick sizes, as they often indicate trend reversal when coupled with significant support and resistance levels.
Logic:
1. The body is used to determine the size of the reversal wick. A wick that is between 2.5 to 3.5 times larger than the size of the body is ideal.
2. For a bullish reversal wick to exist, the close of the bar should fall within the top 35 percent of the overall range of the candle.
3. For a bearish reversal wick to exist, the close of the bar should fall within the bottom 35 percent of the overall range of the candle.
This pattern must always be coupled with important support resistance levels, else there will be a lot of false signals.
The chart below is the same NIFTY chart as above with the Wick Reversal candles marked as well.
You can see that there are a lot of false signals, but the price also indicates ’pausing’ at important levels by printing a wick reversal setup.
You can use this information to your advantage when riding a trend.
FINAL WORDS:
Settings for various patterns simply reflect the logic described.
You will probably need to tweak and optimize the pattern settings for the stock that you are trading.
Higher Beta/Higher Volatility stocks are a great choice for these patterns.
Using these patterns at critical support and resistance levels will result in dramatically high accuracy.
Be creative and try to develop a proper system around this indicator, with rules for position sizing, stop loss etc.
You do not have to trade all the patterns. Even trading just one pattern with a proper system is good enough.
DO NOT USE THIS INDICATOR AS A BUY/SELL SYSTEM, YOU WILL LOSE MONEY.
Feel free to drop any feedback in the comments section below, or if you have any unique candlestick patterns that you would like me to code.

Zigzag SARThis is another ZigZag script. But the difference between this and other ZigZag indicators on TV is that here we find highs and lows based on Parabolic SAR.
It repaints?
YES.
On last line of ZigZag you get repainting, because the highs and lows get confirmation only if direction (SAR dots) changes.
This shouldn't be used to forecast highs and lows directly anyway, it's just a visual guide for past highs and lows.
I'm using it to spot harmonic patterns and Wolfe waves more easily. The plan is to draw these automatically in the future, but my skills at Pinescript are limited at the moment.
PS. Ideas for my scripts are coming from @Jegejig1 on Stocktwits, if you want to know who to blame lol

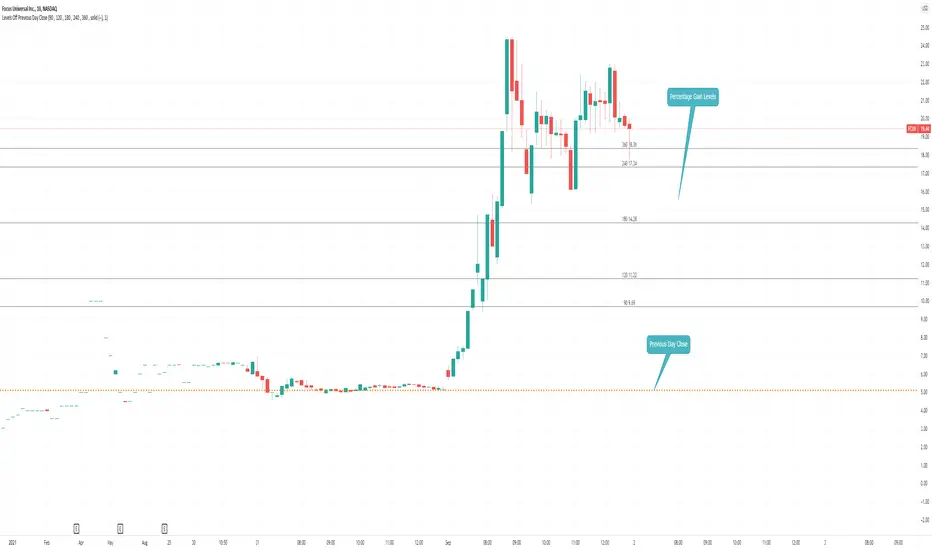
Levels Off Previous Day CloseThis script calculate the 90-120-180-240-360 Percent gains based on the previous day close.
Three Week Tight Pattern IndicatorThree Week Tight Pattern is a consolidation indicator which give extra buy point on strong fundamental stocks. You can read about it from IBD here: www.investors.com

Order Block FinderAfter finding a huge amount of use from TV user's wugamlo script Order Block Finder (Experimental) , I decided to make some much needed upgrades! Added support for plotting the last X number of Order Blocks and am currently working on a multi-timeframe version.
If you'd like to contribute to the MTF analysis portion, that would benefit tons of other scripts and open the possibility to more "MTF Panel" style indicators.
Please visit the original script page (link at top) to review how the indicator is used in trading.

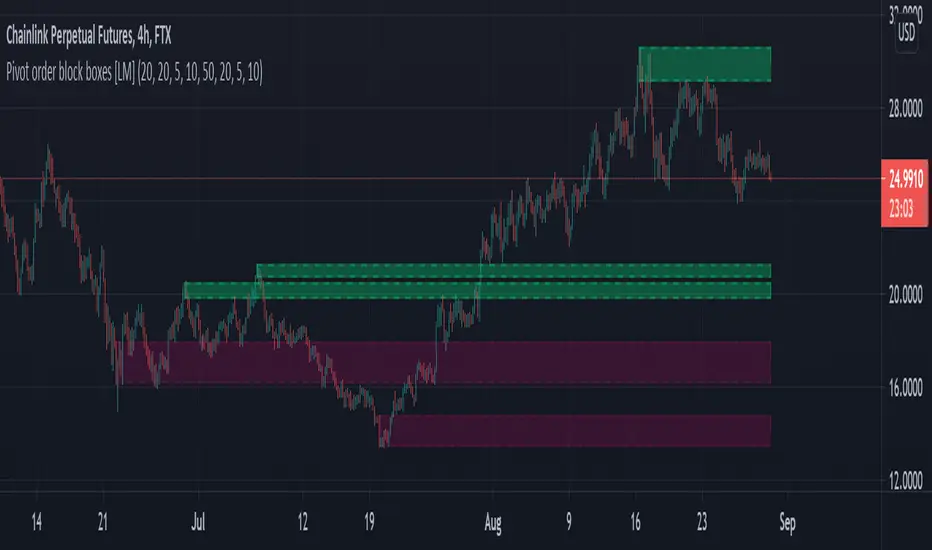
Pivot order block boxes [LM]Hello traders,
let me intoduce you pivot order block boxes. The idea is find the pivot point that within the right side count of candles achieved some percentage change and in that way filter out important pivots. Once the pivot point is found and matches the volatility condition then from the left side of pivot first candle that is up candle for pivot high and down candle for pivot low, could be also the pivot candle itself is selected and rendered high and low of that candle. The premise behind is that those are the levels profesional traders are buying.
It has two settings that you can change at your will, it also enables hide/show particular pivot setting
Hope you will enjoy as I enjoyed to write it.
Lukas
Poor ReversalsPoor Reversals Indicator
This indicator finds Poor Reversals. Poor reversals are reversals in price with consecutive highs or lows that are close together. Look for the different types of highs and lows. Some say candle patterns don't matter, but they forget it's the orderflow that makes the pattern. Find poor, tweezer, and 1 tic rejections and study what happens next. We don't need to read the depth of market to see what the orderflow is saying. They are called poor because the auction didn't run its course. It didn't continue the direction until all activity in that direction was exhausted. Proper reversals create excess. Excess is a long tail/wick. A proper reversal leaves a long tailed excess unfilled.
The different highs and lows give clues to what kind of orderflow happened there. The difference between them is which high or low happened first. Price does often come back to these areas and clears them up with a proper reversal. We can see them on all timeframes. Knowing what they mean in the orderflow helps with reading charts.
The Poor Reversals are:
Poor
1 Tick Rejection
Tweezer
When looking at 2 bars that have very close high or lows, there are a few different types. They are each poor and can be further defined as each are price action clues.
If next low is higher, it's a poor low
If next low is lower, it's 1 tic rejection
If next low is equal, it's tweezer bottom
If next high is lower, it's a poor low
If next high is higher it's 1 tic rejection
If next high is equal it's tweezer bottom
Poor Highs and Lows:
The high or low comes first. The next bar does not go past it. Poor highs and lows are often created from price exhaustions. This means at poor highs buyers are trapped. At poor lows sellers are trapped. Price ran out of steam to continue in that direction. There wasn't enough activity and participation to continue the auction in that direction.
Poor lows are defined when 2 lows are very close, and the 1st bar is lower. The 2nd comes very close to a new low. It happens most when shorts, at the moment, "run out of steam". They were "too aggressive" and got themselves "short in the hole". When a poor low is made, price will bounce because shorts are buying to protect profits.
Poor highs are defined when 2 highs are very close. The 1st bar is higher. The 2nd comes very close to a new high. It happens most when longs, at the moment, "run out of steam". They were "too aggressive" and got themselves "long in the tooth". When a poor high is made, price will pullback because longs are selling to protect profits.
1 Tick Rejections:
The high or low comes last. The next bar goes just a little bit beyond it. A "1 tic rejection" happens when a new low is made and quickly rejects. The name is misleading. It doesn't have to be "1 tic". Different markets have different measurements. For ES, it's less than 8 tics. For NQ, it's about 5-20 points. It varies depending on relative market volatility.
1 Tick highs are defined when 2 highs are very close, and the 1st bar is lower. This happens when longs are aggressive and drive price up. Price makes a newer high and longs rapidly start taking profits. Their selling activity drives price lower. In the orderflow, longs likely closed at the same time new shorts sell. This competition to sell drives price lower. At the high, it says longs saw it wouldn't go higher and they took rapid exit.
1 Tick lows are defined when 2 lows are very close, and the 1st bar is lower. This happens when shorts are aggressive and drive price down. Price makes a newer low and shorts rapidly start taking profits. Their buying activity drives price higher. In the orderflow, shorts likely closed at the same time new longs buy. This competition to buy drives price higher. At the low, it says shorts saw it wouldn't go lower and they took rapid exit.
Tweezer Tops and Bottoms
The highs or lows of the bars are equal. Tweezers most often mean that an aggressive trader is influencing price. They drove price in one direction and then quickly reversed sentiment. Tweezers most often happens in stop hunts. An aggressive trader found where the stops were located and then entered an aggressive order to turn the market.
Tweezer Tops are defined when 2 highs are equal. The first bar sets the high. The second bar matches the high. This happens when there is an active seller entering. It could be simple profit taking from longs or new aggressive shorts. In bull trends, price will move up to find short stop. When the stops are found, the market reverses sharply lower.
Tweezer Bottoms are defined when 2 lows are equal. The first bar sets the low. The second bar matches the low. This happens when there is an active buyer entering. It could be simple profit taking from shorts or new aggressive longs. In bull trends, price will move up to find long stops. When the stops are found, the market reverses sharply higher.
Poor Reversals can be poor, 1 Tick Rejections, or Tweezers. They are all considered poor and upon further investigation we can see they are created from different conditions in the orderflow. They are not called Poor Reversals because they are weak. They are called poor because of the action that happened there. One side got caught in a bad position. Other sharks in the market smelled blood and ripped them apart.
This indicator is a work in process. While the concepts are great for real time trading, this indicator is not designed to be used in real time trading. It will repaint based on the bar close. The purpose of this indicator is to train our brains to see these nuances on candle charts. Some say candle patterns don't matter, but they forget it's the orderflow that makes the pattern. We must make split second decisions and knowing the context behind the orderflow reduces response time. These poor reversals don't have to retest, and the best ones won't come back. I use these concepts to find exits, where my trades might be wrong, confirmation I'm on the right side. It's amazing how these simple nuances can turn the markets. But sure enough, they do. Check them out in all time frames.
It's a fun indicator to play with. Some markets do require tweaks to the “Ticks” setting. Too big and charts will be noisy. Too low and not much will show up. A general rule of thumb is more volatile markets need higher tick values while less volatile need lower Tick values. Higher timeframes are also more reliable than lower time frames. I've included some customizable settings and I plan on adding more in the future. Enjoy!
