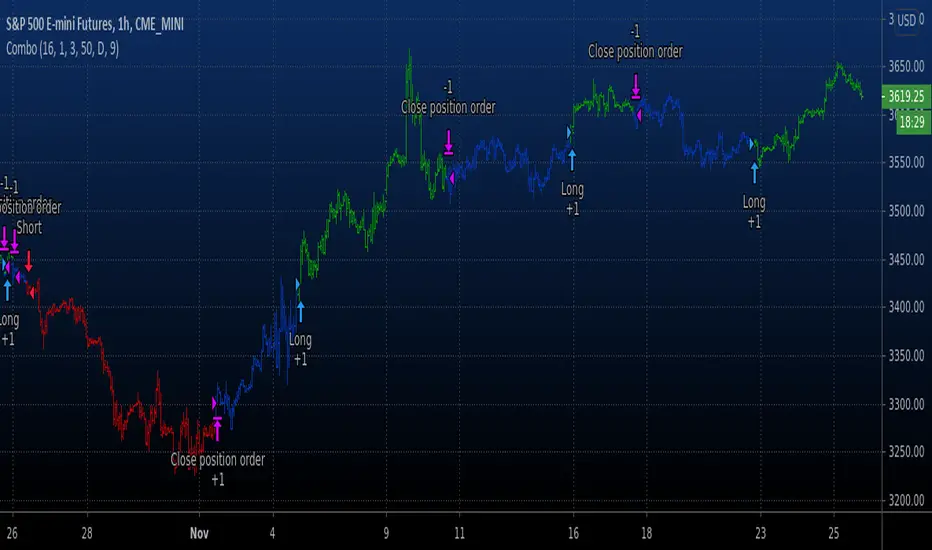
Combo Backtest 123 Reversal & High and Low Levels This is combo strategies for get a cumulative signal.
First strategy
This System was created from the Book "How I Tripled My Money In The
Futures Market" by Ulf Jensen, Page 183. This is reverse type of strategies.
The strategy buys at market, if close price is higher than the previous close
during 2 days and the meaning of 9-days Stochastic Slow Oscillator is lower than 50.
The strategy sells at market, if close price is lower than the previous close price
during 2 days and the meaning of 9-days Stochastic Fast Oscillator is higher than 50.
Second strategy
This script shows a high and low period value.
Width - width of lines
SelectPeriod - Day or Week or Month and etc.
LookBack - Shift levels 0 - current period, 1 - previous and etc.
WARNING:
- For purpose educate only
- This script to change bars colors.
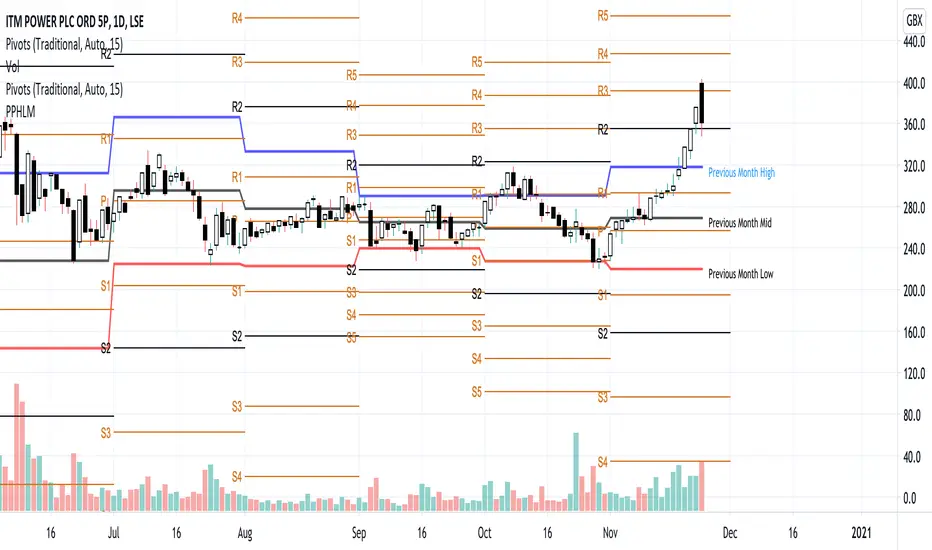
Titik Pivot
Previous Period High-Low-MidThis indicator is unique in that it also shows you the Mid price level for the previous period.
For intraday chart time period, you can see the previous day and week H, L and Mid.
For daily chart time period, you can see the previous month H, L and Mid.
Parabolic Peak Indicator
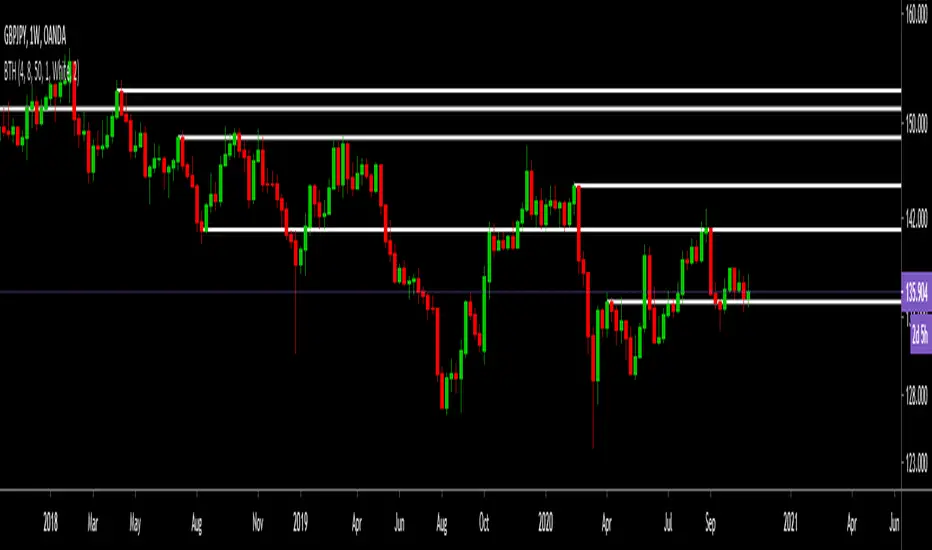
This indictor combines the concept of Bollinger Bands with a Sharpe Ratio calculation. The period used for calculation and the band widths can be adjusted. This was developed to be used on BTC and is best used on the weekly timeframe (with settings 20, close, 1, 2, and 3.2) although it can be used on any timeframe and the period used can be changed to compensate. For example, if you would like to view the chart on the daily timeframe for the use of other indicators but would like to view this on the weekly you can multiply your period by 7 to compensate (settings 140, close, 1, 2, and 3.2).
It is best viewed with bars rather than candles. Bars closing above the nominal green line are colored green. Bars closing below the nominal green line are colored red. Peak values of bars exceed the upper band they will be colored fuchsia, indicating the price may be nearing a peak high. When minimum values of bars fall below the lower band they will be colored lime green, indicating the price may be nearing a capitulation low.
Observations:
-First and foremost, market trend is indicated by the general bar colors (green/red).
-Different bands act similar to support and resistance during shorter timeframe price action.
-The farther price is away from the nominal green line the more you are over/underpaying for the asset based on the Sharpe Ratio.
-On BTC the indicator acts fairly reliably but different multipliers may be needed at different historical levels of maturity of the asset.
-Aside from detecting parabolic peaks, when price triggers a signal during an uptrend you will very often see an opportunity to buy at that price again at some point -in other words price will eventually normalize and give you another opportunity (much like filling gaps).
-After a significant consolidation period large moves can set off the high or low signal (fuchsia/lime green) as price expands into a new regime after the consolidation. These signals should be viewed as the establishment of a new trend direction rather than an indication of a true high or low.


Pivot Points (Daily, Weekly, Monthly)Pivot point: P = (High + Low)/2
First support: S1 = Low
Second support, S2 = Low - 2 * (High - Low)
First resistance: R1 = High
Second resistance, R2 = High + 2 * (High - Low)
White Line: Pivot Point
Gleen Line(Thin Line): Support 1
Green Line(Thick Line): Support 2
Red Line(Thin Line): Resistance 1
Red Line (Thick Line): Resistance 2
You can adjust it to daily, weekly or monthly indicators, daily for intraday trading (1minute, 1hour etc.), weekly and monthly for day/swing trading, monthly for weekly trades. I plot the graph with steplines since I think they can show the differences of pivots from time to time more clearly, you are free to change to other plot styles like circles or regular lines if you want to. Please like this script, and let me know any questions, thanks.

[JRL] MM FibonacciThis is a new indicator that uses Murrey Math formulas to find the tops and bottoms, then uses those tops and bottoms to draw long-term fibonacci retracement levels. The genius of Murrey was his geometric formulas to calculate the right place to start plotting the lines, but I think the fibonacci ratios typically seem more accurate than the MM line ratios. So in this script I attempt to take the best of each and combine them into a new, superior indicator.
Let me know in the comments if you find this useful. Cheers!

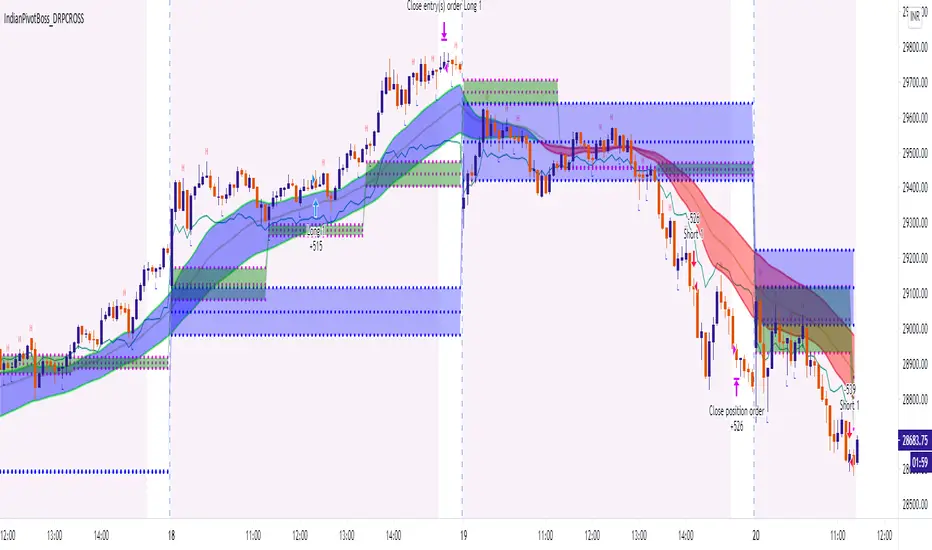
IndianPivotBoss_DRPCROSS_V2This strategy is an intraday strategy based on Developing pivot cross.
Long is generated when price crosses above developing pivot.
Short is generated when price crosses down developing pivot.
It also looks into developing pivot width for an expansion before taking into consideration of the above signals thereby providing signals only when a possibility of a trend emerges.
Pls note that past performance is not indicative of future performance.
Hence use it at your own risk. There is no guarantee for profits and there is always a possibility of losing entire capital in trading.
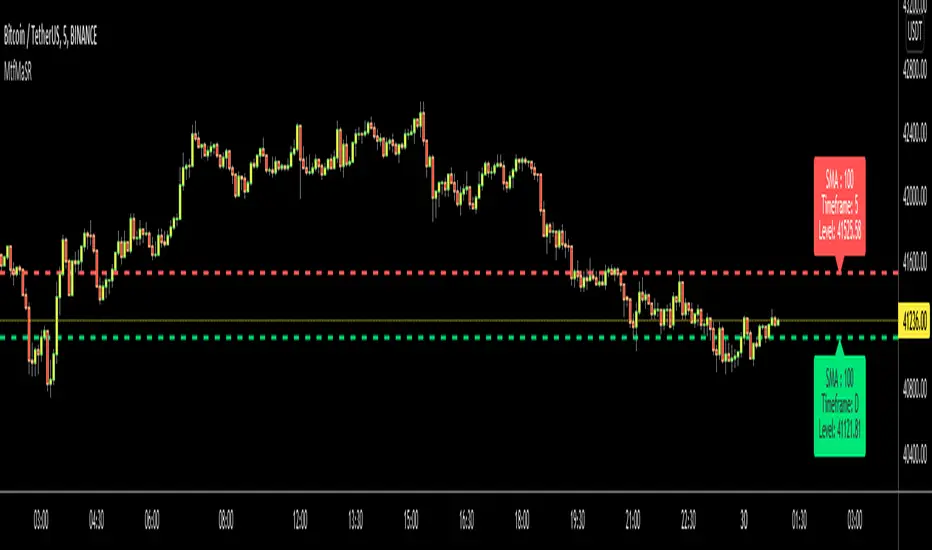
Moving Averages as Support Resistance MTFHello Traders!
As most of you know that Moving Averages with the lengths 50, 100, 150 and 200 are very important. We should use these this moving averages to figure out S/R levels, the possible reversals points, trend direction etc. we should check these moving averages on Higher Time Frames as well. for example if you look at the chart with 5mins time frame, you should also check it in 1hour and 4hour time frames to see to big picture and main trend. this is important as trend is your friend and you should not take positions against the trend.
I developed this script to show them clearly and make the chart understandable. 1 resistance line above the price and 1 support line below the price, it shows the moving average type, length, time frame and S/R level.
You have option to show SMA or EMA and to include/exclude current time frame, because you may want to see only MAs from higher time frames. you should set higher time frames accordingly.
if you add all moving averages for current and higher time frame the chart looks very crowded as following example:
The script makes it clear to understand the chart better, here an example:
It can show when S/R was broken and you get alert. here an example:
You have coloring and style options, you can change line style and colors as you wish:
Enjoy!
[JRL] Murrey Math LinesMurrey Math Lines are support and resistance lines based on geometric mathematical formulas developed by T.
H. Murrey. MM lines are a derivation of the observations of W.D. Gann. Murrey's geometry facilitate the use of Gann's theories in a somewhat easier application. According to Gann's theory, price tends to trend and retrace in 1/8th intervals. The most important MM line levels are the 0/8, 4/8 and 8/8 levels, which typically provide strong support and resistance points. The 3/8 and 5/8 levels represent the low and high of the typical trading range. When price is above the typical trading range, it is considered overbought, and when it is below it is considered oversold. The 2/8 and 6/8 levels provide strong pivot points.
Some of the other Murrey Math indicators on TradingView use different formulas and therefore produce varying results. I've checked my indicator against MM indicators on other platforms and it is consistent with those indicators.
This indicator also allows users to switch to alternative timeframes for analysis and it includes labels for the MM lines. If you have any suggestions or comments, please leave them below.
Cheers!

Pivot Support and Resistance Finder [JV] V2Dear Traders,
This script is a follow-up to my previous Pivot Support and Resistance Finder.
After so many positive feedback, for which I thank you all, I started rebuilding it to implement some requested features.
The biggest change is that by default, the indicator now shows zones instead of lines.
Support Zone: from low to close
Resistance Zone: from close to high
I removed the 5 lines, instead showing the most recent levels and the forming (fast) levels.
However, if you change the occurrence in the options, you can still see previous levels:
0 = Current Level
1 = Previous Level
2 = Level before the Previous Level
...
More important configurable options:
Pivot Length
Pivot Quick Length (used to draw forming levels
Option to draw using bar closes, wicks or both (area)
Hide / Display to forming level
Show past levels.
I hope this is clear enough.
For any questions, remarks, suggestions, feel free to contact me.
Happy Trading!

Daya LilinI calculate the momentum of each candle and separate it by color with a different tone.
The darker the color, the stronger the candle. Easy to know fake breakout, strong breakout, and momentum of trend continuation.
also, there is a pivot point to easily determine the nearest support and resistance .
lastly, there is some rsi and shadow ratio to determine possible overbought and oversold entry.
p/s: donate sikit coin or bank in haha

Confluence of Indicators and Signals v1 skvWhy this script
This script will display the buy or sell signals received from indicators, super trend, adx, rsi, macd, sma, and floor pivots along with some tweaked calculations and fixed numbers. This is useful for beginners who want to study the signals and timing to practice. This script is created for educational purpose and can be used for intraday scalping with 5 minutes time frame only after the signals are understood clearly.
How to use
Strong Buy - when series of buy/long signals generated by indicators, bright green up arrow indicates momentum/strength
Strong Sell - when series of sell/short signals generated by indicators, bright orange down arrow indicates momentum/strength
Exits - use the pivot lines, or the RSI-LX, SX exit signals. Also combine with Bollinger Bands to understand the exit points.
Look for reversals at pivot resistance and support.
Disclaimer
1. Only for educational purpose
2. Intraday scalping strategies only and on 5 min timeframe
3. Do paper trade before using any information for actual trading
4. Not swing or positional trade

Pivots High Low (HH/HL/LH/LL)/Trend [Anan] Hello Friends,,
This is pivot points high low with pivot trend to define the trend direction.
Pivot trend is the pivot points average.
Options:
- Pivot Point Period
- Show/hide Pivot Points Labels
- Show/hide Bull/Bear Labels ( depends on pivot trend)
- Show/hide Pivot Center Line (Bull>Center, Bear

Borjas Tarh Horizontals S/RBorjas Tarh Horizontals
Automatically Plot Horizontals Support and Resistance.
In the Setting, you should optimize the values according to each time frame of the ticker.
Pivot Length : Number of bars to use to calculate pivot
Max Breaks : Maximum number of times a line can be broken before it's invalidated
Max Distance % : Maximum distance PA can move away from line before it's invalidated
Frontrun/Overshoot Threshold % : If PA reverses within this distance of an existing S&R line, consider it a Frontrun / Overshoot
You can copy it and make it better.
Pivot Support and Resistance Finder [JV] V1Hi Traders.
This is my first attempt of writing an indicator.
Let me start by saying I could never have done this without lmatl and WMX_Q_System_Trading who were and are an incredible source of inspiration.
This indicator shows horizontal Pivot Support and Resistance . It draws up to 4 horizontal lines extending to the right from and adds labels to High and Low Pivot Candles . It also draws the Support / Resistance that is currently forming.
You can select the number of lines on the current timeframe.
There are some options in Settings:
Current timeframe pivot settings
Show and hide levels of the current timeframe
Change colors
Extend Lines
Any suggestions are more than welcome!
I also welcome donations, no matter how small ;-)
Pivot STRTGY_V1This Strategy operates on a Daily Time Frame and decisions are made based on monthly Pivot Points.
Choosing different time frames and pivot periods influences trading decisions and is not recommended
The script contains the following calculations:
-Pivot Points,
-Short and long term moving averages (sma, ema, getting),
-Bollinger bands,
-Trend following
The strategy aims to keep the asset profitable for as long as possible by predicting the turning points of the price.
Therefore, it is not suitable for day-trade.
Average holding period of assets is 15-20 days.
The script makes decisions to buy or sell when the price is above or below the determined averages and pivot points.
In this way, it follows the trend and aims for maximum profit.
It continuously makes calculations for the distortion conditions of the trend and generates orders to exit the position when the necessary conditions are met to stop the loss.

BANKNIFTY - Anchored VWAP
An attempt to make Anchored VWAP for NSE:BANKNIFTY from Volume of underlying securities.
Notes :
- To cross check one may verify by changing Symbol to any stock and use in-built VWAP indicator
- Works only with BANKNIFTY and stocks. Does not work with other NSE Indices

Darkpool FinderThis script is designed to located darkpool prints on SPY.
If you do not know what a darkpool is, please research into it.
Essentially, darkpools print at 8 am EST premarket almost everyday. When price hits these pockets, it is usually quite reactive to it since there are a large number of orders in that pocket.
When the script finds a darkpool print, it will plot the line until price hits the pocket, once the pocket is hit, the orders are filled entirely, hence the line will stop plotting. These pockets are only filled in the New York Cash session, if it isn't hit the day its printed, it remains open until it is filled.
For this script to work correctly, the user must have the Arca data exchange paid for since this is the only data that will show the wick prints during the premarket.
Once the correct data is enabled, use the 1-5 minute candles for the plots to render correctly, you may have to use each one for best results.
Even though this script was made for SPY, it works on any ticker because any equity ticker has darkpool prints.
So if you want to use the script on other tickers besides SPY, you must purchase the according exchange data or the script will not work!
If you are in a different time-zone other than EST, you must configure the inputs in the script to match the 8 AM EST time for the script to print properly.
Darkpools are not an end all be all play, sometimes its a coinflip, its just another tool in you toolbox to help determine your move in the market.

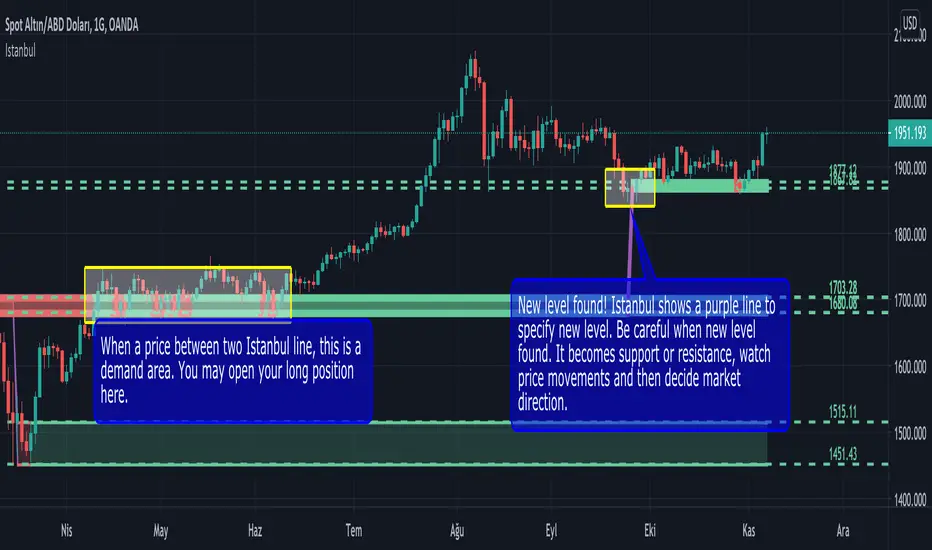
Istanbul by MMEN
I'm proud of to introducing Istanbul indicator. Istanbul is a smart support/resistance indicator based on price action. It analyzes price with different lengths and decide where is the high volume and reversal pattern.
There are 5 different lengths. They are 20, 100, 200, 500 and 1000. Each levels specified by different tickness. 20 is the thinnest and 1000 is the thickest. You can easily track levels by thickness. 20 has the lowest and 1000 has the highest impact on price movement.
There is an other field named as Precision. If you want to see more levels on the assets, please increase precision value. Otherwise decrease. For example, If you want to see more strong levels, you can set precision to 2. Otherwise set precision to 10. Default is 5.
Istanbul is also uses volume as a decision point. So you can adjust Volume Multiplier as you wish. Default is 1.5.
Lines have 3 different colors.
Green: It's support. Price above this level.
Red: It's resistance. Price below this level.
Purple: It's indecision. Waiting for confirmation.
Istanbul shows important levels as a channel. If prices moves between two lines, this channel is the starting point for new trend. It may be long or short. Watch prices and make your decision.
TR
Istanbul indikatörünü sizlere tanıtmaktan gurur duyuyorum. Istanbul, price action felsefesine göre destek ve direnç noktalarını belirleyen akıllı bir indikatördür. Fiyat hareketlerini farklı uzunluklarda geriye giderek inceler ve yüksek hacimli dönüş formasyonları gördüğü zaman destek ve direnç noktalarını çizer.
5 farklı seviye vardır. Bu seviyeler zayıftan güçlüye doğru 20, 100, 200, 500, 1000'dir. Her seviye gücüne göre farklı kalınlıkta çizilmiştir. 20 en ince, 1000 ise en kalın çizgidir. Grafiğe bakarken kolayca kalınlıklarına ve inceliklerine göre destek/direnç noktalarının gücünü anlayabilirsiniz.
Precision değişkeni ise Istanbul'un hassasiyetini ayarlar. Bu yüzdesel bir değişkendir. Varsayılan olarak %5 ayarlanmıştır. Eğer daha keskin ve net destek/direnç noktaları görmek isterseniz bu yüzdeyi düşürmeniz gerekir. Örneğin 2 yapabilirsiniz. Eğer daha çok destek/direnç noktası görmek isterseniz bu değeri 10 olarak ayarlayabilirsiniz.
Istanbul'un karar mekanizması içinde hacim de etkin bir rol alıyor. Volume Multiplier seçeneğeni isteğinize göre değiştirebilirsiniz. Bu değerin 1'den küçük olmaması gerekir.
Çizgilerin 3 farklı rengi vardır.
Yeşil: Destek noktası. Fiyat bu seviyenin üzerinde.
Kırmızı: Direnç noktası. Fiyat bu seviyenin altında.
Mor: Kararsızlık. Indikatör onay bekliyor.
Istanbul önemli seviyeleri bir kanal olarak gösterir. Eğer fiyat kanal içinde hareket ediyorsa, bu kanal yeni trendin başlayacağı seviyelerdir. Bu trend yükseliş ya da düşüş trendi olabilir. Fiyat hareketlerine bakarak long ya da short pozisyon açabilirsiniz.
EXAMPLES || ÖRNEKLER
AAPL
GBPUSD
ATOMBTC
XU100
Kviateq - Session PivotsFirst of all, I must say that this script wouldn't be possible without the help of one of the best script developers on TradingView - @ahancock (thanks a bunch for your help)
This script draws opening ranges for each of the sessions - Tokyo, London and New York and plots session high, low and pivot range of the previous session.
So if you trade London session - you would only take longs if we're above the Tokyo pivot range and vice versa for shorts.
Often times previous session's highs act as resistance and lows act as support, so careful trading around those levels.
It is obviously meant for lower timeframes, since each of the sessions only lasts a few hours.
Default settings are set to the exchange that I use and my timezone (GMT +7), so you might need to adjust the settings accordingly.
Tokyo - 12am GMT
London - 7am GMT
New York - 12pm GMT

Algonize Pivot Strategy (APS)This study is based on several Price Action parameters of :-
• Pivot Points,
• Higher High and Lower Lows,
• High Low Index ,
• Support and Resistance.
► How To Use This Strategy?
This is a pure scalping strategy and it is advised to use this only with algo trading systems. Due to high trade frequency.
► This Strategy has inbuilt custom time frame backtester, which enables you to test for performance between any date or check for a single day.
► To Create Alerts for algo trading in this strategy simply Check "Activate Algo" from Settings then Create new alert , select your strategy in condition box, and now scroll down to message box and write
{{strategy.order.comment}}
That's it , Just Click on Create Alert Button
Backtest Values Used:-
Initial Capital : 1000000
Order Size (Lots) : 1 (Contract) Lots
Pyramiding : 0 orders
Commission : 0.003%
Sharpe Ratio : 1.741
Profit Factor : 1.174
Test Yourself and give feedback.
PM us to obtain access.

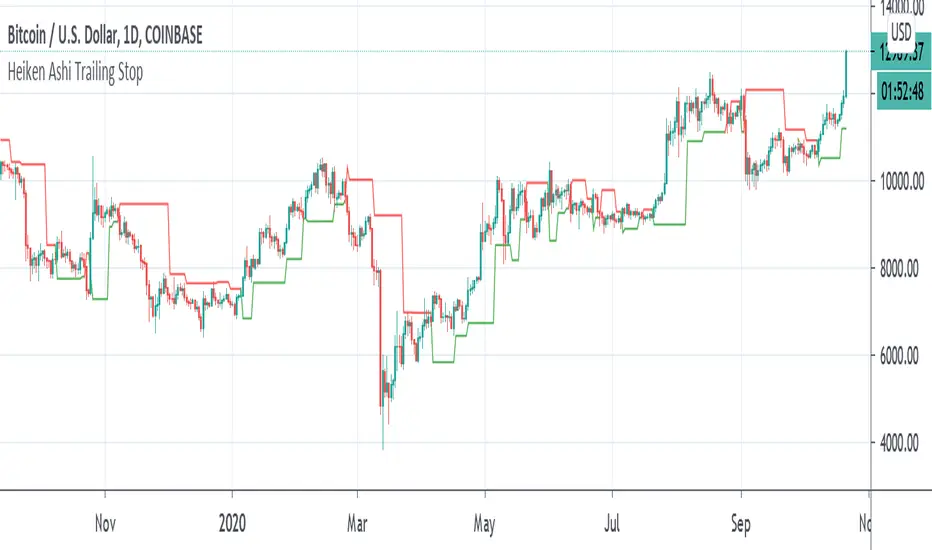
Heiken Ashi Pivot Breakout Trailing StopThis is a heiken ashi pivot based trailing stop for breakout entries and exits. It's possibly related to the Swing Index System by Welles Wilder or an alternative to it that I came up with, in case determining the swings on the Accumulative Swing Index is too much of a burden. It is believed that the ASI uses the calculation of heiken ashi in its formula. This does not use the ASI as a bottom indicator in the chart but instead uses the heiken ashi bars on the top of the chart to objectively find the swing pivots . These swings pivots act as support and resistance and can be used to confirm the start of a breakout or the end of one.
Suppose you find a chart pattern or setup, such as divergence or a pennant in the RSI , a pattern on the ASI, and/or on the chart, or the end of an elliot wave , etc and want to confirm a strong breakout and ride it to the end. Many trailing stops won't be able to confirm the beginning or would last too long or not long enough to exit out of one. On an uptrend, when the price breaks below the last swing low pivot , it can confirm the end of the breakout. On a downtrend, when the price breaks above the last swing high pivot , it can confirm the end of the breakout.
This trailing stop is not meant to replace trend following ones. The swing pivots can vary yet the price can still continue at an uptrend whereas this heiken ashi pivot based trailing stop exits as soon as it goes above or below the last resistance point. These swing points can end up being too close for trend following but can work well for breakout trading. The bigger the chart pattern or breakout, the more reliable the exit signal will be in my opinion. This is an experimental idea that I came up with from trying to interpret the ASI.
Market ProfileHello All,
This is Market Profile script. "Market Profile is an intra-day charting technique (price vertical, time/activity horizontal) devised by J. Peter Steidlmayer. Steidlmayer was seeking a way to determine and to evaluate market value as it developed in the day time frame. The concept was to display price on a vertical axis against time on the horizontal, and the ensuing graphic generally is a bell shape--fatter at the middle prices, with activity trailing off and volume diminished at the extreme higher and lower prices." You better search it on the net for more information, you can find a lot of articles and books about the Market Profile.
You have option to see Value Area, All Channels or only POC line, you can set the colors as you wish.
Also you can choose the Higher Time Frame from the list or the script can choose the HTF for you automatically.
Enjoy!
