Quarterly H/L [Dango]Introducing the Quarterly High and Low Indicator, a powerful and original tool designed to enhance your understanding of price action by identifying key turning points within quarterly cycles. This innovative script accurately determines the most significant highs and lows in each quarter, providing valuable insights for traders.
Key Features:
- Identifies and displays quarterly highs and lows on 90-minute, daily, weekly, monthly, and yearly timeframes
- Employs advanced algorithms and a deep understanding of cycle theory to precisely pinpoint key turning points
- Accounts for subtle nuances in price action and market dynamics
- Intended to be used in conjunction with the Quarterly Cycles Indicator for further confluence
How It Works:
The Quarterly High and Low Indicator utilizes a proprietary algorithm to meticulously analyze price action within each quarter. This advanced formula takes into account multiple factors, such as price momentum, volatility, and volume, to accurately identify the most significant high and low points.
The script employs a multi-step process to determine the quarterly highs and lows:
1. Cycle Isolation: The indicator first isolates the price action within each quarter, focusing on the specific time frame being analyzed (90-minute, daily, weekly, monthly, or yearly).
2. Momentum Analysis: The script then analyzes the price momentum within each quarter, identifying periods of strong bullish or bearish sentiment. This helps to narrow down potential high and low points.
3. Volatility and Volume Confirmation: To further refine the identification of key turning points, the indicator assesses the volatility and volume characteristics surrounding potential highs and lows. Significant changes in volatility and volume often accompany important price reversals.
4. Proprietary Scoring System: The algorithm assigns scores to each potential high and low point based on a proprietary scoring system. This system takes into account the confluence of momentum, volatility, and volume factors to determine the most significant turning points within each quarter.
The Quarterly High and Low Indicator visually represents these key turning points on the chart, enabling traders to easily identify potential support and resistance levels, trend reversals, and optimal entry and exit points. By focusing on the most significant price levels within each quarter, the indicator helps traders cut through the noise and make more informed trading decisions.
Expected Usage:
The Quarterly High and Low Indicator is designed to be a valuable tool for traders seeking to gain a deeper understanding of price action and market dynamics. By mapping out the most significant high and low points within each quarter, the indicator provides users with key levels to watch for potential trend reversals, support, and resistance.
1. Identifying Pivots and Reversals: The quarterly highs and lows identified by the indicator serve as critical levels where price is more likely to pivot or reverse. Traders can use these levels to anticipate potential trend changes and adjust their trading strategies accordingly.
2. Backtesting and Historical Analysis: The indicator enables traders to analyze historical price action and assess how the market has reacted to quarterly high and low levels in the past. By backtesting their strategies using these key levels, traders can gain valuable insights into the effectiveness of their approach and make data-driven refinements.
3. Support and Resistance: Quarterly highs and lows often act as significant support and resistance levels. Traders can use the indicator to identify these key areas and plan their trades around them. For example, if price approaches a quarterly high, traders may watch for potential selling pressure and consider taking profits or initiating short positions.
4. Confirmation and Confluence: The Quarterly High and Low Indicator can be used in conjunction with other technical analysis tools to confirm trade setups and increase confidence in trading decisions. When multiple indicators or analysis techniques align with the quarterly highs and lows, it provides a stronger signal for potential trade entry or exit points.
5. Risk Management: By understanding the location of quarterly highs and lows, traders can make more informed decisions about stop-loss placement and position sizing. Setting stop-losses beyond these key levels can help mitigate the risk of getting stopped out prematurely due to short-term price fluctuations.
6. Combining with the Quarterly Cycles Indicator: The Quarterly High and Low Indicator is intended to be used alongside the Quarterly Cycles Indicator for further confluence and validation. By analyzing the relationship between the identified quarterly highs and lows and the underlying quarterly cycles, traders can gain a more comprehensive understanding of market dynamics and potential turning points. When the quarterly highs and lows align with the key phases of the quarterly cycles, it provides a stronger signal for potential trend changes and trading opportunities.
Incorporating the Quarterly High and Low Indicator into a trading strategy, along with the Quarterly Cycles Indicator, allows traders to develop a more comprehensive understanding of price action and make better-informed decisions. By backtesting and analyzing how price reacts around these key levels and cycles, traders can refine their approach and potentially improve their trading outcomes.
Limitations and Disclaimer:
While the Quarterly High and Low Indicator is a powerful tool, it should not be used in isolation. Traders should combine the insights gained from this indicator with other forms of analysis, such as the Quarterly Cycles Indicator, fundamental analysis, risk management, and sound trading psychology, to develop a well-rounded and effective trading approach.
Please note that the indicator's accuracy may be impacted by extreme market volatility or unusual events, and quarterly highs and lows should not be relied upon in isolation. As with any trading tool, individual results may vary, and past performance does not guarantee future outcomes. Traders should always exercise caution, use appropriate risk management techniques, and continuously educate themselves to adapt to changing market conditions.
This indicator is provided for educational purposes only and should not be considered financial advice. Always conduct your own due diligence and consult with a financial professional before making any trading decisions.
Privacy of Code:
The underlying logic and specific calculations used in the proprietary algorithm are not disclosed to protect the intellectual property of the script. The advanced formula and scoring system used to identify quarterly highs and lows are the result of extensive research, testing, and refinement. By keeping these details confidential, the script maintains its competitive edge and ensures the protection of its intellectual property.
Titik Pivot

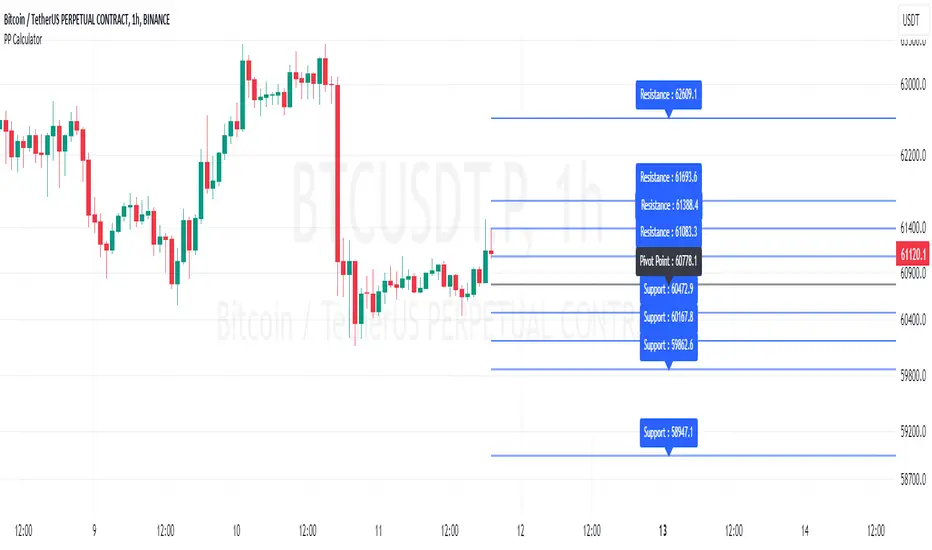
Pivot Point Calculator [JP&Dia]English User Guide
Script Name: Pivot Point Calculator
What Does This Script Do? This script calculates classic and Camarilla pivot points used in financial markets. Pivot points are used to identify key support and resistance levels, and this script helps traders better understand market movements.
How to Use It?
Add the script to your charts on TradingView.
Enter your desired time frame in the “Enter Time Frame” field (e.g., M, W, D).
Choose either or both “Classic Pivot” and “Camarilla Pivot” options to display them.
The script will automatically calculate the pivot points and display them on the chart.
Why Is This Script Unique? This script combines both classic and Camarilla pivot calculations, allowing users to easily utilize both pivot styles through a single script.
How Can People Benefit? Traders can use this script to identify potential buy-sell points and market trends. They can also conduct their market analyses more efficiently and effectively.
Script Adı: Pivot Noktası Hesaplayıcı
Script Ne İşe Yarar? Bu script, finansal piyasalarda kullanılan klasik ve Camarilla pivot noktalarını hesaplar. Pivot noktaları, önemli destek ve direnç seviyelerini belirlemek için kullanılır ve bu script, yatırımcıların piyasa hareketlerini daha iyi anlamalarına yardımcı olur.
Nasıl Kullanılır?
Scripti TradingView’deki grafiklerinize ekleyin.
“Zaman Dilimi Girin” alanına istediğiniz zaman dilimini girin (Örneğin: M, W, D).
“Classic Pivot” ve “Camarilla Pivot” seçeneklerinden birini veya her ikisini de seçerek gösterilmesini sağlayabilirsiniz.
Script otomatik olarak pivot noktalarını hesaplayacak ve grafik üzerinde gösterecektir.
Neden Özgü Bir Script? Bu script, hem klasik hem de Camarilla pivot hesaplamalarını birleştirir ve kullanıcıların her iki pivot stilini de tek bir script üzerinden kolayca kullanmalarını sağlar.
İnsanlar Nasıl Faydalanabilir? Yatırımcılar, bu scripti kullanarak potansiyel alım-satım noktalarını ve piyasa trendlerini belirleyebilirler. Ayrıca, piyasa analizlerini daha verimli ve etkili bir şekilde yapabilirler.
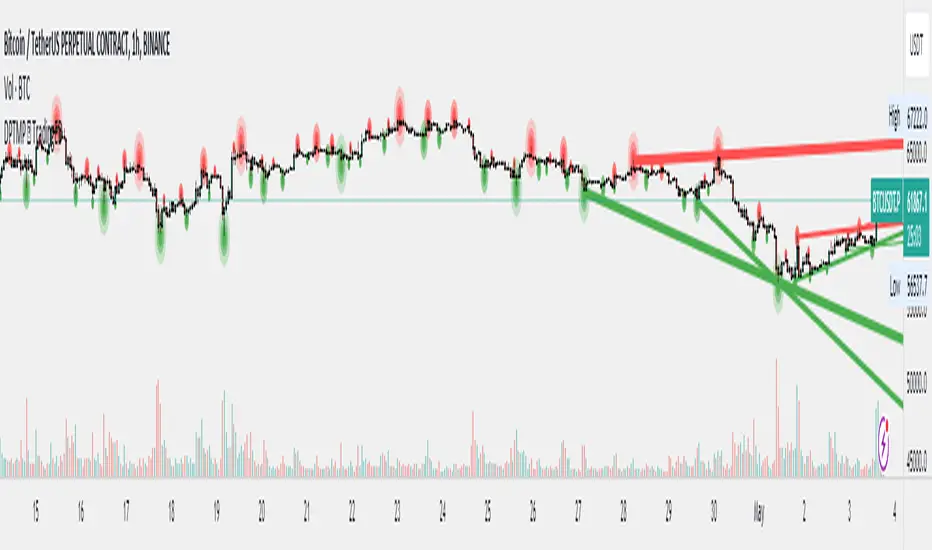
Liquidations [ChartPrime]Liquidations Indicator:
The Liquidations indicator is a powerful tool designed to help traders identify significant liquidation levels in financial markets. By analyzing volume data over a specified lookback period, the indicator highlights potential areas where market participants with high leverage positions may face liquidation, providing valuable insights into market dynamics.
Usage:
Traders can use the Liquidations indicator to:
◈ Identify liquidity grab opportunities: Liquidation levels often attract price action as market participants with leveraged positions face the risk of forced liquidation. Traders can anticipate price movements as the market aims to trigger these stops, potentially leading to rapid price movements or reversals.
◈ Confirm trend strength: A cluster of liquidation levels in the same direction as the prevailing trend may confirm the strength of the trend, while divergences between liquidation levels and price movements may signal potential trend reversals.
Settings:
◈ Previous Value Bars Back: Specifies the number of previous bars used in calculating the liquidation levels.
◈ Show Leverage: Allows users to selectively display liquidation levels for different leverage multiples, including 5x, 10x, 25x, 50x, and 100x.
◈ Liquidation Levels Width: Sets the width of the lines representing liquidation levels on the chart.
◈ Short Liquidations Color: Specifies the color of the lines representing short liquidation levels.
◈ Long Liquidations Color: Specifies the color of the lines representing long liquidation levels.
◈ Bar Color: Sets the color of the background bar when the indicator is active.
Visual Representation:
◈ Liquidation levels are plotted as horizontal lines on the chart, with different colors representing short and long liquidation levels.
◈ Each liquidation level is labeled with the corresponding leverage multiple (e.g., 5x, 10x, etc.).
A dashboard displays the active liquidation levels for each leverage multiple, allowing traders to quickly assess the current market conditions.
◈ Time Window allows users to cut off unnecessary part of the chart and concentrate on a current active part of the chart to make better trading decisions:
Interpretation:
Market participants tend to place stop-loss orders near liquidation levels , creating clusters of pending orders. As price approaches these levels, it may trigger a cascade of stop-loss orders, providing liquidity for market orders and potentially leading to rapid price movements in the opposite direction.
Traders can anticipate price reversals or accelerations as price interacts with liquidation levels, using them as reference points for identifying potential entry or exit opportunities.
Note:
While the Liquidations indicator provides valuable insights into market dynamics, traders should use it in conjunction with other technical analysis tools and risk management strategies to make informed trading decisions.

Dynamic Pivot Tracker Multi-Period - TradingEDThe "Dynamic Pivot Tracker Multi-Period" is an advanced tool designed for traders who require a detailed, multi-layered view of pivot levels across multiple time frames from a single chart. This indicator uses dynamic calculations to identify and connect high and low pivot points, aiding traders in pinpointing potential support and resistance areas and making informed decisions based on significant market structural changes.
Key Features:
Flexibility of Periods: Users can define pivot lengths for up to four different periods, ranging from as short as minutes to as long as days, allowing complete customization based on the trader's needs.
Dynamic Pivot Length Calculation: Utilizes a specialized function to adjust pivot length based on the selected time unit, ensuring pivot detection is relevant to the current time context.
Pivot Point Detection: Calculates and plots high and low pivots for each defined period using the pivothigh and pivotlow function for optimum accuracy.
Dynamic Line Management: The indicator dynamically manages the lines connecting pivots, removing old ones before plotting new to keep the chart clean and up-to-date.
Crossover Alerts: Set up automatic alerts to notify users when the price crosses above or below a pivot level, which may be indicative of an entry or exit opportunity.
Customizable Display Options:
Show Fractals: Option to visualize or hide fractals, which can indicate price reversal points.
Show Lines: Toggle the display of lines connecting the pivots, making it easier to visualize trends and ranges.
Show Pivots: Allows users to choose whether or not to see pivot points marked directly on the chart.
Practical Applications:
Trend Analysis: By observing how the price interacts with pivots across different periods, traders can gain a deeper understanding of market direction.
Support and Resistance Identification: Pivot levels can act as zones of support or resistance, providing key points for stop placement or profit taking.
Optimization of Entries/Exits: Crossover alerts provide timely signals to enter or exit positions based on significant price movements.
This indicator is ideal for day traders, swing traders, and technical traders looking to integrate pivot analysis into their trading methodology, offering a robust and customizable tool to enhance market decision-making.
[Support and Resistance with Trend Lines] with Backtest (TSO) with Backtest (TSO)
===========================================================================
===========================================================================
This indicator serves as a comprehensive full-cycle trading system, providing alerts at each stage of the trade, from opening to closure. The algorithm uses most recent and historical S&R (Support and Resistance) levels with most recent and historical Trend Lines, generating signals for trades when Breaks/Bounces occur (Trade Open Signal triggers can be configured via very customizable indicator Input "Signal Trigger Matrix" settings). With signal for trade open, TP (Take Profit and SL (Stop Loss) levels are calculated as well and marked on the chart including alerts for each action of the trade. The indicator offers a variety of automated approaches for TP (Take-Profit) and SL (Stop-Loss) settings. These include static current/historical S&R (Support and Resistance) levels or S&R/Trend Lines dynamic breaks for TP (Take-Profit) and various SL (Stop-Loss) approaches, including ATR Trailing SL, opposite S&R (Support and Resistance) levels SL, opposite Trend Lines SL and more. This diverse set of tools ensure flexibility in tailoring TP (Take-Profit) and SL (Stop-Loss) parameters to different market conditions, contributing to a more adaptive and robust trading system. Additionally, a series of signal analysis tools, including market sentiment, candle bar analysis, divergence, and volume, enhance the precision of trading signals.
* Works with popular timeframes: 1M, 3M, 5M, 15M, 30M, 45M, 1H.
* Works well with Futures and Indices, can be used to trade Stocks, Crypto and FOREX.
* Includes LIVE alert/labels Breakouts and Bounces signal trigger feature, which can be used for scalping (NOTE: This approach cannot be backtested).
* Every action of the trade is calculated on a confirmed closed candle bar state (barstate.isconfirmed), so the indicator will never repaint.
==============================================================
Indicator examples:
---------------------------------------------------------------------------
Strategy Config: SRTL_MES_15M3Y_EODoff_ALL
Here is a nice example of MES (Micro E-Mini S&P 500 Index Futures) configuration, which uses S&R (Support and Resistance) breakouts as signal trigger with Elliot Wave confirmation and previous S&R historical levels for TP (Take-Profit).
---------------------------------------------------------------------------
An example of an intraday Tesla trade. Also the green arrows will be displayed IMMEDIATELY when Breakout/Reverse Bounce occurs (same an Alert will be triggered immediately).
===========================================================================
Trading open/close/TP/SL labels, plots and colors explanations:
---------------------------------------------------------------------------
>>> S&R (Support and Resistance) levels/lines: orange - support, blue - resistance (can be hidden).
>>> Trend Lines: yellow - support, green - resistance (can be hidden).
>>> Blue labels show resistance breakouts and bounces, light-blue - bullish, dark-blue - bearish
>>> Yellow labels show resistance breakouts and bounces, light-yellow - bullish, dark-yellow - bearish
>>> Green/Red arrows on top/bottom of candle bar will show LIVE breakouts (if turned on)
>>>>> LONG open: green "house" looking arrow below candle bar.
>>>>> SHORT open: red "house" looking arrow above candle bar.
>>>>> LONG/SHORT take-profit target: green/red circles (multi-profit > TP2/3/4/5 smaller circles).
>>>>> LONG/SHORT stop-loss target: green/red + crosses.
>>>>> LONG/SHORT take-profit hits: green/red diamonds.
>>>>> LONG/SHORT stop-loss hits: green/red X-crosses.
>>>>> LONG/SHORT EOD (End of Day | Intraday style) close (profitable trade): green/red squares.
>>>>> LONG/SHORT EOD (End of Day | Intraday style) close (loss trade): green/red PLUS(+)-crosses.
===========================================================================
STATS TABLE ///////////////////////////////////////////////////////////////
---------------------------------------------------------------------------
>>> Trading STATS table on the chart showing current trade direction, Last TP (Take-Profit) Taken, Current Trade PL (profit/loss in price difference from trade open to the very current state).
---------------------------------------------------------------------------
CUSTOM TRADING DATE RANGE /////////////////////////////////////////////////
---------------------------------------------------------------------------
>>>>> This feature can be used to manually set indicator trading range from and to a specific date and time. NOTE: This is not intended for a very long date range backtesting, utilize TradingView Strategy Tester for that.
* Use TradingView “Strategy Tester” to see Backtesting results
NOTE: If Strategy Tester does not show any results with Date Ranged fully unchecked, there may be an issue where a script opens a trade, but there is not enough TradingView power to set the Take-Profit and Stop-Loss and somehow an open trade gets stuck and never closes, so there are “no trades present”. In such case - manually check “Start”/“End” dates or use “Deep Backtesting” feature!
---------------------------------------------------------------------------
INTRADAY ACTIVE TRADING SESSION CONFIGURATION /////////////////////////////
---------------------------------------------------------------------------
>>> Regional Active Trading Session Hours Schedule: If selected - trades will only open during regional active trading session, if 'OFF', there will be no trading schedule and trades will open 24/7.
>>> EOD(End of Day) Close - On/Off: Close the trade if it's still open at the end of active trading session (on the very last candle bar). NOTE: If no region is selected at 'Regional Active Trading Session Schedule' - there will be no EOD(End of Day) Close and trades will run overnight until either SL(Stop-Loss) or TP(Take-Profit) is hit!
>>>>> EOD(End of Day) Close - 1 candle bar before last: This is specifically for stocks as while usually indices can be closed 15minutes after the market closes, for stocks - the last candle bar closes at the same time with the market active trading session, which if closed - trades can't be closed until next day/session! Enable this setting for the trade to close/alert 1 candle bar before the last one, so there is still time to close the trade at the Broker (NOTE: depending on the timeframe, 1 candle bar can be: 15sec, 30sec, 1min, 3min, 5min, 15min, 30min, 45min, 1h).
---------------------------------------------------------------------------
SIGNAL TRIGGER MATRIX ////////////////////////////////////////////////
---------------------------------------------------------------------------
>>> Trading Engine: This setting turns on TradingView Strategy trading engine for backtesting.
>>> Market Session Only: With this setting turned on, all signal trigger Breaks/Bounces will be hidden during Pre/Post market time.
>>> Plot S&R Levels/Lines: Plot S&R (Support and Resistance) on chart. Note: historical levels/lines will only be plotted if hit (Break/Bounce).
>>> Plot Trend Lines Levels/Lines: Plot Trend Lines levels/lines on chart. Note: historical levels/lines will only be plotted if hit (Break/Bounce).
>>> Use S&R Current Levels | Use S&R Historical Levels | Use Trend Lines Current Levels | Use Trend Lines Historical Levels |: Choose which levels should be used for Breaks/Bounces to be captured on. If all triggers are turned on/checked - whatever happens 1st wins the trigger.
>>> Breaks | Bounces: 'Breaks': Turn on Breaks through levels/lines signal trigger. | 'Bounces': Turn on Bounces off levels/lines signal trigger.
>>> Signal: Regular | Signal: S&R Combo | Signal: TL Combo | Signal: S&R + TL Combo | Signal: Repeat Action |: Trade open signal trigger execution approach MATRIX (If 1 or more turned on at the same time - whatever comes first will be the trade signal trigger). 'Regular': A single Break/Bounce must occur on a closed bar for signal trigger. 'S&R Combo': A combination of 2 Current + Historical S&R (Support and Resistance) Break/Bounce must happen in the same direction on same bar for signal trigger. 'TL Combo': A combination of 2 Current + Historical Trend Lines Break/Bounce must happen in the same direction on same bar for signal trigger. 'S&R + TL Combo': a combination of ANY S&R and Trend Line Break/Bounce must happen in the same direction on same bar for signal trigger. 'Repeat Action': Initial and then confirmation (2nd/3rd/etc. consecutive occurence) Break/Bounce must occur on same level/line for signal trigger.
>>> Historical - Look Back (# of days): How far back (in # of days) will historical S&R/Trend Lines will be used for Trade Open signals/TP/SL/etc.
>>> Historical - Look Back Invalidation (# of days): IF THERE IS TOO MUCH HISTORICAL LEVELS/LINES ON CHART - LOWER THIS SETTING + MAKE SURE IT'S SMALLER THAN 'Historical - Look Back (# of days)'. With big Look back period (5+ days) - it can become very messy with too many historical levels/lines. To clear oldest historical levels/lines - set Look Back Invalidation # of days to less than Historical Look Back # of days. (After X # of Look Back Invalidation days - older levels/lines will become invalidated and no longer used for opening trades/TP (Take-Profit)/SL (Stop-Loss), while newer levels/lines will still be discovered.
>>> S&R/Trend Lines - Support/Resistance combined into 1 entity: Every level or a line becomes simply a level or a line, regardless if it originally was a support or resistance. By default, depending on the level/line originally being support or resistance - the signal direction will be such as: Resistance is broken > LONG / bounced > SHORT; Support is broken > SHORT / bounced > LONG; with this setting on, either level or line can be both broken or bounced off in ANY direction, trade open direction will depend on current market sentiment only.
---------------------------------------------------------------------------
S&R CONFIGURATION ////////////////////////////////////////////////
---------------------------------------------------------------------------
>>> S&R Search - Left Bars (current): This setting is for calculating optimal S&R (Support and Resistance) levels (in combination with below - Right Bars).
>>> S&R Search - Right Bars (current): This setting is for calculating optimal S&R (Support and Resistance) levels (in combination with above - Left Bars).
>>> S&R Search - Custom Resolution (current): This is a custom timeframe setting specifically for S&R Search, it disregards current chart timeframe. This is great to use for scalping, for example: with main chart set to 1min and the custom timeframe set to 3min or 5min - there will be stronger support/resistance levels with more detailed price action.
>>> S&R Search - Left Bars (historical): This setting is for calculating optimal S&R (Support and Resistance) levels (in combination with below - Right Bars).
>>> S&R Search - Right Bars (historical): This setting is for calculating optimal S&R (Support and Resistance) levels (in combination with above - Left Bars).
>>> S&R Search - Custom Resolution (historical): This is a custom timeframe setting specifically for S&R Search, it disregards current chart timeframe. This is great to use for scalping, for example: with main chart set to 1min and the custom timeframe set to 3min or 5min - there will be stronger support/resistance levels with more detailed price action.
>>> S&R - Historical S&R Levels - Extend to the right: Extend all S&R lines to the right.
>>> S&R (Current/Historical) - Live Breakout/Bounce - ALERT/SHOW: NOTE: Alert wlil trigger immediately at price Breaking thru or Bouncing off level/line and an arrow above /below the bar will show the direction of breakout/bounce. If on that same live bar - price comes back causing the Breakout/Bounce become no longer valid - the arrow will disappear as the condition of the Break/Bounce will no longer be valid.
---------------------------------------------------------------------------
TREND LINES CONFIGURATION ////////////////////////////////////////////////
---------------------------------------------------------------------------
>>> Show: Trend Line development (where it 'did not exist' yet): It takes 2 pivots to develop a trend line, pivot is established at least 3 candle bars later from where the pivot is. With this setting turned on - it will plot dashed lines where trend lines originated connecting the 1st and 2nd pivot point up to where the trend line became established (where in reality you would now be able to draw a certain trend line). Established already generated trend line are plotted with a solid line.
>>> Trend Lines - Line Slope Confirmation: LONG breakout will only be shown if trend line is goind downslope \. SHORT breakout will only be shown if trend line is goind upslope /.
>>> Trend Lines - Search - Left Bars (current): This setting is for calculating optimal Trend Lines.
>>> Trend Lines - Search - Right Bars (current): This setting is for calculating optimal Trend Lines.
>>> Trend Lines - Custom Resolution (current): This is a custom timeframe setting specifically for S&R Search, it disregards current chart timeframe. This is great to use for scalping, for example: with main chart set to 1min and the custom timeframe set to 3min or 5min - there will be stronger support/resistance levels with more detailed price action.
>>> Trend Lines - Search - Left Bars (historical): This setting is for calculating optimal Trend Lines.
>>> Trend Lines - Search - Right Bars (historical): This setting is for calculating optimal Trend Lines.
>>> Trend Lines - Custom Resolution (historical): This is a custom timeframe setting specifically for S&R Search, it disregards current chart timeframe. This is great to use for scalping, for example: with main chart set to 1min and the custom timeframe set to 3min or 5min - there will be stronger support/resistance levels with more detailed price action.
>>> Trend Lines - Historical Trend Lines - Extend to the right: Extend all Trend Lines to the right.
>>> Trend Lines (Current/Historical) - Live Breakout/Bounce - ALERT/SHOW: NOTE: Alert will trigger immediately at price Breaking thru or Bouncing off level/line and an arrow above /below the bar will show the direction of breakout/bounce. If on that same live bar - price comes back causing the Breakout/Bounce become no longer valid - the arrow will disappear as the condition of the Break/Bounce will no longer be valid.
---------------------------------------------------------------------------
TAKE-PROFIT/STOP-LOSS CONFIGURATION ///////////////////////////////////////
---------------------------------------------------------------------------
>>> TP (Take-Profit) System: 'S&R Static Current/Historical': TP (Take-Profit) is calculated using current/historical S&R (Support & Resistance) levels at trade open and remains static. 'S&R/Trend Lines Dynamic Breaks': TP (Take-Profit) is fully dynamic and will be trigger at price above trade open price and with Breakout occurence (S&R or Trend Line current/historical breakout).
>>> TP (Take-Profit) # of targets: It is wise to divide the trade into several profit targets. With this setting - up to 5 TP (Take-Profit) targets can be approached. The trade will be equally divided up by the selected # of TP (Take-Profit) targets.
>>> SL (Stop-Loss) System: 'ATR-Trailing-SL': SL (Stop-Loss) is trail-following the ATR (Average True Range) line, NOTE: If at signal trigger, ATR will be against the trade direction - trade open signal will be skipped; 'S&R-Static-SL': SL (Stop-Loss) is set at trade open per optimal most recent S&R level and remains there until trade closes; 'TrendLines-Static-SL': SL (Stop-Loss) is set at trade open per optimal most recent trend line and remains there until trade closes; 'TrendLines-Dynamic-SL': SL (Stop-Loss) will be set per current opposite trend line and follow it until trade is open.; 'Oppos-Sig-Trd-in-Loss': SL (Stop-Loss) will trigger at opposite signal with trade currently at loss.
>>> SL (Stop-Loss) - On/Off: Without SL (Stop-Loss), unless EOD (End of Day) Close is turned on - there will be no SL (Stop-Loss) at all!
---------------------------------------------------------------------------
MARKET SENTIMENT CONFIRMATION ///////////////////////////////////////
---------------------------------------------------------------------------
>>> Market Sentiment: Signal is confirmed per Market Sentiment direction. If Market Sentiment is turned off - whatever signal comes 1st will be the trade open trigger.
---------------------------------------------------------------------------
SIGNAL ANALYSIS AND CLEANUP ///////////////////////////////////////////////
---------------------------------------------------------------------------
>>> Signal Cleanup - Bar Color: Include Bar Color (bullish/bearish) confirmation, LONG signal will only be opened if signal bar is green/bullish, SHORT if red/bearish.
>>> Signal Cleanup - Bar Directional Structure: Skip opposite bar structure types signals (For example: bearish green hammer).
>>> Signal Cleanup - Bar Doji Skip: Skip doji (indecisive) candles signals.
>>> Signal Cleanup - EWO (Elliott Wave Oscillator): Include EWO (Elliott Wave Oscillator), LONG will only be opened if EWO is bullish / SHORT if EWO is bearish.
>>> Signal Cleanup - VWAP (Volume-Weighted Average Price): Include VWAP (Volume-Weighted Average Price), LONG will only be opened if price is above VWAP / SHORT if price is below VWAP.
>>> Signal Cleanup - MA (Moving Average) Confirmation: Include MA (Moving Average), LONG will only be opened if MA is bullish / SHORT if MA is bearish.
>>> Signal Cleanup - ATR (Average True Range): Include ATR (Average True Range) confirmation, LONG will only be opened if ATR is bullish / SHORT if ATR is bearish.
>>> Signal Cleanup - Divergence(RSI + MACD): Include Divergence (RSI + MACD ) confirmation, LONG will only be opened if Divergence is bullish / SHORT if Divergence is bearish.
>>> Signal Cleanup - Volume % Strength: Include Volume strength/percentage confirmation, LONG/SHORT will only be opened with strong Volume matching the signal direction | By default, strong Volume percentage is set to 150% and weak to 50%.
>>> Signal Cleanup - Volume Above Average: Include Volume Above Moving Average (Volume closing bar closes above volume moving average) confirmation, LONG/SHORT will only be opened with Volume above average - Volume closed bar color must match the closed price color (bullish/bearish direction) + Volume bar must be closed above volume MA line).
---------------------------------------------------------------------------
===========================================================================
||||||||||||||||||||||||||||||||||| *** ||||||||||||||||||||||||||||||||||| *** |||||||||||||||||||||||||||||||||||
||||||||||||||||||||||||||||||||||| *** ||||||||||||||||||||||||||||||||||| *** |||||||||||||||||||||||||||||||||||
TP System - VERY IMPORTANT INFO!
-------------------------------------------------------------------------------------------------------------------
"TP PERCENTAGE" - amount by which current trade/position needs to be reduced/partially closed/sold.
-------------------------------------------------------------------------------------------------------------------
TP System: Dynamic
"TP PERCENTAGE" - will always be the same amount (trade/position size divided by the # of take-profit(TP) targets) and percentage to be closed will always be of the ORIGINAL trade/position.
-------------------------------------------------------------------------------------------------------------------
TP System: Static
"TP PERCENTAGE" - will always be the same amount IF take-profit(TP) targets are hit 1-by-1 (TP1 > TP2 > TP3 > TP4 > TP5), otherwise it will vary and unless it is a 1st take-profit(TP1), the REMAINING trade/position size will always be smaller than original and therefore the percentage to be closed will always be of the REMAINING trade/position and NOT the original one!
-------------------------------------------------------------------------------------------------------------------
"TP PERCENTAGE" CheatSheet (these are the only percentages you may see)
-----------------------------------------------------------------------
TP PERCENTAGE---Close/Sell Amount-------------Example (trade size: 50 stocks)
20%-------------trade size * 0.2--------------50 * 0.2 = 10 stocks
25%-------------trade size * 0.25-------------50 * 0.25 = 12.5(~13) stocks
34%-------------trade size * 0.34-------------50 * 0.34 = 17 stocks
40%-------------trade size * 0.4--------------50 * 0.4 = 20 stocks
50%-------------trade size * 0.5--------------50 * 0.5 = 25 stocks
60%-------------trade size * 0.6--------------50 * 0.6 = 30 stocks
66%-------------trade size * 0.66-------------50 * 0.66 = 33 stocks
75%-------------trade size * 0.75-------------50 * 0.75 = 37.5(~38) stocks
80%-------------trade size * 0.8--------------50 * 0.8 = 40 stocks
100%------------trade size--------------------50 = 50 stocks
-----------------------------------------------------------------------
If for any reason a portion of the current/remaining trade closed at such occurrence was slightly wrong, it is not an issue. Such occurrences are rare and with slight difference in partial TP closed is not significant to overall performance of our algorithms.
||||||||||||||||||||||||||||||||||| *** ||||||||||||||||||||||||||||||||||| *** |||||||||||||||||||||||||||||||||||
||||||||||||||||||||||||||||||||||| *** ||||||||||||||||||||||||||||||||||| *** |||||||||||||||||||||||||||||||||||
===========================================================================
Alert Settings (you don’t have to touch this section unless you will be using TradingView alerts through a Webhook to use with trading bot)
---------------------------------------------------------------------------
Here is how a LONG OPEN alert looks like.
NOTE: Each label , , etc. is customizable, you can change the text of it within indicator Input settings.
ALERT >>>>>>>>>>>>>>>>>>>>>>>>>>>>>>>>>>>>>>>>>>>>>>>
COIN: BTCUSD
TIMEFRAME: 15M
LONG: OPEN
ENTRY: 20000
TP1: 20500
TP2: 21000
TP3: 21500
TP4: 22500
TP5: 23500
SL: 19000
Leverage: 0
---------------------------------------------------------------------------
Here is how a TP1 alert will look with 5 TPs breakdown of the trade.
NOTE1: Next to TP1 taken it will show at which price it was triggered.
NOTE2: Next to "TP Percentage" it shows how much of the CURRENT/ACTIVE/REMAINING trade needs to be closed.
NOTE2: If TP2/3/4/5 comes before TP1 - the alert will tell you exactly how many percent of the trade needs to be closed!
ALERT >>>>>>>>>>>>>>>>>>>>>>>>>>>>>>>>>>>>>>>>>>>>>>>
COIN: BTCUSD
TIMEFRAME: 15M
LONG: TP1
TP1: 20500
TP Percentage: 20%
---------------------------------------------------------------------------
Here is how an alert will look for LONG - STOP-LOSS.
ALERT >>>>>>>>>>>>>>>>>>>>>>>>>>>>>>>>>>>>>>>>>>>>>>>
COIN: BTCUSD
TIMEFRAME: 15M
ENTRY: 20000
LONG: SL
SL: 19000
---------------------------------------------------------------------------
Here is how an alert will look for LONG - EOD (End of Day) In Profit close.
ALERT >>>>>>>>>>>>>>>>>>>>>>>>>>>>>>>>>>>>>>>>>>>>>>>
COIN: BTCUSD
TIMEFRAME: 15M
LONG: EOD-Close (profit)
ENTRY: 20000
EOD-Close: 21900
===========================================================================
Adding Alerts in TradngView
---------------------------------------------------------------------------
-Add indicator to chart and make sure the correct strategy is configured (check Backtesting results)
-Right-click anywhere on the TradingView chart
-Click on Add alert
-Condition: Select this indicator by it’s name
-Immediately below, change it to "alert() function calls only", as other wise there will be 2 alerts for every alert!
-Expiration: Open-ended (that may require higher tier TradingView account, otherwise the alert will need to be occasionally re-triggered)
-Alert name: Whatever you desire
-Hit “Create”
-Note: If you change ANY Settings within the indicator – you must DELETE the current alert and create a new one per steps above, otherwise it will continue triggering alerts per old Settings!
===========================================================================
Good Luck! (NOTE: Trading is very risky, past performance is not necessarily indicative of future results, so please trade responsibly!)
---------------------------------------------------------------------------
NOTE: There seems to be a strange glitch when strategy is running live, it will show "double-take" take-profits labels on the chart. This is not affecting the script logic and backtesting results, if you simply change the timeframe real quick to something else then back - it will no longer show the duplicate orders... this must be some sort of a glitch as every alert was thoroughly tested to make sure everything is working!

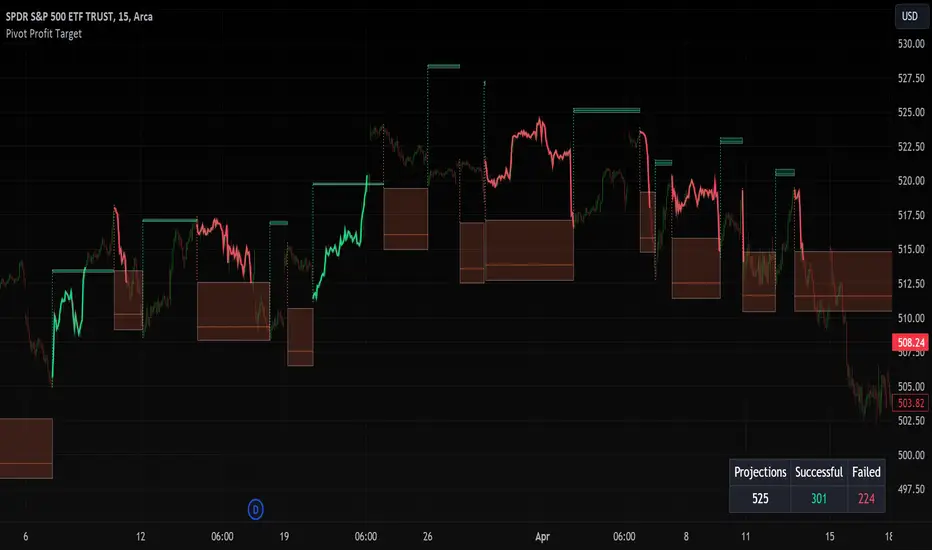
Pivot Profit Target [Mxwll]Introducing the Pivot Profit Target!
This script identifies recent pivot highs/lows and calculates the expected minimum distance for the next pivot, which acts as an approximate profit target.
The image above details the indicator's output.
The image above shows a table consisting of projection statistics.
How to use
The Pivot Profit Targets can be used to approximate a profit target for your trade.
Identify where your entry is relative to the most recent pivot, and assess whether the minimum expected distance for the most recent pivot has been exceeded. Treat the zones as an approximation.
If your trade aligns with the most recent pivot - treat the minimum expected distance zone as a potential profit target area. Of course, price might stop short or continue beyond the projection area!
That's it! Just a short and sweet script; thank you!
Volume Profile with Node Detection [LuxAlgo]The Volume Profile with Node Detection is a charting tool that allows visualizing the distribution of traded volume across specific price levels and highlights significant volume nodes or clusters of volume nodes that traders may find relevant in utilizing in their trading strategies.
🔶 USAGE
The volume profile component of the script serves as the foundation for node detection while encompassing all the essential features expected from a volume profile. See the sub-sections below for more detailed information about the indicator components and their usage.
🔹 Peak Volume Node Detection
A volume peak node is identified when the volume profile nodes for the N preceding and N succeeding nodes are lower than that of the evaluated one.
Displaying peak volume nodes along with their surrounding N nodes (Zones or Clusters) helps visualize the range, typically representing consolidation zones in the market. This feature enables traders to identify areas where trading activity has intensified, potentially signaling periods of price consolidation or indecision among market participants.
🔹 Trough Volume Node Detection
A volume trough node is identified when the volume profile nodes for the N preceding and N succeeding nodes are higher than that of the evaluated one.
🔹 Highest and Lowest Volume Nodes
Both the highest and lowest volume areas play significant roles in trading. The highest volume areas typically represent zones of strong price acceptance, where a significant amount of trading activity has occurred. On the other hand, the lowest volume areas signify price levels with minimal trading activity, often indicating zones of price rejection or areas where market participants have shown less interest.
🔹 Volume profile
Volume profile is calculated based on the volume of trades that occur at various price levels within a specified timeframe. It divides the price range into discrete price intervals, typically known as "price buckets" or "price bars," and then calculates the total volume of trades that occur at each price level within those intervals. This information is then presented graphically as a histogram or profile, where the height of each bar represents the volume of trades that occurred at that particular price level.
🔶 SETTINGS
🔹 Volume Nodes
Volume Peaks: Toggles the visibility of either the "Peaks" or "Clusters" on the chart, depending on the specified percentage for detection.
Node Detection Percent %: Specifies the percentage for the Volume Peaks calculation.
Volume Troughs: Toggles the visibility of either the "Troughs" or "Clusters" on the chart, depending on the specified percentage for detection.
Node Detection Percent %: Specifies the percentage for the Volume Troughs calculation.
Volume Node Threshold %: A threshold value specified as a percentage is utilized to detect peak/trough volume nodes. If a value is set, the detection will disregard volume node values lower than the specified threshold.
Highest Volume Nodes: Toggles the visibility of the highest nodes for the specified count.
Lowest Volume Nodes: Toggles the visibility of the lowest nodes for the specified count.
🔹 Volume Profile - Components
Volume Profile: Toggles the visibility of the volume profile with either classical display or gradient display.
Value Area Up / Down: Color customization option for the volume nodes within the value area of the profile.
Profile Up / Down Volume: Color customization option for the volume nodes outside of the value area of the profile.
Point of Control: Toggles the visibility of the point of control, allowing selection between "developing" or "regular" modes. Sets the color and width of the point of control line accordingly.
Value Area High (VAH): Toggles the visibility of the value area high level and allows customization of the line color.
Value Area Low (VAL): Toggles the visibility of the value area low level and allows customization of the line color.
Profile Price Labels: Toggles the visibility of the Profile Price Levels and allows customization of the text size of the levels.
🔹 Volume Profile - Display Settings
Profile Lookback Length: Specifies the length of the profile lookback period.
Value Area (%): Specifies the percentage for calculating the value area.
Profile Placement: Specify where to display the profile.
Profile Number of Rows: Specify the number of rows the profile will have.
Profile Width %: Adjusts the width of the rows in the profile relative to the profile range.
Profile Horizontal Offset: Adjusts the horizontal offset of the profile when it is selected to be displayed on the right side of the chart.
Value Area Background: Toggles the visibility of the value area background and allows customization of the fill color.
Profile Background: Toggles the visibility of the profile background and allows customization of the fill color.
🔶 RELATED SCRIPTS
Supply-Demand-Profiles
Liquidity-Sentiment-Profile
Thanks to our community for recommending this script. For more conceptual scripts and related content, we welcome you to explore by visiting >>> LuxAlgo-Scripts .

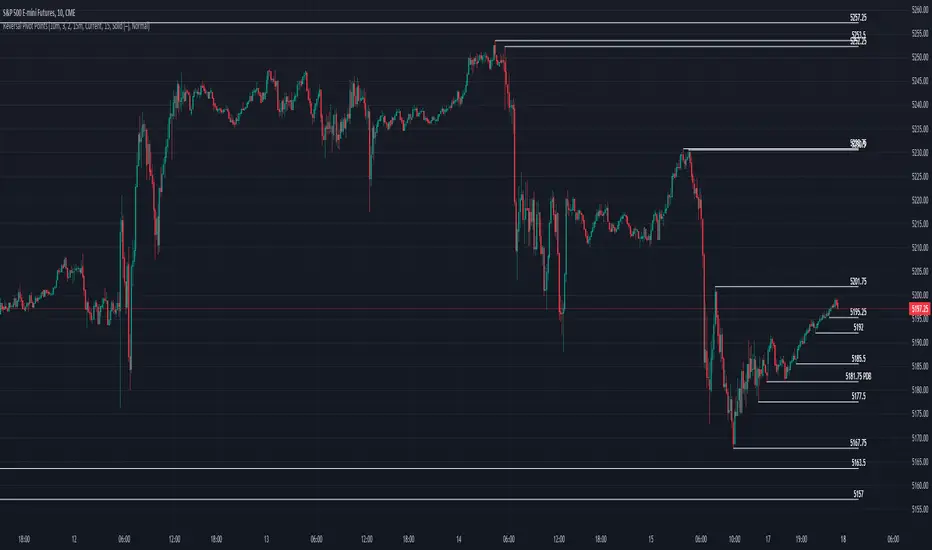
Reversal Pivot PointsThis indicator aims to identify price levels where price action has quickly reversed from. These "pivots" establish major levels where major liquidity is located. Unlike standard support and resistance levels, when price breaks below or above a pivot, these pivots disappear from the chart. Comes with various customization features built to fit all.
Features
Pivot Timeframe: Identify and plot pivots from one specific timeframe and see it from all lower timeframes
Pivot left/right bar limit: A feature aimed at preventing false pivots identification
Remove On Close (ROC): Feature to only remove pivots once price close under it
ROC Timeframe: The timeframe the script uses to determine if the candle closed under the level
Wait For Close: Will only remove the pivot after the current candle closes
Line Extension Type: The extension of the line. None - extends line to current time, left - only extends line to the left, right - only extends line to the right, both - extends line both directions
Line Offset: How much to offset (in bars) the line and label from the current candle
Line Type: The style of line when plotted. Solid (─), dotted (┈), dashed (╌), arrow left (←), arrow right (→), arrows both (↔)
Display Level: Whether to or not to display the price of the pivot
Display Perfect Level: Whether to or not to display levels where price perfectly rejected off of
Alerts: Creates an alert when a level has been crossed
How to trade
1. Pivots can be traded to or from. The stock market (market makers) will tend to "chase" liquidity in order to fill orders at better averages. This allows us retail traders to to participate alongside these moves to these pivots. Once price action hits a pivot, it can do two things: break the pivot and continue or bounce off it. We can participate alongside these bounces after confirmation of a reversal (doji, volume, etc). These bounce plays are high risk as it's generally 50-50, but the risk to reward is typically also very high, making them very valuable to take.
2. Typically, the market is a fluid environment and should be "natural," so perfect things (manmade and filled with liquidity) should not occur. With this knowledge, we can expect these perfect levels, "PDT/PDB," to break as they are not natural occurrence and have heavy liquidity on and above/below them. We can trade to these levels and expect them to break/sweep if price action comes near them again.
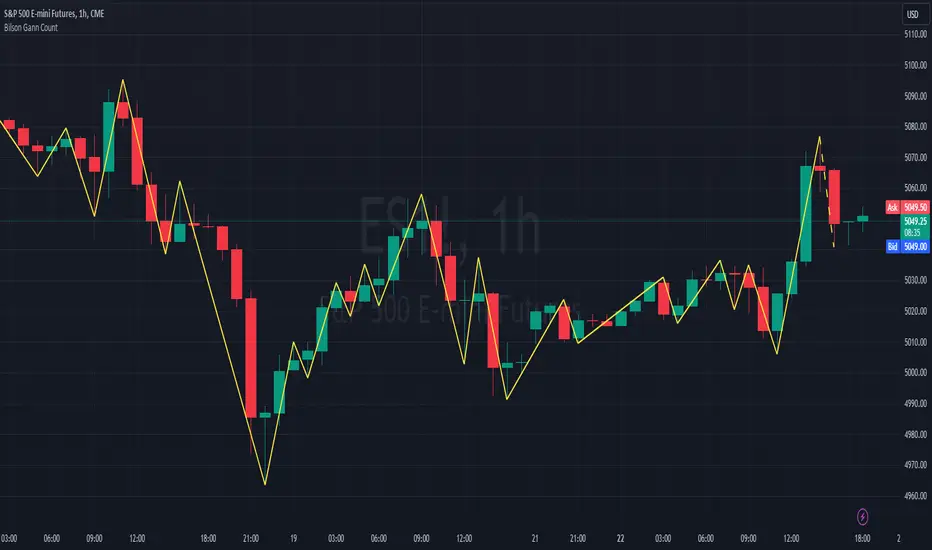
Bilson Gann CountGann counting is a method for identifying swing points,trends, and overall market structure. It simplifies price action by drawing short trend lines that summarize moves.
There's essentially 4 types of bar/candle.
Up bar - Higher high and higher low than previous bar
Down bar - Lower high and lower low than previous bar
Inside bar - Lower high and higher low than previous bar
Outside bar - Higher high and lower low than previous bar
We use these determinations to decide how the trendline moves through the candles.
Up bars we join to the high, down bars we join to the low, inside bars are ignored.
There are other indicators that already exist which do this, the difference here is how we handle outside bars.
Other gann counting methods skip outside bars, this method determines how to handle the outside bar after the outside bar is broken.
examples
UP -> OUTSIDE -> UP = Outside bar treated as swing low
UP -> OUTSIDE -> DOWN = Outside bar treated as swing high
DOWN -> OUTSIDE -> UP = Outside bar treated as swing low
DOWN -> OUTSIDE -> DOWN = Outside bar treated as swing high
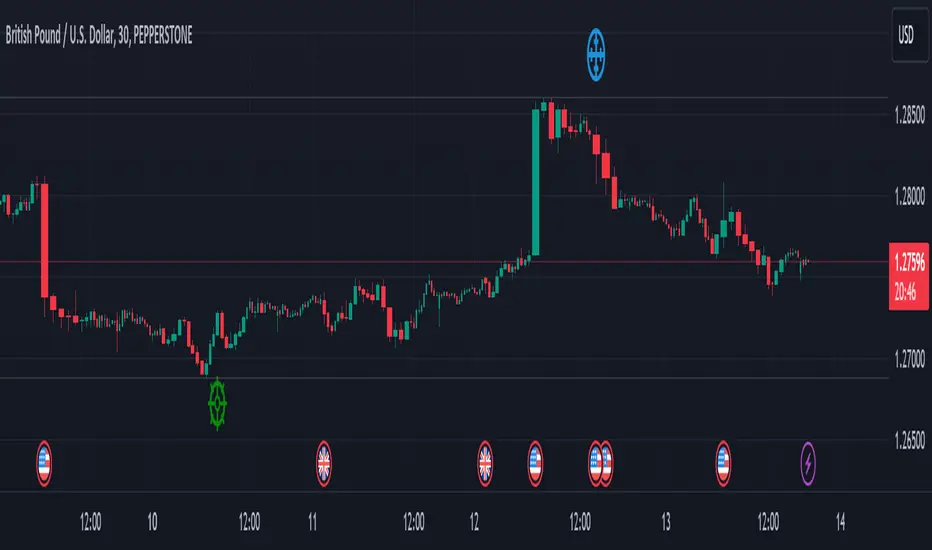
Swing Sniper by Republic of TradersSwing Sniper: A Comprehensive Market Reversal Indicator
Description:
Swing Sniper, developed by Republic of Traders, is a sophisticated trading indicator designed for traders who require precise market reversal signals. It performs optimally across all trading instruments and timeframes, offering both reliability and precision.
How It Works:
Swing Sniper employs a complex signal generation mechanism that activates only when six distinct conditions align within a specific timeframe. This includes:
A modified Commodity Channel Index (CCI) that helps identify short-term price fluctuations.
A Relative Momentum Index (RMI) utilized for recognizing long-term market trends.
A Supertrend indicator serves as a dynamic trend filter.
Several custom parameters that enhance signal reliability.
These components work synergistically to ensure that each trading signal is robust and well-founded. The indicator specializes in capturing significant market reversals by requiring a confirmation of trend reversal through a break and close above or below a previous supply/demand zone.
Usage Instructions:
Upon a valid signal, Swing Sniper advises traders that a potential market reversal has occurred and an entry may be considered in the direction of the new trend. Traders are recommended to set alerts for "once per candle close," allowing them to monitor multiple charts and timeframes simultaneously. Proper risk management is encouraged by placing stop losses just below or above the previous swing low or high and the signal candle's low or high. Take profits should similarly be set to capitalize on potential swings.
Why Choose Swing Sniper:
Swing Sniper is designed not only as a tool for generating entries but as a strategic component of your trading methodology. It brings a clear, analytical approach to navigating the markets, supported by detailed and logical indicator collaboration. This ensures users understand the underlying mechanics and can apply the tool effectively within their trading strategy.
Commitment to Originality and Utility:
Swing Sniper is a unique creation, adhering to TradingView’s standards by offering actionable insights that are distinct from other indicators available on the platform. It is meticulously crafted, featuring an original combination of technical analysis tools tailored to enhance market reversal detection.
Disclaimer:
Past performance is not indicative of future results. Always exercise due diligence and consider market conditions when trading.
Visualization Aid:
The accompanying chart visualization helps users identify signal examples, marked with a red triangle for market reversals short and a green triangle for market reversals long.
Embrace the strategic depth and precision of Swing Sniper and enhance your trading confidence and accuracy in financial markets.
Wunder OI breakout1. The basic concept for this strategy is to breakout open interest levels.
2. Open interest indicates the total number of active positions in the market a sharp increase in which we will use to enter a trade.
3. The main concept of this strategy is to break open interest levels.The strategy is based on building levels based on the highs and lows over a certain period. The breakdown of the set levels is used for entry. You can change the period as well as the percentage of change in open interest to find setups based on your pair and timeframe.
4. A function for calculating risk on the portfolio (your deposit) has been added to the Wunder OI breakout. When this option is enabled, you get a calculation of the entry amount in dollars relative to your Stop Loss. In the settings, you can select the risk percentage on your portfolio. The loss will be calculated from the amount that will be displayed on the chart.
5. For example, if your deposit is $1000 and you set the risk to 1%, with a Stop Loss of 5%, the entry volume will be $200. The loss at SL will be $10. 10$, which is your 1% risk or 1% of the deposit.
Important! The risk per trade must be less than the Stop Loss value. If the risk is greater than SL, then you should use leverage.
The amount of funds entering the trade is calculated in dollars. This option was created if you want to send the dollar amount from Tradingview to the exchange. However, putting your volume in dollars you get the incorrect net profit and drawdown indication in the backtest results, as TradingView calculates the backtest volume in contracts.
To display the correct net profit and drawdown values in Tradingview Backtest results, use the ”Volume in contract” option.

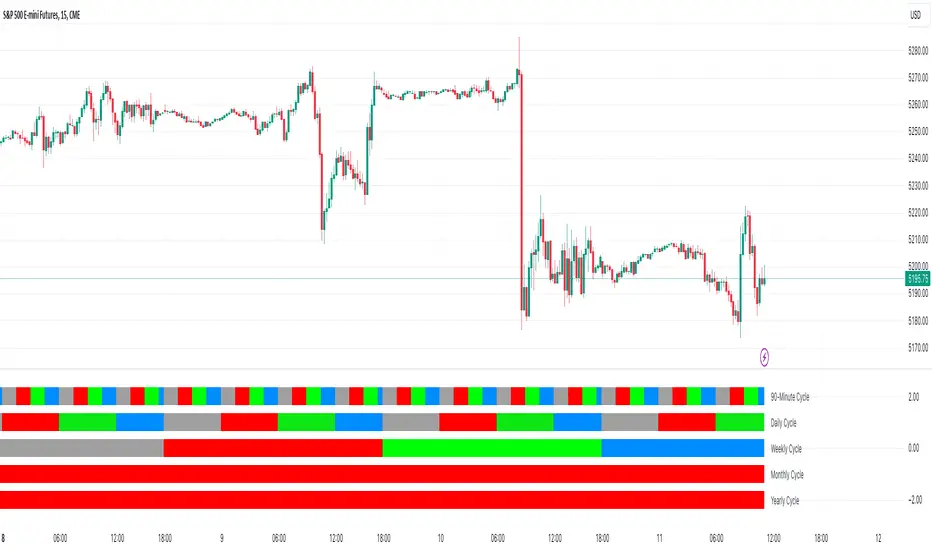
Quarterly Cycles [Dango]Introducing the Comprehensive Quarterly Cycle Indicator, a powerful and original tool designed to enhance your understanding of price action through the lens of quarterly cycles. This innovative script is a novel creation that accurately incorporates the nuances and complexities often overlooked by those who claim to have a quarterly cycle indicator.
Key Features:
- Displays 90-minute, daily, weekly, monthly, and yearly quarterly cycles
- Employs advanced algorithms and a deep understanding of cycle theory to precisely map out cycles
- Accounts for subtle nuances ignored by other indicators
How It Works:
The Comprehensive Quarterly Cycle Indicator meticulously calculates and visualizes various quarterly cycles based on a proprietary algorithm that determines the presence and absence of quarters. This intricate formula takes into account multiple factors and complex relationships between time and price to accurately identify when a quarter is present and when it isn't.
By leveraging this unique approach, the indicator can provide a more precise and reliable representation of quarterly cycles compared to other methods. The advanced algorithms employed by the script go beyond simple trend detection or scalping techniques, offering a comprehensive view of the underlying market rhythms.
The indicator's visual representation of quarterly cycles serves as an invaluable aid in recognizing time-based patterns, turning points, and potential trend shifts. Through the lens of this indicator, traders can gain a deeper understanding of how time influences market dynamics and can make more informed decisions based on this knowledge.
Intended Use:
The Comprehensive Quarterly Cycle Indicator is designed primarily for educational purposes, helping traders develop a keen intuition for interpreting price action through the lens of quarterly cycles. By studying the indicator's output alongside price movements, users can gain valuable insights into market dynamics and timing.
Please note that while this indicator is a powerful learning tool, it should not be considered a standalone trading system. As with any technical analysis tool, it is essential to combine its insights with other forms of analysis and risk management principles.
Limitations:
The indicator's accuracy may be impacted by extreme market volatility or unusual events
Quarterly cycles are one of many factors influencing price action and should not be relied upon in isolation
By offering a novel and accurate representation of quarterly cycles, this indicator aims to empower traders in their journey to understand and navigate the markets effectively. However, as with any trading tool, individual results may vary, and past performance does not guarantee future outcomes.
Disclaimer:
This indicator is provided for educational purposes only and should not be considered financial advice. Always conduct your own due diligence and consult with a financial professional before making any trading decisions.
Privacy of Code
Please note that the underlying logic and specific calculations used in the proprietary algorithm are not disclosed to protect the intellectual property of the script. The main reason for keeping these details hidden is due to the intricate formula used to determine when a quarter is actually present and when it isn't, taking into account various factors and complex relationships between time and price.
The proprietary algorithm is the result of extensive research, testing, and refinement, forming the core of the Comprehensive Quarterly Cycle Indicator's unique approach to identifying and visualizing quarterly cycles. By keeping the specific calculations confidential, the script maintains its competitive edge and ensures the protection of its intellectual property.
Despite not disclosing the exact details, the description aims to provide a clear understanding of the script's functionality, its unique approach to identifying quarterly cycles, and the potential benefits for traders. The information provided offers insights into the key features, general methodology, and advantages of utilizing the Comprehensive Quarterly Cycle Indicator in your trading analysis.
Fib Pivot Points HLThis TradingView indicator allows users to select a specific timeframe (TF) and then analyzes the high, low, and closing prices from the past period within that TF to calculate a central pivot point. The pivot point is determined using the formula (High + Close + Low) / 3, providing a key level around which the market is expected to pivot or change direction.
In addition to the central pivot point, the indicator enhances its utility by incorporating Fibonacci levels. These levels are calculated based on the range from the low to the high of the selected timeframe. For instance, a Fibonacci level like R0.38 would be calculated by adding 38% of the high-low range to the pivot point, giving traders potential resistance levels above the pivot.
Key features of this indicator include:
Timeframe Selection: Users can choose their desired timeframe, such as weekly, daily, etc., for analysis.
Pivot Point Calculation: The indicator calculates the pivot point based on the previous period's high, low, and closing prices within the selected timeframe.
Fibonacci Levels: Adds Fibonacci retracement levels to the pivot point, offering traders additional layers of potential support and resistance based on the natural Fibonacci sequence.
This indicator is particularly useful for traders looking to identify potential turning points in the market and key levels of support and resistance based on historical price action and the Fibonacci sequence, which is widely regarded for its ability to predict market movements.
Example:
Suppose you're analyzing the EUR/USD currency pair using this indicator with a weekly timeframe setting. The previous week's price action showed a high of 1.2100, a low of 1.1900, and the week closed at 1.2000.
Using the formula ( High + Close + Low ) / 3 (High+Close+Low)/3, the pivot point would be calculated as ( 1.2100 + 1.2000 + 1.1900 ) / 3 = 1.2000. Thus, the central pivot point for the current week is at 1.2000.
The range from the low to the high is 1.2100 − 1.1900 = 0.0200 1.2100−1.1900=0.0200.
To calculate a specific Fibonacci level, such as R0.38, you would add 38% of the high-low range to the pivot point: 1.2000 + ( 0.0200 ∗ 0.38 ) = 1.2076 1.2000+(0.0200∗0.38)=1.2076. Thus, the R0.38 Fibonacci resistance level is at 1.2076.
Similarly, you can calculate other Fibonacci levels such as S0.38 (Support level at 38% retracement) by subtracting 38% of the high-low range from the pivot point.
Traders can use the pivot point as a reference for the market's directional bias: prices above the pivot point suggest bullish sentiment, while prices below indicate bearish sentiment. The Fibonacci levels act as potential stepping stones for price movements, offering strategic points for entry, exit, or placing stop-loss orders.

True Opens [Dango]Description:
This True Open Indicator for Quarterly Theory is designed to assist traders in studying and backtesting Quarterly Theory, a time-based approach to interpreting market cycles. Quarterly Theory, as introduced by the Inner Circle Trader, suggests that time must be divided into quarters for proper analysis of market cycles.
Key concepts of Quarterly Theory:
The yearly cycle consists of four quarters, each comprising three months.
The monthly cycle consists of four quarters, each representing one week (excluding partial weeks).
The weekly cycle consists of four quarters, each representing one day (Monday to Thursday).
The daily cycle consists of four quarters, each representing six hours, aligning with the four main trading sessions (Asian, London, New York, and afternoon).
This indicator plots the true opens, which are crucial reference points in Quarterly Theory. True opens are the opening prices of the second quarter (Q2) of each cycle. They serve as a time-based filter for gauging market swings and determining entry points. When bullish, traders aim to buy below the true open, and when bearish, they aim to sell above it.
The true opens plotted by this indicator include:
Yearly true open
Monthly true open
Weekly true open
Daily true open
Asian session true open
London session true open
New York session true open
Afternoon session true open
The exact times of these true opens are not disclosed, as they are calculated using a proprietary method to ensure accuracy and reliability.
By clearly delineating these true opens on the chart, this indicator serves as a handy visual reference for those who have studied Quarterly Theory. It enables traders to easily identify these key reference points while studying price action across various time frames. It helps traders make informed decisions based on the principles of Quarterly Theory, enhancing their understanding of market cycles and potentially improving the accuracy of their trades.
To effectively utilize this indicator, traders should have a basic understanding of Quarterly Theory and its underlying concepts. The indicator can be used in conjunction with other tools and strategies to analyze price action and make trading decisions.
Please note that while this indicator is designed to assist in studying Quarterly Theory, it should not be considered a standalone trading system. Traders should always exercise caution and use appropriate risk management techniques when trading.
Originality and Usefulness:
This True Open Indicator for Quarterly Theory is a unique tool designed specifically to assist traders in studying and applying the concepts of Quarterly Theory. While there may be other indicators that plot certain opening prices, this indicator stands out by comprehensively plotting all the true opens across various time frames, as defined by Quarterly Theory. Not all
The key unique features of this indicator are:
It plots true opens based on the specific rules of Quarterly Theory, which are not commonly found in other indicators.
It covers a wide range of time frames, from yearly and monthly down to intraday sessions, providing a comprehensive view of market cycles.
The plotted true opens serve as time-based filters for gauging market swings and determining entry points, which is a distinct approach based on Quarterly Theory.
The true opens are calculated using a proprietary method that ensures accuracy and reliability.
The source code of this indicator is kept closed to protect the intellectual property and the proprietary algorithms used to accurately identify and plot the true opens based on Quarterly Theory. The closed-source nature also ensures that the indicator remains reliable and consistent, as it prevents unauthorized modifications that could lead to incorrect or misleading results.
By offering a unique and comprehensive tool for studying Quarterly Theory, this indicator provides significant value to traders seeking to enhance their understanding of market cycles and improve their trading accuracy. The closed-source approach is necessary to maintain the integrity and effectiveness of this specialized indicator.

ZigZag With ATR Filter [vnhilton](OVERVIEW)
The typical ZigZag indicator, which connects pivot points (see TradingView's Help Center regarding their indicator Pivot Points High Low, for an in depth explanation on how they are calculated) with lines, except instead of a percentage threshold, it uses ATR which adjusts for volatility of the ticker you are viewing. The ZigZag indicator can therefore be used to help visualise price legs and trends on a usually noisy looking chart.
(FEATURES)
- Toggles for pivot point label contents such as the value, the trend, or nothing at all.
- ATR and pivot point periods.
- ATR multiplier minimum threshold to plot pivots and draw lines only when this threshold is met (helps eliminate small, perhaps insignificant price movements, to have a better focus on the overall trend).
- Show the last 2 to 499 ZigZag lines.
- Uptrend, downtrend and range colors for high and low pivot labels, text labels and lines, for both confirmed and real-time plots.
- Label size, and label styles for the high and low pivots.
- Customisable width and styles (Arrow Right, Dashed, Dotted, Solid) for the ZigZag line.
In the main chart picture, labels show both the pivot point value and the trend at that point. In the picture above, on the left shows only the pivot point value, the right shows only the trend.
Picture above shows just the label with 0 contents. Also notice the last recent line being blue instead of green. This is because the current bar hasn't finished so this line is currently live and not confirmed, so is subject to change. Keep in mind even if a pivot point is confirmed, it can be updated by a subsequent higher high/lower low.
Left chart shows a minimum ATR threshold multiplier of 1x; Right chart has 2x ATR minimum threshold. Notice the left chart highlights more price legs as more price legs satisfy a less strict threshold.

Market Structure AlgoThe "Market Structure Algo" (MS Algo) is a comprehensive tool developed by OmegaTools. This advanced indicator is designed to analyze the market's structure through a combination of pivot highs and lows, creating a nuanced understanding of potential market movements.
Core Functionality:
- Internal and External Market Structure (MS): The MS Algo differentiates between internal and external market structures by analyzing pivot points over different periods. This dual analysis allows for a deeper understanding of short-term and long-term market trends.
- Zone Distance and Visualization: The indicator introduces a novel approach to visualizing potential areas of interest or 'zones' around pivot points, adjustable through the 'Zone Distance' setting. This feature enhances the visual representation of zone created on the chart that can be used as a support and resistance area.
- Dynamic Signal Generation: Utilizing a comprehensive algorithm, the MS Algo identifies potential signals for entering and exiting trades based on the internal market structure. These signals are visually represented on the chart, aiding in decision-making. These signals are based on the acceptance and confirmed breakout or the refusal of the pivot points by the price.
Operational Mechanism:
- The MS Algo calculates pivot highs and lows over specified periods (input by the user) to determine the market's current structure. It then evaluates the market's position relative to these pivot points to assign a market structure score, which can range from bullish to bearish extremes.
- Signals for long and short positions, as well as exits, are generated based on the interaction between the close price and these pivot points.
- Additionally, the indicator plots zones around the moving average, adjusted for the ATR and the specified 'Zone Distance,' providing a visual guide to areas where the market might find support or resistance.
Usage Guidelines:
- To apply the MS Algo to your TradingView charts, adjust the 'Internal MS' and 'External MS' settings to align with your analysis preferences. The 'Zone Distance' input allows for customization of the zone visualization feature.
- The color-coded signals and zone fillings serve as guides to understanding the current market structure and potential areas of interest. These should be interpreted within the context of a broader trading strategy and risk management framework.
Understanding the Indicator's Originality:
The MS Algo stands out due to its unique blend of pivot analysis and zone visualization, providing traders with a detailed view of the market's structure that goes beyond traditional indicators. Its originality lies in the methodological integration of these components to offer a tool that enhances market analysis.
Responsible Use Disclaimer:
The financial markets are unpredictable, and the MS Algo is designed to serve as an analytical tool within a trader's arsenal, not a standalone solution for trading decisions. Traders should use this tool judiciously, alongside comprehensive market analysis and sound risk management practices. It's important to understand that the MS Algo does not guarantee trading success nor does it claim to predict specific price movements. Trading involves risks, including the potential loss of capital.

Altered Money Flow Index by CoffeeShopCrypto**Use the comments section below to request access to the script**
Market Trends need to be confirmed each and every time.
Over the years the Money Flow Index has been a tool to find where the money is flowing
either long or short in market movements.
Long confirmation and false short
Confirming a long entry:
1. Wait for price to close above a previous swing high.
2. Look to see if the MFI is in UPCOLOR and above ZERO.
Confriming a short entry:
1. Wait for price to close below a previous swing low.
2. Look to see if the MFI is in DOWNCOLOR and below ZERO.
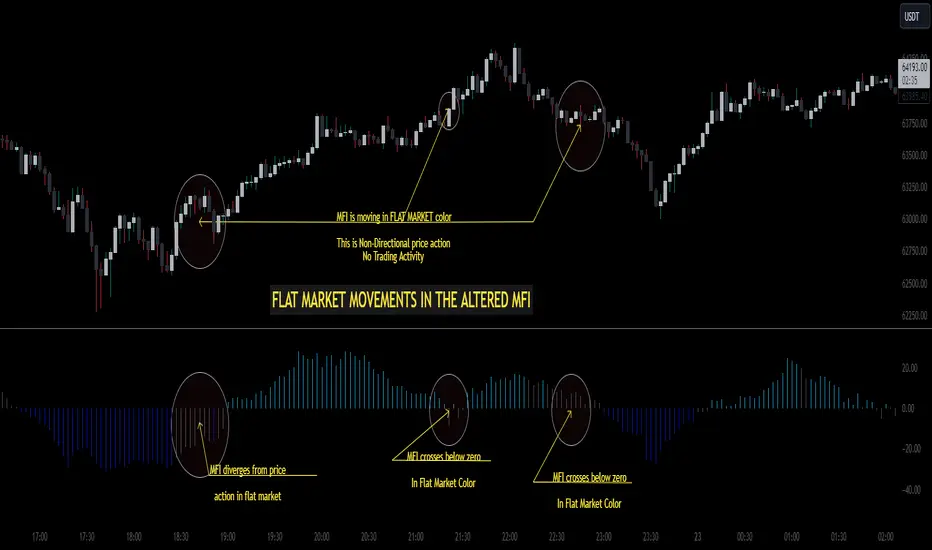
NON-Confirmed market: (Flat Market)
Anytime you believe you have a confirmation via price action, check the MFI to see if it is in FLAT MARKET color.
If this is true, do not enter until it is out of FLAT MARKET color.
Flat Market ALtered MFI
A Flat Market Altered MFI reading can do a few things for you.
It can help to confirm the following:
1. price action is moving sideways.
2. a pullback or market stall that was deep enough where dis-intrest in the market occured.
3. a sudden loss of momentum in the short term trend of closing prices.
Utilizing the Altered Money Flow Index indicator by CoffeeShopCrypto offers traders a nuanced approach to identifying market trends, including periods of flat market conditions. Alongside its directional bias indicating bullish or bearish activity based on whether values are above or below zero, respectively, the script incorporates a distinctive feature to recognize flat markets. When neither bullish nor bearish momentum dominates, the indicator designates a flat market, denoted by a distinct color. This feature enhances traders' ability to discern not only bullish and bearish phases but also periods of market consolidation or indecision.
In addition to its ability to recognize bullish and bearish trends, the Altered Money Flow Index indicator by CoffeeShopCrypto incorporates a unique feature to signify potential pullbacks or pauses in market momentum. This is particularly evident when the MFI crosses below zero while displaying a flat market color. Such occurrences suggest that although the short-term movement may appear bearish, it's likely a temporary pullback rather than a sustained trend reversal. Similarly, when the MFI crosses above zero amidst a flat market color, it indicates a potential pause in bullish momentum, urging traders to exercise caution and await confirmation of a sustained uptrend. By incorporating these nuanced observations, traders can effectively discern between short-term fluctuations and significant trend changes, enabling them to make more judicious trading decisions and avoid premature entries or exits.
Alongside its directional bias indicating bullish or bearish activity based on whether values are above or below zero, respectively, the script integrates the Relative Strength Index (RSI) to further refine market analysis. When the Altered MFI and RSI are both above zero, it suggests a strong bullish trend, indicating significant buying pressure. Conversely, when both indicators are below zero, it indicates a strong bearish trend, signifying heightened selling pressure. By observing the confluence between the Altered MFI and RSI, traders can gain valuable confirmation of bullish or bearish money flow in the market, enabling them to make more informed trading decisions.
Multi Pivot (S/R) & Previous Period (OHLC)█ Multi Pivot (Support/Resistance) & Previous Period (Open/High/Low/Close)
The previous script was deleted because of a copyrighted word.
From JayRogers description.
█ Multi Pivot Selector
Allows you to set up to 3 distinct sets of pivots, each with their own resolution settings and the ability to select how many support|resistance levels are shown.
The maximum amount of S|R levels available varies with different pivot types, the options available are:
Traditional
Fibonacci
Woodie
Classic
Copyrighted word
Camarilla
Fibonacci Extended
█ Previous Period Levels
A simple but highly customisable display of previous higher time-frame OHLC values.
Customised resolution input which excludes time frames lower than 1 hour while extending the common higher reference inputs.
This script is based on JayRogers script, I only added some features so please check out his script.
I added the timeframe in the labels, in order to make it easier to differentiate when using multiple pivot set.
As well as making it possible to change the lines color of each pivot set separately.
Labels can now be displayed on each side (right, left and both) or just disabled.
The type of pivot can be shown on the right side.
Lines extension can be disabled and lines width value can be changed.
I also added another one of his script to display OHLC levels, I made similar changes.
Converted to Pine Script v5.
Previous Period Levels - X Alerts
Pivotal - Multi Pivot Selector (which was also deleted because of the copyrighted word)

Pivots and SwingsThis indicator displays simple pivots of varying degrees and connects them into swings whilst displaying the information of each swing.
First order pivot highs are confirmed when the N number of bars each side of the bar in question have a lower high whilst a first order pivot low is confirmed when the N number of bars on each side of the bar in question have a higher low. In this script N is set to 2 as a default, so when the middle bar of a set of 5 bars has the highest high, then it is considered a first order pivot high and vice versa for lows.
Second order pivot highs are confirmed when a first order pivot is higher than the first order pivot points on either side of the pivot point in question. Second order pivot lows are confirmed when a first order pivot low is lower than the first order pivot lows either side of the pivot in question.
Third order pivots follow the same logic but consider the highest and lowest second order pivots
A quick note on how the bars are coloured basis trends. If price breaks through the last first order pivot high, the bars will be coloured in a (default) green sequence and will stay green until price moves back below the most recent first order pivot low, at which time it will revert to a (default) red sequence.
The information about the duration and magnitude of the swings are displayed in an effort to identify when a swing leg of an overall trend may be shortening which signifies a weakening trend, or lengthening to signify a trend that is gaining in strength.
I hope you find this indicator useful!

Machine Learning Breakouts (from Pivots)I developed the 'Machine Learning Breakouts (from Pivots)' indicator to revolutionize the way we detect breakout opportunities and follow trend, harnessing the power of pivot points and machine learning. This tool integrates the k-Nearest Neighbors (k-NN) method with the Euclidean distance algorithm, meticulously analyzing pivot points to accurately forecast multiple breakout paths/zones. "ML Pivots Breakouts" is designed to identify and visually alert traders on bullish breakouts above high lines and bearish breakouts below low lines, offering essential insights for breakout and trend follower traders.
For traders, the instruction is clear: a bullish breakout signal is given when the price crosses above the forecasted high line, indicating potential entry points for long positions. Conversely, a bearish breakout signal is provided when the price breaks below the forecasted low line, suggesting opportunities to enter short positions. This makes the indicator a vital asset for navigating through market volatilities and capitalizing on emerging trends, designed for both long and short strategies and adeptly adapting to market shifts.
In this indicator I operate in a two-dimensional space defined by price and time. The choice of Euclidean distance as the preferred method for this analysis hinges on its simplicity and effectiveness in measuring and predicting straight-line distances between points in this space.
The Machine Learning Breakouts (from Pivots) Indicator calculations have been transitioned to the MLPivotsBreakouts library, simplifying the process of integration. Users can now seamlessly incorporate the "breakouts" function into their scripts to conduct detailed momentum analysis with ease.
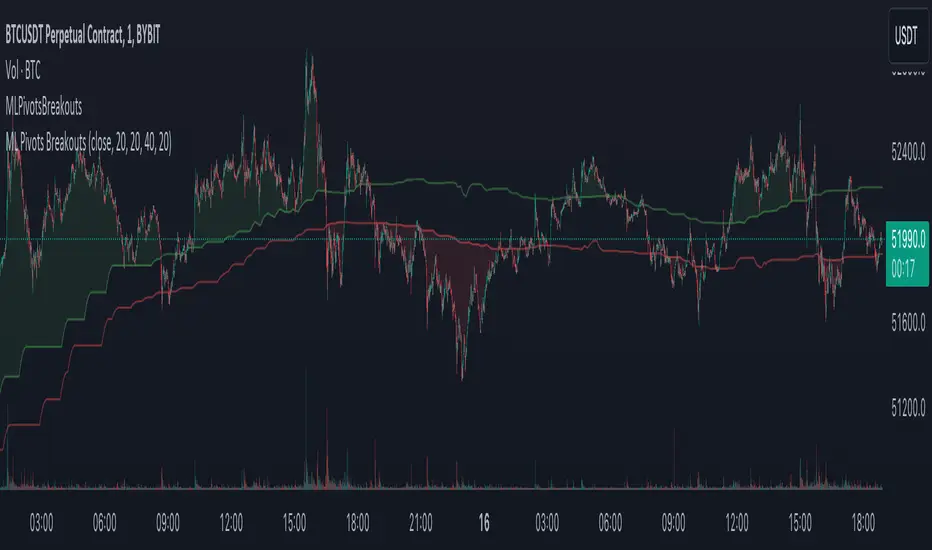
Manual Trend Line Breakout Labels and Alerts (TA:MTL)Manual Trend Line Breakout Labels and Alerts (TA:MTL)
TA:MTL is an indicator designed for manually plotting trend lines with advanced features including future extension, automatic breakout labels, and alerts. Developed for traders and analysts seeking precise trend determination and timely response to trend changes.
Key Features
Manual Trend Point Selection: Set two time points to define the start and end of the main trend line.
Adaptive Extension: The trend line automatically extends into the future, aiding in the anticipation of potential trend direction.
Strict Breakout Conditions: The indicator monitors strict breakout conditions where the price must cross the trend line post-bar closure, providing more reliable signals.
Visual Labels and Alerts: Visual labels appear upon detecting a breakout, accompanied by alerts for immediate user notification.
Customizable Appearance: Choose colors for primary and extended lines, as well as for breakout labels.
Usage Instructions
Set two time points (Trend time point 1 and Trend time point 2) to determine the initial and final points of the trend line.
Select the position type (Position Type) - "Long" for an upward trend or "Short" for a downward trend.
Customize the appearance of lines and labels using the available color parameters.
Activate the display of the future line extension (Show Future Line) if needed.
Monitor automatic labels and alerts to identify breakout moments of trend lines.

Timeframe PivotsUse this tool to plot open prices from any timeframe as a pivot level with the option to go advanced and turn on extensions (instructions below), which review the relationship between previous and current open prices to build range extensions up to six levels wide.
Please be aware extensions, nor vwap are not enabled by default! It is up to the user to determine how they wish to setup this indicator. Please read the full description for utilizing this indicator so that it's well known the complete feature set and understanding of how to enable additional plots, complete instruction is provided for all users below.
Default configuration example:
To enable extensions the user must open the indicator configuration by clicking the gear icon for "Timeframe Pivots", depending on screen resolution scrolling with mouse may need to occur in order to find the section labeled "Extensions", use the mouse or equivalent human interface device to check the checkbox to the right of the color plots and line type drop down.
Extensions enabled example:
Timeframe Selection
Timeframes available to the indicator are any timeframe the platform makes available to the user by default, or also if the TradingView user has higher tier plan to create custom timeframes - those should be available as well. To adjust timeframe the user must open the indicator configuration by clicking the gear icon for "Timeframe Pivots", depending on screen resolution scrolling with mouse may need to occur in order to find the input labeled "Timeframe", use the mouse or equivalent human interface device select the drop down and select timeframe suitable to users application.
How the extension width and extensions are calculated:
The exact process takes the new timeframe change open price calculates the difference between prior open, once that has been completed then it's divided in half to build extensions.
Code example:
Extension Width = (Open - Open ) / 2
How the extensions are calculated:
// +1 for positive extension, -1 for negative extension
(Extension Width * (Configured Multiplier * 1)) + Pivot Open Price
+1 Extension:
$5 * (1.0 * 1) + $400 = $405
-1 Extension:
$5 * (1.0 * -1) + $400 = $395
So it should be established how each projected extension, either positive or negative, is created.
Range bound market detection and notes:
One note regarding the ranges, sometimes the open prices of each period can be close in proximity to their predecessor, there's not enough range to build meaningful projections. In these situations this means the market is most likely range bound and prior range data is utilized to continue providing guidance. This addresses an issue with other pivot indicators that will instead blindly follow price and present useless pivot ranges.
It does this through detection of average half range widths, the last 14 ranges to be exact, if the current, (open - open / 2), half range width is smaller than the average, prior half range width will be used.
Code example:
// assume past half range widths are 10, 8, 9, 5, 14, 7, 7, 9, 10, 10, 4, 7, 7, 8
float v_halfRangeWidthToUseForExtensions = na
v_priorHalfRangeWidth = 10
v_avgHalfRangeWidth = 8.2 // past range widths sum = 115 / 14
v_newHalfRangeWidthToUseForExtensions = 2 // new open - open is tiny compared to avg
if v_newHalfRangeWidthToUseForExtensions < v_avgHalfRangeWidth
// replace new half range width with previous one
v_newHalfRangeWidthToUseForExtensions := v_priorHalfRangeWidth
In the code example above if the new half range width was above or equal to the rolling average, no adjustment would be made by the indicator.
VWAP
Additional feature of showing vwap, anchored to the same timeframe as the pivot, provides a trend and volume analysis within the confines of the pivots range.
The user must open the indicator configuration by clicking the gear icon for "Timeframe Pivots", scroll using mouse to the "VWAP" section and click the checkbox next to the "Source" field, past the color plots. They are not enabled by default!
The user can also add the bands for VWAP by clicking the checkbox next to the "Bands" field, past the color plots. They are not enabled by default!
VWAP calculations begin from open price of new timeframe change, then afterwards the "Source" set is utilized, the default is HLC3 which is standard for VWAP indicators.
Multiple Timeframe Analysis (MTFA)
It's simple to create a unique combination of favored timeframes for multiple timeframe analysis, consider daily, weekly and monthly combined analysis for powerful indications of market sentiment and directional bias.
Example MTFA demonstration:
Why was this created?
I created this while investigating the efficacy of open price ranges, it became apparent that these pivot ranges are some of the more price respecting pivots I've ever observed. I also grew tired of lack of price adherence to other pivot indicators widely available.
There exists a relationship between each timeframes open price in comparison to prior open price, if the market is willing to navigate to a prior lower open price from higher open price, it could be perceived as bearish and the extensions (if enabled as instructed above), could be suitable range based projections for future price movements.
Example comparison:
As can be seen, and there are many examples, where Timeframe Pivots provides more discreet levels and potential explanations for price movements.
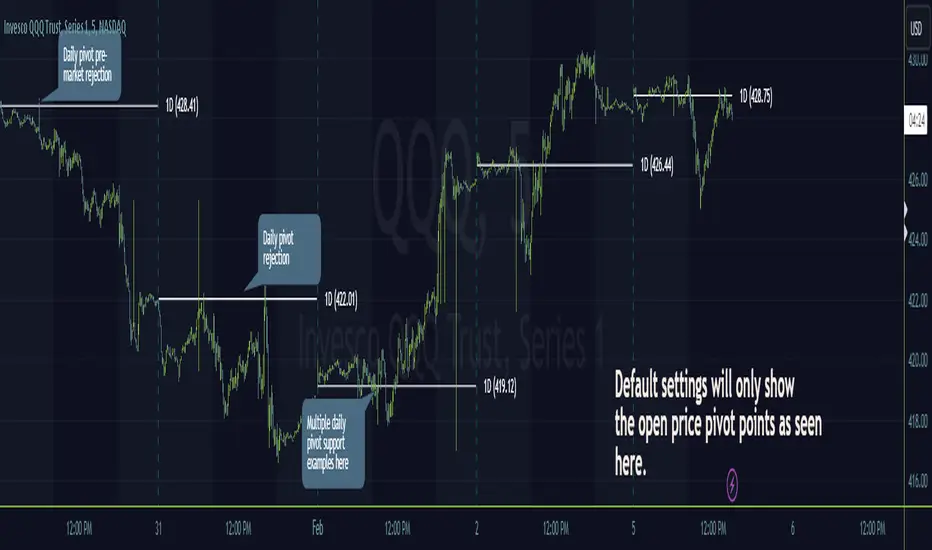
Opening Range Reversal ZonesThis script finds a reversal zone beyond the opening range for the selected period. I borrowed most of the opening range script itself from asenski.
I added a few things:
Trade Entry Times -- this restricts the "alert times."
Shading for the above mentioned times for the two "reversal" zones
A couple of other visuals for lines for the hi, mid, low of the opening range and lines for the fibs
Alerts while in the trading entry time session for fibbonacci crossovers.
I use this on NDX, SPY, and QQQs and have found buying "at the money" 0DTE puts in the "red zone" or 0DTE calls in the "green zone" frequently wins.
I have no statistics, as I am very methodical when I choose to enter, paying attention to the news, recent momentum, etc, and am not blindly entering when alert comes, but when one does, I do research and enter a trade.
In any case, thought I would share.