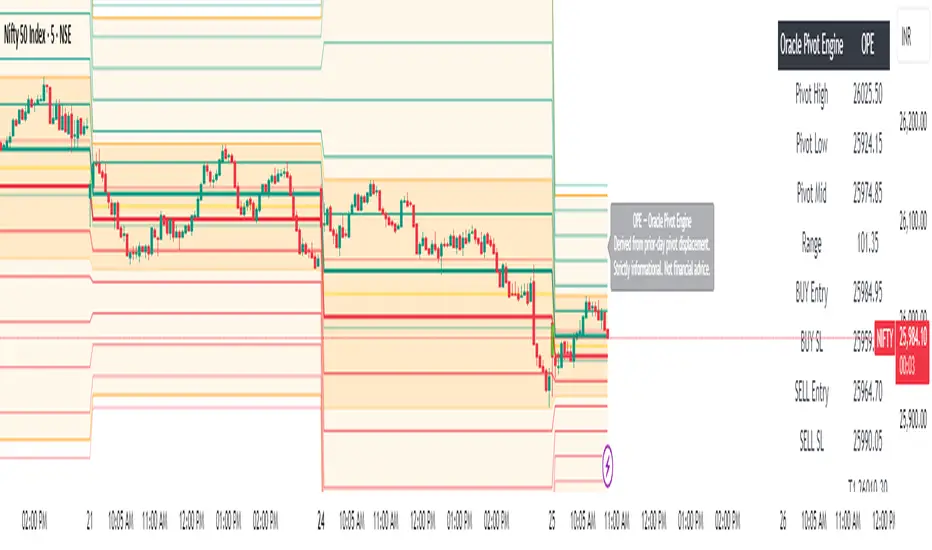
Oracle Pivot Engine (OPE) — @darshaksscThe Oracle Pivot Engine (OPE) is a market-structure visualization tool that derives all its levels exclusively from historical price data — specifically, the previous day’s high, low, and mid-range.
It does not provide signals, alerts, entries, exits, predictions, or trade recommendations.
Instead, it creates a non-repainting reference framework that helps users observe how the current session interacts with the prior session’s completed price structure.
All calculations are analytical, static, and based on fully closed candles.
🧠 How It Works (Core Logic Explained)
OPE computes the following values from the completed prior daily candle:
Prior-Day High
Prior-Day Low
Prior-Day Midpoint
Displacement Range = High − Low
This displacement range is used to generate symmetrical upward and downward reference zones.
These levels do not update during the session.
They refresh only once per day when a new daily candle closes.
This ensures the indicator remains fully non-repainting and stable on every intraday chart.
📐 Reference Levels Generated
Using the fixed prior-day displacement range, OPE plots:
1. BUY-Side Reference Map (Upward Bias)
BUY Reference Entry
BUY Reference Stop
BUY T1
BUY T2
BUY T3
BUY T4
BUY T5
BUY T6
These are not trade signals — they are mathematical extensions above the prior-day midpoint for structural interpretation only.
2. SELL-Side Reference Map (Downward Bias)
SELL Reference Entry
SELL Reference Stop
SELL T1
SELL T2
SELL T3
SELL T4
SELL T5
SELL T6
Again, these levels are not directives.
They are mirrored displacement extensions below the prior-day midpoint.
📊 Pivot Zone & Bands
The indicator includes optional visual layers derived from the same prior-day pivots:
Pivot High–Low Zone Shading → shows the prior-day full range
Pivot Midline → prior-day mid-price
Outer Displacement Bands → extended contextual boundaries
These are purely visual boundaries meant to improve market context.
🧾 Dashboard / HUD Explanation
A compact on-chart HUD summarizes all values.
It displays:
Section | Information (All Historical)
Prior-Day Pivots | High, Low, Mid, Range
BUY Map | Entry, Stop, T1–T6
SELL Map | Entry, Stop, T1–T6
The HUD allows you to quickly review:
Where the current price is relative to the previous day’s structure
How far price is from each level
Whether the session is operating inside or outside the prior-day displacement zones
Everything shown is static, non-repainting , and for reference only .
📊 How to Analyze It
✔ 1. Contextual Awareness
OPE helps users visually compare current intraday price to prior daily structure.
You can observe whether price is:
Inside yesterday’s high/low zone
Above the prior-day displacement
Below the prior-day displacement
This offers a clearer understanding of daily context and volatility.
✔ 2. Structural Symmetry
The BUY-side and SELL-side maps extend from the same pivot logic.
This can help visualize:
Expansion away from the prior-day midpoint
Compression within the prior-day range
Symmetrical displacement around key reference levels
Again — these are observational insights , not signals.
✔ 3. Range Interaction
As the session unfolds, users often study:
How price reacts around prior-day midpoint
Whether price is gravitating toward or away from the displacement levels
How intraday swings behave within these historical boundaries
This type of analysis is contextual , not predictive.
⚠️ Important Disclosures
This script does NOT generate trading signals.
It does NOT predict future price movement.
It does NOT contain advice, instructions, recommendations, or strategies.
All levels are derived exclusively from historical daily candle data .
This is strictly an informational visualization tool meant to support chart analysis.
Past price levels do not guarantee any future price behavior.
🛑 Disclaimer
This indicator is provided solely for educational and informational purposes.
It should not be interpreted as financial advice or a call to action of any kind.
Users should apply independent judgment and discretion when analyzing markets.
Titik Pivot
Fractals Trend [BigBeluga]🔵 OVERVIEW
Fractals Trend is a trend-following overlay that leverages fractal swing points to define dynamic support and resistance zones. By storing and averaging recent high and low fractals, it determines trend direction and plots a smooth band that flips depending on market bias—displaying support during uptrends and resistance during downtrends .
🔵 CONCEPTS
Fractal Swings: Fractals are identified using a customizable length. A high fractal forms when the current high is the highest in a range; a low fractal when the current low is the lowest.
Fractal Memory: The indicator keeps a rolling window of recent high and low fractals inside arrays, limited by the user-defined storage quantity.
switch
upperF => FracrtalsUpper.push(high )
lowerF => FracrtalsLower.push(low )
FracrtalsUpper.size() > fCount => FracrtalsUpper.shift()
FracrtalsLower.size() > fCount => FracrtalsLower.shift()
Trend Detection: Price crossing above the average, min/max or median high fractals signals an uptrend; crossing below average, min/max or median low fractals signals a downtrend.
Dynamic Band Plotting: Depending on the trend, the script plots the average of either the upper or lower fractals as a trailing support or resistance line.
Visual Confirmation: Fractal labels appear as triangle markers at highs and lows, providing additional structural context.
🔵 FEATURES
Automatically detects high and low fractals using customizable length.
Stores a defined number of fractals to smooth out noise and reduce false signals.
Flips trend bias dynamically with colored band and smooth transitions.
Plots fractal-based support in bullish trends, resistance in bearish trends.
Triangle markers show real-time fractal highs and lows.
Fully configurable visuals, color themes, and fractal detection logic.
Clean, non-intrusive overlay that works on any market or timeframe.
🔵 HOW TO USE
Use the colored band as a directional filter: green = uptrend (support), orange = downtrend (resistance).
Combine with entry signals or break/retest strategies when price approaches the band.
Use triangle markers to confirm structural swing points.
Adjust Fractals Length to tune sensitivity—shorter values detect quicker shifts, longer values reduce noise.
Change the fractal bands type to adapt trend detection to different market conditions.
Use in conjunction with momentum or volume tools for confluence.
🔵 CONCLUSION
Fractals Trend offers a lightweight, intuitive way to track market bias using price structure alone. Its smart switching logic and clean visuals make it a powerful tool for trend traders seeking structure-based dynamic S/R—without laggy moving averages or overcomplicated signals.

Universal Pivot ScannerUniversal Pivot Scanner
Professional pivot pattern detection for any market data source.
A robust pivot detector designed to work across all timeframes and data types - price action, technical indicators, volume, or custom studies. One tool, multiple applications.
Core Functionality
Identifies two high-probability retracement patterns:
HH+HL → Bullish continuation setup (higher high followed by higher low)
LL+LH → Bearish continuation setup (lower low followed by lower high)
Key Features
Non-repainting detection. Labels and alerts trigger at pivot confirmation, ensuring real-time actionable signals without historical bias.
Source flexibility. Compatible with any input - price data, oscillators (RSI, MACD), volume analysis, or proprietary indicators. Single implementation across multiple strategies.
Adaptive configuration. Adjustable lookback period optimizes performance for different market conditions and data types.
Recommended Settings
Lookback: 1 → Oscillators and momentum indicators
Lookback: 3-10 → Price action and ranging markets
Includes visualization table displaying recent pivot sequence and active pattern status.
Designed for systematic traders requiring consistent, verifiable signals across diverse market conditions.

Yest/PreMkt H/LI published this Tradingview script to allow you to see pre-market and previous day highs/lows for directional trading. This works with stocks, ETFs and indexes. To see pre-market highs/lows, you MUST enable "extended" session in the TV charts. You can change colors to your liking. Enjoy!

Vector CPR Bands## Overview
The Vector CPR Bands indicator enhances the classic Central Pivot Range (CPR) by incorporating "vector" detection—identifying periods with above-average or climactic volume. It projects CPR ranges from these high-volume periods forward as visual bands, which act as persistent support/resistance zones until invalidated by price action. Ideal for spotting key levels in trending or ranging markets, especially on higher timeframes like weekly or monthly.
## Key Features
- **CPR Calculation**: Plots previous, developing (non-repainting), and repainting CPR with mid-pivot, TC (top central), and BC (bottom central) lines, plus fills.
- **Vector Detection**: Scans for high-volume bars in the anchor timeframe (default weekly). Flags "above-average" (≥1.5x avg) or "large" (≥2x avg or max climax).
- **Band Projection**: Creates bands from vector-qualified CPR periods. Extends them rightward until touched/revisited (configurable: invalidate on wick/close, delete or freeze/gray out).
- **Customization**:
- Timeframe: Set CPR anchor (e.g., 'W' for weekly, 'M' for monthly).
- Display: Toggle CPR types, pivot guides.
- Volume Thresholds: Adjust lookback and ratios.
- De-clutter: Limit max bands, pin to period start, always extend.
- **Alerts & Signals**: Built-in alerts for developing pivot crossing previous pivot (bullish/bearish).
## How to Use
1. Add to chart and set anchor timeframe (e.g., 'M' for monthly vCPR on BTC, as shown in example charts).
2. Watch bands as S/R: Virgin (untested) bands often provide strong bounces; mitigated ones fade.
3. Combine with volume/price action: Bullish bands suggest upside bias, especially if price holds above.
4. Example: On BTC weekly, vector bands from high-volume weeks highlight multi-month zones—breaks signal shifts.

Swing Traces [BigBeluga]🔵 OVERVIEW
The Swing Traces indicator identifies significant swing points in the market and extends them forward as fading traces. These traces represent the memory of recent highs and lows, showing how price interacts with past turning points over time. Traders can use the fading intensity and breakout signals to gauge when a swing has lost influence or when price reacts to it again.
🔵 CONCEPTS
Swing Detection – Detects recent upper and lower swing points using sensitivity-based highs and lows.
Trace Longevity – Each swing projects a “trace” forward in time, gradually fading with age until it expires.
Trace Size – Each trace is drawn with both a main level and a size extension (half of the bar range) to highlight swing influence.
Longevity Counters – Swings remain active for a customizable number of bars before fading out or being crossed by price.
Swing Retest – Labels appear when price retest above/below an active trace extension levels, confirming potential reversal.
🔵 FEATURES
Adjustable sensitivity length for swing detection.
Separate longevity controls for upper and lower swing traces.
Fading gradient coloring for visualizing how long a trace has been active.
Double-trace plotting: one at the swing level and one offset by trace size.
Clear BUY/SELL signals when price crosses a swing trace after it has matured.
🔵 HOW TO USE
Use blue (upper) traces as resistance zones; lime (lower) traces as support zones.
Watch for fading traces: the longer they persist, the weaker their influence becomes.
Retest dots (●) confirm when price retest a trace, signaling a potential reversal.
Shorter sensitivity values detect faster, smaller swings; longer values capture major swing structures.
Combine with trend indicators or volume to filter false breakout signals.
🔵 CONCLUSION
The Swing Traces indicator is a powerful tool for mapping price memory. By projecting recent swing highs and lows forward and fading them over time, it helps traders see where price may react, consolidate, or break through with strength. Its dynamic traces and breakout labels make it especially useful for swing traders, breakout traders, and liquidity hunters.

ZigZagZigZag Indicator – Overview
This ZigZag indicator highlights the most important swing highs and swing lows on the chart, helping traders see market structure more clearly by filtering out minor price movements. It connects significant turning points with straight lines, creating a clean visual representation of trend direction and major reversals.
How It Works
Price constantly moves up and down, but not every movement is meaningful. The ZigZag indicator waits for price to make a move large enough to be considered a true swing point. Once such a movement occurs, the indicator identifies it as either a swing high or a swing low and draws a line connecting it to the previous swing.
This produces a simplified outline of market structure, making it easier to recognize trends, corrections, and major turning points.
Settings
ZigZag Length
Controls the sensitivity of the indicator.
Lower values produce more frequent swing points.
Higher values show only major swings and reduce noise.
Show ZigZag
Enables or disables the visual lines. When disabled, the indicator continues tracking swing points internally.
What You See on the Chart
Every time the market creates a confirmed swing high or swing low, the indicator draws a line to the previous swing in the opposite direction.
After a major low is confirmed, a line is drawn to the most recent high.
After a major high is confirmed, a line is drawn to the most recent low.
This creates a clear, continuous zigzag that outlines the dominant movements of the market without reacting to every small fluctuation.
Why This ZigZag Is Useful
It does not repaint once a swing is confirmed.
It provides a clean and simplified view of price structure.
It helps identify trend direction, structure breaks, impulses, and corrections.
It is useful for traders who follow price action, smart money concepts, and swing-based strategies.
Recommended Use Cases
This ZigZag indicator is suited for traders who rely on market structure analysis, including:
Swing trading
Smart Money Concepts (BOS/CHOCH detection)
Identifying impulses and pullbacks
Finding strong highs and lows
Studying overall trend direction

Pivot crossThis script is simple way of seeing the trend using two pivots, one with lower time frame and other with higher timeframe. When the lower crosses above higher, its bullish, when lower crosses below higher pivot then bearish. Works on any timeframes for intraday and swing trading.

Liquidity & inducementsHi all!
This indicator will show liquidity and inducements.
I will continue to try to add different types of liquidity and inducements, at this moment it contains 6 kinds of liquidity/inducement, they are:
• Grabs
• Big grabs
• Sweeps
• Turtle soups
• Equal highs/lows (liquidity and inducement)
• BSL & SSL
And 1 type of inducement:
• Retracement
This description will contain indicator examples of each individual liquidity and inducement. They will all be with the default settings.
Settings
First you will find settings for the market structure (BOS/CHoCH/CHoCH+). Select left and right pivot lengths and if the pivots should have a label or not.
This is the base foundation of this indicator and is possible with my library 'PriceAction' ().
You will see solid lines for break of structures (BOS), change of characters (CHoCH) and change of character plus (CHoCH+).
The pivots found will be the core of this indicator and will show you when the closing price breaks it. When that happens a break of structure (BOS) or a change of character (CHoCH or CHoCH+) will be created. The latest 5 pivots found within the current trend will be kept to take action on.
A break of structure is removed if an earlier pivot within the same trend is broken and the pivot's high price for a bullish trend or low price for a bearish trend is more extreme than the BOS pivot's price.
You are able to show the pivots that are used. "HH" (higher high), "HL" (higher low), "LH" (lower high), "LL" (lower low) and "H"/"L" (for pivots (high/low) when the trend has changed) are the labels used.
In the next section ('Liquidity ($$$)') you can select which types of liquidity you want to see. Note that 'Equal highs/lows' can also show inducement (more on that later).
In the section afterwards ('Inducement (IDM)') you can select if you want retracement inducements to be visible or not. More information on what they are later on.
The section for each individual liquidity and/or inducement can first contain a line named 'Pivot', where you can set the pivot lengths (first left, then right). Then you can set the 'Lookback', which means that the 'Lookback' number of past pivots is to take action on. After that you set the 'Timeframe' for the pivots used. That means that all available liquidity/inducements will be from your desired timeframe. Lastly you set the color of the liquidity/inducement (either a single color or bullish followed by bearish colors).
Lastly in the settings you can select the font sizes for the market structure and liquidity/inducements and what style liquidity/inducements lines will have. The sizes defaults to 7 and has a dotted line look.
Grabs
Liquidity grabs and liquidity sweeps are very similar. It all depends on if the current bar closed above/below the liquidity pivot and on if its a continuation or reversal. In a liquidity grab the bar that's above or below the liquidity pivot was not closed above or below it. Like this:
Or
The visual feedback will be a dotted line between the liquidity pivot and liquidity grab bar and a linefill between the high of the liquidity grab bar and the liquidity pivot.
Indicator example:
Big grabs
This is another 'grabs' option. You can show an additional grab if you want to. I suggest having this grab from a higher timeframe or with larger pivot lengths than the other grab.
The default is with the chart timeframe and 10/10 as pivot lengths.
Indicator example:
Sweeps
A liquidity sweep is like a liquidity grab but with the difference that price closes above/below and has a continuation instead of a reversal. If the liquidity pivot was at the same bar as a BOS/CHoCH/CHoCH+ it will not be a liquidity grab but a structural break instead.
They can look like this:
Indicator example;
Turtle soups
If only one candle is beyond the pivot it could be a liquidity grab. It's a grab if price didn't close beyond the liquidity pivot, if so it's invaliditet. Turtle soups are basically false breakouts that takes liquidity (is a false breakout from a pivot with the lengths and timeframe from the settings).
The turtle soup can have a confirmation in the terms of a change of character (CHoCH). You can enable this in the settings section for 'Turtle soups' through the 'Confirmation' checkbox (enabled by default). The turtle soup strategy usually comes with some sort of confirmation, in this case a CHoCH, but it can also be a market structure shift (MSS) or a change in state of delivery (CISD).
The addition of turtle soups is possible through my script 'Turtle soup' ().
The drawing will be a dotted line between the liquidity pivot and the last bar of the false breakout and a box from the start of the false breakout to the end of it.
Indicator example:
Equal highs/lows
Equal highs/lows will always show liquidity, but might also show inducement. Inducement will be shown on equal lows if the trend is bullish and on equal highs if it's bearish, like this:
Or
Equal highs can only be created if the second pivot is lower than the first one. Equal lows can only be created if the second pivot is higher than the first one. If that is not the case it could be a liquidity grab.
When equal highs or equal lows are find that produces inducement (equal lows in a bullish trend and equal highs in a bearish trend), the indicator will first display inducement and will show liquidity once traders are induced to enter the security. Stop loss placement, for liquidity, is 0.1 * the average true range (ATR, of length 14). They will look like this:
Only inducement:
Inducement and liquidity:
Indicator example:
Equal highs/lows inducements can not be triggered after a BOS/CHoCH/CHoCH+. They are cleared upon a structural break.
BSL & SSL
Buyside liquidity (BSL) and sellside liquidity (SSL) will be shown. A pivot that's been mitigated (touched by price) can never be BSL or SSL. The BSL/SSL available will be dynamic while price moves (work in Replay and lower timeframes that moves fast) and pick the latest pivot/s (with left and right lengths from the 'Market structure' section). You can define how many BSL/SSL you want to see with a default value of 1, meaning only 1 BSL and 1 SSL can be shown. If there is no unmitigated high (BSL) or low (SSL), no BSL/SSL will be available to show. If there are BSL/SSL available they're very useful to use as targets for entering a trade.
The will look like this when available;
And without BSL available:
Or
And without SSL available:
Note that the examples without BSL/SSL available could have liquidity available from previous price legs.
This can be an example of a BSL/SSL sequence:
First both buyside and sellside liquidity is available:
Then a new low appears and new sellside liquidity is available:
Then buyside liquidity is mitigated, so only sellside liquidity is available:
A new high pivot appears and buyside liquidity is available again:
Lastly a bearish CHoCH happens and sellside liquidity is mitigated, only buyside liquidity is available:
Retracement
The first retracement after a BOS/CHoCH/CHoCH+ is considered an inducement with the mission to get traders into a trade prematurely to get stopped out. This level is shown and look like this:
Or
A retracement inducement is removed when a new BOS/CHoCH/CHoCH+ appears and it's not triggered.
---------------------------
As of now there aren't any alerts available. You cannot use the Pine Screener from Tradingview either to see new liquidity/inducement events. I have this planned for future updates though.
I hope that this long description makes sense, let me know otherwise! Also let me know if you experience any bugs or have a feature request or just want to share good settings to use.
Best of trading luck!

Liquidity Hunt Detector PDH/PDL [SmartFoxy]Liquidity Hunt Detector PDH/PDL
The Liquidity Hunt Detector (LHD) is designed to identify and anticipate liquidity grabs around the:
• Previous Day High (PDH);
• Previous Day Low (PDL).
It builds dynamic trigger levels that highlight where price may deliver its first impulse before reaching PDH/PDL.
The Liquidity Hunt Detector (LHD) identifies high-probability reversals and continuations around the Previous Day High (PDH) and Previous Day Low (PDL).
It dynamically tracks the market’s move from the session open, builds trigger levels toward PDH/PDL, and highlights where liquidity is most likely to be taken.
When price taps a Trigger Up/Down level, the indicator generates Long/Short signals with optional confirmation from the integrated MA Ribbon , ensuring only high-quality, trend-aligned setups are shown.
When price interacts with these trigger levels, the indicator generates signals that help traders evaluate the market structure and prepare for potential entries.
Designed for Forex, Crypto, Indices, Stocks , the LHD provides a clean and intuitive structure for navigating intraday liquidity grabs, session impulses, and directional bias shifts.
The indicator is built from three fully independent modules, each of which can be used separately:
Liquidity Hunt Detector (LHD)
Moving Average Ribbon (MA Ribbon)
Previous Day High/Low (PDH/PDL) levels
Liquidity Hunt Detector (LHD) Logic
1.1 Display LHD – Enables or disables the entire Liquidity Hunt Detector module.
1.2 Max Days – Number of previous days used to generate PDH/PDL levels.
1.3 GMT – Corrects all time-based calculations based on your broker/session timezone.
1.4 Calculation Method (Point A Logic)
1) Static Method
Point A = the session’s opening price.
Trigger lines are calculated strictly as a percentage of the move A → PDH or A → PDL.
Intraday fluctuations do not affect the calculation.
2) Dynamic Method
Point A updates using the current intraday high/low:
• If price forms a new low, Point A updates for the PDH-side calculations;
• If price forms a new high, Point A updates for the PDL-side calculations.
This produces trigger lines that reflect the true live market structure rather than a fixed opening reference.
1.5 Main OTT Time (Operational Trading Time)
This is the core time window during which the indicator:
• updates Point A;
• calculates trigger levels;
• validates PDH/PDL;
• draws AB / AC movement structure;
• generates entry signals.
Outside this window, no new signals or recalculations occur.
⚠ If your broker’s first candle opens at a non-standard time (e.g., 00:08), adjust the OTT start time to avoid visual artifacts.
1.6 Show Line A – Displays the opening price level (Point A) until the end of the OTT window.
Style, width, and color are customizable.
1.7 Show Line AB — Price Movement Toward PDH.
Static Method – Single line: A → PDH
Dynamic Method – Two segments:
• A → Daily Low;
• Daily Low → PDH.
If PDH is swept, the “B” label switches to Sweep PDH.
1.8 Show Line AC – Price Movement Toward PDL.
Static Method – Single line: A → PDL
Dynamic Method – Two segments:
• A → Daily High;
• Daily High → PDL.
If PDL is swept, the “C” label switches to Sweep PDL.
1.9 Show Trigger Up Line (LONG Trigger) – Defines the level where the Long signal can activate.
By default, at 50% of the A → PDH movement.
When price touches this line, the script may:
• show a LONG label;
• trigger an alert.
All visual parameters are customizable.
1.10 Show Trigger Up Line (LONG Trigger)
Same logic as Trigger Up, but based on A → PDL.
1.11 Show Main Zone (OTT Zone) – Visual background highlighting of the active OTT window.
Helps instantly see:
• whether signals are allowed;
• how much time remains in the trading window?
Color and opacity are adjustable.
1.12 Upper Zone (toward PDH) – Tracks the protected area towards PDH.
Updates dynamically with new highs.
1.13 Lower Zone (toward PDL) – Tracks the zone toward PDL.
Updates dynamically with new lows.
1.14 Show Labels – Displays reference labels (A, B, C, Trigger Up, Trigger Down).
Label size is customizable.
1.15 Add Price – Adds the exact price value to each label.
1.16 Change Color after Sweep PDH or PDL – After PDH or PDL is broken, the indicator automatically recolors lines and labels to visually confirm the sweep.
1.17 Show SHORT Label – Displays the SHORT entry label when all conditions for a bearish signal are met.
Style parameters are set in the previous blocks.
1.18 Alert on Bearish Trigger Down – Triggers an alert when the price activates the bearish trigger.
1.19 Show LONG Label – Displays the LONG entry label when bullish conditions are met.
Style parameters are set in the previous blocks.
1.20 Alert on Bullish Trigger Up – Triggers an alert when the price activates the bullish trigger.
1.21 Alerts Active Time – Defines a custom time interval during which trigger signals are allowed.
Even if price touches a trigger level,
❗ signals will NOT be generated outside this allowed time.
Useful for:
• avoiding Asian session signals;
• reducing noise in low-liquidity periods.
1.22 Labels and Alerts Display Mode
Two settings modes:
• On Trigger (Instant Mode) – Signals appear immediately when price touches the trigger.
• On Candle Close (Conservative Mode) – Signals form only after the candle closes beyond the trigger level.
A more conservative option.
1.23 Delay LHD Signal Until MA Ribbon Confirms Direction – If enabled, LHD signals will NOT fire until the MA Ribbon produces a matching directional signal.
Logic:
• Price hits the trigger → LHD conditions become “armed”;
• The indicator waits;
• When MA Ribbon confirms trend direction (Long/Short);
• The final LHD label + alert is generated.
This ensures LHD trades are filtered and aligned with MA-based trend confirmation.
⚠ Works only when the MA Ribbon module is active.

Weekly Institutional Fib PivotsThese Fibonacci levels act as institutional order zones, meaning price reacts more powerfully when it originates from them. Use them as a weekly roadmap to anticipate where price is likely to travel each day, including during overnight or automated trading sessions.
How to trade them:
• Take the previous weeks levels and use those levels to trade the current week.
• Enter and exit around the major fib levels
• Use the 50% midpoint between levels as your first take-profit or stop-loss zone
These levels provide structure, targets, and precision for both intraday and multi-session trading.
Strategy:
Place your order at one level, and exit before it reaches the next level or at the 50% area of the zone

TrenVantage RETAIL - Smart Support and Resistance📘 TrenVantage RETAIL – Smart Support & Resistance
Hello Traders!
We are excited to introduce this new tool TrenVantage RETAIL! This indicator is a precision-built market structure tool designed to help traders easily identify actionable Support & Resistance zones, emerging trends, and proximity-based reaction areas. It combines pivot-based level detection, a dynamic ZigZag engine, and trend-awareness analytics into a clean, non-cluttered visual layout. The RETAIL edition offers simplified yet powerful logic that highlights only the most relevant 2–3 key levels, making it ideal for traders who prefer clarity over chart overload. Whether you are day-trading or swing-trading, TrenVantage RETAIL helps you understand price behavior, locate nearby reaction zones, and monitor directional bias in real time.
✨ Key Features
🔹 Smart Support & Resistance (Max 3 Levels – Retail Version)
- Auto-detected levels using precision body logic
- Keeps only the most relevant 2–3 zones
- Clean, minimal, and ideal for reaction-based trading
🔹 Clean Pivot Engine
- Uses timeframe-based pivots
- Body-focused calculations improve accuracy
- Fixed retail-friendly lookback ensures consistency
🔹 Trend Detection (ZigZag-Based)
- Real-time uptrend / downtrend state
- Swing-based structure mapping
- Adjustable deviation settings
🔹 Status Box Dashboard
- Trend direction + momentum bias
- Current price & price change
- SMA position and trend influence
- Nearest S/R with point distances
- Market position summary
- Level counts and proximity status
🔹 SMA Overlay
- Fully adjustable period
- Useful for extra confirmation
🔹 Real-Time Alerts
- Proximity alerts near S/R
- Trend change alerts (Uptrend / Downtrend)
- Clean once-per-bar confirmations
🔍 In-Depth Feature Breakdown
1. Smart Support & Resistance Levels
TrenVantage RETAIL uses a refined pivot-based engine combined with candle-body logic to detect only the most meaningful support and resistance zones. Instead of flooding your chart with lines, the algorithm intelligently maintains up to three major levels at any time.
How It Works
- Uses primary pivots from the current timeframe
- Prioritizes candle bodies over wicks for more reliable zones
- Removes outdated levels to keep the chart clean
- Highlights levels with color-coded clarity:
Green = Support
Red = Resistance
How It Helps Traders
- Keeps focus on the levels that matter
- Reduces noise and over-analysis paralysis
- Helps anticipate reactions, rejections, consolidations, and tests
- Works across all markets and timeframes
2. Streamlined Pivot Engine
While many indicators use fixed pivot logic, TrenVantage RETAIL uses a timeframe-aware pivot engine optimized for retail traders who prefer precision without complexity.
How It Works
- Pulls pivots from the trader’s active timeframe
- Uses body-to-body pivot recognition to improve accuracy
- Reduces over-plotting by filtering out weak pivots
How It Helps Traders
- Provides cleaner, more accurate structural points
- Enhances the reliability of support/resistance levels
- Adapts naturally whether you're scalping or swing trading
3. Dynamic Trend Detection (ZigZag Core)
TrenVantage RETAIL includes a clean and efficient ZigZag engine that tracks real structural swings, allowing traders to see trend direction with clarity rather than guessing.
How It Works
- Identifies higher highs, higher lows, lower highs, lower lows
- Uses deviation-based swing filtering
- Smoothly updates trend direction without excessive repainting
- Visually displays structure transitions
How It Helps Traders
- Quickly identifies early trend shifts
- Supports both breakout and pullback strategies
- Helps traders align positions with market structure
- Reduces false signals by focusing on meaningful swings
4. The Status Box Dashboard
The Status Box is your real-time information hub. It reads the current market environment and displays the most essential data in a compact, easy-to-follow format.
What It Shows
- Trend direction
- Price & price change
- SMA position (above/below)
- Nearest support & resistance
- Distance to each level
- Market position: above, below, or between levels
- Count of active S/R zones
- Proximity detection status
How It Helps Traders
- Gives instant situational awareness
- Reduces the need to constantly check chart details
- Helps traders avoid impulsive or uninformed decisions
- Makes multi-timeframe analysis quicker
5. SMA Overlay
The optional SMA is a lightweight trend filter. It adds another layer of clarity without overwhelming the chart.
How It Works
- Plots a standard, adjustable period SMA
- Works as a directional or momentum filter
- Integrates into the status box for quick comparison
How It Helps Traders
- Confirms trend direction
- Adds confluence when combined with levels
- Helps detect momentum shifts early
6. Proximity & Trend Alerts
TrenVantage RETAIL includes clean, actionable alerts that work in real time.
How It Works
- Alerts when price approaches support/resistance within your chosen distance
- Alerts on trend changes (Uptrend / Downtrend)
- Uses once-per-bar logic to avoid excessive notifications
How It Helps Traders
- Removes the need to stare at charts
- Supports breakout, reaction, and reversal strategies
- Ensures traders never miss major structure shifts
🚀 Getting Started (Quick Guide)
1) Add the Indicator to Your Chart
Works instantly on any timeframe or market
2) Adjust the Settings
Toggle S/R, SMA, Alerts, and the Status Box to match your style
3) Watch Key Levels
Red = Key Resistance Levels, Green = Key Support Levels
4) Monitor Status Box
Check Trends, Nearest Levels, SMA Position, and Market Context at a Glance
5) Set Alerts
Enable Trend-Change and Proximity alerts through TradingViews alert menus
📈 Best Practices for TrenVantage RETAIL
🔹Trend Confirmation:
Use the ZigZag trend state and SMA position to confirm whether the market is leaning bullish or bearish.
🔹Level Reactions:
Watch how price behaves as it approaches the nearest S/R line.
Proximity alerts notify you when price is within your chosen distance threshold.
🔹Market Positioning:
The dashboard helps you quickly assess whether price is above all levels, below all levels, or trading between them—useful for breakout and range traders.
🔹Confluence Building:
Combine S/R zones with SMA direction to identify areas of confluence where reactions are more likely.
🔹Chart Clarity Focus:
Since this is the RETAIL version, only the most meaningful three levels are shown at a time—ideal for traders who prefer a clean, structured view.
📌 Disclaimer
This indicator is a technical analysis tool provided for informational and educational purposes only. It does not constitute financial advice, trading advice, or investment recommendations. All trading involves risk, and past performance does not guarantee future results. Always perform your own analysis and use proper risk management. You are solely responsible for any decisions made based on this tool.
If you'd like access or have any questions, feel free to reach out to me directly via DM.

Known Reversals (CreativeAdvance)1 min left to edit script
13 minutes ago
Known Reversals (CreativeAdvance)
Manage access
Add to favorites
Use on chart
0
0
Known Reversals
Non-repainting 1-bar reversal detector
What it does:
Pinpoints the earliest confirmed reversals by detecting a subtle divergence within prevailing momentum. Delivers signals with zero lag and no repaint.
Core logic:
- Monitors directional momentum via highs in uptrends and lows in downtrends
- Activates only when the **close breaks alignment** with that momentum in a single candle
- Proprietary volatility-adjusted oscillator ensures signals fire exclusively in high-probability reversal contexts
Key advantage:
Reveals lower-timeframe reversals the moment they confirm on the current chart — true X-ray vision for precision entries.
Pro tip:
Use with distinct candlestick outline colors to instantly distinguish bullish vs. bearish signals, especially on inside bar reversals (painted uniformly for clarity).
No inputs. No curve-fitting. Just pure, actionable reversal confirmation.

Slope Rank ReversalThis tool is designed to solve the fundamental problem of "buying low and selling high" by providing objective entry/exit signals based on momentum extremes and inflection points.
The System employs three core components:
Trend Detection (PSAR): The Parabolic SAR is used as a filter to confirm that a trend reversal or transition is currently underway, isolating actionable trade setups.
Dynamic Momentum Ranking: The indicator continuously measures the slope of the price action. This slope is then ranked against historical data to objectively identify when an asset is in an extreme state (overbought or oversold).
Signal Generation (Inflection Points):
Oversold/Buy: A 🟢 Green X is generated only when the slope ranking indicates the market is steeply negative (oversold), and the slope value begins to tick upwards (the inflection point), signaling potential mean reversion.
Overbought/Sell: A 🔴 Red X is generated only when the slope ranking indicates the market is steeply positive (overbought), and the slope value begins to tick downwards, signaling momentum exhaustion.
The core philosophy is simple: Enter only when the market is exhausted and has started to turn.

Market Structure Volume Time Velocity ProfileThis is the Market Structure Volume Time Velocity Profile (MSVTVP). It combines event-based profiling with advanced metrics like Time and Velocity (Flow Rate). Instead of fixed time periods, profiles are anchored to critical market events (Swings, Structure Breaks, Delta Breaks), giving you a precise view of value development during specific market phases.
## The 3 Dimensions of the Market
Unlike standard tools that only show Volume, MSVTVP allows you
to switch between three critical metrics:
1. **VOLUME Profile (The "Where"):**
* Shows standard acceptance. High volume nodes (HVN)
are magnets for price.
2. **TIME Profile (The "How Long"):**
* Similar to TPO, it measures how long price spent at each
level.
* **High Time:** True acceptance and fair value.
* **Low Time:** Rejection or rapid movement.
3. **VELOCITY Profile (The "How Fast"):**
* Measures the **speed of trading** (Contracts per Second).
This reveals the hidden intent of market participants.
* **High Velocity (Fast Flow):** Aggression. Initiative
buyers/sellers are hitting market orders rapidly. Often
seen at breakouts or in liquidity vacu.
* **Low Velocity (Slow Flow):** Absorption. Massive passive
limit orders are slowing price down despite high volume.
Often seen at major reversals ("hitting a brick wall").
Key Features:
1. **Event-Based Profile Anchoring:** The indicator starts a new
profile based on one of three user-selected events
('Profile Anchor'):
- **Swing:** A new profile begins when the 'impulse baseline'
(derived from intra-bar delta) changes. This baseline
adjusts when a new **price pivot** is confirmed: When a
price **high** forms, the baseline moves to the **lower**
of its previous level or the peak delta (max of
delta O/C) at the pivot. When a price **low** forms, it
moves to the **higher** of its previous level or the
trough delta (min of delta O/C) at the pivot.
- **Structure:** A new profile begins immediately on the bar
that *confirms* a market structure break (e.g., a new HH
or LL, based on a sequence of price pivots).
- **Delta:** A new profile begins immediately on the bar
that *confirms* a break in the *cumulative delta's*
market structure (e.g., a new HH or LL in the delta).
Both 'Swing' and 'Delta' anchors are derived from the same
**continuous (non-resetting) Cumulative Volume Profile Delta (CVPD)**,
which is built from the intra-bar statistical analysis.
2. **Statistical Profile Engine:** For each bar in the anchored
period, the indicator builds a volume profile on a lower
'Intra-Bar Timeframe'. Instead of simple tick counting, it
uses advanced statistical models:
- **Allocation ('Allot model'):** 'PDF' (Probability Density
Function) distributes volume proportionally across the
bar's range based on an assumed statistical model
(e.g., T4-Skew). 'Classic' assigns all volume to
the close.
- **Buy/Sell Split ('Volume Estimator'):** 'Dynamic'
applies a model that analyzes candle wicks and
recent trend to estimate buy/sell pressure. 'Classic'
classifies all volume based on the candle color.
3. **Visualization & Lag:** The indicator plots the final
profile (as a polygon) and the developing statistical
lines (POC, VA, VWAP, StdDev).
- **Note on Lag:** All anchor events require `Pivot Right Bars`
for confirmation.
- In 'Structure' and 'Delta' mode, the developing lines
(POC, VA, etc.) are plotted using a **non-repainting**
method (showing the value from `pivRi` bars ago).
- In 'Swing' mode, the profile is plotted **retroactively**,
starting *from the bar where the pivot occurred*. The
developing lines are also plotted with this full
`pivRi` lag to align with the past data.
4. **Flexible Display Modes:** The finalized profile can be displayed
in three ways: 'Up/Down' (buy vs. sell), 'Total' (combined
volume), and 'Delta' (net difference).
5. **Dynamic Row Sizing:** Includes an option ('Rows per Percent')
to automatically adjust the number of profile rows (buckets)
based on the profile's price range.
6. **Integrated Alerts:** Includes 13 alerts that trigger for:
- A new profile reset ('Profile was resetted').
- Price crossing any of the 6 developing levels (POC,
VA High/Low, VWAP, StdDev High/Low).
- **Alert Lag Assumption:** In 'Swing' mode, alerts are
delayed to match the retroactively plotted lines.
In 'Structure' and 'Delta' modes, alerts fire in
**real-time** based on the *current price* crossing
the *current (repainting)* value of the metric, which
may **differ from the non-repainting plotted line.**
**Caution: Real-Time Data Behavior (Intra-Bar Repainting)**
This indicator uses high-resolution intra-bar data. As a result, the
values on the **current, unclosed bar** (the real-time bar) will
update dynamically as new intra-bar data arrives. This includes
the values used for real-time alerts in 'Structure' and
'Delta' modes.
---
**DISCLAIMER**
1. **For Informational/Educational Use Only:** This indicator is
provided for informational and educational purposes only. It does
not constitute financial, investment, or trading advice, nor is
it a recommendation to buy or sell any asset.
2. **Use at Your Own Risk:** All trading decisions you make based on
the information or signals generated by this indicator are made
solely at your own risk.
3. **No Guarantee of Performance:** Past performance is not an
indicator of future results. The author makes no guarantee
regarding the accuracy of the signals or future profitability.
4. **No Liability:** The author shall not be held liable for any
financial losses or damages incurred directly or indirectly from
the use of this indicator.
5. **Signals Are Not Recommendations:** The alerts and visual signals
(e.g., crossovers) generated by this tool are not direct
recommendations to buy or sell. They are technical observations
for your own analysis and consideration.

Dynamic Pivot Fibonacci v1.3Advanced Fibonacci Levels & Time Zones
This indicator provides a comprehensive suite for Fibonacci analysis, focusing on both price and time. It is designed for technical analysts who require a highly configurable tool to identify key levels of support, resistance, and temporal market rhythm.
📊 Core Price Level Features
The indicator's primary function is to draw Fibonacci price levels based on one of two user-defined calculation methods:
Pivot-Based Calculation: Automatically detects high/low pivot points using configurable Pivot Left and Pivot Right lookback periods.
Memory-Based Calculation: Identifies the highest high and lowest low over a specified Memory Length (lookback period).
🎨 Display & Customization
13 Configurable Levels: Users can enable, define, and color up to 13 distinct price levels.
Background Fill: Optional color filling between levels for enhanced visual clarity.
Line Extension: Full control over line drawing, including extending lines to the left, right, or both (either indefinitely or for a limited number of bars).
Historical Deletion: Option to automatically delete previous Fibonacci lines when a new range is detected.
⏳ Additional Analysis Tools
Fibonacci Time Zones: Renders vertical time markers based on the Fibonacci sequence, projected from the selected pivot points. This feature is designed to help identify potential turning points in time.
Trend Analysis (SMMA): Includes an optional module to display multiple Smoothed Moving Averages (SMMA) and an aggregate trend line, assisting in contextual market analysis.
🇮🇷 توضیحات فارسی
سطوح پیشرفته فیبوناچی و مناطق زمانی
این اندیکاتور مجموعهای جامع برای تحلیلهای فیبوناچی، با تمرکز همزمان بر قیمت و زمان، ارائه میدهد. این ابزار برای تحلیلگران فنی طراحی شده است که نیازمند ابزاری با قابلیت تنظیمات بالا جهت شناسایی سطوح کلیدی حمایت، مقاومت و ریتم زمانی بازار هستند.
📊 ویژگیهای اصلی سطوح قیمتی
عملکرد اصلی این اندیکاتور، ترسیم سطوح قیمتی فیبوناچی بر اساس یکی از دو متد محاسباتی قابل تعریف توسط کاربر است:
محاسبه مبتنی بر پیوت (Pivot-Based): به صورت خودکار نقاط پیوت سقف و کف را بر اساس دورههای بازبینی (Lookback) قابل تنظیم (Pivot Left و Pivot Right) شناسایی میکند.
محاسبه مبتنی بر حافظه (Memory-Based): بالاترین سقف و پایینترین کف را در یک طول حافظه (دوره بازبینی) مشخص، پیدا میکند.
🎨 نمایش و سفارشیسازی
۱۳ سطح قابل تنظیم: کاربران میتوانند تا ۱۳ سطح قیمتی مجزا را فعال، تعریف و رنگآمیزی کنند.
پُر کردن پسزمینه (Fill): قابلیت اختیاری پُر کردن فضای بین سطوح با رنگ، برای افزایش وضوح بصری.
امتداد خطوط: کنترل کامل بر ترسیم خطوط، شامل امتداد دادن به سمت چپ، راست یا هر دو طرف (به صورت نامحدود یا برای تعداد کندلهای معین).
حذف سطوح گذشته: گزینهای برای حذف خودکار خطوط فیبوناچی قبلی به هنگام شناسایی یک محدوده جدید.
⏳ ابزارهای تحلیلی جانبی
مناطق زمانی فیبوناچی (Fib Time Zones): نشانگرهای زمانی عمودی را بر اساس دنباله فیبوناچی ترسیم میکند که از نقاط پیوت منتخب، پروجکت (project) شدهاند. این ویژگی برای کمک به شناسایی نقاط عطف احتمالی در بستر زمان طراحی شده است.
تحلیل روند (SMMA): شامل یک ماژول اختیاری برای نمایش چندین میانگین متحرک هموارشده (SMMA) و یک خط روند کلی، جهت کمک به تحلیل زمینه بازار.

Reversals & Pullbacks PRO🚀 Reversals & Pullbacks Pro — Predict Market Turning Points with Precision
Stop chasing trends — start anticipating them.
The Reversals & Pullbacks Pro indicator identifies high-probability reversal and pullback zones before they happen, using advanced mean reversion logic and momentum change signals.
What it does:
✅ Detects major reversals and minor pullbacks in real time
✅ Uses dynamic mean reversion algorithms to spot over-extended price moves
✅ Highlights premium entry zones for counter-trend and trend-reversal setups
✅ Works across many markets — Designed for Forex and Indices but can be used on Crypto
✅ Clean visuals with smart alerts (no repainting after candle close)
💡 Perfect for:
Swing traders, scalpers, and day traders who want to catch price turning points before everyone else.
⏱️ Don’t react — predict.
Upgrade your trading with Reversals & Pullback Pro and trade market reversals like a PRO!

Range Trading StrategyOVERVIEW
The Range Trading Strategy is a systematic trading approach that identifies price ranges
from higher timeframe candles or trading sessions, tracks pivot points, and generates
trading signals when range extremes are mitigated and confirmed by pivot levels.
CORE CONCEPT
The strategy is based on the principle that when a candle (or session) closes within the
range of the previous candle (or session), that previous candle becomes a "range" with
identifiable high and low extremes. When price breaks through these extremes, it creates
trading opportunities that are confirmed by pivot levels.
RANGE DETECTION MODES
1. HTF (Higher Timeframe) Mode:
Automatically selects a higher timeframe based on the current chart timeframe
Uses request.security() to fetch HTF candle data
Range is created when an HTF candle closes within the previous HTF candle's range
The previous HTF candle's high and low become the range extremes
2. Sessions Mode:
- Divides the trading day into 4 sessions (UTC):
* Session 1: 00:00 - 06:00 (6 hours)
* Session 2: 06:00 - 12:00 (6 hours)
* Session 3: 12:00 - 20:00 (8 hours)
* Session 4: 20:00 - 00:00 (4 hours, spans midnight)
- Tracks high, low, and close for each session
- Range is created when a session closes within the previous session's range
- The previous session's high and low become the range extremes
PIVOT DETECTION
Pivots are detected based on candle color changes (bullish/bearish transitions):
1. Pivot Low:
Created when a bullish candle appears after a bearish candle
Pivot low = minimum of the current candle's low and previous candle's low
The pivot bar is the actual bar where the low was formed (current or previous bar)
2. Pivot High:
Created when a bearish candle appears after a bullish candle
Pivot high = maximum of the current candle's high and previous candle's high
The pivot bar is the actual bar where the high was formed (current or previous bar)
IMPORTANT: There is always only ONE active pivot high and ONE active pivot low at any
given time. When a new pivot is created, it replaces the previous one.
RANGE CREATION
A range is created when:
(HTF Mode) An HTF candle closes within the previous HTF candle's range AND a new HTF
candle has just started
(Sessions Mode) A session closes within the previous session's range AND a new session
has just started
Or Range Can Be Created when the Extreme of Another Range Gets Mitigated and We Have a Pivot low Just Above the Range Low or Pivot High just Below the Range High
Range Properties:
rangeHigh: The high extreme of the range
rangeLow: The low extreme of the range
highStartTime: The timestamp when the range high was actually formed (found by looping
backwards through bars)
lowStartTime: The timestamp when the range low was actually formed (found by looping
backwards through bars)
highMitigated / lowMitigated: Flags tracking whether each extreme has been broken
isSpecial: Flag indicating if this is a "special range" (see Special Ranges section)
RANGE MITIGATION
A range extreme is considered "mitigated" when price interacts with it:
High is mitigated when: high >= rangeHigh (any interaction at or above the level)
Low is mitigated when: low <= rangeLow (any interaction at or below the level)
Mitigation can happen:
At the moment of range creation (if price is already beyond the extreme)
At any point after range creation when price touches the extreme
SIGNAL GENERATION
1. Pending Signals:
When a range extreme is mitigated, a pending signal is created:
a) BEARISH Pending Signal:
- Triggered when: rangeHigh is mitigated
- Confirmation Level: Current pivotLow
- Signal is confirmed when: close < pivotLow
- Stop Loss: Current pivotHigh (at time of confirmation)
- Entry: Short position
Signal Confirmation
b) BULLISH Pending Signal:
- Triggered when: rangeLow is mitigated
- Confirmation Level: Current pivotHigh
- Signal is confirmed when: close > pivotHigh
- Stop Loss: Current pivotLow (at time of confirmation)
- Entry: Long position
IMPORTANT: There is only ever ONE pending bearish signal and ONE pending bullish signal
at any given time. When a new pending signal is created, it replaces the previous one
of the same type.
2. Signal Confirmation:
- Bearish: Confirmed when price closes below the pivot low (confirmation level)
- Bullish: Confirmed when price closes above the pivot high (confirmation level)
- Upon confirmation, a trade is entered immediately
- The confirmation line is drawn from the pivot bar to the confirmation bar
TRADE EXECUTION
When a signal is confirmed:
1. Position Management:
- Any existing position in the opposite direction is closed first
- Then the new position is entered
2. Stop Loss:
- Bearish (Short): Stop at pivotHigh
- Bullish (Long): Stop at pivotLow
3. Take Profit:
- Calculated using Risk:Reward Ratio (default 2:1)
- Risk = Distance from entry to stop loss
- Target = Entry ± (Risk × R:R Ratio)
- Can be disabled with "Stop Loss Only" toggle
4. Trade Comments:
- "Range Bear" for short trades
- "Range Bull" for long trades
SPECIAL RANGES
Special ranges are created when:
- A range high is mitigated AND the current pivotHigh is below the range high
- A range low is mitigated AND the current pivotLow is above the range low
In these cases:
- The pivot value is stored in an array (storedPivotHighs or storedPivotLows)
- A "special range" is created with only ONE extreme:
* If pivotHigh < rangeHigh: Creates a range with rangeHigh = pivotLow, rangeLow = na
* If pivotLow > rangeLow: Creates a range with rangeLow = pivotHigh, rangeHigh = na
- Special ranges can generate signals just like normal ranges
- If a special range is mitigated on the creation bar or the next bar, it is removed
entirely without generating signals (prevents false signals)
Special Ranges
REVERSE ON STOP LOSS
When enabled, if a stop loss is hit, the strategy automatically opens a trade in the
opposite direction:
1. Long Stop Loss Hit:
- Detects when: position_size > 0 AND position_size <= 0 AND low <= longStopLoss
- Action: Opens a SHORT position
- Stop Loss: Current pivotHigh
- Trade Comment: "Reverse on Stop"
2. Short Stop Loss Hit:
- Detects when: position_size < 0 AND position_size >= 0 AND high >= shortStopLoss
- Action: Opens a LONG position
- Stop Loss: Current pivotLow
- Trade Comment: "Reverse on Stop"
The reverse trade uses the same R:R ratio and respects the "Stop Loss Only" setting.
VISUAL ELEMENTS
1. Range Lines:
- Drawn from the time when the extreme was formed to the mitigation point (or current
time if not mitigated)
- High lines: Blue (or mitigated color if mitigated)
- Low lines: Red (or mitigated color if mitigated)
- Style: SOLID
- Width: 1
2. Confirmation Lines:
- Drawn when a signal is confirmed
- Extends from the pivot bar to the confirmation bar
- Bearish: Red, solid line
- Bullish: Green, solid line
- Width: 1
- Can be toggled on/off
STRATEGY SETTINGS
1. Range Detection Mode:
- HTF: Uses higher timeframe candles
- Sessions: Uses trading session boundaries
2. Auto HTF:
- Automatically selects HTF based on current chart timeframe
- Can be disabled to use manual HTF selection
3. Risk:Reward Ratio:
- Default: 2.0 (2:1)
- Minimum: 0.5
- Step: 0.5
4. Stop Loss Only:
- When enabled: Trades only have stop loss (no take profit)
- Trades close on stop loss or when opposite signal confirms
5. Reverse on Stop Loss:
- When enabled: Hitting a stop loss opens opposite trade with stop at opposing pivot
6. Max Ranges to Display:
- Limits the number of ranges kept in memory
- Oldest ranges are purged when limit is exceeded
KEY FEATURES
1. Dynamic Pivot Tracking:
- Pivots update on every candle color change
- Always maintains one high and one low pivot
2. Range Lifecycle:
- Ranges are created when price closes within previous range
- Ranges are tracked until mitigated
- Mitigation creates pending signals
- Signals are confirmed by pivot levels
3. Signal Priority:
- Only one pending signal of each type at a time
- New signals replace old ones
- Confirmation happens on close of bar
4. Position Management:
- Closes opposite positions before entering new trades
- Tracks stop loss levels for reverse functionality
- Respects pyramiding = 1 (only one position per direction)
5. Time-Based Drawing:
- Uses time coordinates instead of bar indices for line drawing
- Prevents "too far from current bar" errors
- Lines can extend to any historical point
USAGE NOTES
- Best suited for trending and ranging markets
- Works on any timeframe, but HTF mode adapts automatically
- Sessions mode is ideal for intraday trading
- Pivot detection requires clear candle color changes
- Range detection requires price to close within previous range
- Signals are generated on bar close, not intra-bar
The strategy combines range identification, pivot tracking, and signal confirmation to
create a systematic approach to trading breakouts and reversals based on price structure, past performance does not in any way predict future performance

Adaptive CE-VWAP Breakout Framework [KedArc Quant]Description
A structured framework that unites three complementary systems into one charting engine:
Chandelier Exit (CE) – ATR-based trailing logic that defines trend direction, stop placement, and risk/reward overlays.
Swing-Anchored VWAP (SWAV) – a dynamically anchored VWAP that re-starts from each confirmed swing and adapts its smoothness to volatility.
Pivot S/R with Volume Breaks – confirmed horizontal levels with alerts when broken on expanding volume.
This script builds a single workflow for bias → trigger → managementwithout mixing unrelated indicators. Each module is internally linked rather than layered cosmetically, making it a true analytical framework—not.
Acknowledgment
Special thanks to Dynamic Swing Anchored VWAP by Zeiierman, whose swing-anchoring concept inspired a part of the SWAV module’s implementation and adaptation logic.
Support and Resistance Levels with Breaks by LuxAlgo for S/R breakout logic.
How this helps traders
Trend clarity – CE color-codes direction and provides evolving stops.
Context value – SWAV traces adaptive mean paths so traders see where price is heavy or light.
Action filter – Pivot+volume logic highlights true structural breaks, filtering false moves.
Discipline tool – Optional R:R boxes visualize risk and target zones to enforce planning.
Entry / Exit guidelines (for study purposes only)
Bias Use CE direction: green = long bias red = short bias
Entry
1. Breakout method– Trade in CE direction when a pivot level breaks on valid volume.
2. VWAP confirmation– Prefer breaks occurring around the nearest SWAV path (fair-value cross or re-test).
Exit
Stop = CE line / recent swing HL / ATR × (multiplier)
Target = R-multiple × risk (default 2 R)
Optional live update keeps SL/TP aligned with current CE state.
Core formula concepts
ATR Stop: Stop = High/Low – ATR × multiplier
VWAP calc: Σ(price × vol) / Σ(vol) anchored at swing pivot, adapted by APT (Adaptive Price Tracking) ratio ∝ ATR volatility.
Volume oscillator: 100 × (EMA₅ – EMA₁₀)/EMA₁₀; valid break when threshold %.
Input configuration (high-level)
Master Controls
Show CE / SWAV modules Theme & Fill opacity
CE Section
ATR period & multiplier Use Close for extremums
Show buy/sell labels Await bar confirmation
Risk-Reward overlay: R-multiple, Stop basis (CE/Swing/ATR×), Live update toggle
SWAV Section
Swing period Adaptive Price Tracking length Volatility bias (ATR-based adaptation) Line width
Pivot & Volume Breaks
Left/Right bar windows Volume threshold % Show Break labels and alerts
Best timeframes
Intraday: 5 m – 30 m for breakout confirmation
Swing: 1 h – 4 h for trend context
Settings scale with instrument volatility—adjust ATR period and volume threshold to match liquidity.
Glossary
ATR: Average True Range (volatility metric)
CE: Chandelier Exit (trailing stop/trend filter)
SWAV: Swing-Anchored VWAP (anchored mean price path)
Pivot H/L: Confirmed local extrema using left/right bar windows
R-multiple: Profit target as a multiple of initial risk
FAQ
Q: Does it repaint? A: No—pivots wait for confirmation and VWAP updates forward-only.
Q: Can modules be disabled? A: Yes—each section has its own toggle.
Q: Can it trade automatically? A: This is an indicator/study, not an auto-strategy.
Q: Is this financial advice? A: No—educational use only.
Disclaimer
This script is for educational and analytical purposes only.
It is not financial advice. Trading involves risk of loss. Past performance does not guarantee future results. Always apply sound risk management.

Clean CPR for Intraday, Swing trading✅ Clean CPR for Intraday & Swing Trading (NSE-Optimized)
Simple, Accurate, No-Clutter CPR levels for NIFTY, BANKNIFTY, FINNIFTY & Stocks
Perfect for Indian intraday & swing traders who want clean charts, reliable zones, and fast decision-making without overcomplicated indicators.
✅ 📌 Short Summary
This indicator plots Previous Day High/Low, CPR, Support & Resistance, and high-probability shaded zones (PH↔R1 & PL↔S1). It’s built specifically to help Indian traders identify reversal zones, breakout levels, and trend direction quickly — without chart noise or unnecessary lines.
✅ 🔍 What This CPR Indicator Does
A clean, beginner-friendly version of CPR built for practical trading in NSE markets.
1️⃣ Previous Day High & Low (PH / PL)
Plots yesterday’s high & low with price labels
These act as powerful reference levels used heavily in Indian intraday setups
Helps spot opening range breakouts, rejections, and pullback entries
2️⃣ Central Pivot Range (CPR)
CPR gives the market structure for the day
Price above CPR → Bullish bias
Price below CPR → Bearish bias
Narrow CPR → Possible trending day
Wide CPR → Likely sideways market
This is especially useful in NIFTY, BANKNIFTY, which reacts strongly to CPR width.
3️⃣ Support & Resistance Levels (R1 / S1)
Plots the first major resistance and support levels
You can plot R1 to R5, S1 to S5
Each Line can be same or different color as per your choice
4️⃣ Smart Shaded Zones (High-Probability Areas)
These shaded blocks highlight the most important reversal zones:
✅ Resistance Zone → Area between PH and R1
✅ Support Zone → Area between PL and S1
These zones often act as:
Bounce areas
Reversal regions
Ideal trade entry/exit points
Especially powerful when combined with opening range & volume spikes.
5️⃣ Current Day Open Line
Shows the opening price of today, a key reference for:
Trend confirmation
Intraday bias
Opening drive setups
6️⃣ Clean Design — No Clutter
Old historic zones are automatically removed
Only the useful previous session zones remain
All prices shown as whole numbers (no decimals)
Clear labels, clean zones, easy to read even on mobile
✅ Why This Is Perfect for Indian Traders
This indicator is optimized for:
NIFTY Futures / Options
BANKNIFTY Futures / Options
FINNIFTY
NSE Stocks
Index scalping & options trading
Indian intraday traders rely heavily on:
Previous Day High/Low
CPR width
R1/S1 reactions
Day Open behavior
PH↔R1 reversal zones
PL↔S1 support zones
This tool highlights all of them automatically, without crowding your chart.
✅ Who Should Use This
✔ New traders
✔ Intraday scalpers
✔ Swing traders
✔ Option buyers/sellers
✔ Anyone who wants a clean CPR layout without confusing extras
✅ Benefits
Clear bullish/bearish bias
High-precision reversal zones
Better entries/exits
Faster chart reading
No overthinking — the zones show themselves

The 5-min StratOverview
The 5-min Strat Indicator V1 is a precision tool designed for intraday futures trading on instruments such as MNQ, MES, and other U.S. equity index futures. It marks out critical levels from Pre-Market and Regular Trading Hours (RTH) to support breakout, reversal, and trend-following strategies.
This indicator includes:
Previous Day High (PDH) and Low (PDL) from RTH session only (9:30 AM to 4:00 PM EST)
Pre-Market High (PMH) and Low (PML) from 4:00 AM to 9:30 AM EST
48 EMA and 200 EMA
Clean, right-aligned labels for each key level
⏱️ Intended Timeframe
✅ 5-minute timeframe ONLY
❌ Not designed for 1-min, 15-min, or higher timeframes
Built using 5-min data to precisely define Pre-Market and RTH levels
🌐 Markets
Futures contracts like:
MNQ (Micro Nasdaq)
MES (Micro S&P)
NQ, ES (standard contracts)
Can be adapted for stocks or ETFs, but built around futures session logic
📌 Key Sessions
Pre-Market Session: 04:00 AM to 09:30 AM EST
PMH/PML captured in real time
Locked after 09:30 AM
Regular Trading Hours (RTH): 09:30 AM to 4:00 PM EST
PDH/PDL captured only from this time window
Locks at end of day and displays the next session
🚨 Non-Negotiables / Must-Know Constraints
Feature Constraint
Timeframe Must be used on 5-minute charts
Timezone All sessions are based on EST (New York)
Symbol Type Built and tested for futures like MNQ/MES
Pre-Market Lock PMH/PML are only locked after 9:30 AM EST
RTH Data PDH/PDL ignore overnight sessions — only 9:30–16:00
Labels Automatically reset each day and appear on the price axis
🎯 Usage Tips
Combine with price action at these levels for breakouts or fades
Use the EMAs for directional bias
Great for layering onto automated strategy logic (strategy version available)

Daily Pivot Breakout Strategy IndicatorTagline:
A pivot-based breakout system that identifies confirmed daily breakouts with momentum and volume filters, with precise entry timing across all timeframes.
How It Works:
This indicator detects strict pivot high breakouts on daily data, filtered by Rate of Change (ROC ≥30%) and Relative Volume (RVOL >1). It displays both the breakout confirmation signal and the next-day entry signal directly on your chart, regardless of timeframe.
Visual Signals:
Orange Pivot Line: The most recent confirmed pivot high (within 250-day lookback)
Day-0 Label (Teal): Appears on the breakout confirmation day (when price closes above daily pivot with filters met)
Entry Banner (Green): Appears on the next trading day at market open - your actual entry point
Cross-Timeframe Consistency:
Daily Chart: View the big picture - Day-0 on breakout bar, Entry on next bar
Any Timeframe: Logic remains consistent to daily pivots and data, signals adapt to show at the correct time
Built-in Alert Conditions:
5PivotBreakout_Scan (Day-0): Fires when breakout is confirmed. Use this for after-hours scanning to build watchlists of confirmed breakouts
5PivotBreakout_Strategy (Next): Fires at market open the next day. Use this to automate entries on confirmed breakouts
Typical Workflow:
Set up Day-0 alerts on your watchlist to catch breakouts as they happen
Review confirmed breakouts each evening
Set up Entry alerts on selected tickers to automate next-day execution (fires at market open)
Optional: Convert to strategy() for backtesting with custom exits (20% trail is good)
Key Features:
Strict pivot detection: No ties allowed - center must be highest point
Momentum filter: 100-day ROC ensures trending strength
Volume confirmation: 20-day RVOL validates participation
No repainting: Uses lookahead_off for realistic, tradeable signals
Customizable Inputs:
Pivot strength parameters (left/right bars)
Pivot lookback period
ROC period and minimum threshold
RVOL period
Toggle visibility of pivot line and labels
Note: This indicator is for educational purposes only and does not constitute financial advice. Past performance does not guarantee future results. Always test thoroughly before live trading.

[FS] Pivot Measurements# Pivot Measurements
An advanced TradingView indicator that combines LuxAlgo's pivot point detection algorithm with automatic measurement calculations between consecutive pivots.
## Features
### Pivot Detection
- **Regular Pivots**: Detects standard pivot highs and lows using configurable pivot length
- **Missed Pivots**: Identifies missed reversal levels that occurred between regular pivots
- **Visual Indicators**:
- Regular pivot highs: Red downward triangle (▼)
- Regular pivot lows: Teal upward triangle (▲)
- Missed pivots: Ghost emoji (👻)
- **Zigzag Lines**: Connects pivots with colored lines (solid for regular, dashed for missed)
- **Ghost Levels**: Horizontal lines indicating missed pivot levels
### Measurement System
- **Automatic Measurements**: Calculates price movements between consecutive pivots
- **Visual Display**:
- Transparent colored boxes (blue for upward, red for downward movements)
- Measurement labels showing:
- Price change (absolute and percentage)
- Duration (bars, days, hours, minutes)
- Volume approximation
- **Smart Positioning**: Labels positioned outside boxes (above for upward, below for downward)
- **Color Coding**: Blue for positive movements, red for negative movements
## Parameters
### Pivot Detection
- **Pivot Length** (default: 50): Number of bars on each side to identify a pivot point
- **Regular Pivots**: Toggle and colors for regular pivot highs and lows
- **Missed Pivots**: Toggle and colors for missed pivot detection
### Measurements
- **Number of Measurements** (1-10, default: 10): Maximum number of measurements to display
- **Show Measurement Boxes**: Toggle to show/hide measurement boxes and labels
- **Box Transparency** (0-100, default: 90): Transparency level for measurement boxes
- **Border Transparency** (0-100, default: 50): Transparency level for box borders
- **Label Background Transparency** (0-100, default: 30): Transparency level for label backgrounds
- **Label Size**: Size of measurement labels (tiny, small, normal, large)
## Usage
1. Add the indicator to your chart
2. Configure the **Pivot Length** based on your timeframe:
- Lower values for shorter timeframes (e.g., 10-20 for 1-5 min)
- Higher values for longer timeframes (e.g., 50-100 for daily)
3. Adjust pivot colors and visibility as needed
4. Customize measurement display settings:
- Set the number of measurements to display
- Adjust transparency levels for boxes, borders, and labels
- Choose label size
## Technical Details
- **Pine Script Version**: v6
- **Pivot Detection**: Based on () algorithm for detecting regular and missed pivots
- **Measurement Calculation**:
- Measures between consecutive pivots (from most recent to older)
- Calculates price change, percentage change, duration, and approximate volume
- Automatically sorts pivots chronologically
- **Performance**: Optimized with helper functions to reduce code duplication
## Notes
- The indicator automatically limits the number of stored pivots to optimize performance
- Measurements are only created when there are at least 2 pivots detected
- All measurements are recalculated on each bar update
- The indicator uses `max_bars_back=5000` to ensure sufficient historical data
## License
This indicator uses LuxAlgo's pivot detection algorithm from (). Please refer to the original LuxAlgo license for pivot detection components.
