HTF Candles: 3x Multi-Timeframe Candle Boxes #Pip-Whisperer
- Modify 3 Timeframes to display Candle Boxes over your Chart
- Thats it.
- Enjoy!
- If anyone implements candlestick pattern detection to this before me, please send me link, that would be sick!
Cari dalam skrip untuk "candle"

MTF Stochastic Zones w/ Candle and Swing Hi/Lo IndicatorsMTF Stochastic Zones w/ Candle and Swing Hi/Lo Indicators by // © KaizenTraderB
This indicator will display the Stochastic RSI as color zones utilizing 3 Timeframes of your choice as well as key reversal candles:
Entry Timeframe StochRSI Crossovers and Long Wick Reversal Candles (Hammer and Hanging Man) and Engulfing Candles
That correlate with Swing Highs and Lows.
When the higher timeframe is bullish it will be green and when bullish, red.
When the middle timeframe is counter the higher, it will appear brownish.
The entry timeframe will print Candle Labels and Swing Highs and Lows at bullish and bearish Stochastic RSI crossovers when oversold and overbought, respectively,
In the direction of the higher timeframe directional bias when the middle timeframe is counter that direction to catch reversals in corrections.
(It also prints Bull/Bear StochRSI Crossovers that correlated with Swing Highs and Lows that are not Hammers, Hanging Men or Engulfing Candles.)
The options allow you to turn the zones, swing highs and lows, candle indicators and entry StochRSI Crossovers on and off, as well as which Timeframes you choose to view.
Entry - 1Hr, 15m, 5m or 1m Middle Timeframe - Daily, 4Hr, 1Hr or 15m Higher Timeframe - Monthly, Weekly, Daily, 4Hr or 1Hr
You can change the Swing High and Low Lookback periods, as well as
The Stochastic RSI Lookback for each of the three timeframes and the level of Overbought and Oversold:
When 8 is chosen for RSI Lookback, Stochastic Lookback = 5, SmoothK = 3, Smooth D = 3 For 13 - 8, 5, 5 For 21 - 13, 8, 8 For 34 - 21, 13, 13
Its good practice to adjust settings so Higher Timeframe zones (green/red) correlate with longer trend movements,
Medium Timeframe with corrections and reversal areas (brown) and Entry Timeframe with key reversal candles.
For example, to adjust the Daily Higher Timeframe, turn the Higher Timeframe to Daily, turn off the others and bring up the Daily Chart.
Look at chart for last 200 bars or so and go through the different settings until you find the one that best correlates with recent past price action.
Do the same procedure for the Middle and Entry Timeframe. Once all the settings are how you prefer, view the Indicator on the Entry Timeframe to find trades.
Coding included to prevent repainting
Can be used in conjunction with the MTF Stochastic RSI w/ Zones which is displayed in the lower panel.
Need the same settings in both indicators for them to correlate or use different settings for different views,
Message me with feedback to improve upon this indicator or requested additions.
I will soon be releasing a Strategy based on this indicator!

M.Right Candlestick Patterns & Bulkowski Percentages 1.0Hello Traders!
As a fan of Bulkowski, I figured I'd release this for everyone's benefit as well.
The legendary candlestick pattern expert, Thomas Bulkowski, has over 35 years of trading and analysis experience and is the absolute go-to expert when it comes to candlestick pattern identification.
Bulkowski Candlestick Percentages from his site and books.
Source: Built in "All Candlestick Patterns"
In this version,
--> Added 8 Candles and removed some that are statistically insignificant and others that Bulkowski doesn't use (can add back if requested).
--> Added 2 Colors for Bullish and Bearish Continuations.
----> Assigned Colors Tested performance to Continuations.
--> Built-in Variables and Candles adjusted slightly to conform to Bulkowski pattern principles.
--> Moved inputs back to ABC order.
--> Decided to leave the theoretical performance positioning for the signal (i.e. Top for theoretically bearish ). However..
----> I adjusted the signal color to match Bulkowski's tested performance.
--> Removed Plot Close (obsolete)
--> Hover over signal to see both Theoretical and Tested Performance.
Figured I'd help give an edge to the @TradingView Community like so many before me have been able to.
Please feel free to add comments, share insight, and of course, like!
Cheers,
Mike

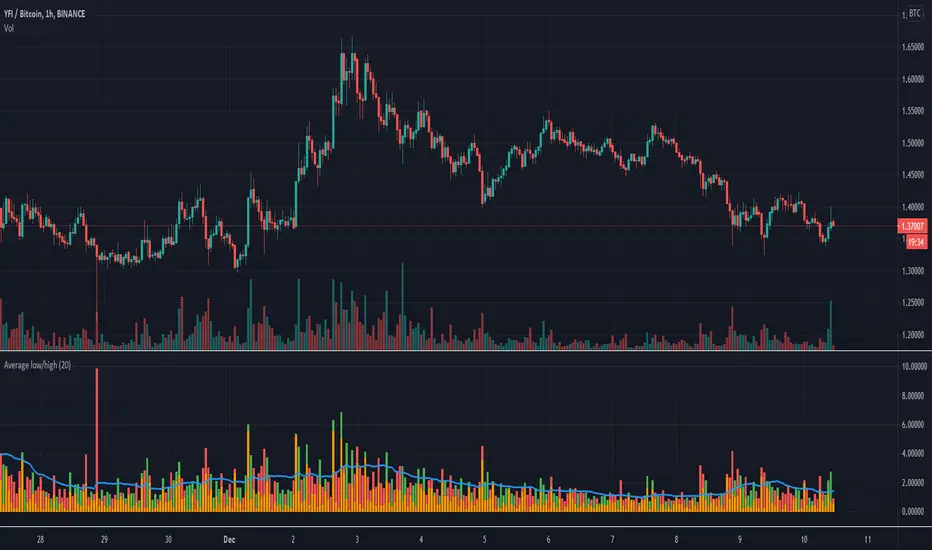
Candle Height in Percentage - ColumnsThis indicator calculates the difference in percentage between lows and highs of a candle. The orange bars show the height of the candle body (open/close) and the red/green on top show the percentage of the wicks (high/low). This assists in understanding the volatility of an asset. Showing this in percentages is more helpful in crypto. It also shows the Simple Moving Average of this data with the blue line.
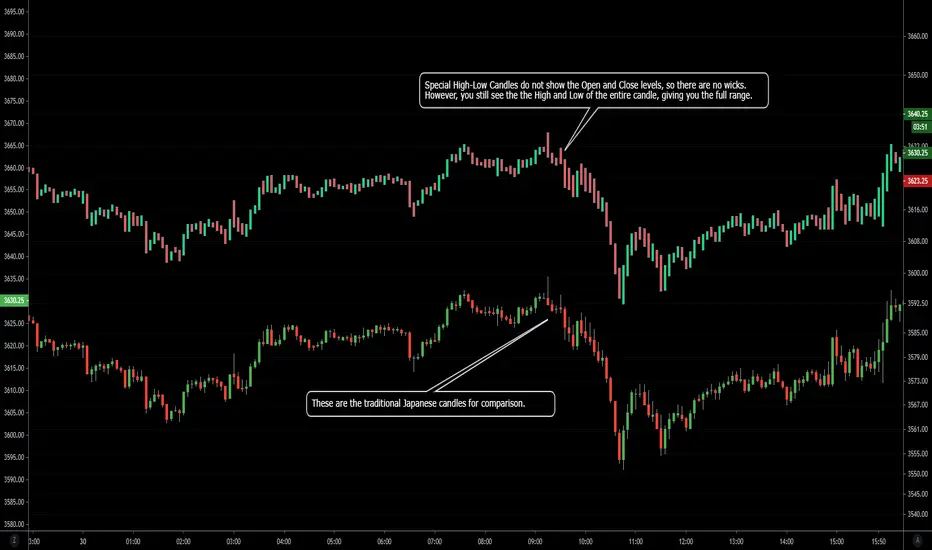
NSDT Special High-Low CandlesThis is an interesting take on candlesticks. These special High-Low Candles do not show the Open and Close levels, so there are no wicks. However, you still see the the High and Low of the entire candle, giving you the full range.
Since this is an indicator, be sure to hide the chart candles to avoid overlap. Or choose offsetting colors to see the traditional candles under the indicator candles.
Candle Patterns Ver.2When someone decided to start trading the first thing we learn is how to read and understand the candlesticks. This little "boxes" with sticks tell us how the market sentiment and they can be used to "predict" future moves. I put predict inside a quotation marks because I would say predict the market is almost an utopia and we all know the reason.
Anyway with a good understand in reading the candlesticks with other indicators(like momentum or even a MA) can give us some edge when analyzing an instrument.
Since we have a lot of candlesticks types I did some back test and figured out that for my strategy that three candlestick types works very well. I will briefly describe then.
Engulfing Bar
This type of candlestick shows us a potential reversal based on the previous bar.
A bullish Engulfing has the close higher than the open it works better if the previous one is a bearish bar(open higher than close) and it is at a Support level. The body of the Engulfing bar should "engulf" the full body of the previous bar. If all parameters(previous bearish bar at Support level after a downtrend move) this Engulfing will represents a reversal move. When I say reversal it could means a pullback reversal(if the past trend is downtrend) or if the previous downtrend is a pullback from a past uptrend. In any way the previous bearish followed by an bullish Engulfing in general leads for an upward move.
The same picture applies to a previous bullish bar followed by an bearish Engulfing bar that if appears at the Resistance level will lead to a downward move.
One thing that is worth to mention is in a downward(or upward) move we have a small bullish bar followed by a bullish Engulfing this situation may lead to a continuation, not reversal.
Pinbar Bar:
This is another candlestick type that represents possible reversal. The Pinbar candle show a small(or medium) size but the important part is the size of the stick. If the stick is the upper one and has the size of 2 times the size of the body, it is a bearish bars and it appears after an uptrend move it represents that the buyers are losing momentum so we can expect a reversal move. When this type of bar appears after a downward move, it is a bullish bars but the stick is the lower one and has the size of two times of the body it will represents a bullish reversal. In this picture this candle is called a "Hammer".
So based on that I develop an indicator that shows me these 2 bars types and makes easy to identify with the other indicator possible entries.
Please feel free for a constructive comments and hope it help any one whe trading. Candlestick are the fundamentals of Price action.
You all have a great trading new week.

CFR - Candle Formation RatioDescription
This indicator is designed to detect candles with small bodies and significant wick-to-body ratios, often useful for identifying doji-like structures and potential accumulation areas.
Features
Filter candles by maximum body size (% of the total candle range).
Require that wicks are at least X times larger than the body.
Define the position of the body within the candle (e.g., body must be between 40% and 60% of the candle height).
Visual output: a single arrow marker when conditions are met.
Fully customizable marker color and size.
⚠️ Note: The settings of this version are currently in Turkish. An English version of the settings will be released in the future.

Liquidity Sweep Candlestick Pattern with MA Filter📌 Liquidity Sweep Candlestick Pattern with MA Filter
This custom indicator detects liquidity sweep candlestick patterns—price action events where the market briefly breaks a previous candle’s high or low to trap traders—paired with optional filters such as moving averages, color change candles, and strictness rules for better signal accuracy.
🔍 What is a Liquidity Sweep?
A liquidity sweep occurs when the price briefly breaks the high or low of a previous candle and then reverses direction. These events often occur around key support/resistance zones and are used by institutional traders to trap retail positions before moving the price in the intended direction.
🟢 Bullish Liquidity Sweep Criteria
The current candle is bullish (closes above its open).
The low of the current candle breaks the low of the previous candle.
The candle closes above the previous candle’s open.
Optionally, in Strict mode, it must also close above the previous candle’s high.
Optionally, it can be filtered to only show if the candle changed color from the previous one (e.g., red to green).
Can be filtered to only show when the price is above or below a moving average (if MA filter is enabled).
🔴 Bearish Liquidity Sweep Criteria
The current candle is bearish (closes below its open).
The high of the current candle breaks the high of the previous candle.
The candle closes below the previous candle’s open.
Optionally, in Strict mode, it must also close below the previous candle’s low.
Optionally, it can be filtered to only show if the candle changed color from the previous one (e.g., green to red).
Can be filtered to only show when the price is above or below a moving average (if MA filter is enabled).
⚙️ Features & Customization
✅ Signal Strictness
Choose between:
Less Strict (default): Basic wick break and close conditions.
Strict: Must close beyond the wick of the previous candle.
✅ Color Change Candles Only
Enable this to only show patterns when the candle color changes (e.g., from red to green or green to red). Helps filter fake-outs.
✅ Moving Average Filter (optional)
Supports several types of MAs: SMA, EMA, WMA, VWMA, RMA, HMA
Choose whether signals should only appear above or below the selected moving average.
✅ Custom Visuals
Show short (BS) or full (Bull Sweep / Bear Sweep) labels
Plot triangles or arrows to represent bullish and bearish sweeps
Customize label and shape colors
Optionally show/hide the moving average line
✅ Alerts
Includes alert options for:
Bullish sweep
Bearish sweep
Any sweep
📈 How to Use
Add the indicator to your chart.
Configure the strictness, color change, or MA filters based on your strategy.
Observe signals where price is likely to reverse after taking out liquidity.
Use with key support/resistance levels, order blocks, or volume zones for confluence.
⚠️ Note
This tool is for educational and strategy-building purposes. Always confirm signals with other indicators, context, and sound risk management.

Big Candles FilterHow It Works
A candle is considered "big" only if its body (distance from open to close) exceeds the barHeight value.
** NOT calculated by Range !!!
Features :
Bullish candles (close > open) are marked with a green "Buy" triangle if the body is large enough.
Bearish candles (close < open) are marked with a red "Sell" triangle if the body is large enough.
The bars are colored for big candles, and optional labels show the open and close prices.

Change Candle Color When 5 EMA Not ConnectedThis custom TradingView indicator changes the color of candlesticks to yellow whenever the 5-period Exponential Moving Average (EMA) is not "connected" to the current candle.
How It Works:
The 5 EMA is calculated based on the closing prices of the last 5 candles.
A candle is considered "not connected" to the EMA if:
The high and low of the current candle are both either above or below the 5 EMA, implying a significant deviation from the EMA.
When this condition is met, the candle color is changed to yellow to highlight this disconnection.
The default behavior of the script is to not display the 5 EMA line, keeping the chart uncluttered while focusing on the candlestick colors.
Usage:
This indicator is useful for scalping or short-term trading strategies, as it helps identify when the price has moved significantly away from the 5 EMA. A yellow candle could signal potential overextension or a possible reversal if the price is far from the EMA. Traders can use this as part of their risk management or entry/exit decision-making process.
Customization:
The indicator doesn't display the 5 EMA line, but you can modify the script to show it if needed by uncommenting the plot(ema5) line.
You can adjust the period of the EMA by modifying the ema5 period in the code, though the default setting is 5 periods.

Fibonacci Candlestick - AYNETHow It Works
Inputs:
ltf_timeframe: Specify the timeframe for candlestick data (e.g., 1H, 4H).
Fibonacci Levels:
Toggle Fibonacci level visibility (show_fib_levels).
Customize Fibonacci line color (fib_color) and width (fib_width).
Candlestick Data:
Fetches open, high, low, and close prices for the specified timeframe using request.security.
Fibonacci Levels:
Calculates standard Fibonacci retracement levels (0.0, 23.6%, 38.2%, 50%, 61.8%, 78.6%, 100%) for each candle's high-low range.
Draws horizontal lines for each level using line.new.
Candlestick Visualization:
Plots lower timeframe candles with customizable bullish and bearish colors.
Key Features
Dynamic Fibonacci Levels:
Fibonacci levels are recalculated for each candlestick's high-low range.
Levels update dynamically with new candles.
Candlestick Overlay:
Visualizes candlestick data from the specified timeframe directly on the current chart.
Customizable Appearance:
Configure colors for Fibonacci levels, candlestick bodies, and wicks.
Use Cases
Microstructure Analysis:
Analyze individual candlesticks with their Fibonacci retracements for potential support/resistance zones.
Multi-Timeframe Trading:
Overlay candlestick and Fibonacci data from a lower timeframe onto a higher timeframe chart.
Let me know if you'd like further enhancements or explanations! 😊

Candle Body Support/Resistance [LuxAlgo]The Candle Body Support/Resistance indicator is a tool that provides Support/Resistance levels from high-volatility candles, a concept originally described by Steve Nison in "Beyond Candlesticks".
Users can define the candle body percentage used to set the detected support/resistance levels. Occurrences of price testing the returned levels are highlighted using user-customizable dots.
🔶 USAGE
Support/Resistance levels are drawn from volatile candles, that is candles having a body (range between opening and closing price) whose magnitude is larger than the Volatility Threshold , which is determined by the multiplicative factor of an ATR (Average True Range) using a user set length.
The level starts from the opening price +/- a percentage of the open-close range. Users can adjust the percentage of the candle body used as support/resistance levels respectively, with higher percentage values returning levels prone to get reached sooner by the price.
A test is considered valid when a wick passes through the Support/Resistance level while the closing price is not breaking it.
Two modes are included, Trailing and Historical , both affecting the displayed elements of the indicator, these are described in the sub-section below.
🔹 Historical
The Historical Mode will draw a separate line from every Volatile Candle . When this line is tested, a dot will be drawn.
In the above example, the red resistance line was tested once until a bullish volatile candle formed, which closed just below the resistance level. The resistance level was tested again, after which the newly created support level was broken quickly, and the price decreased. These levels proved helpful later, acting as resistance/support levels (illustrated by the extra manually drawn dashed white lines).
To prevent cluttering Support/Resistance , lines will be deleted when the line is mitigated and hasn't been tested.
When a Support/Resistance line reaches its Maximum Line Length , it will also be deleted when it has not been tested.
🔹 Trailing
When a new volatile candle of the same type (bullish/bearish) appears while the Support/Resistance isn't broken, this line will be updated with the values of the new volatile candle. This creates a trailing line and a less cluttered chart.
Unlike the Historical mode , a line will not be deleted after a while or when it is mitigated. Instead, the line won't be updated anymore. A new line will start from the next found volatile candle.
Using the same situation as the Historical Mode example, we can note the future significance of old support/resistance levels (illustrated by the extra manually drawn dashed white lines).
The user can switch between these 2 modes, each offering a unique perspective on the market. This provides a more in-depth examination of the market, enhancing the user's trading analysis.
Using a copy of our indicator while using both modes can also be helpful.
🔶 DETAILS
The Support level is the opening price of a bullish volatile candle plus a user-set percentage of the candle's body, while the Resistance level is the opening price of a bearish volatile candle minus a percentage of the candle's body.
The following example illustrates the ATR with the multiplicative factor (Volatility Threshold) where the body of Volatile candles exceeds the ATR limits. Changing the Volatility Threshold and ATR length gives users extra flexibility to adjust to their needs.
🔹 Max Line Length
When using the Historical Mode and the duration of a displayed level reaches the user-set Max Line Length value, the level will return to the last test or be deleted when it has not been tested.
🔶 SETTINGS
Display Mode: Display mode of the indicator.
Support %: Sets the distance of the Support Line from the opening price relative to the candle body.
Resistance %: Sets the distance of the Resistance Line from the opening price relative to the candle body.
🔹 Filter
Length ATR: Amount of bars for the calculation of the Average True Range.
Volatility Threshold: multiplicative factor of ATR.
Max Line Length: Maximum allowed duration/length (in bars) of a Support/Resistance level.

Gradient Candles
The Gradient Candles indicator is crafted to be a comprehensive replacement for default candlesticks, offering users an enhanced and visually stunning alternative. To experience the intended results and fully immerse in the distinctive features of Gradient Candles, it's recommended to hide the default candlesticks. This ensures that traders can fully appreciate the unique color gradient and dynamic visual representation that this indicator brings to chart analysis.
Designed to elevate chart analysis, Gradient Candles not only offer a fresh perspective on price movements but also captivate users with their visually appealing representation of market dynamics. Departing from traditional candlestick coloration, the dynamic adaptation of colors, the 'color.from_gradient()' function plays a pivotal role in translating the current source value into a color that reflects its proximity to the highest and lowest values and corresponding colors. Beyond its analytical capabilities, Gradient Candles transform market analysis into an aesthetically enriching experience, providing traders with a unique and comprehensive tool for their technical analysis toolkit.
Traders can tailor the indicator's appearance to suit their preferences and seamlessly integrate it into their personal trading environment. From color inversion to transparency adjustments and the option to fill candles instead of outlining them, the customization features empower users to create a visual representation that aligns precisely with their unique preferences.

Candlestick Patterns [NAS Algo]Candlestick Patterns plots most commonly used chart patterns to help and understand the market structure.
Bullish Reversal Patterns:
Hammer:
Appearance: Small body near the high, long lower shadow.
Interpretation: Indicates potential bullish reversal after a downtrend.
Inverted Hammer:
Appearance: Small body near the low, long upper shadow.
Interpretation: Signals potential bullish reversal, especially when the preceding trend is bearish.
Three White Soldiers:
Appearance: Three consecutive long bullish candles with higher closes.
Interpretation: Suggests a strong reversal of a downtrend.
Bullish Harami:
Appearance: Small candle (body) within the range of the previous large bearish candle.
Interpretation: Implies potential bullish reversal.
Bearish Reversal Patterns:
Hanging Man:
Appearance: Small body near the high, long lower shadow.
Interpretation: Suggests potential bearish reversal after an uptrend.
Shooting Star:
Appearance: Small body near the low, long upper shadow.
Interpretation: Indicates potential bearish reversal, especially after an uptrend.
Three Black Crows:
Appearance: Three consecutive long bearish candles with lower closes.
Interpretation: Signals a strong reversal of an uptrend.
Bearish Harami:
Appearance: Small candle (body) within the range of the previous large bullish candle.
Interpretation: Implies potential bearish reversal.
Dark Cloud Cover:
Appearance: Bearish reversal pattern where a bullish candle is followed by a bearish candle that opens above the high of the previous candle and closes below its midpoint.
Continuation Patterns:
Rising Three Methods:
Appearance: Consists of a long bullish candle followed by three small bearish candles and another bullish candle.
Interpretation: Indicates the continuation of an uptrend.
Falling Three Methods:
Appearance: Consists of a long bearish candle followed by three small bullish candles and another bearish candle.
Interpretation: Suggests the continuation of a downtrend.
Gravestone Doji:
Appearance: Doji candle with a long upper shadow, little or no lower shadow, and an opening/closing price near the low.
Interpretation: Signals potential reversal, particularly in an uptrend.
Long-Legged Doji:
Appearance: Doji with long upper and lower shadows and a small real body.
Interpretation: Indicates indecision in the market and potential reversal.
Dragonfly Doji:
Appearance: Doji with a long lower shadow and little or no upper shadow.
Interpretation: Suggests potential reversal, especially in a downtrend.

Probability of Candle Close Higher Than OpenThe "Probability of Candle Close Higher Than Open" indicator is designed to help traders assess the likelihood of a given candle closing higher than its open based on the previous candle's price action. It does this by calculating a probability score between 0 and 1 and displaying it on the chart, along with a horizontal line representing a user-defined probability threshold.
The indicator uses three input variables to determine the probability score:
lookback_period: This input defines the number of previous candles to consider when calculating the probability. By default, it is set to 2, meaning the indicator considers the previous two candles.
prev_high and prev_low: These variables are calculated using the highest() and lowest() functions, respectively, and represent the highest high and lowest low of the previous lookback_period candles.
prev_body: This variable calculates the absolute value of the difference between the open and close prices of the previous candle.
The probability score is then calculated based on the following conditions:
If the current candle's open price is higher than the previous lookback_period candles' highest high, the probability score is set to 0.1 (indicating a low probability of the candle closing higher than its open).
If the current candle's open price is lower than the previous lookback_period candles' lowest low, the probability score is set to 0.9 (indicating a high probability of the candle closing higher than its open).
If neither of the above conditions apply, the probability score is calculated using the following formula:
If the previous candle closed higher than its open, the probability score is set to 0.5 plus half of the previous candle's body (i.e., the absolute difference between its open and close prices).
If the previous candle closed lower than its open, the probability score is set to 0.1 plus half of the previous candle's body.
If the previous candle closed at the same price as its open, the probability score is set to 0.1.
Finally, the indicator plots the probability score as a label on the chart and a horizontal line representing the probability threshold.
Disclaimer:
Trading involves significant risk and is not suitable for all investors. The "Probability of Candle Close Higher Than Open" indicator is for informational purposes only and should not be used as the sole basis for making trading decisions. Always conduct your own research and due diligence before entering any trades. No guarantee or warranty is given as to the accuracy or completeness of the information provided by this indicator, and any reliance on this information is at your own risk. Past performance is not necessarily indicative of future results. Trading with margin carries the risk of losing more than your initial investment. Only trade with risk capital that you can afford to lose.

50% candlestick closeThis indicator is useful at important level, when you want to see some bullish or bearish signs in candlestick.
At your important support level you can buy, if candlestick close is above 50% of its range, with low of this candlestick as SL.
At your important resistance level you can sell, if candlestick close is below 50% of its range, with high of this candlestick as SL.

Detect BOS in Five Candles with MTF - Alert [MsF]Japanese below / 日本語説明は英文の後にあります。
-------------------------
*This indicator is based on azmathshah's "Last Three Candles each of Two HTF".
It's a very cool indicator. thank you.
You can detect trend reversal with candlesticks.
It's MTF compatible and can display up to 2 sets of 5 candles of any time frame on the right side of the chart.
By displaying the candles of the upper time frame bars, you can check the trend change and measure the entry timing with the lower time frame bars.
There are two types of alerts.
"Liquidity Sweep": This is an alert when the upper beard (high) of ③ is touched with the next foot.
"Candle Close": An alert when the upper whisker (high) of ③ is exceeded by the closing price of the next bar (generally a strong signal)
-------------------------
ローソク足でトレンド転換を検知するインジケーターです。
MTF対応となっておりチャートの右側に任意タイムフレームのローソク5本を最大2セット表示できます。
上位足のローソクを表示することにより、トレンド転換確認しながら、下位足でエントリータイミングを計ることができます。
アラートは2種類あります。
"Liquidity Sweep":③の上ヒゲ(high)を次の足でタッチした場合のアラートです
"Candle Close":③の上ヒゲ(high)を次の足の終値で上回った場合のアラートです(一般的には強力なシグナルとなります)

Breakout Candles + RSIHello!
This is my firt script :)
This indicator looks for candles that are significantly larger than the previous X candle.
It is possible to set the following:
Multiplier: deviation from the size of the previous X candle (if set to 3 the size of the actual candle's body /abs(open - close)/ must be larger than the size of the bigger candle from the prevous X candles)
Previous candles: the number of previous candles to size check
Upper RSI limit: if the RSI14 close higher than the specified number, the candle will ignore
Lower RSI limit: if the RSI14 close lower than the specified number, the candle will ignore
Without dojis: if checked, watches candles only that do not have a bottom spike (bullish) or top spike (bearish). Useful for Heikin-Ashi candles
Feel free to left any suggestion!
Thank You!

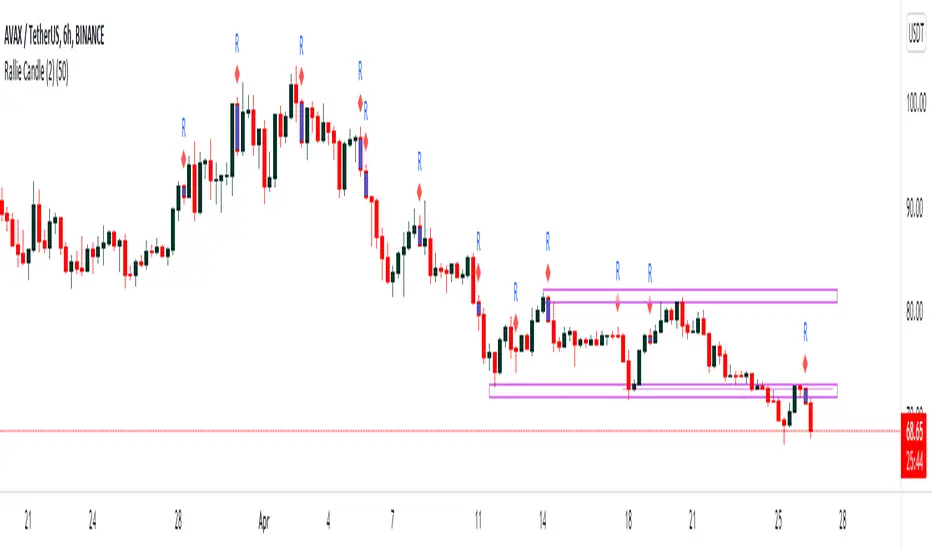
Rally Candle (End Game ) 26/04/2022 Few Months ago I started wanted to code a candle which alerts me when a Rally may be over in Bearish Conditions and today I have created a candle which is 1. subjective but more importantly appears in areas where buying pressure is at either a climax or in the process of a decline and this is where the Rally Candle signals. This shows momentum may be shifting and these can provide some good entries.
They will only working when price is below the 200ema and in overextended markets - VERY IMPORTANT!!!
Works on all timeframe with HTF providing more price percentage than LTF
They aren’t a specific candle size however they will repaint when we see 4 higher close candles followed by a candle which has closed lower than the previous 4th.
//Candle Conditions
This candle has to be in a swing high area to be valid and on 1H and 6H but the 1H will repaint a lot of candles so when we have a point system of +20 we can assume this setup is a good setup.
//Candle Operators
You can change the color of the bar to your liking
There is a ema filter so if you want to candle to not show candles of the 50ema this operator will do the command.
Please post requests and any potential implementations I could port to pine script.
Hope you Enjoy :)
Volume Filtered *All Candlestick Patterns* [KT] Hello!
This script uses TradingView's *All Candlestick Patterns* indicator and includes a volume filter.
The frequency of each candlestick pattern is recorded in addition to the subsequent session's outcome - higher or lower close.
The requisite volume for the pattern is configurable; formations will not be distinguished when volume is less than the defined lower threshold.
For example, setting the volume threshold to 10% forces the script to identify candlestick patterns in which volume for the session (candle) is 10% greater than the volume moving average. All candlestick patterns with volume less than (1.10 * volume MA) are discounted.
The script counts the frequency of each pattern - the number of times the pattern occurred - in addition to the next candle's outcome.
Pertinent statistics are displayed in the table, which can be hidden.
I plan on working on the script quite a bit more; please comment a suggestion if you have one! What else should be included?

Classic Candlestick on Range ChartHello traders!
This is my first script to share with everyone! As of right now the range candles on Tradingview are lacking the option to see range charts using the classic candlesticks. This script allows you to overlay a regular candlestick or heikin-ashi candlestick on a range chart!! Unfortunately, the only bar that cannot be a candlestick is the current bar. Once that bar has completed its range then it will update to a regular candlestick.
Install / Use instructions!
-For the best visual appearance it is important to set the transparency of up bars and down bars to 0. This setting is found in the main chart settings under SYMBOL. However, if you want to see the current unfinished range bar you need to set the "projection up bars" and "projection down bars" to the color you prefer.
-To change the colors of the candlesticks is found under the indicator settings like any other script!

Vector Candles [v6 Optimized + EMA]
Vector Candles represent an innovative technical analysis approach that transforms traditional candlestick charting by integrating volume dynamics, color-coded momentum, and multi-dimensional market insights. Unlike standard candlesticks that merely display price movement, Vector Candles encode additional market information through sophisticated color and volume algorithms.
Key Features:
-Dynamic Volume-Based Coloring: Candles change color based on trading volume intensity
-Volume Categories:
High Volume (Lime/Red): Significant market activity (200%+- Vol of Previous 10 Candles)
Above Average Volume (Blue/Fuchsia): Moderate market momentum (150%+- Vol of Previous 10 Candles).
Normal Volume (Gray Scales): Standard market conditions.
Stopping Volume Candles - Typically Pinbar/Doji candles. Stops volume in the current direction of delivery & can help forecast impending reversals or end to the current trend.
-Integrated EMA (Exponential Moving Average) Option:
-Customizable EMA Length (Default: 50 periods) (I use 33)
Configurable EMA Source (e.g., close price)
Optional EMA Overlay for Trend Confirmation

IU Three Line Strike Candlestick PatternIU Three Line Strike Candlestick Pattern
This indicator identifies the Three Line Strike candlestick pattern — a rare yet powerful 4-bar reversal setup that captures exhaustion and momentum shifts at the end of strong trends.
Pattern Logic:
The Three Line Strike is a 4-candle pattern that typically signals a sharp reversal after a sustained directional move. This script detects both bullish and bearish variations using strict criteria to ensure accuracy.
Bullish Three Line Strike:
* Previous three candles must be bearish (red)
* Each of these candles must close progressively lower (indicating a strong downtrend)
* The current candle must:
* Be bullish (green)
* Open below the prior close
* Completely engulf the previous three candles by closing above the first candle's open
* And make a higher high than the last 3 bars — confirming a strong reversal
* Once confirmed, a green shaded box is drawn around the 4-bar zone to highlight the pattern
Bearish Three Line Strike:
* Previous three candles must be bullish (green)
* Each must close progressively higher (indicating a strong uptrend)
* The current candle must:
* Be bearish (red)
* Open above the prior close
* Completely engulf the prior three candles by closing below the first candle's open
* And make a lower low than the last 3 bars — confirming downside strength
* A red shaded box is plotted around the 4-bar formation to emphasize the reversal zone
Why this is unique:
Most candlestick tools focus on 1–2 bar patterns. The Three Line Strike goes a step further by combining trend exhaustion (3 same-colored candles) with a full reversal engulfing candle. This pattern is both rare and highly expressive of sentiment shift, making it a standout signal for discretionary and algorithmic traders alike.
How users can benefit:
* High-probability setups: Filters out weak signals using multi-bar confirmation logic
* Clear visual cues: Dynamic shaded boxes and labels make spotting reversals effortless
* Cross-timeframe compatible: Works on intraday and higher timeframes across all markets
* Real-time alerts: Get notified instantly when a bullish or bearish setup forms
This indicator is a valuable addition for traders who want to capture key reversals backed by strong multi-bar price action logic. Whether you are a price action purist or a pattern-based strategist, the IU Three Line Strike gives you a reliable edge.
Disclaimer:
This script is for educational purposes only and does not constitute financial advice. Trading involves risk, and past performance is not indicative of future results. Always do your own research and consult with a licensed financial advisor before making trading decisions.
