Advanced Fully Reversed Candles with Reversed IchimokuThe "Advanced Fully Reversed Candles with Reversed Ichimoku" indicator is a sophisticated tool designed for traders who seek a unique perspective on market dynamics. This innovative indicator not only reverses the traditional candlestick chart but also inverts the Ichimoku Cloud components, providing a comprehensive view of the market's inverted behavior.
Key Features:
Reversed Candlestick Chart:
The indicator recalculates the OHLC (Open, High, Low, Close) prices by reversing them along the price axis. This means that what typically would be an upward movement is displayed as a downward movement, and vice versa. This reversal provides an alternative view that can help traders identify hidden patterns and potential reversal points that might not be obvious on a standard chart.
Reversed Ichimoku Cloud:
All components of the Ichimoku Cloud indicator are recalculated based on the reversed price data. This includes:
Tenkan-sen (Conversion Line): Reversed based on the highest and lowest prices over the specified period.
Kijun-sen (Base Line): Reversed in a similar manner to the Tenkan-sen, providing a medium-term perspective on price trends.
Senkou Span A (Leading Span A): Reversed to form one boundary of the Kumo (cloud), offering insight into future support and resistance levels.
Senkou Span B (Leading Span B): Reversed to form the other boundary of the Kumo, complementing Senkou Span A.
Chikou Span (Lagging Span): Reversed and plotted backward for additional confirmation of trend direction and strength.
Dynamic Price Range Calculation:
The indicator dynamically calculates the maximum and minimum prices over the last 500 bars (or the available range if fewer bars are present). This ensures that the reversal is always based on the most relevant data, providing accurate and up-to-date visualizations.
Visual Enhancements:
The reversed candlesticks are color-coded for easy interpretation: green for upward movements and red for downward movements, based on the reversed data.
The Ichimoku Cloud is filled with semi-transparent colors to clearly distinguish between bullish and bearish conditions even in its reversed state.
Debugging Aids:
For transparency and accuracy, the indicator plots the maximum and minimum price lines used for the reversal calculations. This allows users to verify the internal workings of the indicator and ensure the reversal logic is correctly applied.
Usage:
This indicator is ideal for advanced traders and analysts who want to explore market behavior from an unconventional angle. By reversing both the candlestick chart and the Ichimoku Cloud, it provides a unique perspective that can uncover new trading opportunities and enhance market analysis.
Customization:
Users can customize the periods for the Tenkan-sen, Kijun-sen, and Senkou Span B, as well as the displacement for the Ichimoku Cloud. This flexibility allows traders to adapt the indicator to their specific trading strategies and timeframes.
Conclusion:
The "Advanced Fully Reversed Candles with Reversed Ichimoku" indicator is a powerful tool that transforms traditional market analysis. By inverting both price movements and key technical indicators, it opens up a new dimension of trading insights, helping traders to see the market in a completely different light.
Parameters:
Tenkan-sen period (default: 9)
Kijun-sen period (default: 26)
Senkou Span B period (default: 52)
Displacement (default: 26)
How to Apply:
Add the script to your TradingView account via the Pine Editor.
Customize the parameters according to your trading strategy.
Analyze the reversed candlestick chart and Ichimoku Cloud to gain unique insights into market trends and potential reversal points.
Cari dalam skrip untuk "candle"

Time - Bar StatusCandlestick analysis
The Indicator "Bar Status" will display the current open candle state and the last three close candles state based on the logic below.
Abbreviations.
OC = Open Candle (if in no state listed below)
FB = False Break
BO = Break Out
IN = Inside Bar
FBR = False Break Reversal
Logic:
OC = This is the current open candle yet to close. Its status will change as it progresses through time until close.
Green False Break Revers (FBR) = bar Close is higher than previous bar Close AND bar High is higher than previous bar High AND bar Low is lower than previous bar Low.
Green False Break (FB) = bar Close is lower than previous bar High AND bar High is higher than previous bar High.
Green Breakout (BO) = bar Close is higher than previous bar Close AND bar High is higher than previous bar High.
Green Inside Bar (IN) = bar High is lower than previous bar High AND bar Low is higher than previous bar Low.
Red False Break Revers (FBR) = bar Close is lower than previous bar Close AND bar Low is lower than previous bar Low AND bar High is Higher than previous bar High.
Red False Break (FB) = bar Close is higher than previous bar Low AND bar Low is lower than previous bar Low.
Red Breakout (BO) = bar Close is lower than previous bar Close AND bar Low is lower than previous bar Low.
Red Inside Bar (IN) = bar High is lower than previous bar High AND bar Low is higher than previous bar Low.
The end column is the current open candle/bar.
The second from the end column is the last closed candle/bar.
The third from the end column is the second closed candle/bar.
The forth from the end column is the third closed candle/bar.
=============================================================
Also Includes candle countdown timer, of various candles. i.e. 4 hour, 1 hour, 15min, 5 min.

Volume Delta Candles [LuxAlgo]Volume Delta Candles provides insights about Intrabar trading activity in an easy-to-interpret manner. Lower timeframe or real-time data is used for displaying Volume Delta percentage against the total volume as a coloured bar part.
The script also highlights the intrabar price with the maximum trading activity, as well as complementary information.
🔶 USAGE
The tool focuses on intrabar volume to provide more information about the trading activity associated with a candle, without having to use an external volume indicator.
Each indicator components is further explained below:
🔹 Volume Delta
The volume delta is obtained by the difference between buy volume and sell volume, where buy volume is the volume associated with a bullish intrabar candle, and sell volume with a bearish intrabar candle.
Positive volume delta is displayed with a green candle area, while negative delta is displayed with a red candle area.
🔹 Bar Coloring
The script displays VD as a percentage of the whole, or from the candle half, depending on the setting ' Display '.
Bars can be coloured as follows:
Full (100%) when Display is set at ' Full Bar '
Half (50% or 100% of half a bar) when Display is set at ' Half Bar '
A negative VD (more bearish than bullish volume) will fill the bar from the top (or centre) of the bar towards the bottom, and a positive VD will fill a bar from the bottom (or centre) of the bar towards the top.
A negative VD on a green candle will show a red-coloured VD against a green-bordered candle. On the other hand, a positive VD on a red candle will show a green-coloured VD against a red-bordered candle.
Colours for VD sentiment opposite to the candle sentiment can be set differently if desired.
🔹 Highest Volume Price Level
The script displays a white (black on light mode) line highlighting the intrabar price level with the highest volume.
When ' Show Previous Max Volume Price ' is checked, a white (black on light mode) dot is displayed 1 bar to the right.
🔶 DETAILS
🔹 Tick/LTF data
The above example used Lower TimeFrame (LTF) data.
The following example uses real-time tick data ( Settings -> Data From )
Both options, LTF or tick data, will show a vertical dotted line where the data starts.
🔹 LTF settings
When ' Data from ' LTF is chosen and ' Auto ' enabled, the LTF will be the nearest possible x times smaller TF than the current TF. When 'Premium' is disabled, the minimum TF will always be 1 minute to ensure TradingView plans lower than Premium don't get an error.
Examples with current Daily TF (when Premium is enabled):
500 : 3 minute LTF
1500 (default): 1 minute LTF
5000: 30 seconds LTF (1 minute if Premium is disabled)
🔹 Notes
Different LTFs give different data, which means different results; this doesn't mean it isn't correct; they are just different data sets.
(LTF is displayed at the top right corner)
To ensure maximum visibility of values, we recommend using Bars from the Bar's style menu.
🔶 SETTINGS
Data from: Lower TimeFrame or real-time Tick data
Resolution: LTF setting
Auto + multiple: Adjusts the initial set resolution
Premium: Enable when your TradingView plan is Premium or higher
🔹 Intrabar Data
Colours
Display: Full/Half bar
Show previous max volume price: White/black dot, showing previous highest volume price level
🔹 Table
Show TF: Show LTF at the top right corner
Colour + table text size
🔹 Details
Show details: label with 'Volume', 'Delta' (VD) and '%'
See USAGE for more information

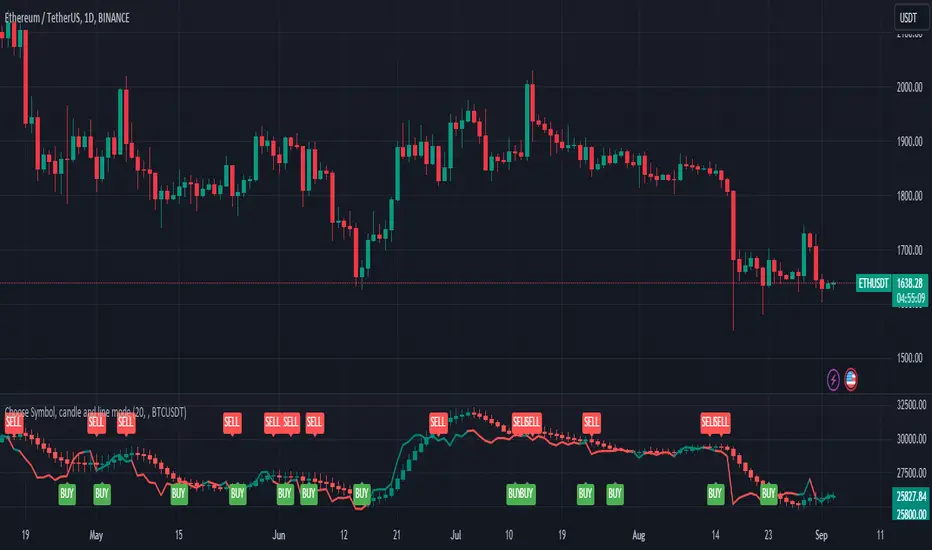
Choose Symbol, candle and line modeThis indicator plots candlesticks or line charts based on user-specified symbol and price data in the time frame. The user can also choose whether this indicator works in normal mode or Heikin-Ashi mode. Here are the features of this indicator:
1. **Trend and Normal Modes:** User can choose to operate the indicator in two different modes. In "Trend Mode" the indicator plots the moving average of the price based on the specified period length. In the "Normal Mode", it draws the opening, high, low and closing prices similar to the Heikin-Ashi candlesticks.
2. **Time Zone Selection:** User can select a different time zone to operate this indicator. By default, the current chart timeframe is used.
3. **Symbol Selection:** The indicator uses the price data from the specified symbol. The user can specify the symbol in the format "SYMBOL:PAIR".
4. **Buy-Sell Signals:** The indicator identifies buy and sell signals based on a certain period length. A buy signal occurs when the price goes above the line, while a sell signal occurs when the price goes below the line.
5. **Buy-Sell Alerts:** Alerts are sent to the user for buying and selling signals.
6. **Display on Chart:** The indicator draws candlesticks or line chart with specified modes and colors. It also marks the buying and selling points on the chart.
This indicator is used to analyze price movements in the specified symbol and time frame and to assist in buying and selling decisions. It has a user-friendly and customizable interface.
It is for idea purposes only, does not contain investment advice.
Volume Impulse & Candlestick Patterns - FontiramisuIndicator showing volume impulse & engulfing candlestick pattern.
You can set up multiple parameter for both events.
Volume Impulse :
Volume Period : Lenght of the average volume calculated.
Volume Multiplier : Factor to compare actual volume with average volume.
Engulfing Pattern :
VS avg body : Let you chose to compare body candle to average body of the last few candles (define with parameter : lenghtSizeAvgBody ), otherwise it will be compared to the last body candle.
Engulfing Multiplier : Factor to compare and validate the pattern.

Higher Timeframe Box & Divider - All Candles [GoldnHunt]The Higher Timeframe Box & Divider – All Candles indicator visually maps higher timeframe candles onto lower timeframe charts.
It highlights the open and close range of each higher timeframe candle as a box, along with a vertical divider marking the start of each new period.
This helps traders clearly see higher timeframe structure and momentum flow without switching charts.
Features:
Draws a box showing only the body (open to close) of each higher timeframe candle.
Uses candle color to represent bullish and bearish momentum.
Adds a divider line for each new higher timeframe candle.
Works across all symbols and timeframes.
Lightweight and optimized for performance.
Use case:
Perfect for traders using multi-timeframe (MTF) analysis who want to visualize higher timeframe candle progression while observing lower timeframe price action.

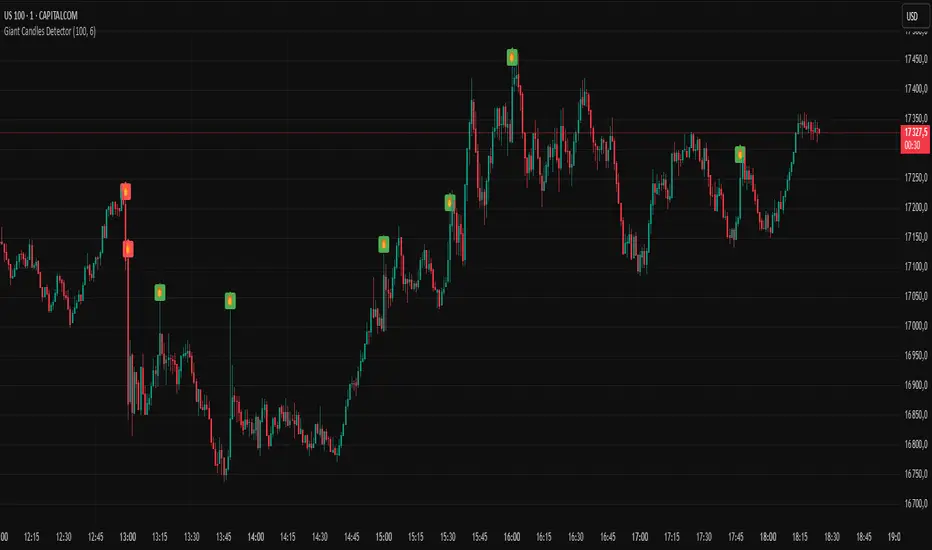
Giant Candles DetectorThis script identifies abnormally large candles — also known as "giant candles" — based on a customizable size threshold relative to the average candle size over a user-defined period.
Key Features:
Automatically detects candles that are significantly larger than average.
Differentiates between bullish (green) and bearish (red) candles.
Option to visually highlight candles with background color.
Built-in alert to notify you immediately when a giant candle appears.
Ideal for traders looking to spot volatility spikes, key breakouts, or significant price movements with minimal effort.
POC-Candle-EMA-ATR-LongShadow-50percCandleThis is a script for those who trade based on volume and smart money strategies.
Some of the features of this script:
- Display "Time Price Opportunity Chart". These points help traders to identify price opportunities over time and have a better analysis of the market.
- Mark candles that have traded more volume than previous candles.
- Mark candles whose body is at least and not more than 50% of the total candle size, these candles can be found more easily in smart money strategies.
- Mark spike candles to find FVG faster
- Mark candles that have a shadow of at least more than 380 points and can be good reversal points.
- EMA indicator to check the market trend
- DonchianChannel indicator to check the price trend on the chart
Regards

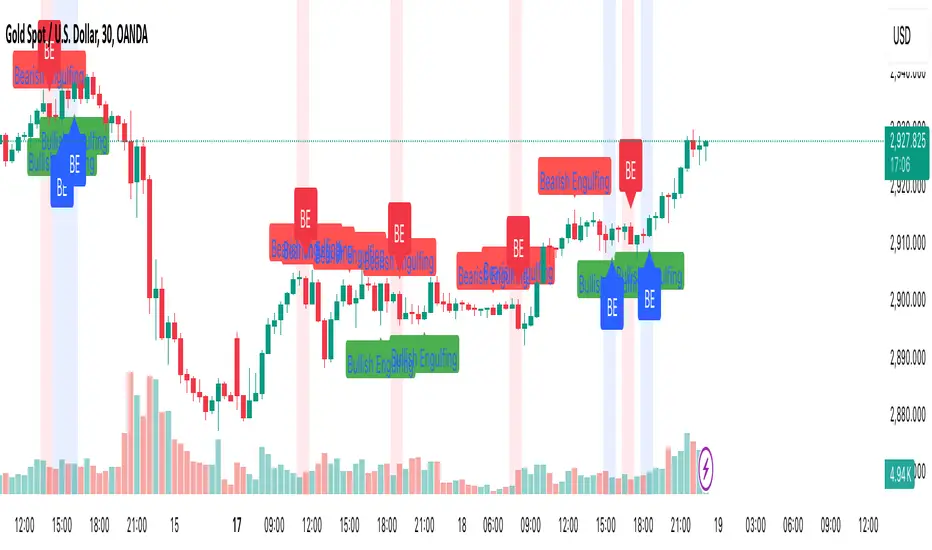
Engulfing Candle PatternIndicator Overview
This indicator identifies Bullish and Bearish Engulfing candlestick patterns on a price chart. These patterns are reversal signals:
Bullish Engulfing: Occurs during a downtrend, where a bullish candle fully engulfs the body of the previous bearish candle.
Bearish Engulfing: Occurs during an uptrend, where a bearish candle fully engulfs the body of the previous bullish candle.
Key Features
1. Pattern Detection:
Detects Bullish Engulfing and Bearish Engulfing patterns based on candle body comparisons.
Uses the current and previous candle's open/close prices to determine engulfing conditions.
2. Visualization:
Plots labels on the chart:
" Bullish Engulfing " below the candle for bullish patterns.
" Bearish Engulfing " above the candle for bearish patterns.
3. Alerts:
Triggers alerts when either pattern is detected, allowing traders to take action.
How It Works
Bullish Engulfing Condition:
Current candle is bullish (close > open).
Previous candle is bearish (close < open).
Current candle's body fully engulfs the previous candle's body.
Bearish Engulfing Condition:
- Current candle is bearish (close < open).
- Previous candle is bullish (close > open).
- Current candle's body fully engulfs the previous candle's body.
Usage
- Apply the script to any chart in TradingView.
- Look for " Bullish Engulfing " or " Bearish Engulfing " labels on the chart.
- Set up alerts to get notified when these patterns form.
This indicator is a simple yet effective tool for identifying potential trend reversals using engulfing candlestick patterns.
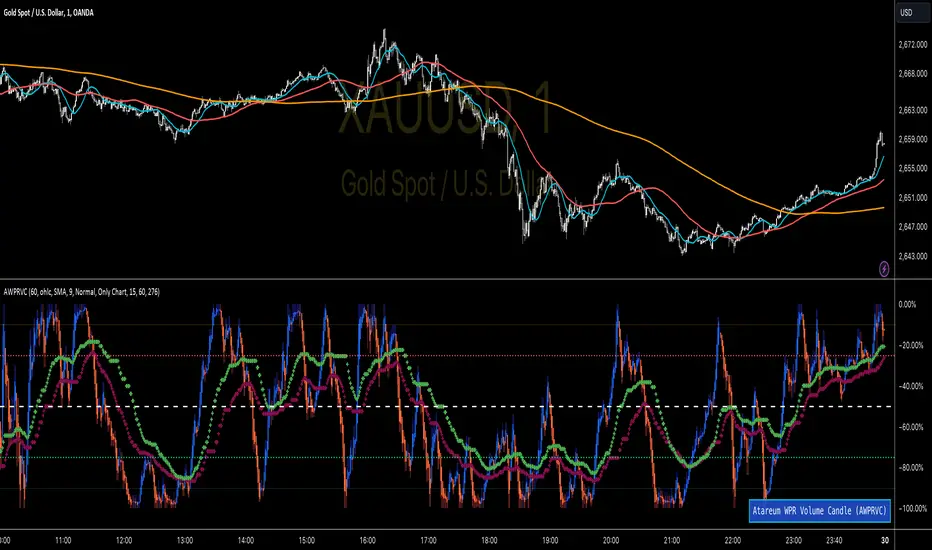
WPR Volume Candle [Atareum]AWPRVC (Atareum WPR Volume Candles) is clearly an awesome indicator produced by AtareumFX that is based on William’s Percent Range concepts by combination with volume. This is a new approach of volume candles that is combined with R% concepts and creates such a powerful tool to trace the market and assists traders to make better decisions surly and so much accurate. You can find this new indicator more useful because it has all benefits and advantages of William’s R% and cover its disadvantages. Also it is more powerful because of using volume in its calculations and generate a new candles which is more reliable and trustworthy.
Concept:
Using William’s Percent leading periods and calculations on redesigning new candles in combination with volume, that makes unique reform candles, but these new candles with their new cloud system clearly response to any reasonable price movement with so much information.
As you know if use R% there are some misleading fake signals generate by oscillator, also it could not show any sign of price moving trend which is almost confusing for beginners or even a pro trader! And finally this oscillator is so sensitive to price change that is so creepy to use for most of traders.
This new AWPRVC solve the problem and make all of them handy and useful for you.
The cloud system which is designed in AWPRVC shows the price trend moving from Bearish Zone (-100 to -50 percent) to Bullish Zone (-50 to 0 percent). You can trust the lead moving forward of the clouds in two separate Top and Bottom (Bull and Bear) lines which solely determine the trend and power of price moving. When clouds are close to each other means we continue the trend and when they get far away from each other means we will face powerful trend in near future. If they are in Bearish Zone we continue the selling pressure and vice versa. Following picture shows good sample of Long and Short positions in compare with so many fake signals generated on original R%.
Besides the cloud system of AWPRVC which is clearly show the price trend and it is completely enough for being sure about price moving trend, you can use moving average which is designated in it to confirm the price trend, also.
Also you can see this new AWPRVC candle by using volume within its conformation, make reasonable price candles which is no so sensitive and so creepy and make your decisions come true in peace and clear sense of market moves. You can see following picture which is showing although the real price candles are so unclear and nonsense of making decision but the AWPRVC candles lead you to make true and trustable position.
As you see this new combination of Williams R% oscillator with volume and also generating a perfect new cloud system will clearly help traders even pro to trust the signals and understand whole market movement better and all of original problems of R% solved and even make a most powerful, trustworthy and useful new indicator.
Parameters:
Section 1 : Candle colour setting for flourishing just as you desire !
Section 2 : Defining Periods of R% and source of candle data in combination with determining the smoothing type of moving averages and signal period.
Section 3 : Select using Standard candles alongside with redesigned cloud calculation type and three additional moving averages which can plot on each newly generated candles and standard candles on a chart with the type mode defined in the previous section.
Note: if you want to omit any or all of these moving averages, you can use 0 in period, instead of selecting "None" in the plot moving option!
Usage :
Overall:
Regardless of the additional moving averages which will lead to so many situations of market according to their types and designs, that is four different period for new redesign AWPRVC and three period for standard chart. You can easily select periods and type for these moving averages. Also, do not forget that signal moving averages is shown only on AWPRVC chart and have two different colour for upward and downward trends. Other moving averages are plot by just one single colour.
Cloud levels are so important because AWPRVC candles show respect to them and when they break the clouds upward or downward it is surly beginning of a trend. Do not forget we have 5 levels for tracing new AWPRVC candles move as follows : Ready for Short \ Long, Surly Short \ Long and Turn Trend which is in middle range of movement percent. Each level clearly shows what it means by its name.
Support and Resistance:
Any consolidation of AWPRVC candles in Ready for Short or Long Zones means the support or resistance level due to its nature, but important thing is how long the candles lasts in there or how many times repeated in the same level in AWPRVC chart zone in future.
For plotting the support or resistance you should trace range of AWPRVC candles consolidated and plot zone in standard chart candles just like following picture.
Divergence:
When standard price candles move downward but we see upward trend in clouds of AWPRVC candles that means we should face Bullish Trend because of the divergence and vice versa. You can see perfect example in following picture.
Signal:
Alert of Long :
Bullish candle cross both cloud down and up level simultaneously.
Confirmed Long :
AWPRVC candles cross up turn trend level and pullback to cloud up level.
Take profit of Long:
Any cross down of the AWPRVC candles from surly short level of chart.
Alert of Short :
Bearish candle cross both cloud up and down level simultaneously.
Confirmed Short :
AWPRVC candles cross down turn trend level and pullback to cloud down level.
Take profit of Short:
Any cross up of the AWPRVC candles from surly long level of chart.
Notes:
Use moving averages cross of standard chart candles as lead to be in positions more as they are good representative of trend.
As long as AWPRVC candles or Cloud levels are in Bullish Zone, you can stay in Long positions.
Cloud level thickness means the power of trend and can be use as confirmation of powerful trend, so when cloud levels tight or going to cross each other it means the trend is going to be reversed.
It is the result of many years of experience in markets and there are so many details about this AWPRVC chart which I am in the experiment phase to publish in the future, so please help me with your ideas and do not hesitate to comment and inform me any suggestions or criticism.
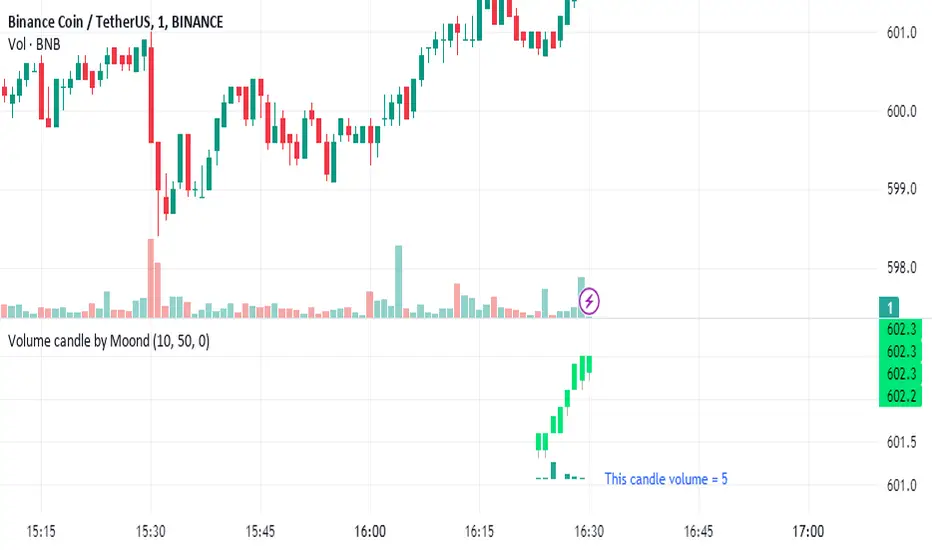
Volume candle by MoondIndicator Description: Equal Volume Candle Chart
This indicator creates a real-time candlestick chart where each candle forms upon the completion of a specific volume threshold, rather than within fixed time intervals. The candles update dynamically based on the total volume traded, providing a unique perspective that incorporates market activity directly into price movements.
Key Features:
Dynamic Candles Based on Volume: Candles form when a defined lot size of volume is reached, making each candle represent consistent trading activity rather than a fixed time period.
Customizable Volume Lot Size: Users can easily adjust the volume threshold to suit different trading styles or asset classes.
Real-Time Market Reflection: The chart responds to changes in market volume, offering a clearer view of market intensity and momentum.
Concept Behind the Indicator: Traditional candlestick charts operate on time intervals, which can ignore the influence of volume in price changes. By basing the candle formation on equal volumes, this indicator integrates both price and traded volume into the visual representation, helping traders capture key shifts in market sentiment and activity that might be missed on time-based charts
Atareum Volume Ichimuku CandleAVIC (Atareum Volume Ichimoku Candles) is clearly an awesome indicator that is based on Ichimoku concepts by combination with volume. This is a new approach of volume candles that is combined with Ichimoku concepts and creates such a powerful tool to trace the market and assists traders to make better decisions, truly.
Concept:
Using Ichimoku leading periods and calculations on redesigning new candles in combination with volume, that makes unique reform candles on Tenkansen movement, but these new candles clearly omit noises in combination with volume, and then the new redesigned system of cloud calculations builds, new series of data for Senko Span A and Senko Span B which is so odd in first view, because they will barely ever cross each other, but they show very more informative and useful.
Parameters:
Section 1 : Candle colour setting for flourishing just as you desire !
Section 2 : Defining Periods of standard Ichimoku and source of candle data in combination with determining the smoothing type of moving averages and signal period.
Section 3 : Select using Heikin Ashi based candles alongside with redesigned cloud calculation type and three additional moving averages which can plot on each newly generated candles and standard candles on a chart with the type mode defined in the previous section.
Note: if you want to omit any or all of these moving averages, you can use 0 in period, instead of selecting "None" in the plot moving option!
Usage :
Overall:
Regardless of the additional moving averages which will lead to so many situations of market according to their types and designs, that is four different period for new redesign AVIC and three period for standard chart. You can easily select periods and type for these moving averages. Also, do not forget that signal moving averages is shown only on AVIC chart and have two different colour for upward and downward trends. Other moving averages are plot by just one single colour.
Cloud levels are so important because AVIC candles show respect to them and when they break the clouds upward or downward it's surly beginning of a trend that is may last long. Also when cloud levels flatten, it is determining a support or resistance according to up cloud or down cloud nature and as long as they will continue or repeated periodically on same level of AVIC chart, it will implement their weakness or strength.
Support and Resistance:
Any flattens of cloud up or down level means the support or resistance level due to its nature, but important thing is how long the cloud lasts flatten or how many times repeated in the same level in AVIC chart.
For plotting the support or resistance you should trace first candle of start of flattens in standard chart just like following picture.
Divergence:
All Higher high or Lower low of standard chart has its reflect in AVIC chart but there is secret in it, It is named divergence. When standard chart price candles generating lower low but the AVIC chart candles do not cross the bottom, it means we will spike high as soon as AVIC candle chart complete its divergence. You can see perfect example in following picture.
Cloud level Ends
When cloud down level become flattens and cloud up level start a bull run it means we will face a great up trend movement but as soon as cloud down level starts to move up it mean we are going to finish the bull run and maybe it goes with consolidation phase or reversal phase. This reaction is exactly happen in vice versa for bear run trend. You can see both examples in following pictures.
Note: if we face end of bull run and cloud down level make a U turn shape upside down it means we will have reversal phase even not too long but it is sharp and fast reversal. If cloud down level just turn right slightly, it means we should have consolidation phase, mostly or we can continue the last trend slightly. All these situations can happen in vice versa bear run. You can see example in following picture.
Signals:
Long but risky:
You can go long when AVIC candles are green and be in position as long as they are not change in colour.
Long and safe :
You can go long when AVIC candles cross up cloud down level and be in position as long as AVIC candles cross down cloud up level.
Long and sure:
You can go long when AVIC candles cross up cloud up level and be in position as long as AVIC candles cross down cloud down level.
Short but risky:
You can go short when AVIC candles are red and be in position as long as they are not change in colour.
Short and safe :
You can go short when AVIC candles cross down cloud up level and be in position as long as AVIC candles cross up cloud down level.
Short and sure:
You can go short when AVIC candles cross down cloud down level and be in position as long as AVIC candles cross up cloud up level.
Notice : Candles with large body are so strong but if a body candle is weak or flatten it may a signal of changing colour and direction, especially when using Heikin Ashi type.
It is the result of many years of experience in markets and there are so many details about this AVIC chart which I am in the experiment phase to publish in the future, so please help me with your ideas and do not hesitate to comment and inform me any suggestions or criticism.

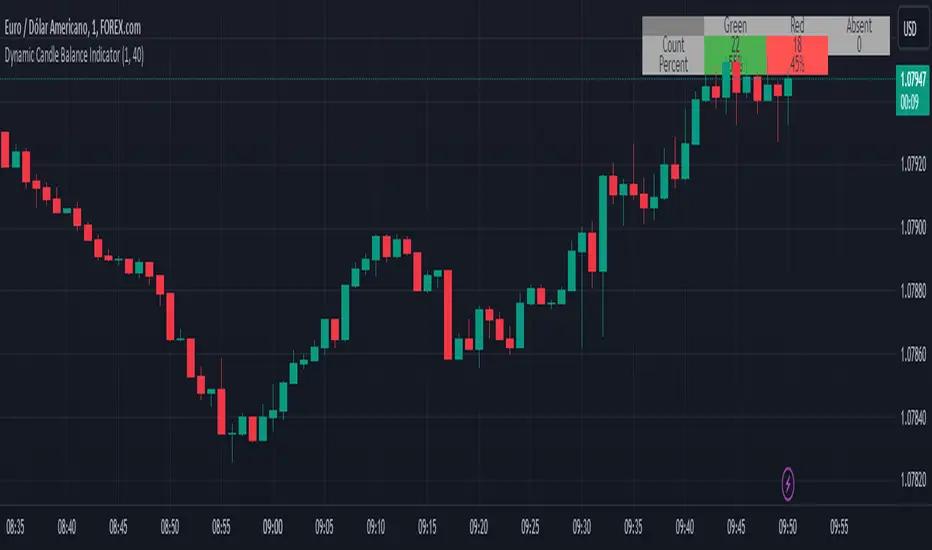
Dynamic Candle Balance Indicator (Binary)
Dynamic Candle Balance Indicator
The Dynamic Candle Balance Indicator is a powerful tool designed to identify imbalances in candle colors on a chart, which can indicate potential reversals or changes in market direction. This indicator is specifically developed for traders operating on short timeframes, such as 1-minute candles, and is particularly useful for identifying opportunities in binary options.
How to Use:
Set Parameters
Initial Position: Specify the number of initial candles to be considered for calculation.
Count: Determine the total number of candles to be analyzed, including the initial position.
Interpret Results:
Green: Indicates the number of bullish candles (where the closing price is higher than the opening price).
Red: Indicates the number of bearish candles (where the closing price is lower than the opening price).
Absent: Indicates the number of candles that were not considered due to the selected interval.
Performance Analysis:
The indicator calculates the percentage of green and red candles relative to the total number of analyzed candles, providing insights into market balance or imbalance.
Identify Trading Opportunities:
Significant imbalances between candle colors can indicate potential reversals or changes in market direction.
Traders can use this information to make informed decisions about their trading strategies, such as identifying entry or exit points.
Example:
In the last 40 candles, there were 13 green candles and 27 red candles, indicating a higher likelihood of the next candle being green.
Usage Tips:
The indicator is most effective when used on a 1-minute timeframe for binary options trading, especially during periods of high imbalance.
Adjust the parameters according to your trading strategy and the timeframe being analyzed.
Combine the Dynamic Candle Balance Indicator with other technical analysis tools to confirm trading signals.
Legal Disclaimer:
This indicator is provided for educational and informational purposes only. It represents a theory and should be used as part of a comprehensive trading strategy. Past performance is not indicative of future results. Traders should always conduct their own analysis before making trading decisions.
Try out the Dynamic Candle Balance Indicator and leverage its functionalities to identify trading opportunities on short-term charts, especially in 1-minute timeframes for binary options trading during periods of high imbalance. Remember to test the indicator on a practice account before using it on a real account.
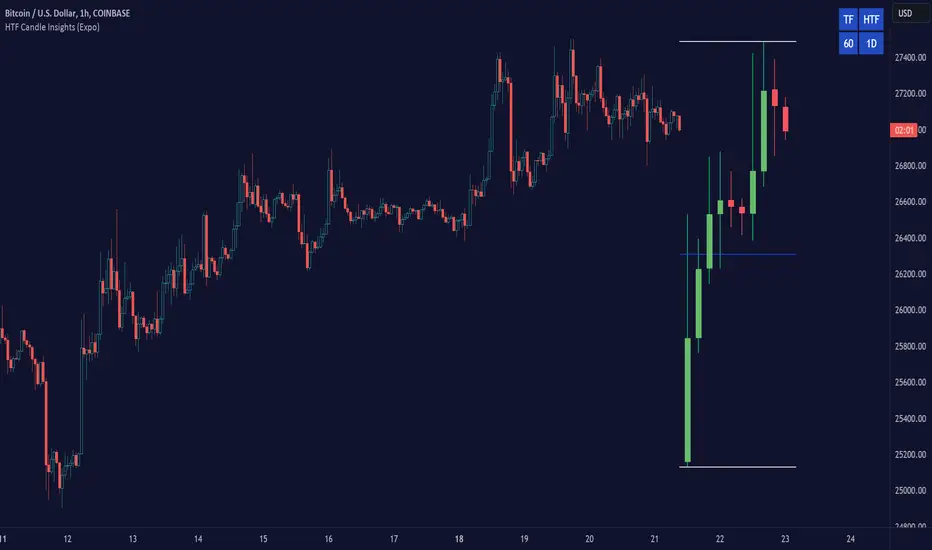
HTF Candle Insights (Expo)█ Overview
The HTF Candle Insights indicator helps traders see what's happening in larger time frames (HTF) while they're looking at smaller ones. This tool lets traders get a complete picture of market trends and price movements, helping them make smarter trading choices. It's really useful for traders who want to understand the main market trends without constantly switching between different chart timeframes.
In simpler terms , this indicator brings the big picture into the smaller frame, so traders don't miss out on what's important while focusing on the details.
█ How It Works
The indicator plots HTF candles on the existing chart, allowing users to view them concurrently with the candles of the current timeframe. This dual visual representation helps in discerning the prevalent market trends and significant price levels from both the current and higher timeframes.
█ How to Use
Trend Analysis
Traders can leverage this indicator to analyze overall market trends by observing HTF candles alongside the current timeframe candles. Recognizing HTF trends aids in aligning trades with the dominant market movement, potentially increasing the probability of successful trades.
Support and Resistance Identification
By viewing the high, low, and mid-levels of HTF candles, traders can identify potential support and resistance zones, enabling them to establish strategic entry and exit points, place stop-losses effectively, and manage risk proficiently.
█ Settings
Timeframe and Candle Amount:
Users can specify the higher timeframe and the number of HTF candles they wish to visualize on their current chart.
Visual Adjustments:
Traders can customize the color schemes for upward and downward candles and their wicks, and adjust the visibility and colors of the range lines, allowing for a tailored visual experience.
Range Lines:
Users have the option to display the high/low range of the displayed candles, and, if preferred, the mid-range line, enabling them to gain insights into significant price levels and ranges.
Table Display:
The indicator offers the ability to display a table, which provides an overview of the current chart's timeframe and the specified HTF.
-----------------
Disclaimer
The information contained in my Scripts/Indicators/Ideas/Algos/Systems does not constitute financial advice or a solicitation to buy or sell any securities of any type. I will not accept liability for any loss or damage, including without limitation any loss of profit, which may arise directly or indirectly from the use of or reliance on such information.
All investments involve risk, and the past performance of a security, industry, sector, market, financial product, trading strategy, backtest, or individual's trading does not guarantee future results or returns. Investors are fully responsible for any investment decisions they make. Such decisions should be based solely on an evaluation of their financial circumstances, investment objectives, risk tolerance, and liquidity needs.
My Scripts/Indicators/Ideas/Algos/Systems are only for educational purposes!
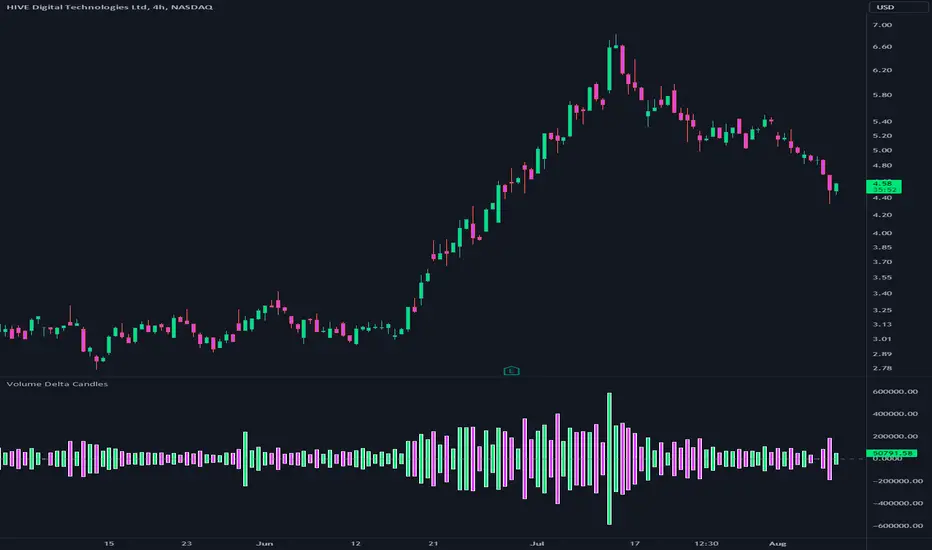
Volume Delta CandlesThis indicator is designed to visualize the volume delta, which represents the difference between buying and selling volumes during each candle period. The indicator plots custom candlesticks on the chart, with OHLC values calculated based on the volume delta.
Calculations:
To calculate the volume delta, the indicator first determines the buying and selling volumes. If the closing price is higher than the opening price (close > open), the volume is considered as buying volume. If the closing price is lower than the opening price (close < open), the volume is considered as selling volume. Otherwise, the volume is set to zero. The volume delta is then calculated as the difference between the buying volume and the selling volume.
The custom OHLC values are derived from the volume delta. The custom open is obtained by subtracting the volume delta from the closing price. The custom close is obtained by adding the volume delta to the closing price. The custom high is set as the maximum value between the closing price and the custom open, ensuring that the candle represents the highest value within the range. The custom low is set as the minimum value between the closing price and the custom open, ensuring that the candle represents the lowest value within the range.
Interpretation:
The indicator's custom candles provide visual insights into the volume delta. Each candlestick's color (lime for positive volume delta, fuchsia for negative volume delta) indicates the dominance of buying or selling pressure during that period. When the volume delta is positive, it suggests that buying volume exceeded selling volume, possibly indicating a bullish sentiment. Conversely, when the volume delta is negative, it indicates that selling volume was higher, potentially signaling a bearish sentiment. The indicator also plots a zero line to represent the equilibrium point, where buying and selling volumes are equal.
Potential Uses and Limitations:
Traders can use the indicator to gain insights into the strength and direction of buying and selling pressures. Positive volume delta during an uptrend could suggest the presence of strong buying interest, potentially supporting further bullish moves. On the other hand, negative volume delta during a downtrend could indicate intensified selling pressure, hinting at potential further declines. Traders might use the indicator in conjunction with other technical analysis tools, such as support and resistance levels, trendlines, or oscillators, to confirm potential reversal points or trend continuations.
It's essential to interpret the indicator in the context of the overall market environment. While volume delta can provide valuable insights into short-term buying and selling imbalances, it is just one aspect of market analysis. Traders should consider other factors, such as market structure, fundamental events, and overall sentiment, to make informed trading decisions. Additionally, the indicator's efficacy might vary across different market conditions, and it may produce false signals during low-volume periods or choppy markets.
Conclusion:
By visualizing volume delta through custom candlesticks, traders can gauge market sentiment and potentially identify key reversal or continuation points. As with any technical indicator, it is advisable to use the Volume Delta Candles in combination with other tools to gain a comprehensive understanding of market conditions and make well-informed trading choices. Additionally, traders should practice proper risk management techniques to protect their capital while using the indicator in their trading strategy.
RSI Candle Advanced V2RSI Advanced
As the period value is longer than 14, the RSI value sticks to the value of 50 and becomes useless.
Also, when the period value is less than 14, it moves excessively, so it is difficult for us to see the movement of the RSI .
So, using the period value and the RSI value as variables, I tried to make it easier to identify the RSI value through a new function expression.
This is how RSI Advanced was developed.
Period below 14 reduce the volatility of RSI , and period above 14 increase the volatility of RSI, allowing overbought and oversold zones to work properly and give you a better view of the trend.
By applying the custom algorithm so that the 'RSI Advanced' with period on a 5-minute timeframe has the same value as the 'original RSI' with period on a 60-minute timeframe.
As another example, an 'RSI Advanced' with a period in a 60-minute time frame has the same value as an 'original RSI' with a period in a 240-minute time frame.
Compare the difference in the RSI with a period value of 200 in the snapshot.
------------------------------------------------------------------------------------------
RSI Candlestick
RSI derives its value using only the closing price as a variable.
I solved the RSI equation in reverse and tried to include the high and low prices of candlesticks in the equation.
As a result, 'if the high or low was the closing price, the value of RSI would be like this' was implemented.
Just like when a candle comes down after setting a high price, an upper tail is formed when RSI Candle goes down after setting a high price!!
In divergence, we had to look only at the relationship between closing prices, but if we use RSI candles, we can find divergences in highs and highs, and lows and lows.
Existing indicators could not express "gap", but Version 2 made it possible to express "gap"!!!!!!
RSI can be displayed as candlesticks, bars and lines
Then enjoy my RSI!
----------------------------------------------------------------------------------------
RSI Advanced
기간값이 14보다 길어질수록 RSI값은 50값에 달라붙게 되어서 쓸모가 없어집니다.
또 기간값이 14보다 줄어들수록 과도하게 움직여서 우리는 RSI의 움직임을 보기가 힘듭니다.
그래서 기간 값과 RSI 값을 변수로 사용하여 새로운 함수 식을 통해 RSI 값을 식별하기 편하도록 해보았습니다.
이렇게 RSI Advanced가 개발되었습니다.
기간값이 14보다 낮으면 rsi의 변동폭이 줄어들고, 기간값이 14보다 크면 변동폭이 넓어져 과매수 및 과매도 영역이 제대로 작동하여 추세를 더 잘 볼 수 있습니다.
또한 저는 5분 타임프레임의 기간값이 168(=14*12)인 RSI가 주기 값이 14인 60분 타임프레임의 RSI와 동일한 값을 갖도록 적절한 함수 표현식을 적용하여 RSI를 변경했습니다.
다른 예로, 15분 시간 프레임에서 기간값이 56(=14*4)인 RSI는 60분 시간 프레임의 기간값이 14인 RSI와 동일한 값을 갖습니다.
기간값이 200인 RSI의 차이를 스냅샷에서 비교해보십시오.
-----------------------------
RSI Candlestick
RSI는 종가만을 변수로 사용하여 값을 도출해냅니다.
저는 RSI 식을 역으로 풀어내어서 캔들스틱의 고가와 저가, 시가를 식에 포함시켜보았습니다.
결과적으로, '만약 고가나 저가가 종가였다면 RSI의 값이 이럴것이다'를 구현해내었습니다.
캔들이 고가를 찍고 내려오면 윗꼬리가 생기듯 RSI Candle에서도 고가를 찍고 내려오면 윗꼬리가 생기는겁니다!!
다이버전스 또한 원래는 종가끼리의 관계만 봐야했지만 RSI 캔들을 이용한다면 고가와 고가, 저가와 저가에서도 다이버전스를 발견할 수 있습니다.
기존의 지표는 "갭"을 표현하지 못했지만 Version 2 에서는 "갭"을 표현할 수 있게 만들었습니다!!!!!!
그럼 잘 사용해주십시오!!!

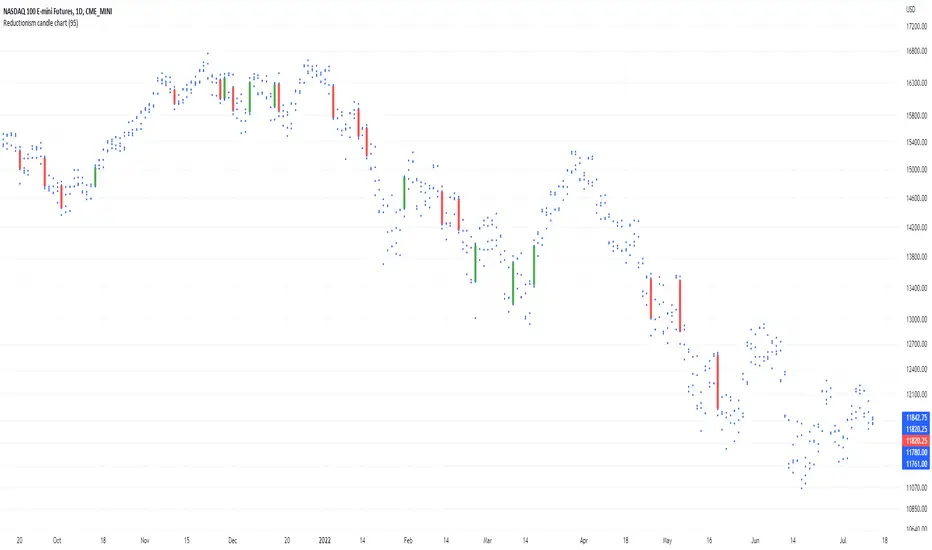
Reductionism candle chartHere I am introducing "Reductionism candle chart", in most of the case takeing away those distracting "candles", and also remaining the most of data (4 dots) for each index on the chart.
And only keeping high valuation change "price gap" filled up with candles.
For someone who don't relies on candles to their decision. Usually candles are redundant to them.
For someone who uses candle, definitely not all candles are carrying the same amount of information.
Most often less is more, in terms of representing the thing that is not related to your model.
This script the color and the volatility boundary are changeable, so no additional coding is required to use it.
Enjoy :)
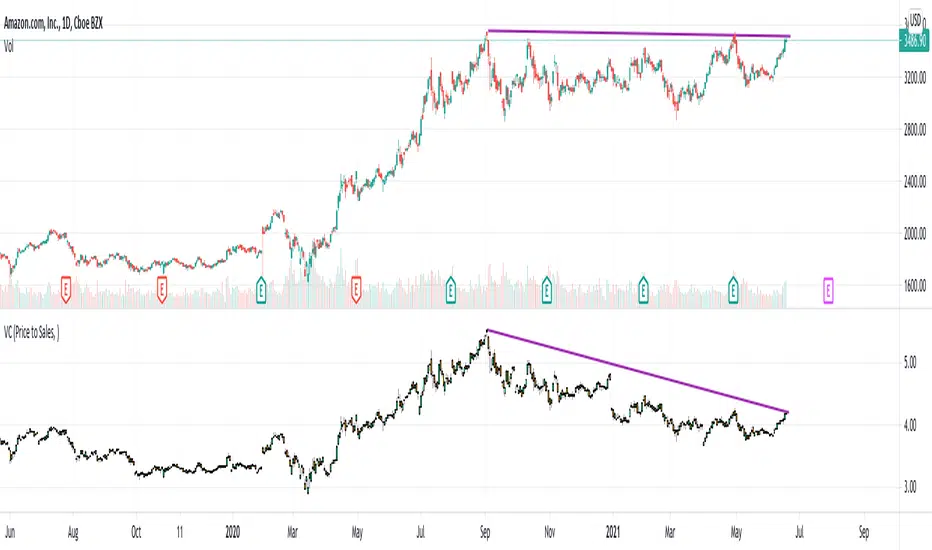
Value CandlesCreating candles from value stats as an experiment. These candles will almost always follow price candles except when there is a deviation.
Strategies based on buying the dips can be applied better on value candles. This is because, drop in value candles imply real bargain whereas drop in price candles can also be due to some other factors.
We can clearly see in the Amazon chart that value candles have come down even though price candles are at same level from September. This signifies AMZN stock is having more value now (due to increased sales from September to now) than back in September even though the price is same.
Another simple thing we can do is move Value candles into same overlay as that of price candles. This will look something like this:
Key thing to remember : Lower the value candle higher the relative value of stock.
Kawabunga Swing Failure Points Candles (SFP) by RRBKawabunga Swing Failure Points Candles (SFP) by RagingRocketBull 2019
Version 1.0
This indicator shows Swing Failure Points (SFP) and Swing Confirmation Points (SCP) as candles on a chart.
SFP/SCP candles are used by traders as signals for trend confirmation/possible reversal.
The signal is stronger on a higher volume/larger candle size.
A Swing Failure Point (SFP) candle is used to spot a reversal:
- up trend SFP is a failure to close above prev high after making a new higher high => implies reversal down
- down trend SFP is a failure to close below prev low after making a new lower low => implies reversal up
A Swing Confirmation Point (SCP) candle is just the opposite and is used to confirm the current trend:
- up trend SCP is a successful close above prev high after making a new higher high => confirms the trend and implies continuation up
- down trend SCP is a successful close below prev low after making a new lower low => confirms the trend and implies continuation down
Features:
- uses fractal pivots with optional filter
- show/hide SFP/SCP candles, pivots, zigzag, last min/max pivot bands
- dim lag zones/hide false signals introduced by lagging fractals or
- use unconfirmed pivots to eliminate fractal lag/false signals. 2 modes: fractals 1,1 and highest/lowest
- filter only SFP/SCP candles confirmed with volume/candle size
- SFP/SCP candles color highlighting, dim non-important bars
Usage:
- adjust fractal settings to get pivots that best match your data (lower values => more frequent pivots. 0,0 - each candle is a pivot)
- use one of the unconfirmed pivot modes to eliminate false signals or just ignore all signals in the gray lag zones
- optionally filter only SFP/SCP candles with large volume/candle size (volume % change relative to prev bar, abs candle body size value)
- up/down trend SCP (lime/fuchsia) => continuation up/down; up/down trend SFP (orange/aqua) => possible reversal down/up. lime/aqua => up; fuchsia/orange => down.
- when in doubt use show/hide pivots/unconfirmed pivots, min/max pivot bands to see which prev pivot and min/max value were used in comparisons to generate a signal on the following candle.
- disable offset to check on which bar the signal was generated
Notes:
Fractal Pivots:
- SFP/SCP candles depend on fractal pivots, you will get different signals with different pivot settings. Usually 4,4 or 2,2 settings are used to produce fractal pivots, but you can try custom values that fit your data best.
- fractal pivots are a mixed series of highs and lows in no particular order. Pivots must be filtered to produce a proper zigzag where ideally a high is followed by a low and another high in orderly fashion.
Fractal Lag/False Signals:
- only past fractal pivots can be processed on the current bar introducing a lag, therefore, pivots and min/max pivot bands are shown with offset=-rightBars to match their target bars. For unconfirmed pivots an offset=-1 is used with a lag of just 1 bar.
- new pivot is not a confirmed fractal and "does not exist yet" while the distance between it and the current bar is < rightBars => prev old fractal pivot in the same dir is used for comparisons => gives a false signal for that dir
- to show false signals enable lag zones. SFP/SCP candles in lag zones are false. New pivots will be eventually confirmed, but meanwhile you get a false signal because prev pivot in the same dir was used instead.
- to solve this problem you can either temporary hide false signals or completely eliminate them by using unconfirmed pivots of a smaller degree/lag.
- hiding false signals only works for history and should be used only temporary (left disabled). In realtime/replay mode it disables all signals altogether due to TradingView's bug (barcolor doesn't support negative offsets)
Unconfirmed Pivots:
- you have 2 methods to check for unconfirmed pivots: highest/lowest(rightBars) or fractals(1,1) with a min possible step. The first is essentially fractals(0,0) where each candle is a pivot. Both produce more frequent pivots (weaker signals).
- an unconfirmed pivot is used in comparisons to generate a valid signal only when it is a higher high (> max high) or a lower low (< min low) in the dir of a trend. Confirmed pivots of a higher degree are not affected. Zigzag is not affected.
- you can also manually disable the offset to check on which bar the pivot was confirmed. If the pivot just before an SCP/SFP suddenly jumps ahead of it - prev pivot was used, generating a false signal.
- last max high/min low bands can be used to check which value was used in candle comparison to generate a signal: min(pivot min_low, upivot min_low) and max(pivot max_high, upivot max_high) are used
- in the unconfirmed pivots mode the max high/min low pivot bands partially break because you can't have a variable offset to match the random pos of an unconfirmed pivot (anywhere in 0..rightBars from the current bar) to its target bar.
- in the unconfirmed pivots mode h (green) and l (red) pivots become H and L, and h (lime) and l (fuchsia) are used to show unconfirmed pivots of a smaller degree. Some of them will be confirmed later as H and L pivots of a higher degree.
Pivot Filter:
- pivot filter is used to produce a better looking zigzag. Essentially it keeps only higher highs/lower lows in the trend direction until it changes, skipping:
- after a new high: all subsequent lower highs until a new low
- after a new low: all subsequent higher lows until a new high
- you can't filter out all prev highs/lows to keep just the last min/max pivots of the current swing because they were already confirmed as pivots and you can't delete/change history
- alternatively you could just pick the first high following a low and the first low following a high in a sequence and ignore the rest of the pivots in the same dir, producing a crude looking zigzag where obvious max high/min lows are ignored.
- pivot filter affects SCP/SFP signals because it skips some pivots
- pivot filter is not applied to/not affected by the unconfirmed pivots
- zigzag is affected by pivot filter, but not by the unconfirmed pivots. You can't have both high/low on the same bar in a zigzag. High has priority over Low.
- keep same bar pivots option lets you choose which pivots to keep when there are both high/low pivots on the same bar (both kept by default)
SCP/SFP Filters:
- you can confirm/filter only SCP/SFP signals with volume % change/candle size larger than delta. Higher volume/larger candle means stronger signal.
- technically SCP/SFP is always the first matching candle, but it can be invalidated by the following signal in the opposite dir which in turn can be negated by the next signal.
- show first matching SCP/SFP = true - shows only the first signal candle (and any invalidations that follow) and hides further duplicate signals in the same dir, does not highlight the trend.
- show first matching SCP/SFP = false - produces a sequence of candles with duplicate signals, highlights the whole trend until its dir changes (new pivot).
Good Luck! Feel free to learn from/reuse the code to build your own indicators!

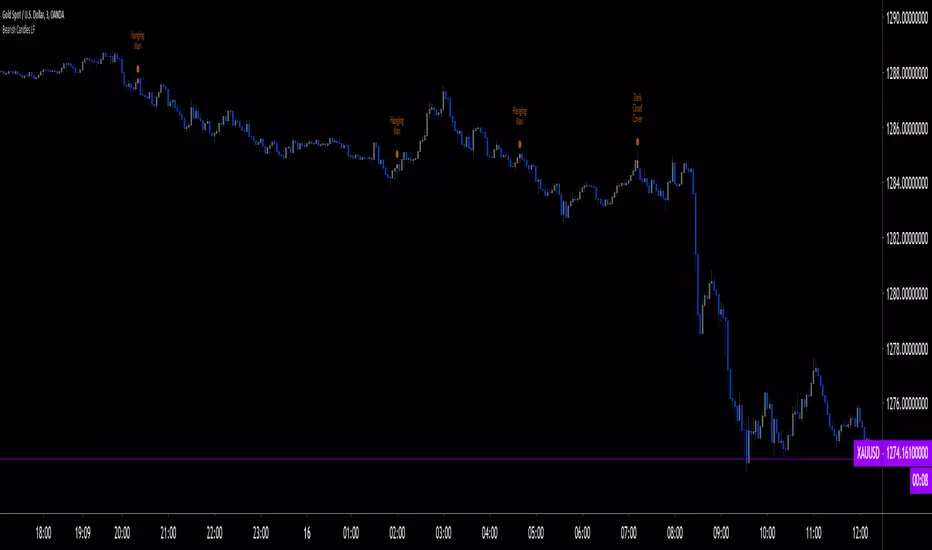
Bearish CandlesPlots 6 different kinds of bearish candlesticks. I started with HPotter's previous work, added 4 other types of bearish Candlesticks and bunched them in one indicator.
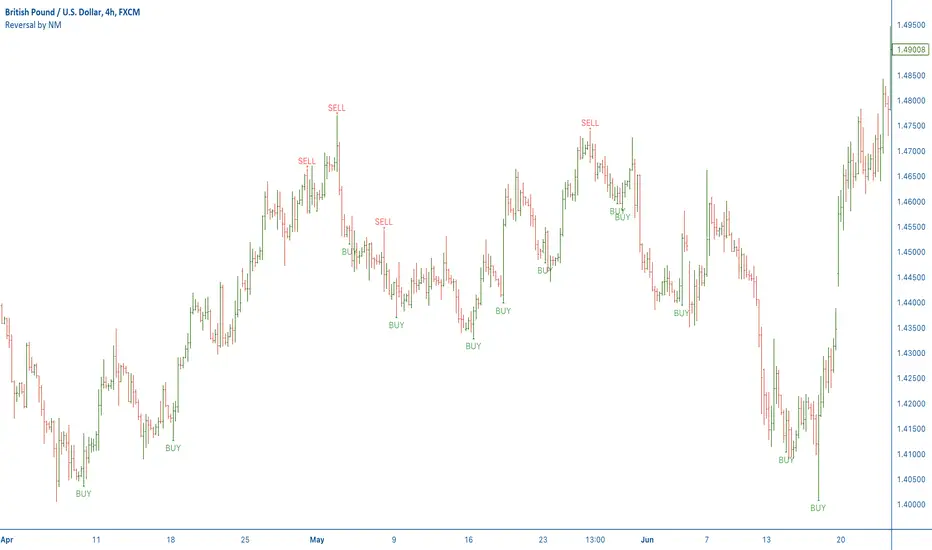
[NM] Reversal Candles v01Reversal candles are a very easy way to identify a turn in trend, this indicator has some specific additional conditions for the reversal candle.
BUY Signal reversal candle
Low of current candle exceeds low of previous candle
Low of current candle is lowest for last 7 candles
High of current candle exceeds high of previous candle
Close of current candle is in the upper 50% of the range of this candle
SELL Signal reversal candle
High of current candle exceeds high of previous candle
High of current candle is Highest for last 7 candles
Low of current candle exceeds low of previous candle
Close of current candle is in the lower 50% of the range of this candle
How do I trade it ? (example buy signal)
Wait for close of the candle and the BUY signal
Put a buy stop entry 5 pips above the high of the candle
Put a stop loss 5 pips below the low of the candle
Calculate difference between entry and stop loss and set your target that number of pips above the entry for a 1:1 RR trade*
Wait for your your target or stop loss to be triggered
* Alternatively, you can take 50% of the profit at the 1st (1:1 RR) profit target, move your stop to break even and let the rest of the position run for a higher potential profit.
Further advice on use
Personally I always look for some additional confirmation like a support or resistance level, a bounce of the EMA or a fibonacci level, but please feel free to add additional filters to make the strategy even more effective. I would strongly advise to backtest your strategy first so you can fine tune it and have confidence in trading it. Forward testing on a demo account before going live, although it takes longer, can be a worthy alternative. Works better on higher time frames.
How do you use it ?
Please leave a note in the comment section below to let me know if you use the indicator and how. There's definitely not just one way to use the indicator so I'm curious about your feedback.
To apply the script to your chart, just add it to your favourites so you can easily find it in the Indicators list.
Kindly leave me a thumbs up if you like this indicator or support my work, and do not hesitate to visit my other indicators. Thanks for your visit
GRaB Candles by mattlacoco with MMM by Harold_NL V1.1Update v1.1:
GRaB colors now green, red, gray
Added Murrey Range lines.
Cleaned up the code.
GRaB candles and a murrey math "midline" in one script.
Some traders using methods of Rob Booker (40% club, trifecta5) like to use both GRaB candles and Murrey Math to combine, or to compare entry and exit moments.
Color of candles are as GRaB candles.
Midline use: Crossing the midline is a change of color in murrey. Candles closing above the midline would be green and below would be red as murrey candles.
Credits:
Original script of Raghee Horner's GRaB Candles by Matt Lacoco (BUY BLUE SELL RED).
Murrey Math Midline added by Harold van Berk (most code copied from "UCS_Murrey's Math Oscillator_V2" by ucsgears)
Candle colors defined by GRaB
Green bulish, Red bearish, Gray neutral
Dark for close lower than open
Light for close higher than open
Candles that close above the Murrey Math Middle line would normally be (murrey) green. Below would be (murrey) red.
Murrey lines can be switched off in "format" of the indicator.

Opposing Candle V2🟩 OC (Opposing Candle) Multi–Timeframe Framework
🔍 Overview
The OC Indicator automatically detects and displays Opposing Candles (OCs) across up to three timeframes.
An Opposing Candle is a candle that fully engulfs the previous one, signaling a potential shift in control — either a trend continuation or a trend reversal.
This multi–timeframe framework gives traders a structured way to visualize displacement, pullbacks, and momentum shifts between timeframes.
⚙️ How It Works
Each OC is drawn as a box showing:
High & Low → The candle’s full range
Open Line (black) → Key control level
Midline (white) → Candle equilibrium
Optional labels for timeframe and session
You can enable up to 3 timeframes (e.g., 30m / 1H / 4H) and adjust how many OCs to display for each.
📈 Trading Framework
🔹 Continuation Setup (Trend Following)
1. 4H Bias → Bullish or Bearish
Identify clear trend structure (HH/HL = bullish, LH/LL = bearish).
Confirm strong displacement and visible gaps between OCs — signs of momentum and healthy trend continuation.
2. 1H Confirmation OC
OC forms in the direction of the 4H bias, confirming control.
3. 30min Pullback OC
Opposite–colored OC appears → represents the pullback.
4. Entry Trigger
A yellow candle closes beyond the 30min OC open line, confirming the end of the pullback.
→ Enter in trend direction.
🎯 Targets
Target 1: Next 1H OC high or low (in trend direction)
Target 2: Next 4H OC high or low
🛑 Stop: Beyond the 30min OC’s opposite wick
🔹 Reversal Setup (Trend Shift)
1. 4H Structure → Extended or Losing Momentum
When there are no higher–timeframe gaps and no displacement, momentum weakens — often a sign of potential reversal.
2. Opposing OC Forms on HTF
A strong engulfing OC appears against the previous trend at a key structural level.
3. Lower–Timeframe Alignment
1H and 30min OCs begin forming in the new direction, confirming control shift.
4. Entry Trigger
Break of the lower–timeframe OC open line signals the reversal confirmation.
🟢 Example: Bullish Reversal
4H downtrend shows compression (no displacement)
4H bullish OC forms at support
30min breaks above a bearish OC’s open line → Go long
🔴 Example: Bearish Reversal
4H uptrend stalls at resistance
4H bearish OC forms
30min breaks below a bullish OC’s open line → Go short
🎯 Targets
Target 1: Nearest opposing 1H OC high/low
Target 2: Major 4H structural high/low
🛑 Stop: Beyond the reversal OC wick
🧠 Key Concepts
Displacement = Strength. Strong, impulsive moves with clear gaps between OCs show continuation.
Compression = Weakness. Overlapping candles and no HTF displacement often hint at reversal.
OC = Control Candle. The open line is the “line in the sand” — when price breaks it, control flips.
Multi–TF Confluence = Precision. 4H → 1H → 30m gives you structure → confirmation → entry accuracy.
🎨 Features
✅ Multi–Timeframe OC detection (default: 30m / 1H / 4H)
✅ Bullish & Bearish boxes with open and midlines
✅ Break candles highlighted yellow
✅ Optional labels (timeframe + session)
✅ Session filters (Asia, London, NYAM, NYPM)
✅ Fully customizable visuals and extension lengths
