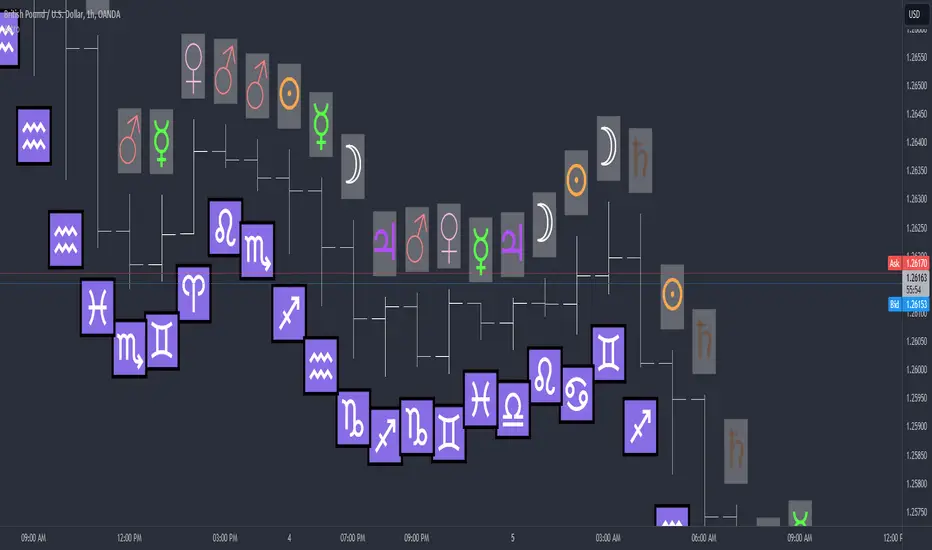
Astro-CandlesThis script is just for fun.
It generates a Planet and a Zodiac Sign at the close of each candle.
The candle is "sliced" into 7 sections, one for each Planet and the close lands in one of those sections.
The candle is "sliced" into 12 sections, one for each Zodiac and the open lands in one of those sections.
You could use it to generate a quick "answer" to a question.
You could use to contemplate your day if you use the daily candle.
You could even try to use it to trade and make some money, somehow.
Every combination should be possible, Moon in Aries, Mars in Capricorn, whatever.
Since it's based on candle structure, it might yield some interesting information.
Or not!
Enjoy!
Cari dalam skrip untuk "candle"
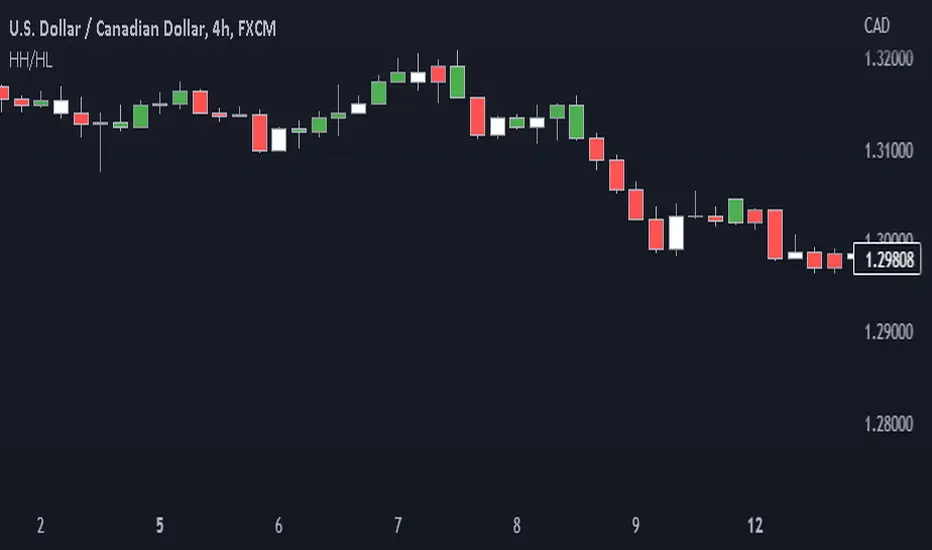
Price action: candlestick trend painter This script paints bars in different colors based on whether they are trending up or down.
It shows you if a candle is bearish or bullish based on the high and low of the previous candle.
Bull candles form higher highs (HH) and higher lows (HL) from the previous candle and are painted green.
Bear candles form lower highs (LH) and lower lows (LL) from the previous candle and are painted red.
Disclaimer
Copyright by Drbondsbody.
The information contained in my scripts/indicators/ideas does not constitute financial advice or a solicitation to buy or sell any securities of any type. I will not accept liability for any loss or damage, including without limitation any loss of profit, which may arise directly or indirectly from the use of or reliance on such information.
All investments involve risk, and the past performance of a security, industry, sector, market, financial product, trading strategy, or individual’s trading does not guarantee future results or returns. Investors are fully responsible for any investment decisions they make. Such decisions should be based solely on an evaluation of their financial circumstances, investment objectives, risk tolerance, and liquidity needs.
My scripts/indicators/ideas are only for educational purposes!
Highlight 6-7 PM (IST) candle + mark H/L (Hourly)📌 Highlight 6–7 PM Candle (IST) + High/Low Lines (No Labels)
This indicator automatically detects the 6:00–7:00 PM candle (IST) on the hourly timeframe and visually marks it on the chart.
It highlights the candle and draws horizontal High and Low levels without any labels—making the chart clean and easy to read.
✅ Features
Highlights the 6–7 PM hourly candle (timezone adjustable: IST/UTC/Exchange).
Draws high & low horizontal lines from the target candle.
Option to extend the lines for a selected number of bars.
Optional restriction to only show on 1-hour timeframe.
Clean design — no labels, no clutter.
🛠️ Inputs
Timezone (default: Asia/Kolkata)
Target Hour (default: 18 = 6 PM)
Highlight Color
High/Low Line Colors
Line Extension Length
Enable/Disable Hourly-only Mode
🎯 Use Case
Useful for traders who track post-market candles, volatility behavior, range levels, or want to build intraday strategies based on evening session highs/lows.

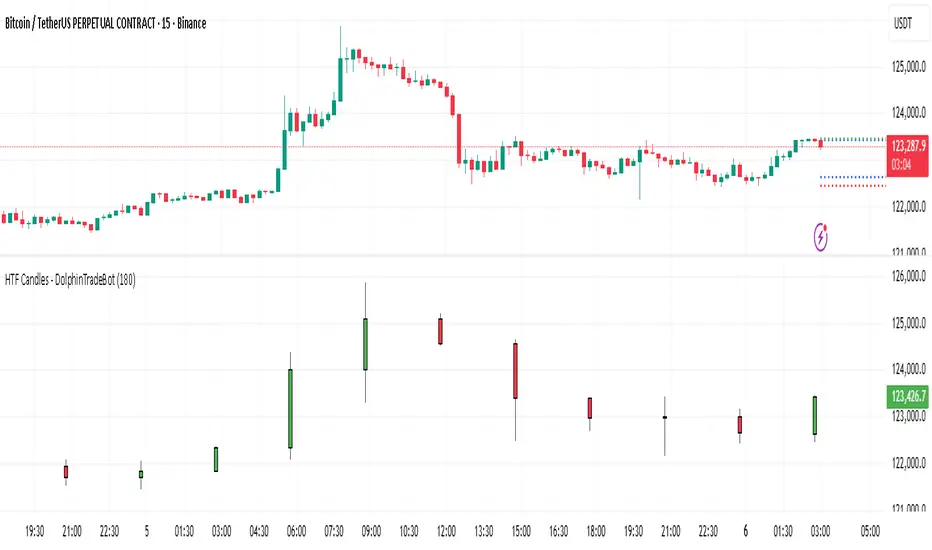
HTF Candles - DolphinTradeBot1️⃣ Overview
The "HTF Candles - DolphinTradeBot" indicator displays higher timeframe (HTF) candlesticks and their OHLC (Open, High, Low, Close) levels on any lower timeframe chart.
While staying on lower timeframes this helps confirm entries or reversals and visualize major market structure, trend bias, and key price zone
2️⃣ How to Use It ?
Use these levels to identify major support/resistance or trend structure.
Observe higher timeframe candle formations (e.g., engulfing, pin bar, doji)
3️⃣ ⚙️Settings
TimeFrame → Select the higher timeframe to display.
Show OHLC Levels → Toggle lines for Open, High, Low, Close.
Line Colors → Customize the color for each level.
Double Inside Body Candles with Box & Alert + 5-Bar LinesThis indicator identifies Double Inside Body Candle patterns, where:
Candle 1 is completely inside Candle 2,
Candle 2 is completely inside Candle 3 (the parent candle),
Candle 3 has a real body (not a doji or negligible body size).
Once the pattern is detected:
A label appears below the current candle.
A highlight box is drawn around Candle 3 (the parent candle) body range.
Horizontal lines are drawn from the top and bottom of Candle 3’s body and extend forward for exactly 5 bars to visualize potential breakout levels.
The script also detects and highlights breakouts:
🔼 Bullish breakout: if price closes above Candle 3's body high.
🔽 Bearish breakout: if price closes below Candle 3's body low.
Alerts are available for:
Double Inside Body pattern detection
Bullish breakout
Bearish breakout
Traders can use this script to identify consolidation periods (double inside bars), then monitor for breakout opportunities in either direction, using the 5-bar lines as short-term breakout levels.

Wick to Candle Ratio with Multiple ColorsThe display in question likely provides visual representations or data related to the concept of the dot-based wick-to-body ratio. This ratio is a term often used in financial markets, particularly in the context of candlestick charts.
In candlestick charts, each candlestick represents a specific time period (such as a minute, hour, day, etc.) and provides four pieces of price data: the opening price, closing price, highest price, and lowest price of an asset within that timeframe. The "body" of the candlestick is the area between the opening and closing prices, while the "wicks" (or shadows) are the lines extending from the body, representing the highest and lowest prices during the period.
The dot-based wick-to-body ratio refers to a method of quantifying the relative lengths of the wicks compared to the body using dots or points. In this context, a display illustrating this ratio might show different candlesticks with highlighted dots representing the ratio between the length of the wick and the body. A higher ratio could indicate more volatility in price movements during that timeframe, while a lower ratio might suggest comparatively stable price action.

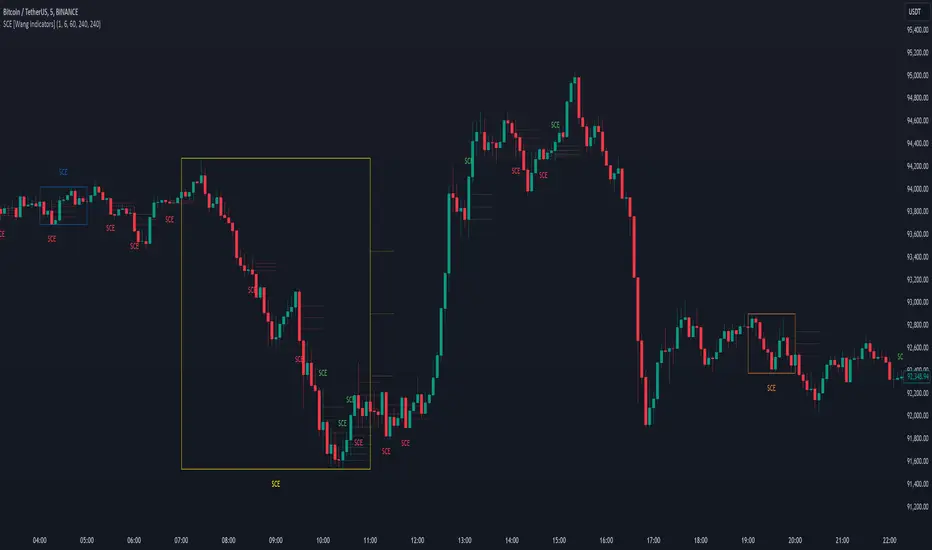
Single Candle Entry with Multi-Timeframe [Wang Indicators]
Single candle entry
Overview : The "Single Candle Entry Model" indicator is designed to help traders through a simple yet effective trading strategy. This indicator automatically detects candles that encompass both the high and low of the previous candle, creating key price zones for potential market entries.
- This indicator was developed with the help of @DaveTeaches -
How does it works ?
Detects when a candle trade above the high and below the low of the previous candle
When it occur, the indicator write "SCE" on the candle
The text will be in different color if its bearish or bullish (customizable by user)
Higher Timeframes
Users can enable up to 3 HTF SCE detection to enhance multi timeframe analysis.
Users can select which timeframe he want to use
Boxes will be displayed around High time frame SCE to highlight the HTF candle.
As regular SCE, the indicator will write "SCE" above or under the box
How does it helps users ?
Once the SCE is created, it can be used as a zone.
Levels (30, 50 and 70%) are displayed
Users can customize their apparence as they see fit
The 30 - 50 - 70 levels are support/resistance that the price tend to bounce of off
You might find some success looking for an entry inside the zone at a level if price gives further confirmations such as a lower time frame flip or using other indicators
Alert can be setup on any timeframe
HTF Control Shift CandlesHTF Control Shift Candles highlights reversal-type candles that show a decisive shift in market control between buyers and sellers. These candles are detected by measuring wick length relative to the entire range and the close’s position within that range. A bullish control shift occurs when a candle forms with a long lower wick and closes in the top portion of its range, showing strong rejection of lower prices and a buyer takeover. A bearish control shift occurs when a candle forms with a long upper wick and closes in the bottom portion of its range, showing rejection of higher prices and a seller takeover. Candles are automatically recolored for fast visual recognition, and alerts are built in so traders never miss a potential shift in control.
This tool is specifically designed for 30-minute and higher timeframes, where control shift candles carry greater significance for swing and intraday setups. Inputs allow you to adjust wick percentage (wickPct) and body percentage (bodyPct) thresholds for different levels of sensitivity. For example, with wickPct = 0.5 and bodyPct = 0.3, a bullish control shift requires the lower wick to be at least 50% of the entire range and the close to finish in the top 30%. By tuning these values, traders can refine the detection for different volatility regimes or personal trading strategies.
Bar Close Confirmation Only
This indicator confirms signals only after the candle has closed. The calculation requires final values for open, high, low, and close, which are not fixed until the bar finishes forming. That means no mid-bar or intrabar repainting — alerts and highlights trigger only once the bar is complete. For example, if a candle temporarily has a long lower wick but closes back in the middle of its range, it will not be marked as a bullish control shift. This ensures accuracy by waiting for the final candle close before confirming that buyers or sellers truly maintained control.
Control shift candles can be especially useful around liquidity sweeps, support/resistance zones, or after extended moves, as they often mark key turning points. A bullish control shift near demand may provide an early entry confirmation for longs, while a bearish control shift at supply may signal short opportunities or exits from longs. This makes the indicator a versatile tool for anticipating reversals, timing entries with precision, and filtering signals on higher timeframes where market structure shifts are most impactful.

Opening candle indicator
The indicator only works in the US and Saudi markets. Its idea is to draw a line for the highest and lowest prices of the first opening candle on a five-minute frame. A break of the highest price of the candle means a buy, while a break of the lowest price of the candle means a sell. Three lines are drawn as price targets calculated at twice the length of the opening candle... The lines in the previous trading session disappear when the current session begins.
Exponential moving averages can be used to help decide whether to stay in the trade or sell.
When using the indicator, you must go to the indicator settings and change the market.
يعمل هذا المؤشر فقط في السوقين الأمريكي والسعودي. وتتمثل فكرته في رسم خط لأعلى وأدنى سعرين للشمعة الافتتاحية الأولى على إطار زمني مدته خمس دقائق. كسر أعلى سعر للشمعة يعني الشراء، بينما كسر أدنى سعر للشمعة يعني البيع. تُرسم ثلاثة خطوط كأهداف سعرية محسوبة بضعف طول الشمعة الافتتاحية... تختفي خطوط جلسة التداول السابقة عند بدء الجلسة الحالية.
يمكن استخدام المتوسطات المتحركة الأسية للمساعدة في تحديد ما إذا كان ينبغي الاستمرار في التداول أم البيع. عند الرغبة في استخدامه يجب الذهاب لإعدادت المؤشر وتحديد السوق إما الأمريكي أو السعودي.

Period Counter CandleDescription:
The Period Candle Counter is a Pine Script v6 indicator designed to track and display candle statistics within a user-defined time range. This tool provides valuable insights into market movement by counting green (bullish) and red (bearish) candles within the selected period, along with their respective percentages.
Additionally, it calculates the total duration of the selected candles based on the current chart timeframe. This allows traders to understand how much actual market time has passed during the analyzed period.
Features & Functionality:
✅ Custom Time Selection:
Users can define a start and end time for the analysis.
The indicator automatically identifies and tracks candles within this period.
✅ Candle Count & Percentages:
Total Candles in the selected period.
Green Candle Count & Percentage (bullish candles).
Red Candle Count & Percentage (bearish candles).
✅ Time Calculation:
Multiplies the number of candles by the chart timeframe.
Converts the total time into hours and minutes (e.g., "2h 30m").
✅ User-Friendly Display:
Data is neatly organized in a panel positioned in the top-right corner of the chart.
Background highlighting is applied during the selected period for easy visualization.
Use Cases:
📊 Trend Analysis – Helps traders identify whether a session was bullish or bearish.
⏳ Market Session Timing – Understand how long a specific trend or movement lasted.
📉 Backtesting Strategy Support – Evaluate historical periods efficiently.

Three Candle Breakout Marker**Title: Three Candle Breakout Marker**
**Description:**
The **Three Candle Breakout Marker** is a powerful trading indicator designed for traders who want to identify significant price movements based on recent price action. This script marks candles that break above the highest high or below the lowest low of the previous three candles, providing clear visual signals for potential trading opportunities.
### Key Features:
- **Visual Indicators**: The indicator uses upward blue triangles to signify when a candle closes above the highest high of the last three candles, indicating a bullish breakout. Conversely, it uses downward orange triangles to mark when a candle closes below the lowest low of the last three candles, signaling a bearish breakout.
- **Customizable Alerts**: Traders can easily customize this indicator to suit their trading strategies by adjusting colors and sizes for better visibility on their charts.
- **Enhanced Chart Analysis**: With optional horizontal lines drawn at the breakout levels, traders can quickly assess key support and resistance areas, enhancing their decision-making process.
### How to Use:
1. **Add to Chart**: Simply add the indicator to your TradingView chart for any asset or timeframe you are analyzing.
2. **Identify Breakouts**: Look for blue triangles above candles for bullish breakout signals and orange triangles below candles for bearish breakout signals.
3. **Combine with Other Tools**: Use this indicator in conjunction with other technical analysis tools and indicators to confirm signals and improve your trading strategy.
### Conclusion:
The **Three Candle Breakout Marker** is an essential tool for traders looking to capitalize on momentum shifts in the market. By clearly marking breakout points, it helps traders make informed decisions and enhances their ability to react swiftly to changing market conditions.
Feel free to explore and customize this indicator to fit your trading style! Happy trading!

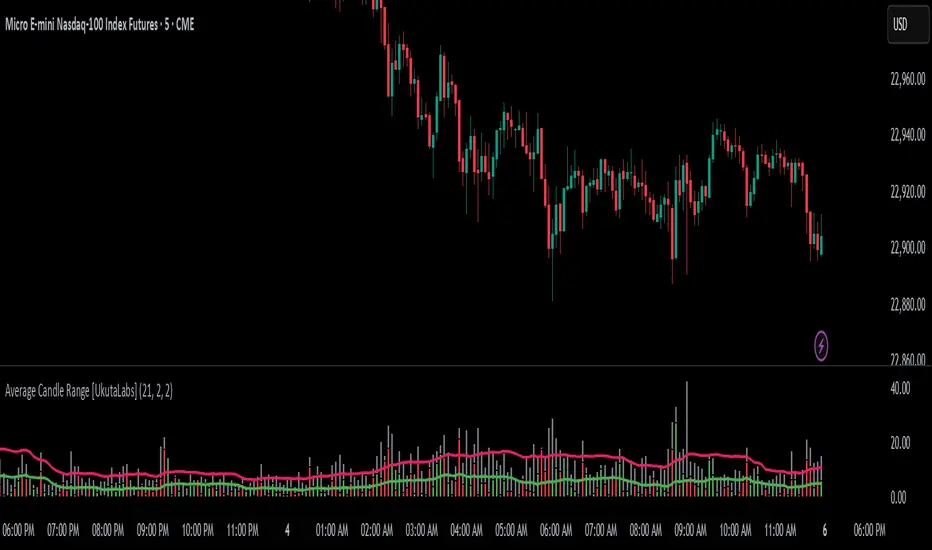
Average Candle Range [UkutaLabs]█ OVERVIEW
The Average Candle Range is a powerful indicator that compares the size of the current bar to past bars. This comparison can be used in a wide variety of trading strategies, allowing traders to understand at a glance the relative size of each candle.
█ USAGE
As each candlestick forms, two bars will be plotted on the indicator. The grey bar represents the total range of the candle from the high to the low, and the second bar represents the body of the bar from the open to the close. Depending on whether the bar is bullish or bearish, the second bar will be colored green or red respectively.
Two averages will also be drawn over these bars that represent the average size of the two bar types over a period that is specified by the user. These averages can be toggled in the indicator settings.
█ SETTINGS
Configuration
• Period: Determines how many bars to use in the calculation of the averages.
• Show Bar Average: Determines whether or not the average for the full bar size is displayed.
• Show Body Average: Determines whether or not the average for the body is displayed.
EMA Divergence Color CandlesThis indicator colors candles based on their position relative to the EMA and the strength of the divergence.
Above EMA → Blue (bullish zone)
Below EMA → Red (bearish zone)
Divergence strength is shown in 3 color levels:
Weak (close to EMA)
Medium
Strong (far from EMA)
The indicator draws its own candles, so no TradingView settings need to be changed.
The EMA line is also shown on top of the custom candles.

CISD Trend Candle - EMA + Always MACDThis indicator combines trend detection using EMA with constant MACD cross signals to provide a clear visual understanding of market direction and potential entry/exit points.
■ 1. Trend Detection with EMA (Candle Coloring)
Calculates an EMA (default: 21).
Checks whether the last n candles (default: 5):
Close above the EMA → Uptrend (Blue candles)
Close below the EMA → Downtrend (Red candles)
Otherwise → Neutral (Gray candles)
Candle colors automatically change to show the current market trend at a glance.
■ 2. Always-Visible MACD Golden/Dead Cross Signals
Based on MACD settings (12, 26, 9)
Golden Cross → Blue upward triangle below the bar
Dead Cross → Red downward triangle above the bar
Signals are always displayed, regardless of trend state, making them useful for timing entries and exits.
■ 3. EMA Line Display
The EMA used for trend detection is plotted as an orange line.
🎯 Ideal Use Cases
This indicator is designed for traders who want to:
Quickly visualize trend direction through candle colors
Always monitor MACD cross signals
Improve decision-making with simple, intuitive visual cues

Bullish Candlestick with No or Small Bottom Wickthis indicator highlights bullish candles with no lower wick of with a very small lower wick. the idea is that when this occurs, price will sooner or later get back to this area. you could use it for a strategy that sets up shorts just below the bullish candle.

Micro Daily CandlesThis helps me visualize the daily candles on a micro scale by looking at the intraday chart.
The open and close are filled red and green making the body of the daily candle. The current day high and low are marked and represents the daily candle wick.

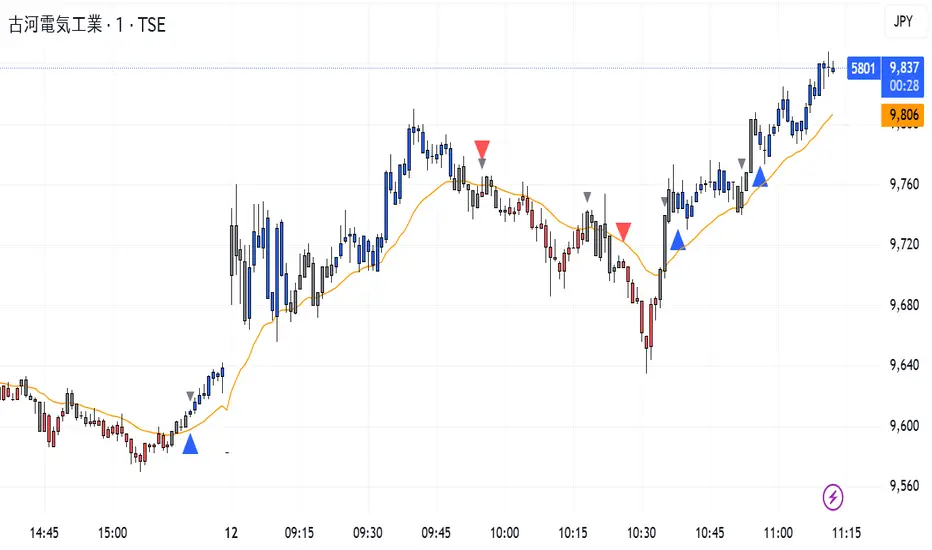
CISD Trend Candle + MACD SignalThis custom TradingView indicator combines trend-based candle coloring with MACD reversal detection to generate clear entry and exit signals:
🔷 Blue triangle (Buy): Appears when the candles confirm an uptrend (e.g., 5 consecutive closes above 21 EMA) and no long position is currently held.
🔴 Red triangle (Sell): Appears when the candles confirm a downtrend (e.g., 5 consecutive closes below 21 EMA) and no short position is currently held.
⚪ Gray triangle (Exit):
If in a long position, it shows when the candle turns neutral (gray) and the MACD crosses down (bearish signal), or the trend turns red.
If in a short position, it shows when the candle turns neutral and the MACD crosses up (bullish signal), or the trend turns blue.
🟠 Orange line: 21-period EMA used for trend validation.
This logic prevents premature entries and provides structured exit points, aiming to avoid false signals in choppy markets.
Wp's Vector CandlesVector Candles are special, color-coded candlesticks that highlight significant market activity, showing intense buying/selling (climax), institutional entry, momentum shifts, or potential reversals by analyzing high volume and large price ranges (spreads). They transform normal charts to instantly spot areas of extreme participation (bullish green/blue, bearish red/violet) versus standard conditions (gray), helping traders see market dynamics beyond just price.

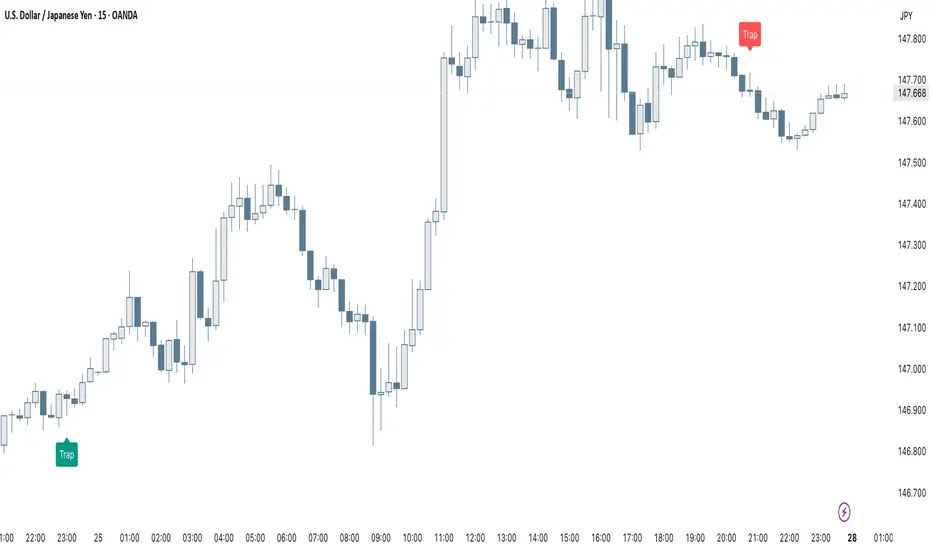
Smart Trap Candle Detector [Pro]Purpose
The Smart Trap Candle Detector is designed to identify common fakeout scenarios in the market, where price breaks a key swing high or low and quickly reverses. These “trap candles” often mislead breakout traders and are commonly used by smart money to induce liquidity before reversing.
How It Works
The script detects potential trap candles using these conditions:
A bearish trap is identified when price breaks above a recent swing high and closes back below it.
A bullish trap is identified when price breaks below a recent swing low and closes back above it.
Optional confirmation from the previous candle’s direction can be enabled.
Swing highs/lows are calculated dynamically using a configurable lookback window.
Once a trap candle is confirmed, a signal is displayed on the chart along with optional labels and alert conditions.
Features
Detects fake breakouts of swing highs and lows
Configurable swing lookback period
Optional confirmation candle filter
Optional label display on trap bars
Built-in alerts for bullish and bearish trap signals
Lightweight, real-time signal detection
Usage Tips
Best used on intraday timeframes such as 15m, 30m, or 1H
Use around key support/resistance zones or liquidity areas
Combine with other confluence signals such as order blocks or RSI divergence
Adjust the swing lookback period depending on the volatility of the asset
Rocket Engulfing Candles🚀 Rocket Engulfing Candles — Bullish & Bearish Detection
This script highlights powerful engulfing candles that resemble rockets — perfect for identifying potential reversals or momentum shifts.
Bullish Rocket (Green Triangle Up)
Fully engulfs the previous candle (higher high, lower low)
Closes higher (bullish body)
Has a longer lower wick (blast-off tail)
Bearish Rocket (Red Triangle Down)
Fully engulfs the previous candle
Closes lower (bearish body)
Has a longer upper wick (crash tail)
These patterns suggest strong buying/selling pressure with possible trend reversals. Ideal for traders looking to spot high-impact candle formations with a visual edge.

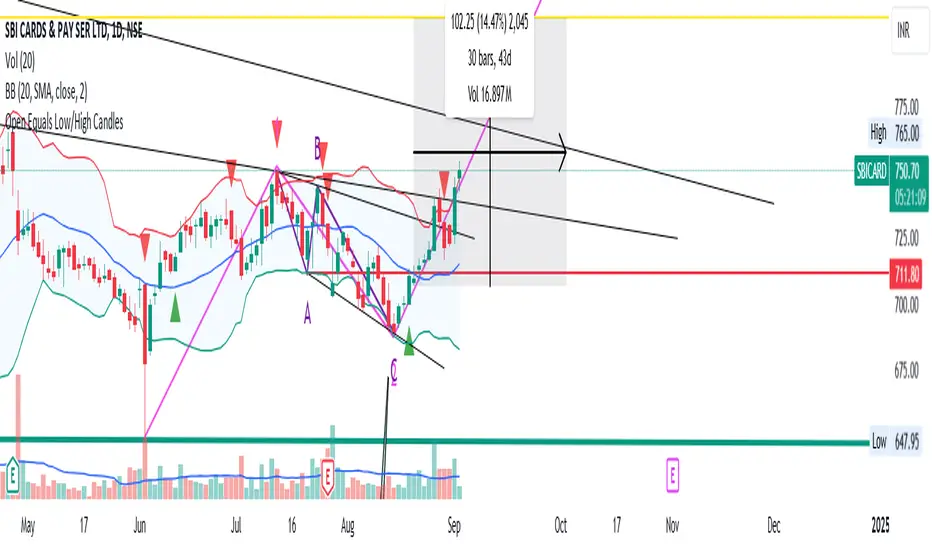
Open Equals Low/High Candles
This Indicator basically helps us to get the candles where Open = Low & Open =High.
Significance:
1) Open = Low Candles
----> Such candles are very powerful, as the Open = Low marks that there aren't any sellers left below the price on that day. Denoting BULLS power and aggression.
2) Open = High Candles
----> Open = High Candles signify that as soon as the markets opened, Bears were very strong, and no buyers left above the opening price for that candle. Denoting Strong BEARISH sentiment and aggression.
PS: This indicator can be used across all timeframes and indices. As it is purely based on Price-Action study.
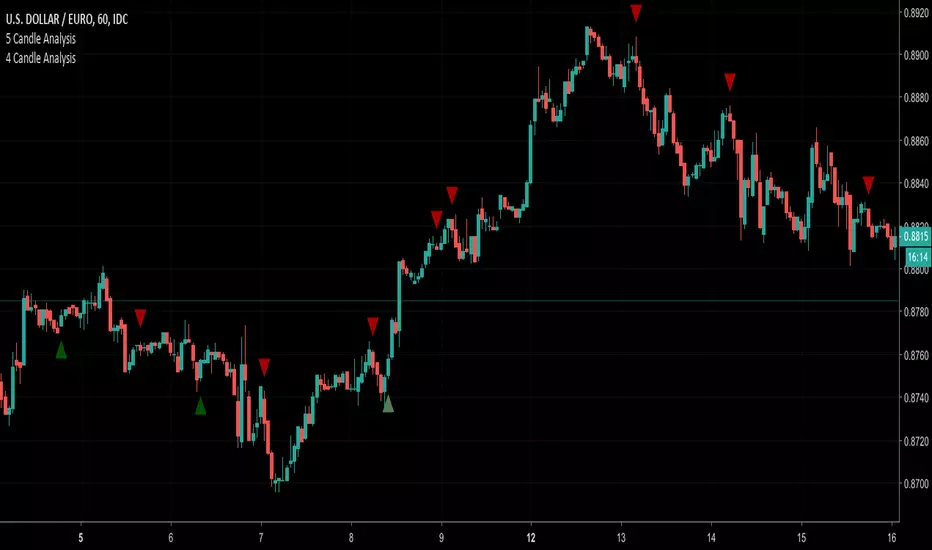
4 Candle AnalysisThis script looks at 4 candles at a time.
If the first 3 candles in the pattern are BEARISH and the 4th candle BULLISH engulfs the 3rd candle then a GREEN triangle UP will display BELOW the 4th candle
If the first 3 candles in the pattern are BULLISH and the 4th candle BEARISH engulfs the 3rd candle then a RED triangle DOWN will display ABOVE the 4th candle
Narayan Candle Up/Down Indicator //@version=5
indicator("Candle Up/Down Indicator", overlay=true)
// Candle colors
candleColor = close > open ? color.green : close < open ? color.red : color.gray
// Plot candles as background
bgcolor(candleColor, transp=80)
// Optional: plot arrow on up/down
plotshape(close > open, title="Up Candle", location=location.belowbar, color=color.green, style=shape.triangleup, size=size.tiny)
plotshape(close < open, title="Down Candle", location=location.abovebar, color=color.red, style=shape.triangledown, size=size.tiny)
