Volatility Resonance CandlesVolatility Resonance Candles visualize the dynamic interaction between price acceleration, volatility, and volume energy.
They’re designed to reveal moments when volatility expansion and directional momentum resonate — often preceding strong directional moves or reversals.
🔬 Concept
Traditional candles display direction and range, but they miss the energetic structure of volatility itself.
This indicator introduces a resonance model, where ATR ratio, price acceleration, and volume intensity combine to form a composite signal.
* ATR Resonance: compares short-term vs. long-term volatility
* Acceleration: captures the rate of price change
* Volume Energy: reinforces the move’s significance
When these components align, the candle color “resonates” — brighter, more intense candles signal stronger volatility–momentum coupling.
⚙️ Features
* Adaptive Scaling
Normalizes energy intensity dynamically across a user-defined lookback period, ensuring consistency in changing market conditions.
* Power-Law Transformation
Optional non-linear scaling (gamma) emphasizes higher-energy events while keeping low-intensity noise visually subdued.
* Divergence Mode
When enabled, colors can invert to highlight energy divergence from candle direction (e.g., bearish pressure during bullish closes).
* Customizable Styling
Full control over bullish/bearish base colors, transparency scaling, and threshold sensitivity.
🧠 Interpretation
* Bright / High-Intensity Candles → Strong alignment of volatility and directional energy.
Often signals the resonant phase of a move — acceleration backed by volatility expansion and volume participation.
* Dim / Low-Intensity Candles → Energy dispersion or consolidation.
These typically mark quiet zones, pauses, or inefficient volatility.
* Opposite-Colored Candles (if divergence mode on) → Potential inflection zones or hidden stress in the trend structure.
⚠️ Disclaimer
This script is for educational purposes only.
It does not constitute financial advice, and past performance is not indicative of future results. Always do your own research and test strategies before making trading decisions.
Cari dalam skrip untuk "candle"

Trend CandlesTrend Candles
Overview
The Trend Candles indicator is a simple yet effective tool designed to help traders visually identify the prevailing market trend. By combining candle coloring with a trend-based Exponential Moving Average (EMA), it enhances chart readability and makes trend-following strategies easier to apply.
Concepts
Exponential Moving Average (EMA): The EMA is a moving average that places more weight on recent price data. It reacts faster to price changes compared to a Simple Moving Average (SMA), making it well-suited for trend detection.
Trend Determination:
- If the EMA is rising (current EMA > previous EMA), the market is considered bullish.
- If the EMA is falling (current EMA < previous EMA), the market is considered bearish.
- If the EMA is flat (no significant change), no trend color is applied.
Candle Coloring:
- Green candles = Uptrend
- Purple candles = Downtrend
- Default candles = Sideways/Flat EMA
Features
- Trend Visualization: Candles automatically change color based on EMA slope, making it easy to spot bullish and bearish phases.
- Customizable EMA Length: The trader can set the EMA period (default is 50), allowing flexibility for short-term or long-term trend analysis.
- Overlay EMA Line: An orange EMA line is plotted on the chart for additional confirmation of the trend.
- Clean & Minimalist: Focuses on trend clarity without cluttering the chart with unnecessary signals.
How to Use
1. Apply the indicator to your chart.
2. Adjust the EMA Length as per your trading style (shorter = faster signals, longer = smoother trend).
3. Follow the candle color:
- Green = Favor long entries.
- Purple = Favor short entries.
- No color = Stay cautious, as trend is unclear.
4. Use with other confirmation tools (support/resistance, volume, or oscillators).
5. Users are encouraged to experiment with different EMA lengths. The default length is 50, but you can explore other values based on your needs. In particular, try Fibonacci numbers such as 13, 21, 34, 55, 89, 144, and 233 to observe how trends behave differently.
Disclaimer
The information provided by the Trend Candles indicator is for educational purposes only. It should not be considered financial advice. Trading involves substantial risk, and past performance is not necessarily indicative of future results. Always do your own research and use risk management practices.

IU Engulfing Candlestick PatternDISCRIPTION
📈 The IU Engulfing Candlestick Pattern indicator spotlights both bullish and bearish engulfing formations in real‑time. It shades each pattern with a transparent box and drops a concise label so you can catch potential reversals at a glance—no clutter, no noise, just the candles that matter.
USER INPUTS :
1. Pattern Recognition Based on = “Both” | “Wicks” | “Body” ( Default Both )
• Both → only highlights candles that satisfy **both** wick‑and‑body engulfing rules
• Wicks → checks full candle range (high‑to‑low)
• Body → checks only the real bodies (open‑to‑close)
2. Show Labels ( Default true )
If ticked then it will show the text as "Bullish Engulfing" or "Bearish Engulfing".
3. Show The Box ( Default true)
if ticked then it will show the green or red boxes.
INDICATOR LOGIC:
🔹 Bullish Engulfing (green box)
– Current bar closes higher than it opens and fully “wraps” the prior bar per your chosen rule.
🔹 Bearish Engulfing (red box)
– Current bar closes lower than it opens and fully “wraps” the prior bar per your chosen rule.
🔸 When a pattern confirms:
1. The script records the local high/low range.
2. Draws a semi‑transparent box spanning the engulfing pair.
3. Prints a compact up/down label exactly at the reaction point.
4. Fires a once‑per‑bar alert (“Bullish Engulfing” / “Bearish Engulfing”) you can route to webhooks or notifications.
WHY IT IS UNIQUE:
✨ Combines classic body‑only engulfing with an optional wick filter, letting traders demand stricter confirmation when markets are noisy.
✨ Box overlays visually segment the engulfed range—clearer than single‑bar markers.
✨ Lightweight: one input, zero repaint, and capped at 500 boxes to keep charts responsive.
✨ Ready‑to‑use alerts—no extra code needed for automation.
HOW USER CAN BENIFIT FROM IT :
- Spot early reversal zones or continuation thrusts without scanning candle by candle.
- Pair the alerts with trading bots, TradingView strategy testers, or mobile push notifications.
- Adapt the strictness (Body vs. Wicks vs. Both) to suit different assets, timeframes, or volatility regimes.
- Use the colored range boxes as dynamic support/resistance references for entries, targets, and stop‑loss placement.
📌 Tip: Test on multiple instruments and timeframes to find the sweet spot that matches your risk profile. This script is for educational purposes—always combine with sound risk management and confirm signals with broader market context.
Disclaimer :
This Video is not financial advice, it's for educational purposes only highlighting the power of coding( pine script) in TradingView, I am not a SEBI-registered advisor. Trading and investing involve risk, and you should consult with a qualified financial advisor before making any trading decisions. I do not guarantee profits or take responsibility for any losses you may incur.

Candle Trend ConfirmationCandle Trend Confirmation Indicator
The "Candle Trend Confirmation" indicator This indicator leverages an Exponential Moving Average (EMA) to visually confirm market trends through dynamic coloring of the EMA line, a shading effect, and candle color changes. It aims to help traders quickly identify strong trends and consolidation phases, enhancing decision-making in various market conditions.
Key Features
Customizable EMA Period:
Traders can adjust the EMA period via an input parameter, with a default setting of 20 periods. This flexibility allows the indicator to adapt to different timeframes and trading strategies.
Pip Threshold for Trend Strength:
A user-defined pip threshold (default set to 0.02) determines the distance from the EMA required to classify a trend as "strong." This parameter can be fine-tuned to suit specific instruments, such as forex pairs, cryptocurrencies, or stocks, where pip values may differ.
Trend Detection Logic:
Strong Uptrend: The closing price must be above the EMA by at least the pip threshold (e.g., 2 pips) and show consistent upward movement over the last three bars (current close > previous close > close two bars ago).
Strong Downtrend: The closing price must be below the EMA by at least the pip threshold and exhibit consistent downward movement over the last three bars.
Consolidation: Any price action that doesn’t meet the strong trend criteria is classified as a consolidation phase.
Dynamic Coloring:
EMA Line: Displayed using the line.new function, the EMA changes color based on trend conditions: green for a strong uptrend, red for a strong downtrend, and purple for consolidation. The line is drawn only for the most recent bar to maintain chart clarity.
Candles: Candlestick colors mirror the trend state—green for strong uptrends, red for strong downtrends, and purple for consolidation—using the barcolor function, providing an immediate visual cue.
Shading Effect: Two dashed lines are drawn above and below the EMA (at half the pip threshold distance) to create a subtle shading zone. These lines adopt a semi-transparent version of the EMA’s color, enhancing the visual representation of the trend’s strength.
How It Works
The indicator calculates the EMA based on the closing price and compares the current price to this average. By incorporating a pip-based threshold and a three-bar confirmation, it filters out noise and highlights only significant trend movements. The use of line.new instead of plot ensures compatibility with certain TradingView environments and offers a lightweight way to render the EMA and shading lines on the chart.
Usage
Trend Identification: Green signals a strong bullish trend, ideal for potential long entries; red indicates a strong bearish trend, suitable for short opportunities; purple suggests a range-bound market, where caution or range-trading strategies may apply.
Customization: Adjust the EMA period and pip threshold in the indicator settings to match your trading style or the volatility of your chosen market. For example, forex traders might set the threshold to 0.0002 for 2 pips on EUR/USD, while crypto traders might use 2.0 for BTC/USD.
Visual Clarity: The combination of EMA coloring, shading, and candle highlights provides a comprehensive view of market dynamics at a glance.

Opposite Delta Candle Highlighter with EMAs & Delta Boxes**Description:**
This indicator is designed to enhance market analysis by highlighting **candles with opposite-colored delta**, plotting **Exponential Moving Averages (EMAs)**, and displaying **delta volume as small boxes below the chart**.
🔹 **Key Features:**
✅ **Opposite Delta Candle Highlighting** – Candles where delta volume contradicts the price direction are highlighted with a **yellow background** and a **blue triangle** above the bar.
✅ **Three Exponential Moving Averages (EMAs)** – Includes **EMA (9, 21, 50)** to help identify trends and dynamic support/resistance levels.
✅ **Delta Volume Display** – Instead of large volume columns, delta is plotted as **small square boxes below the chart**, ensuring clear visibility without overlapping price candles.
✅ **Optimized for Lower Timeframes** – The indicator **automatically selects an appropriate lower timeframe** for more precise delta calculations.
🔹 **How It Works:**
- **Green Candle + Red Delta** → Opposite delta signal (Bearish Sign).
- **Red Candle + Green Delta** → Opposite delta signal (Bullish Sign).
- **Delta bars below the chart** indicate the strength of buying/selling pressure.
- **EMAs help identify the market trend** and potential trade entry zones.
🔹 **Use Cases:**
✔ **Scalping & Day Trading** – Identify potential reversals and trend continuation setups.
✔ **Volume Analysis** – Understand market participation and possible absorption.
✔ **Trend Confirmation** – Use EMAs to confirm trend direction alongside delta volume.
📌 *Best used with lower timeframes (1m, 5m, 15m) for detailed volume analysis.*
🚀 **Enhance your trading with real-time delta insights and price action analysis!**
Global Liquidity Index (Candles)The Global Liquidity Index (Candles) provides a comprehensive overview of major central bank balance sheets worldwide, presenting values converted to USD for consistency and comparability, following relevant forex rates. This indicator, based on the code developed by user ingeforberg , incorporates essential US accounts including the Treasury General Account (TGA) and Reverse Repurchase Agreements (RRP), subtracted from the Federal Reserve's balance sheet to offer a nuanced perspective on US liquidity. Users can tailor their analysis by selectively enabling or disabling specific central banks and special accounts according to their preferences. The index exclusively includes central banks abstaining from currency pegging and with reliable data accessible since late 2007, ensuring a robust aggregated liquidity model.
The calculation of the Global Liquidity Index involves subtracting the Treasury General Account (TGA) and Reverse Repurchase Agreements (RRP) from the Federal Reserve System (FED) and adding the balance sheets of major central banks worldwide: the European Central Bank (ECB), the People's Bank of China (PBC), the Bank of Japan (BOJ), the Bank of England (BOE), the Bank of Canada (BOC), the Reserve Bank of Australia (RBA), the Reserve Bank of India (RBI), the Swiss National Bank (SNB), the Central Bank of the Russian Federation (CBR), the Central Bank of Brazil (BCB), the Bank of Korea (BOK), the Reserve Bank of New Zealand (RBNZ), Sweden's Central Bank (Riksbank), and the Central Bank of Malaysia (BNM).
This tool proves invaluable for individuals seeking a consolidated perspective on global liquidity to interpret macroeconomic trends. Analyzing these balance sheets enables users to discern policy trajectories and assess the global economic landscape, providing insights into asset pricing and assisting investors in making well-informed capital allocation decisions. Historically, assets perceived as riskier, such as small caps and cryptocurrencies, have tended to perform favorably during periods of escalating liquidity. Thus, investors may exercise caution regarding additional risk exposure unless a sustained upward trend in global liquidity is evident.
Main differences between the original and updated indicators:
The "Global Liquidity Index (Candles)" script, compared to the original "Global Liquidity Index" script, offers a more detailed and visually rich representation of liquidity data.
"Global Liquidity Index (Candles)" employs candlestick visualization to represent liquidity data. Each candlestick encapsulates open, high, low, and close prices over a given period. This format provides granular insights into liquidity fluctuations, facilitating a more nuanced analysis.
By using candlesticks, the script offers traders detailed information about liquidity dynamics. They can analyze the patterns formed by candlesticks to discern trends, reversals, and market sentiment shifts, aiding in making informed trading decisions.

Inside Bars/Candles [CodeCraftedTrading]This Pine Script indicator is designed to identify and visually represent inside bars or candles. Here's a breakdown of its features and functionality:
1. Inputs:
insideCandlesColor: Color of the inside bars or candles.
highColor: Color of the horizontal line representing the high of the inside bar.
lowColor: Color of the horizontal line representing the low of the inside bar.
showHighLowLabel: Option to display labels for the high and low prices.
2. Logic:
The script checks for the conditions of an inside bar:
high < high and low > low
If an inside bar is detected and is not already in the range:
* Stores the high and low prices of the previous bar.
* Records the parent bar index and sets the broken flag to false.
If the current bar's high exceeds the stored high or the low falls below the stored low, the broken flag is set to true.
If the current bar is within the stored high and low range, it is considered in-range.
The script then dynamically plots horizontal lines at the high and low prices of the parent bar until the inside bar is broken.
3. Visualization:
The inside bars are colored based on the insideCandlesColor.
Horizontal lines are drawn at the high and low prices of the parent bar within the inside bar.
Optional labels display the rounded values of the high and low prices.
4. Usage:
Apply the script to your chart.
Adjust the input parameters according to your preferences.
The indicator will highlight inside bars with colored bars and draw lines representing the high and low prices. Labels are optional.
5. Note:
Inside bars are bars where the entire price range is within the high and low of the previous bar.
The script uses historical bar information and visualizes the inside bars dynamically on the chart.

No Wick Bull/Bear Candlesticks with Arrow premiumNo Wick Bull/Bear Candlesticks with Arrow premium
This script is for a custom trading indicator called "No Wick Bull/Bear Candlesticks with Arrow premium" developed by ClearTradingMind. It is designed for use with trading platforms that support scripting, such as TradingView. This indicator combines several technical analysis tools to help traders identify potential buy and sell signals in a financial market.
Key Components of the Indicator:
Moving Average (MA): The script allows users to select from various types of moving averages (SMA, EMA, HMA, etc.), which smooth out price data to identify trends. Users can set the length and type of the moving average.
Upper and Lower Bands: These bands are set at a specified deviation percentage above and below the chosen moving average. They help in identifying overbought and oversold conditions.
No Wick Bull/Bear Candlestick Identification:
Bullish Condition: A bullish candlestick is identified when the closing price is higher than the opening price, the low equals the open, and the close is above the moving average.
Bearish Condition: A bearish candlestick is identified when the closing price is lower than the opening price, the high equals the open, and the close is below the moving average.
No Wick: These conditions also imply that the candlesticks have no wicks, suggesting strong buying or selling pressure.
Arrows for Trading Signals:
No lower wick bull bar
No upper wick bear bar
When a bullish condition is met, a green upward-pointing triangle is plotted below the candlestick, indicating a potential buy signal.
When a bearish condition is met, a red downward-pointing triangle is plotted above the candlestick, indicating a potential sell signal.
EMA 20: An additional Exponential Moving Average with a length of 20 periods is plotted for further trend analysis.
Background Color Changes: The script changes the background color to blue if the EMA 20 is above the upper band, and to red if it is below the lower band, providing visual cues about the market trend.
How It Works:
Traders can input their preferences for the moving average type and length, source of the MA (like closing prices), and the deviation percentage for the bands.
The script then calculates the moving average, upper and lower bands, and checks for bullish or bearish candlestick conditions without wicks.
When such conditions are met, it plots arrows to suggest buy or sell signals.
The EMA 20 and background color changes offer additional trend information.
Usage:
This indicator is particularly useful in markets with clear trends. The no wick bull/bear candlesticks indicate strong buying or selling pressure, and the arrows provide clear visual signals for traders to consider entering or exiting positions. As with all trading indicators, it's recommended to use this tool in conjunction with other forms of analysis to confirm trading signals.

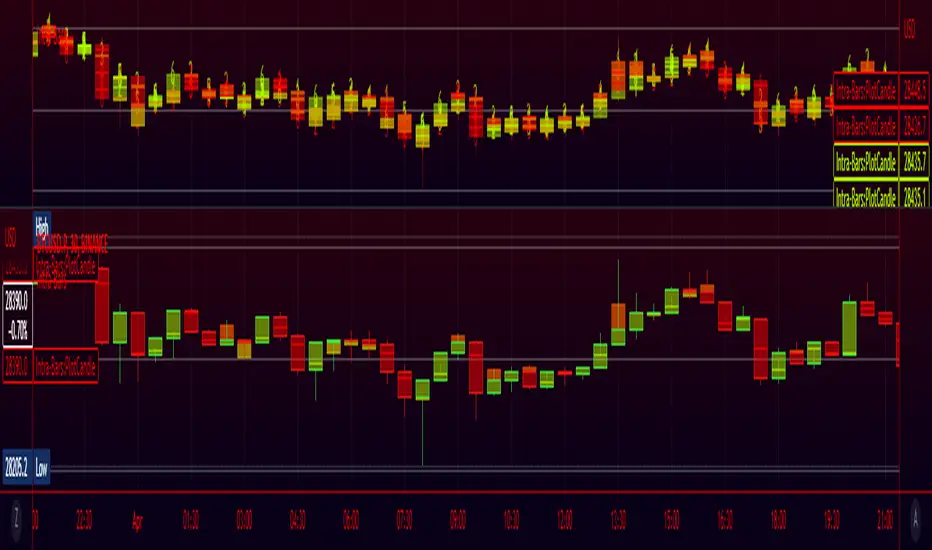
Intra-Candles*For use with <=24 hour Hollow Candles *
Indicator for more informative candle plotting. Select from 2-6 lower timeframe candles and view the price action of the lower bars within the normal chart's candles. Plotting short time frame candles with a semi-transparent body lets you see reversals that occurred during the larger candle's formation. Use the information provided to inform your own trading decisions.
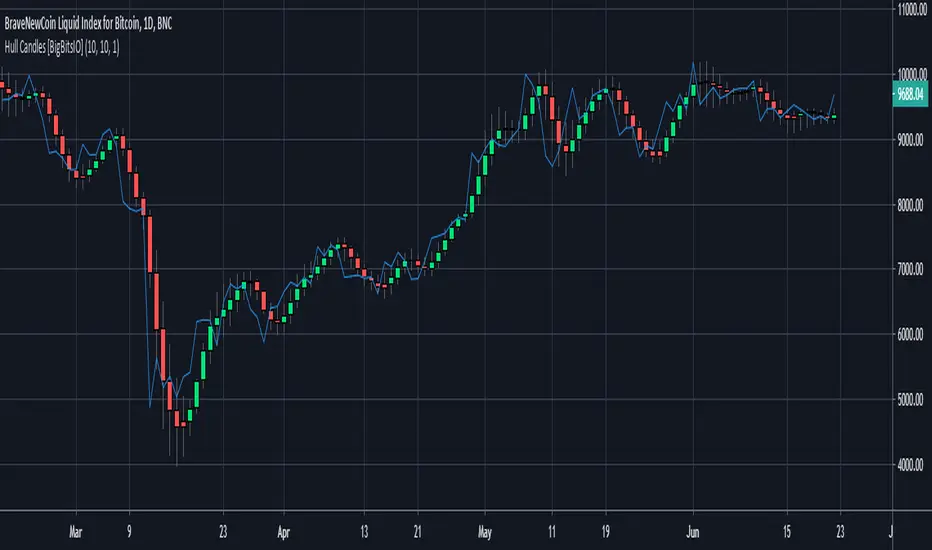
Hull Candles [BigBitsIO]This script is for custom candles based on an HMA calculation with a default period of 10 as well as an SMA of the close price, defaulted to 1 period to only show the current price. The purpose of the custom candles is to try and reduce noise from candles and help identify trends. These custom candles somewhat resemble Heikin-Ashi candles in their appearance.
Explained:
- Open, High, Low and Close (o, h, l, and c) are all calculated using an HMA calculation based on a user input length/period, defaulted at 10.
- Candle colors are determined by using the same HMA calculation on the ohcl4 and comparing it to the previous candle. Green candles have an ohlc4 greater than the previous candle, all other candles are red.
- The current price is plotted with the default blue line with an SMA calculation with 1 period to allow customization of smoothing if necessary to identify trends.
DISCLAIMER: For educational and entertainment purposes only. Nothing in this content should be interpreted as financial advice or a recommendation to buy or sell any sort of security or investment including all types of crypto. DYOR, TYOB.
Delta Volume Candles [LucF]█ OVERVIEW
This indicator plots on-chart volume delta information using candles that can replace your normal candles, tops and bottoms appended to normal candles, optional MAs of those tops and bottoms levels, a divergence channel and a chart background. The indicator calculates volume delta using intrabar analysis, meaning that it uses the lower timeframe bars constituting each chart bar.
█ CONCEPTS
Volume Delta
The volume delta concept divides a bar's volume in "up" and "down" volumes. The delta is calculated by subtracting down volume from up volume. Many calculation techniques exist to isolate up and down volume within a bar. The simplest use the polarity of interbar price changes to assign their volume to up or down slots, e.g., On Balance Volume or the Klinger Oscillator . Others such as Chaikin Money Flow use assumptions based on a bar's OHLC values. The most precise calculation method uses tick data and assigns the volume of each tick to the up or down slot depending on whether the transaction occurs at the bid or ask price. While this technique is ideal, it requires huge amounts of data on historical bars, which considerably limits the historical depth of charts and the number of symbols for which tick data is available. Furthermore, historical tick data is not yet available on TradingView.
This indicator uses intrabar analysis to achieve a compromise between the simplest and most precise methods of calculating volume delta. It is currently the most precise method usable on TradingView charts. TradingView's Volume Profile built-in indicators use it, as do the CVD - Cumulative Volume Delta Candles and CVD - Cumulative Volume Delta (Chart) indicators published from the TradingView account . My Delta Volume Channels and Volume Delta Columns Pro indicators also use intrabar analysis. Other volume delta indicators such as my Realtime 5D Profile use realtime chart updates to calculate volume delta without intrabar analysis, but that type of indicator only works in real time; they cannot calculate on historical bars.
This is the logic I use to determine the polarity of intrabars, which determines the up or down slot where its volume is added:
• If the intrabar's open and close values are different, their relative position is used.
• If the intrabar's open and close values are the same, the difference between the intrabar's close and the previous intrabar's close is used.
• As a last resort, when there is no movement during an intrabar, and it closes at the same price as the previous intrabar, the last known polarity is used.
Once all intrabars making up a chart bar have been analyzed and the up or down property of each intrabar's volume determined, the up volumes are added, and the down volumes subtracted. The resulting value is volume delta for that chart bar, which can be used as an estimate of the buying/selling pressure on an instrument. Not all markets have volume information. Without it, this indicator is useless.
Intrabar analysis
Intrabars are chart bars at a lower timeframe than the chart's. The timeframe used to access intrabars determines the number of intrabars accessible for each chart bar. On a 1H chart, each chart bar of an active market will, for example, usually contain 60 bars at the lower timeframe of 1min, provided there was market activity during each minute of the hour.
This indicator automatically calculates an appropriate lower timeframe using the chart's timeframe and the settings you use in the script's "Intrabars" section of the inputs. As it can access lower timeframes as small as seconds when available, the indicator can be used on charts at relatively small timeframes such as 1min, provided the market is active enough to produce bars at second timeframes.
The quantity of intrabars analyzed in each chart bar determines:
• The precision of calculations (more intrabars yield more precise results).
• The chart coverage of calculations (there is a 100K limit to the quantity of intrabars that can be analyzed on any chart,
so the more intrabars you analyze per chart bar, the less chart bars can be calculated by the indicator).
The information box displayed at the bottom right of the chart shows the lower timeframe used for intrabars, as well as the average number of intrabars detected for chart bars and statistics on chart coverage.
Balances
This indicator calculates five balances from volume delta values. The balances are oscillators with a zero centerline; positive values are bullish, and negative values are bearish. It is important to understand the balances as they can be used to:
• Color candle bodies.
• Calculate body and top and bottom divergences.
• Color an EMA channel.
• Color the chart's background.
• Configure markers and alerts.
The five balances are:
1 — Bar Balance : This is the only balance using instant values; it is simply the subtraction of the down volume from the up volume on the bar, so the instant volume delta for that bar.
2 — Average Balance : Calculates a distinct EMA for both the up and down volumes, and subtracts the down EMA from the up EMA.
The result is akin to MACD's histogram because it is the subtraction of two moving averages.
3 — Momentum Balance : Starts by calculating, separately for both up and down volumes, the difference between the same EMAs used in "Average Balance" and
an SMA of twice the period used for the "Average Balance" EMAs. The difference for the up side is subtracted from the difference for the down side,
and an RSI of that value is calculated and brought over the −50/+50 scale.
4 — Relative Balance : The reference values used in the calculation are the up and down EMAs used in the "Average Balance".
From those, we calculate two intermediate values using how much the instant up and down volumes on the bar exceed their respective EMA — but with a twist.
If the bar's up volume does not exceed the EMA of up volume, a zero value is used. The same goes for the down volume with the EMA of down volume.
Once we have our two intermediate values for the up and down volumes exceeding their respective MA, we subtract them. The final value is an ALMA of that subtraction.
The rationale behind using zero values when the bar's up/down volume does not exceed its EMA is to only take into account the more significant volume.
If both instant volume values exceed their MA, then the difference between the two is the signal's value.
The signal is called "relative" because the intermediate values are the difference between the instant up/down volumes and their respective MA.
This balance flatlines when the bar's up/down volumes do not exceed their EMAs, which makes it useful to spot areas where trader interest dwindles, such as consolidations.
The smaller the period of the final value's ALMA, the more easily it will flatline. These flat zones should be considered no-trade zones.
5 — Percent Balance : This balance is the ALMA of the ratio of the "Bar Balance" over the total volume for that bar.
From the balances and marker conditions, two more values are calculated:
1 — Marker Bias : This sums the up/down (+1/‒1) occurrences of the markers 1 to 4 over a period you define, so it ranges from −4 to +4, times the period.
Its calculation will depend on the modes used to calculate markers 3 and 4.
2 — Combined Balances : This is the sum of the bull/bear (+1/−1) states of each of the five balances, so it ranges from −5 to +5.
The periods for all of these balances can be configured in the "Periods" section at the bottom of the script's inputs. As you cannot see the balances on the chart, you can use my Volume Delta Columns Pro indicator in a pane; it can plot the same balances, so you will be able to analyze them.
Divergences
In the context of this indicator, a divergence is any bar where the bear/bull state of a balance (above/below its zero centerline) diverges from the polarity of a chart bar. No directional bias is assigned to divergences when they occur. Candle bodies and tops/bottoms can each be colored differently on divergences detected from distinct balances.
Divergence Channel
The divergence channel is the space between two levels (by default, the bar's open and close ) saved when divergences occur. When price (by default the close ) has breached a channel and a new divergence occurs, a new channel is created. Until that new channel is breached, bars where additional divergences occur will expand the channel's levels if the bar's price points are outside the channel.
Prices breaches of the divergence channel will change its state. Divergence channels can be in one of three different states:
• Bull (green): Price has breached the channel to the upside.
• Bear (red): Price has breached the channel to the downside.
• Neutral (gray): The channel has not yet been breached.
█ HOW TO USE THE INDICATOR
I do not make videos to explain how to use my indicators. I do, however, try hard to include in their description everything one needs to understand what they do. From there, it's up to you to explore and figure out if they can be useful in your trading practice. Communicating in videos what this description and the script's tooltips contain would make for very long videos that would likely exceed the attention span of most people who find this description too long. There is no quick way to understand an indicator such as this one because it uses many different concepts and has quite a bit of settings one can use to modify its visuals and behavior — thus how one uses it. I will happily answer questions on the inner workings of the indicator, but I do not answer questions like "How do I trade using this indicator?" A useful answer to that question would require an in-depth analysis of who you are, your trading methodology and objectives, which I do not have time for. I do not teach trading.
Start by loading the indicator on an active chart containing volume information. See here if you need help.
The default configuration displays:
• Normal candles where the bodies are only colored if the bar's volume has increased since the last bar.
If you want to use this indicator's candles, you may want to disable your chart's candles by clicking the eye icon to the right of the symbol's name in the top left of the chart.
• A top or bottom appended to the normal candles. It represents the difference between up and down volume for that bar
and is positioned at the top or bottom, depending on its polarity. If up volume is greater than down volume, a top is displayed. If down volume is greater, a bottom is plotted.
The size of tops and bottoms is determined by calculating a factor which is the proportion of volume delta over the bar's total volume.
That factor is then used to calculate the top or bottom size relative to a baseline of the average candle body size of the last 100 bars.
• An information box in the bottom right displaying intrabar and chart coverage information.
• A light red background when the intrabar volume differs from the chart's volume by more than 1%.
The script's inputs contain tooltips explaining most of the fields. I will not repeat them here. Following is a brief description of each section of the indicator's inputs which will give you an idea of what the indicator can do:
Normal Candles is where you configure the replacement candles plotted by the script. You can choose from different coloring schemes for their bodies and specify a unique color for bodies where a divergence calculated using the method you choose occurs.
Volume Tops & Botttoms is where you configure the display of tops and bottoms, and their EMAs. The EMAs are calculated from the high point of tops and the low point of bottoms. They can act as a channel to evaluate price, and you can choose to color the channel using a gradient reflecting the advances/declines in the balance of your choice.
Divergence Channel is where you set up the appearance and behavior of the divergence channel. These areas represent levels where price and volume delta information do not converge. They can be interpreted as regions with no clear direction from where one will look for breaches. You can configure the channel to take into account one or both types of divergences you have configured for candle bodies and tops/bottoms.
Background allows you to configure a gradient background color that reflects the advances/declines in the balance of your choice. You can use this to provide context to the volume delta values from bars. You can also control the background color displayed on volume discrepancies between the intrabar and the chart's timeframe.
Intrabars is where you choose the calculation mode determining the lower timeframe used to access intrabars. The indicator uses the chart's timeframe and the type of market you are on to calculate the lower timeframe. Your setting there should reflect which compromise you prefer between the precision of calculations and chart coverage. This is also where you control the display of the information box in the lower right corner of the chart.
Markers allows you to control the plotting of chart markers on different conditions. Their configuration determines when alerts generated from the indicator will fire. Note that in order to generate alerts from this script, they must be created from your chart. See this Help Center page to learn how. Only the last 500 markers will be visible on the chart, but this will not affect the generation of alerts.
Periods is where you configure the periods for the balances and the EMAs used in the indicator.
The raw values calculated by this script can be inspected using the Data Window.
█ INTERPRETATION
Rightly or wrongly, volume delta is considered by many a useful complement to the interpretation of price action. I use it extensively in an attempt to find convergence between my read of volume delta and price movement — not so much as a predictor of future price movement. No system or person can predict the future. Accordingly, I consider people who speak or act as if they know the future with certainty to be dangerous to themselves and others; they are charlatans, imprudent or blissfully ignorant.
I try to avoid elaborate volume delta interpretation schemes involving too many variables and prefer to keep things simple:
• Trends that have more chances of continuing should be accompanied by VD of the same polarity.
In trends, I am looking for "slow and steady". I work from the assumption that traders and systems often overreact, which translates into unproductive volatility.
Wild trends are more susceptible to overreactions.
• I prefer steady VD values over wildly increasing ones, as large VD increases often come with increased price volatility, which can backfire.
Large VD values caused by stopping volume will also often occur on trend reversals with abnormally high candles.
• Prices escaping divergence channels may be leading a trend in that direction, although there is no telling how long that trend will last; could be just a few bars or hundreds.
When price is in a channel, shifts in VD balances can sometimes give us an idea of the direction where price has the most chance of breaking.
• Dwindling VD will often indicate trend exhaustion and predate reversals by many bars, but the problem is that mere pauses in a trend will often produce the same behavior in VD.
I think it is too perilous to infer rigidly from VD decreases.
Divergence Channel
Here I have configured the divergence channels to be visible. First, I set the bodies to display divergences on the default Bar Balance. They are indicated by yellow bodies. Then I activated the divergence channels by choosing to draw levels on body divergences and checked the "Fill" checkbox to fill the channel with the same color as the levels. The divergence channel is best understood as a direction-less area from where a breach can be acted on if other variables converge with the breach's direction:
Tops and Bottoms EMAs
I find these EMAs rather interesting. They have no equivalent elsewhere, as they are calculated from the top and bottom values this indicator plots. The only similarity they have with volume-weighted MAs, including VWAP, is that they use price and volume. This indicator's Tops and Bottoms EMAs, however, use the price and volume delta. While the channel differs from other channels in how it is calculated, it can be used like others, as a baseline from which to evaluate price movement or, alternatively, as stop levels. Remember that you can change the period used for the EMAs in the "Periods" section of the inputs.
This chart shows the EMAs in action, filled with a gradient representing the advances/decline from the Momentum balance. Notice the anomaly in the chart's latest bars where the Momentum balance gradient has been indicating a bullish bias for some time, during which price was mostly below the EMAs. Price has just broken above the channel on positive VD. My interpretation of this situation would be that it is a risky opportunity for a long trade in the larger context where the market has been in a downtrend since the 5th. Intrepid traders choosing to enter here could do so with a "make or break" tight stop that will minimize their losses should the market continue its downtrend while hopefully preserving the potential upside of price continuing on the longer-term uptrend prevalent since the 28th:
█ NOTES
Volume
If you use indicators such as this one which depends on volume information, it is important to realize that the volume data they consume comes from data feeds, and that all data feeds are NOT created equally. Those who create the data feeds we use must make decisions concerning the nature of the transactions they tally and the way they are tallied in each feed, and these decisions affect the nature of our volume data. My Volume X-ray publication discusses some of the reasons why volume information from different timeframes, brokers/exchanges or sectors may vary considerably. I encourage you to read it. This indicator's display of a warning through a background color on volume discrepancies between the timeframe used to access intrabars and the chart's timeframe is an attempt to help you realize these variations in feeds. Don't take things for granted, and understand that the quality of a given feed's volume information affects the quality of the results this indicator calculates.
Markets as ecosystems
I believe it is perilous to think that behavioral patterns you discover in one market through the lens of this or any other indicator will necessarily port to other markets. While this may sometimes be the case, it will often not. Why is that? Because each market is its own ecosystem. As cities do, all markets share some common characteristics, but they also all have their idiosyncrasies. A proportion of a city's inhabitants is always composed of outsiders who come and go, but a core population of regulars and systems is usually the force that actually defines most of the city's observable characteristics. I believe markets work somewhat the same way; they may look the same, but if you live there for a while and pay attention, you will notice the idiosyncrasies. Some things that work in some markets will, accordingly, not work in others. Please keep that in mind when you draw conclusions.
On Up/Down or Buy/Sell Volume
Buying or selling volume are misnomers, as every unit of volume transacted is both bought and sold by two different traders. While this does not keep me from using the terms, there is no such thing as “buy only” or “sell only” volume. Trader lingo is riddled with peculiarities. Without access to order book information, traders work with the assumption that when price moves up during a bar, there was more buying pressure than selling pressure, just as when buy market orders take out limit ask orders in the order book at successively higher levels. The built-in volume indicator available on TradingView uses this logic to color the volume columns green or red. While this script’s calculations are more precise because it analyses intrabars to calculate its information, it uses pretty much the same imperfect logic. Until Pine scripts can have access to how much volume was transacted at the bid/ask prices, our volume delta calculations will remain a mere proxy.
Repainting
• The values calculated on the realtime bar will update as new information comes from the feed.
• Historical values may recalculate if the historical feed is updated or when calculations start from a new point in history.
• Markers and alerts will not repaint as they only occur on a bar's close. Keep this in mind when viewing markers on historical bars,
where one could understandably and incorrectly assume they appear at the bar's open.
To learn more about repainting, see the Pine Script™ User Manual's page on the subject .
Superfluity
In "The Bed of Procrustes", Nassim Nicholas Taleb writes: To bankrupt a fool, give him information . This indicator can display a lot of information. The inevitable adaptation period you will need to figure out how to use it should help you eliminate all the visuals you do not need. The more you eliminate, the easier it will be to focus on those that are the most useful to your trading practice. Don't be a fool.
█ THANKS
Thanks to alexgrover for his Dekidaka-Ashi indicator. His volume plots on candles were the inspiration for my top/bottom plots.
Kudos to PineCoders for their libraries. I use two of them in this script: Time and lower_tf .
The first versions of this script used functionality that I would not have known about were it not for these two guys:
— A guy called Kuan who commented on a Backtest Rookies presentation of their Volume Profile indicator.
— theheirophant , my partner in the exploration of the sometimes weird abysses of request.security() ’s behavior at lower timeframes.

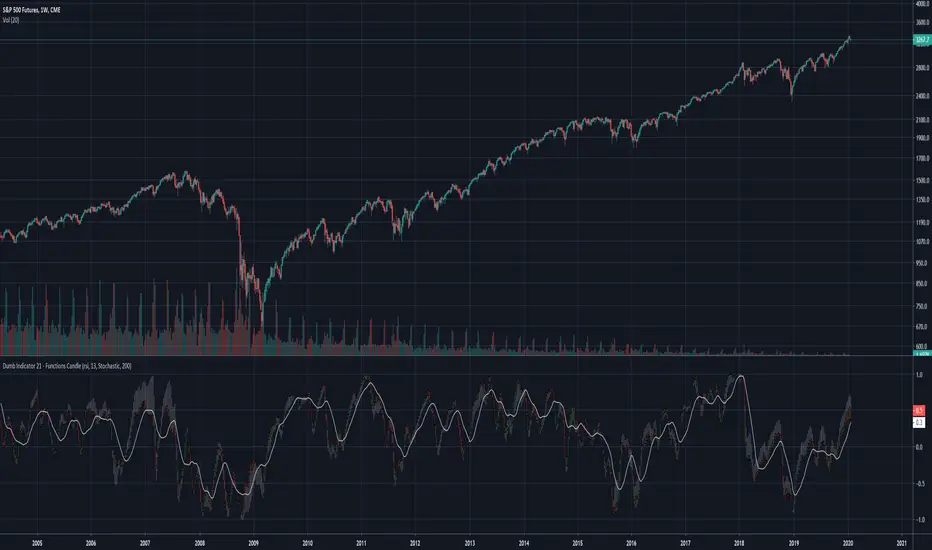
Dumb Indicator 21 - Function's Candlestick Bar's StyleThe idea is help traders to see the patterns and levels from a different point o view.
This script create candlestick using the opening, high, low and close price as source on your favorite function.
It's very simple to use:
Select a function in the drop box list, the number of bars length, check or uncheck the boxes to treat source as logarithm, smooth, and if you want to plot the SMA from the results.
To make a deeper analysis, you can select to plot the candles in Stochastic or in Percent Rank way.
The Stochastic and Percent Rank plot will show how far the price is close to highest or lowest value of the source from the last "Stochastic Length" number of bars.
Some functions with different names can plot the same results.
This indicator works on every kind of market, but you will need to find the best function and length to use.
Please, if you find anything good with this, share to everyone.
3 Band Volume matched Candles3 Band Volume matched Candles– is a clean, high-signal volume-based candle colouring system designed to highlight the extremes of market participation. Instead of using complex multi-band gradients, this simplified version focuses on what truly matters to scalpers and intraday traders:
🔵 Very Weak Volume (Exhaustion)
Shows when the market is running out of participation. These candles often appear near tops, stalled moves, fake breakouts, and areas where liquidity is drying up. Perfect for spotting potential reversals or rug-pull conditions.
⚪ Normal Volume (Baseline Flow)
Represents regular market activity. These neutral candles keep the chart clean and make the extremes stand out instantly.
🟥 Neon Hot-Red (High-Impact Volume)
Highlights moments of significant volume — intervention, aggression, absorption, stop hunts, or strong rejection wicks. These candles are critical for identifying real moves vs. fake ones, spotting wickbacks, and confirming momentum shifts.
Why This Tool Works
By focusing only on the very low and very high ends of market volume, the indicator cuts through noise and exposes the true behaviour behind each candle. Traders can instantly see:
When a move is losing strength
When a trend is topping or stalling
When big volume enters the market
When a wickback is driven by strong rejection
Whether a breakout is real or weak
When reversals are highly probable
This makes it ideal for scalpers, and anyone who trades fast-moving instruments
Customisation
Fully customisable weak/normal and normal/strong thresholds
User-defined colours for each band
Brightness control
Borders-only mode
Adjustable fill opacity
Optional corner legend for clarity

Oscillator CandlesticksI've always wondered why we don't use candlesticks for oscillators...then I stopped wondering and made an oscillator with candlesticks.
The following oscillators are available as a proof of concept:
* Consumer Channel Index (CCI)
* Rate of Change (ROC)
* Relative Strength Index (RSI)
* Trend Strength Index (TSI)
You can add a moving average to the ohlc4 value of the oscillator and choose the type of the moving average and whether it should be influenced by volume.

High Volume Candles - RVolInspired by Key bars from Option Stalker Pro.
This one is meant to be used on charts where the interval is >=1D.
Highlights candles where RVol is > 1.2.
Helps to not accidentally miss that a candle move happened on high volume (or that it did not happen on high volume...), like potential reversals or resistance/support breaks.
Make sure to move this indicator above the ticker in the Object Tree, so that it is drawn on top of the ticker's candles.
More infos: www.reddit.com

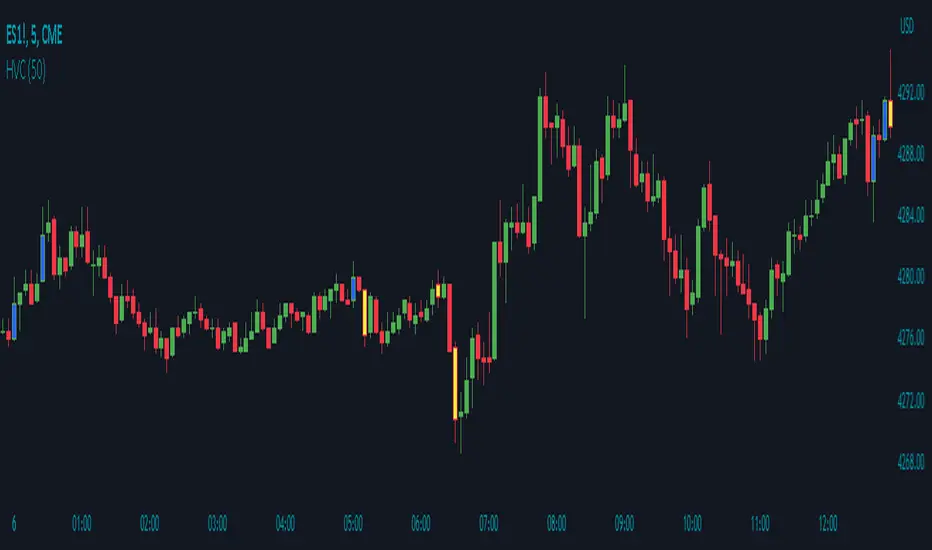
High Volume Candles by Time PeriodDescription:
The High Volume Candles indicator (HVC) is a technical analysis tool designed to identify candles with high trading volume. It allows traders to quickly spot periods of significant market activity based on volume.
How it Works:
The HVC indicator analyzes the volume of each candle in relation to the highest volume observed over a specified lookback period. The indicator compares the current volume with the highest volume within the defined lookback period and identifies candles that have volume equal to or greater than this threshold. It then distinguishes between bullish and bearish candles and assigns custom colors to highlight these high volume occurrences.
Usage:
To effectively utilize the High Volume Candles indicator, follow these steps:
1. Apply the HVC indicator to your chart by adding it from the available indicators.
2. Customize the lookback period according to your trading preferences. This parameter determines the number of previous candles to consider when calculating the highest volume.
3. Observe the candles on the chart:
- Bullish candles (blue by default) indicate periods of high volume when the closing price is higher than the opening price.
- Bearish candles (yellow by default) indicate periods of high volume when the closing price is lower than the opening price.
4. Pay attention to the color-coded volume indications within the candles, which highlight periods of high trading activity.
5. Analyze the volume patterns in conjunction with price action to identify potential trading opportunities. High volume candles often indicate increased market participation and can suggest significant price moves or reversals.
6. Combine the analysis of high volume candles with other technical analysis tools, such as trend lines, support and resistance levels, or indicators, to confirm potential trade setups.
7. Implement appropriate risk management strategies, including setting stop-loss orders and position sizing, to manage your trades effectively and protect your capital.
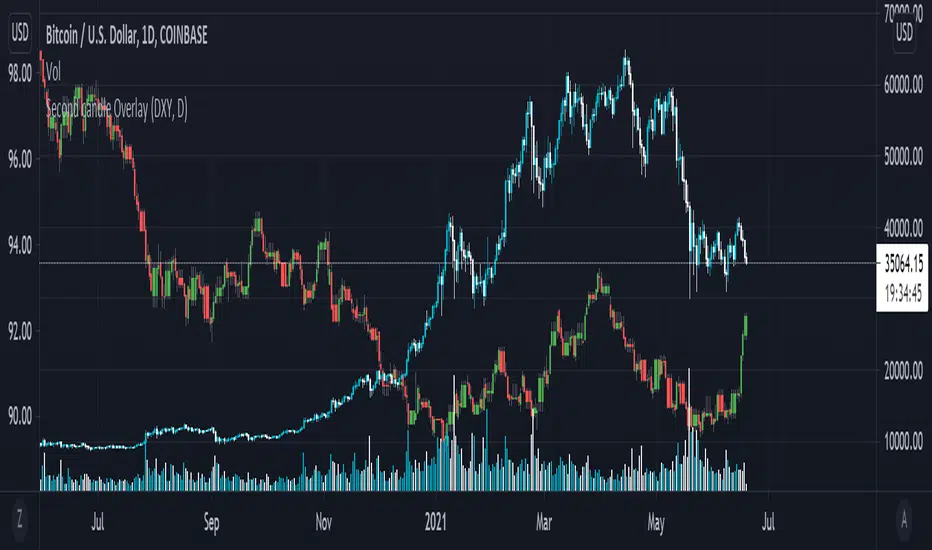
Secondary Candle OverlayThis simple script is meant to allow the user to select another symbol to add onto their chart and plot the candlesticks for that symbol at the selected resolution requested.
Please see the tooltip provided by the 'Secondary Symbol' input for more details with regards to properly using this script on symbols that have vastly different valuations, it will help with getting the symbol requested to scale properly with the primary symbol on the chart.
The user may also input which colors are used for bullish/bearish candles as well as the symbol itself and its resolution.
IMPORTANT NOTE: THIS SCRIPT DOES NOT ACCOUNT FOR SYMBOLS THAT ARE NOT CONTINUOUS (The defval for the symbol is TVC:DXY which closes on weekends whereas a cryptocurrency like Bitcoin does not stop trading ever; candles on these kinds of markets will be repeated when overlaid onto markets that do not have this property.)
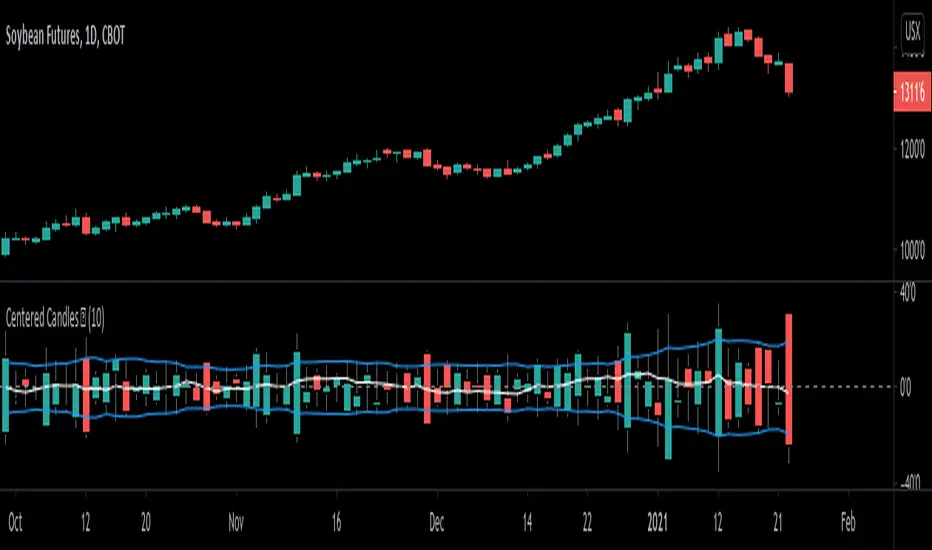
Centered Candles [racer8]Brief 💜
This indicator allows users to more easily compare candlesticks by centering them along a zero line.
Also, I've added some moving average lines for the highs, lows, and closes for these centered candles.
Enjoy 😉
LiquidityPulse Higher Timeframe Consecutive Candle Run LevelsLiquidityPulse Higher Timeframe Consecutive Candle Run Levels
Research suggests that financial markets can alternate between trend-persistence and mean-reversion regimes, particularly at short (intraday) or very long timeframes. Extended directional moves, whether prolonged intraday rallies or sell-offs, also carry a statistically higher chance of retracing or reversing (Safari & Schmidhuber, 2025). In addition, studies examining support and resistance behaviour show that swing highs or lows formed after strong directional moves may act as structurally and psychologically important price levels, where subsequent price interactions have an increased likelihood of stalling or bouncing rather than passing through directly (Chung & Bellotti, 2021). By highlighting higher-timeframe candle runs and marking their extremal levels, this indicator aims to display areas where directional momentum previously stopped, providing contextual "watch levels" that traders may incorporate into their broader analysis.
How this information is used in the indicator:
When a sequence of consecutive higher-timeframe candles prints in the same direction, the indicator highlights the lower-timeframe chart with a green or red background, depending on whether the higher-timeframe run was bullish or bearish. The highest high (for a bull run) or lowest low (for a bear run) of that sequence forms a recent extremum, and this value is plotted as a swing-high or swing-low level. These levels appear only after the required number of consecutive higher-timeframe candles (set by the user) have closed, and they continue updating as long as the higher-timeframe streak remains intact. A level "freezes" and stops updating only when an opposite-colour higher-timeframe candle closes (e.g., a red candle ending a bull run, or a green candle ending a bear run). Once frozen, the level remains fixed to preserve that structural information for future analysis or retests. The number of past bull/bear levels displayed on the chart is also adjustable in the settings.
Why capture a level after a long directional run:
When price moves in one direction for several consecutive candles (e.g. 4, 5, or more), it reflects strong directional bias, often associated with momentum, liquidity imbalance, or liquidity grabs. Once that sequence breaks, the final level reached marks a point of exhaustion or structural resistance/support, where that bias failed to continue. These inflection points are often used by traders and trading algorithms to assess potential reversals, retests, or breakout setups. By freezing these levels once the run ends, the indicator creates a map of historically significant price zones, allowing traders to observe how price behaves around them over time.
Additional information displayed by the indicator:
Each detected run includes a label showing the run length (the number of consecutive higher-timeframe candles in the streak) along with the source timeframe used for detection. The indicator also displays an overstretch marker: this numerical value appears when the total size of the candle bodies within the run exceeds a user-defined multiple of the average higher-timeframe body size (default: 1.5x). This helps highlight runs that were unusually strong or extended relative to typical volatility. You can also enable alerts that trigger when this overstretch ratio exceeds a higher threshold.
Key Settings
Timeframe: Choose which HTF to analyse (e.g., 15m, 1h, 4h)
Minimum Candle Run Length: Define how many consecutive candles are needed to trigger a level (e.g., 4)
Overstretch Settings: Customize detection threshold and alert trigger (in multiples of average body size)
Background Tints: Enable/disable visual highlights for bull and bear runs
Display Capacity: Choose how many past bull/bear levels to show
How Traders Can Use This Indicator
Traders can:
-Watch levels for retests, reversals, breakouts, or consolidation
-Identify areas where price showed strong directional conviction
-Spot extended or aggressive moves based on overstretch detection
-Monitor how price reacts when retesting prior run levels
-Build confluence with your existing levels, zones, or indicators
Disclaimer
This tool does not reflect true order flow, liquidity, or institutional positioning. It is a visual aid that highlights specific candle behaviour patterns and does not produce predictive signals. All analysis is subject to interpretation, and past price behaviour does not imply future outcomes.
References:
Trends and Reversion in Financial Markets on Time Scales from Minutes to Decades (Sara A. Safari & Christof Schmidhuber, 2025)
Evidence and Behaviour of Support and Resistance Levels in Financial Time Series (Chung & Bellotti, 2021)

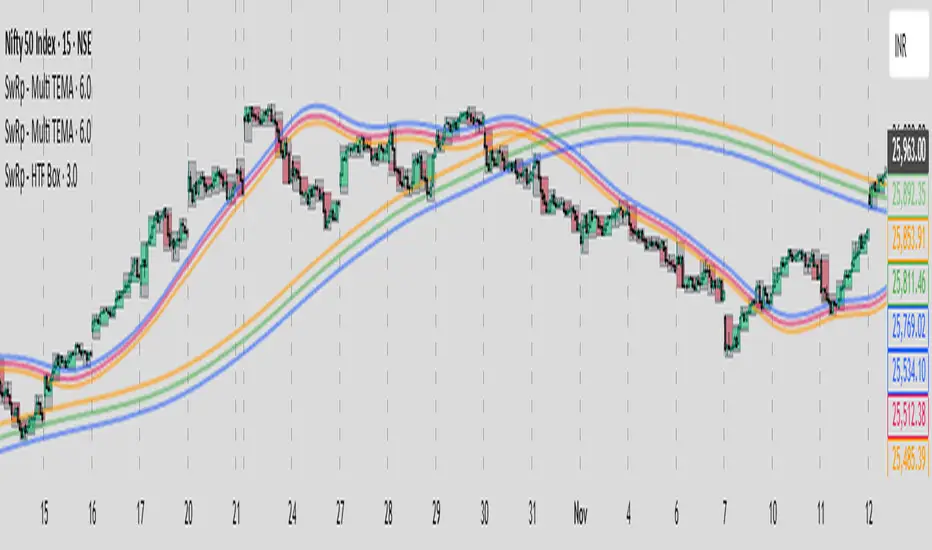
SwRp – HTF Candle Box OverlaySwRp – HTF Candle Box Overlay gives you a clear visual map of higher-timeframe candles directly on your lower-timeframe chart. Instead of switching timeframes, you can see the structure of each HTF candle plotted as colored boxes that update in real time as the candle forms.
Each HTF candle is drawn using two elements:
• A wick box showing the full high-to-low range
• A body box showing the open-to-close move with automatic bull/bear coloring
Both boxes follow the exact HTF open, high, low and close values, and they stay correctly anchored to price using bar-time positioning. You can customize opacity, body/wick visibility, border color, and the number of HTF candles to keep on the chart. The indicator automatically removes older candles when they exceed your set limit, so the chart stays clean.
This tool is ideal for traders who want to see HTF structure, zones, and candle behavior while analyzing entries and exits on smaller timeframes.
Key Features
• Overlay higher-timeframe candles on lower-timeframe charts
• Real-time updating of HTF candle body and wick
• Bull/bear body coloring with full opacity controls
• Independent toggles for body and wick fills
• Automatically remove older HTF candles to keep the chart clean
• Accurate price anchoring using bar-time for all boxes
• No extra lines, labels, or clutter — a clean visual multi-timeframe view
This indicator offers a simple, clear way to track the behavior of higher-timeframe candles without leaving your current chart, helping you combine HTF context with LTF execution more effectively.
HTF Candle Profile [ChartPrime]⯁ OVERVIEW
The HTF Candle Profile visualizes higher-timeframe candle structure and its internal volume distribution directly on lower-timeframe charts. It automatically detects changes in higher-timeframe periods (daily, weekly, or monthly) and constructs a complete volume profile for each, allowing traders to see how volume is distributed across the range of that higher-timeframe candle. This helps identify whether momentum is supported by real volume strength or trapped price movement.
⯁ LOGIC
When a new higher-timeframe candle begins, the indicator starts collecting data for its open, high, low, close, and volume range.
Once sufficient bars have passed (defined by the Min Period Profile input), it calculates a full profile using adaptive bin sizing derived from the range (High–Low) and ATR for scaling precision.
The resulting bins represent the volume concentration at each price level of that higher-timeframe candle.
A Point of Control (PoC) is highlighted — the level where the most volume occurred.
The indicator then draws the higher-timeframe candle body and wicks at the chart’s right side, giving visual context of bullish or bearish sentiment.
⯁ FEATURES
Automatic HTF Detection: Identifies new Daily, Weekly, or Monthly periods and updates profiles in real time.
Dynamic Bin Calculation: Automatically adjusts bin size based on ATR and candle height for accurate volume granularity.
Volume Profile Rendering: Displays colored volume bars extending from the candle, showing where trading activity was concentrated.
Higher-Timeframe Candle Representation: Plots the full HTF candle (open, close, high, low) on the right side of the chart for visual clarity.
PoC Level & Labels: Marks the point of maximum volume within the candle profile with a line and volume label.
Configurable Levels: Toggle display of Open, Close, High, Low, and PoC for each higher-timeframe segment.
Color-coded Sentiment: Candle and profile colors reflect bullish or bearish momentum.
⯁ CONCLUSION
The HTF Candle Profile bridges lower- and higher-timeframe analysis by embedding high-resolution volume data within each major candle. It enables traders to see where liquidity and trading activity cluster inside higher-timeframe structures — revealing whether trends are volume-backed or hollow. Perfect for combining structural insight with volume confluence when analyzing market sentiment transitions across timeframes.

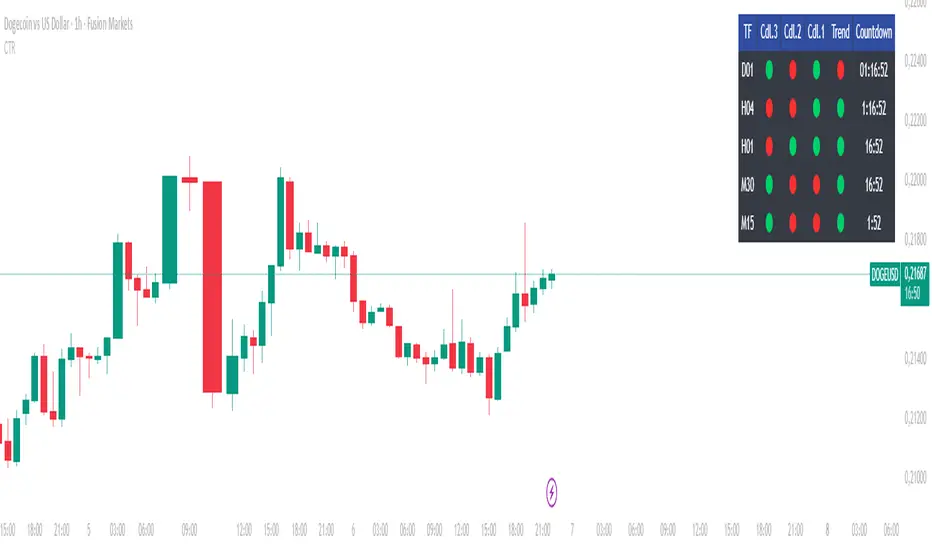
Countdown & Candle Recap DashboardThis script provides a compact dashboard showing a countdown timer and a recap of the previous candles. Ideal for traders who want to monitor short-term price action and candle behavior across different timeframes.
Features: • Countdown display for current candle • Summary of previous candles (PrevCndl1, PrevCndl2) • TimeFrame Recap section for quick analysis
Designed for scalpers, intraday traders, and anyone who values precision timing and candle structure.
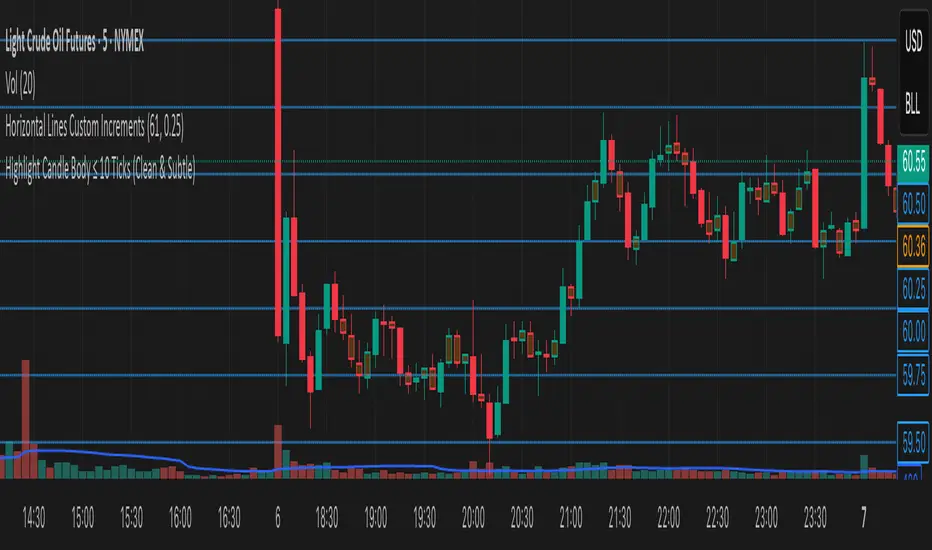
Highlight Candle Body ≤ 10 Ticks (Clean & Subtle)Purpose:
This indicator highlights candlesticks where the body size (difference between open and close) is 10 ticks or less, specifically for instruments like Crude Oil futures (CL) where 1 tick = 0.01.
How it works:
It calculates the body size: abs(close - open)
If the body is ≤ 0.10 (10 ticks), the candle is softly colored in muted orange.
Wicks are ignored — only the body is considered.
No additional shapes or markers — clean and minimal.
Use case:
Helps identify periods of indecision or low momentum — such as potential pause candles, traps, or setups just before volatility returns.