Candle Color OverlayDescription:
The Candle Color Overlay (CCO) indicator is a powerful tool for visualizing price movements on a chart. It overlays the chart with customizable colors, highlighting bullish and bearish candles based on their open and close values. This indicator helps traders quickly identify the direction of price movements and assess market sentiment.
How it Works:
The Candle Color Overlay indicator performs the following steps:
1. Calculation of the OHLC (Open, High, Low, Close) values for each candle based on the selected timeframe.
2. Classification of each candle as bullish or bearish:
- A bullish candle is when the closing price is greater than or equal to the opening price.
- A bearish candle is when the closing price is lower than the opening price.
3. Overlaying colors on the chart:
- The indicator applies a bullish color to the background when candles are classified as bullish and a bearish color to the background when candles classified as bearish. This overlay provides a visual representation of price movements.
4. Optional display of price movement labels:
- If enabled, the indicator shows a text label at the bottom of the current candle, indicating the percentage increase or decrease in price during a bullish or bearish background period.
Usage:
To effectively use the Candle Color Overlay indicator, follow these steps:
1. Add the indicator to your chart from the list of available indicators.
2. Configure the indicator's inputs:
- Choose the desired color for bullish candles using the "Bullish Color" input.
- Select the preferred color for bearish candles using the "Bearish Color" input.
- Specify the timeframe for analysis using the "Time Frame" input (default is 1 hour).
- Optionally enable the "Show Background Price Movement" input to display the percentage increase or decrease in price during each background period.
3. Analyze the colored overlay:
- Bullish colors represent candles where the closing price is greater than or equal to the opening price, indicating bullish sentiment.
- Bearish colors represent candles where the closing price is lower than the opening price, indicating bearish sentiment.
4. If enabled, observe the price movement labels
5. Combine the insights from the colored overlay and the price movement labels with other technical analysis tools, such as trend lines, support and resistance levels, or candlestick patterns, to make well-informed trading decisions.
Cari dalam skrip untuk "candle"

Candle Colored by Volume Z-score [Morty]This indicator colors the candles according to the z-score of the trading volume. You can easily see the imbalance on the chart. You can use it at any timeframe.
In statistics, the standard score (Z-score) is the number of standard deviations by which the value of a raw score (i.e., an observed value or data point) is above or below the mean value of what is being observed or measured. Raw scores above the mean have positive standard scores, while those below the mean have negative standard scores.
This script uses trading volume as source of z-score by default.
Due to the lack of volume data for some index tickers, you can also choose candle body size as source of z-score.
features:
- custom source of z-score
- volume
- candle body size
- any of above two
- all of above two
- custom threshold of z-score
- custom color chemes
- custom chart type
- alerts
default color schemes:
- green -> excheme bullish imbalance
- blue -> large bullish imbalance
- red -> excheme bearish imbalance
- purple -> large bearish imbalance
- yellow -> low volume bars, indicates "balance", after which volatility usually increases and tends to continue the previous trend
Examples:
* Personally, I use dark theme and changed the candle colors to black/white for down/up.
Volume as Z-score source
Any as Z-score source, more imbalances are showed

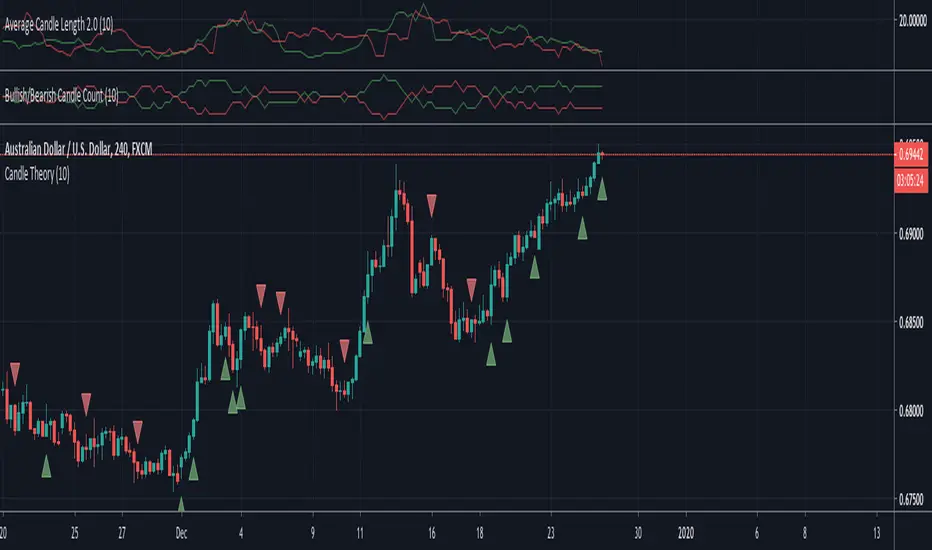
Candle TheoryDescription: The theory behind this script is that if within the last 10 candles, if the majority of them are green and the average length (wick to wick) of those majority green candles is greater than the average length of the minority red candles then it will signal that this is a bullish move within the market and signal you to buy. The opposite is true for bearish moves.
Inputs:
Length - this allows you to decide how many candles to look back, default/recommended is 10
Show First Signal In Series Only - using this indicator without this checked will show many more signals in a row. This allows you to just get a signal for the first candle that is the predicted bullish or bearish move
Candlestick Pattern Indicator – Doji, Harami, More [algo_aakash]This Candlestick Pattern Indicator is designed to help traders identify key price action patterns like Bullish Engulfing, Bearish Engulfing, Doji, Hammer, Morning Star, Evening Star, and many more directly on your TradingView chart. With customizable options to display both bullish and bearish patterns , this indicator provides real-time visual markers and labels, helping you make informed trading decisions.
Key features of the indicator include:
Detects popular candlestick patterns such as Bullish Engulfing, Bearish Engulfing, Hammer, Morning Star, Tweezer Tops, and more.
Customizable settings for displaying pattern shapes, labels, and opacity, tailored to your trading preferences.
Option to plot signals only after a candle closes, ensuring accuracy.
Alerts for immediate notification of detected patterns.
Visual markers on the chart, including arrows and labels, for quick recognition of potential trade setups.
This indicator is ideal for traders who rely on candlestick patterns for technical analysis and want an automated tool to highlight these setups for easier decision-making.
Whether you're a beginner or an experienced trader, this tool will help you spot important patterns in real-time without cluttering your chart.

Candle Range-BarsThe Candle Range Bars indicator visually represents the range of each candlestick in either pips or ticks, depending on your preference. It plots vertical bars to show the size of each candle, making it easy to identify periods of high or low volatility. The indicator also displays the exact range value (in pips or ticks) above each bar, with customizable text size and color for better readability.
Key Features
Pips or Ticks Mode:
Choose to display the candle range in pips (for forex traders) or ticks (for other instruments).
Customizable Text:
Adjust the text color and text size (Tiny, Small, Normal, Large) to suit your chart style.
Clear Visuals:
Bars are colored green for bullish candles and red for bearish candles, making it easy to distinguish between up and down moves.
Flexible Use:
Ideal for analyzing volatility, identifying consolidation zones, and comparing candle ranges across different timeframes.
How to Use:
Add the indicator to your chart.
Customize the settings:
Choose between pips or ticks.
Adjust the text color and text size for the range values.
Observe the bars and their corresponding range values to analyze market volatility.
Why Use This Indicator?:
Simplify Range Analysis: Quickly see the size of each candlestick without manual calculations.
Customizable: Tailor the appearance to match your trading style.
Versatile: Works on any instrument and timeframe.
Settings:
Show Pips (Otherwise Ticks): Toggle between pips and ticks mode.
Text Color: Choose the color of the range value text.
Text Size: Select the size of the range value text (Tiny, Small, Normal, Large).
Ideal For:
Forex, stocks, commodities, and crypto traders.
Traders who focus on volatility and range analysis.
Anyone looking for a clear and customizable way to visualize candle ranges.
This description highlights the key features, benefits, and usability of your indicator, making it appealing to other TradingView members. Let me know if you'd like to tweak it further! 😊

Candle 1 2 3 on XAUUSD (by Veronica)Description
Discover the Candle 1 2 3 Strategy, a simple yet effective trading method tailored exclusively for XAUUSD on the 15-minute timeframe. Designed by Veronica, this strategy focuses on identifying key reversal and continuation patterns during the London and New York sessions, making it ideal for traders who prioritise high-probability entries during these active market hours.
Key Features:
1. Session-Specific Trading:
The strategy operates strictly during London (03:00–06:00 UTC) and New York (08:30–12:30 UTC) sessions, where XAUUSD tends to show higher volatility and clearer price movements.
Pattern Criteria:
- Works best if the first candle is NOT a pin bar or a doji.
- Third candle should either:
a. Be a marubozu (large body with minimal wicks).
a. Have a significant body with wicks, ensuring the close of the third candle is above Candle 2 (for Buy) or below Candle 2 (for Sell).
Callout Labels and Alerts:
Automatic Buy and Sell labels are displayed on the chart during qualifying sessions, ensuring clarity for decision-making.
Integrated alerts notify you of trading opportunities in real-time.
Risk Management:
Built-in Risk Calculator to estimate lot sizes based on your account size, risk percentage, and stop-loss levels.
Customizable Table:
Displays your calculated lot size for various stop-loss pip values, making risk management seamless and efficient.
How to Use:
1. Apply the indicator to XAUUSD (M15).
2. Focus on setups appearing within the London and New York sessions only.
3. Ensure the first candle is neither a pin bar nor a doji.
4. Validate the third candle's body placement:
For a Buy, the third candle’s close must be above the second candle.
For a Sell, the third candle’s close must be below the second candle.
5. Use the generated alerts to streamline your entry process.
Notes:
This strategy is meant to complement your existing knowledge of market structure and price action.
Always backtest thoroughly and adjust parameters to fit your personal trading style and risk tolerance.
Credit:
This strategy is the intellectual property of Veronica, developed specifically for XAUUSD (M15) traders seeking precision entries during high-volume sessions.

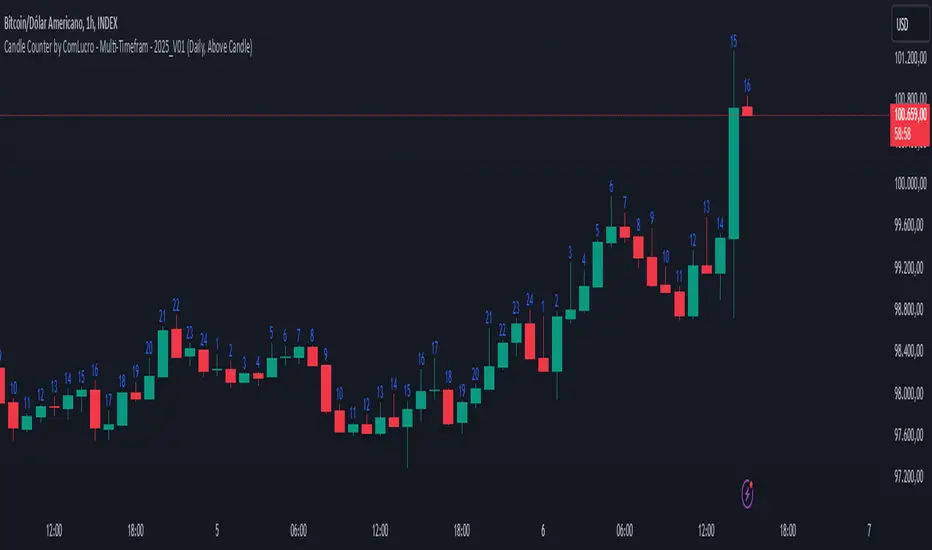
Candle Counter by ComLucro - Multi-Timefram - 2025_V01Candle Counter by ComLucro - Multi-Timeframe - 2025_V01
The Candle Counter by ComLucro - Multi-Timeframe is a highly customizable tool designed to help traders monitor the number of candles across various timeframes directly on their charts. Whether you're analyzing trends or tracking specific market behaviors, this indicator provides a seamless and efficient way to enhance your technical analysis.
Key Features:
Flexible Timeframe Selection: Track candle counts on yearly, monthly, weekly, daily, or hourly intervals to suit your trading style.
Dynamic Label Positioning: Choose to display labels above or below candles, offering greater control over your chart layout.
Customizable Colors: Adjust label text colors to match your chart's aesthetics and improve visibility.
Clean and Organized Visualization: Automatically generates labels for each candle without overcrowding your chart.
How It Works:
Select a Timeframe: Choose from yearly, monthly, weekly, daily, or hourly intervals based on your analysis needs.
Automatic Counting: The indicator calculates and displays the number of candles for the selected period directly on your chart.
Label Customization: Adjust the position (above or below the candles) and color of the labels to align with your preferences.
Why Use This Indicator?
This script is perfect for traders who need a clear and visual representation of candle counts in specific timeframes. Whether you're monitoring trends, evaluating price action, or developing strategies, the Candle Counter by ComLucro adapts to your needs and helps you make informed decisions.
Disclaimer:
This script is intended for educational and informational purposes only. It does not constitute financial advice. Always practice responsible trading and ensure this tool aligns with your strategies and risk management practices.
About ComLucro:
ComLucro is dedicated to providing traders with practical tools and educational resources to improve decision-making in the financial markets. Discover other scripts and strategies developed to enhance your trading experience.
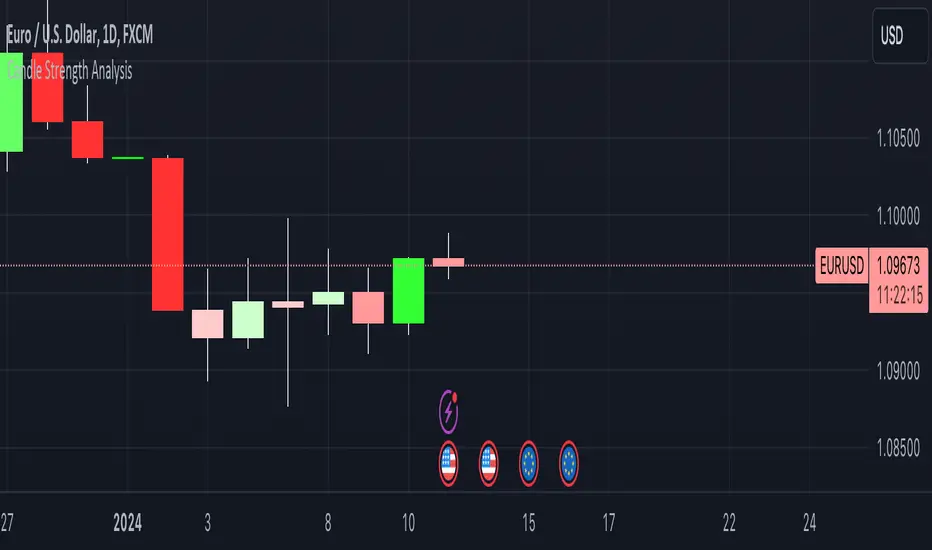
Candle Strength AnalysisView candles differently with this new indicator designed to simply visualise and analyse price movements on your chart!
The more vibrant the colour, the stronger the conviction of its respective candle.
This simple script calculates the closing price as a percentage within the candles high/low range. A colour/strength rating is then assigned to the candle based on where this close price sits within the range.
Strong coloured candles occur when the close is very close to a high or low.
User defined percentage and colour inputs allow for quick personalisation and flexibility.
An additional wick imbalance feature identifies when a candle has a larger wick than its body, which may be used to identify a ranging market or shift in trader sentiment.
For any questions, concerns, or requests, please reach out to me in the comments below.
- The Pine Guru
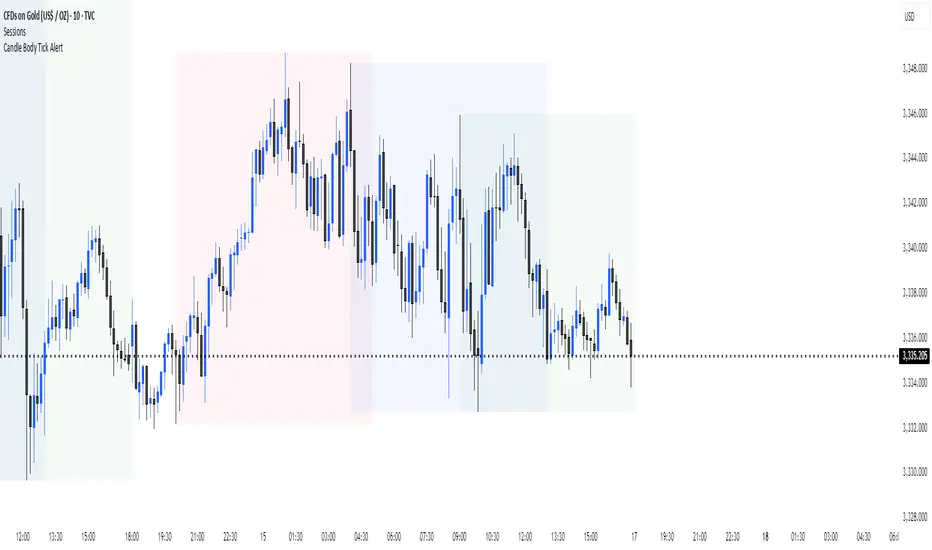
Candle Body Size AlertThis indicator monitors the body size of each candle (close minus open, ignoring wicks) and compares it to a user-defined threshold measured in ticks. If the candle body exceeds the threshold, the indicator triggers an alert condition at the close of the candle.
Features:
1. Adjustable threshold in ticks (default: 4000)
2. Adjustable timeframe (or use chart timeframe)
3. Alerts only at candle close (no intrabar signals)
Use Case:
Designed for traders who want to be notified when unusually large candles form, helping to identify strong momentum moves or volatility spikes.
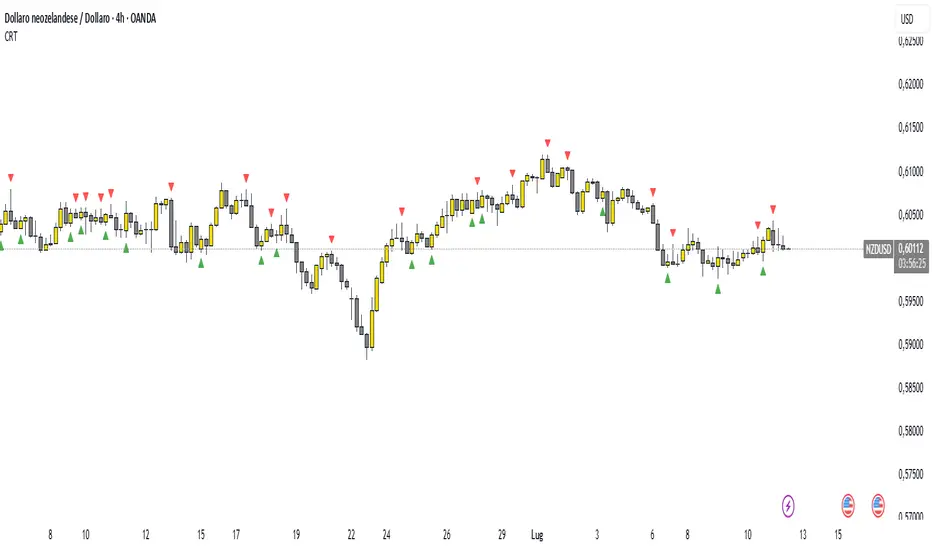
Candle Range Theory (CRT) indicator📌 Indicator Name: Candle Range Theory (CRT) indicator
This indicator detects potential bullish and bearish reversal setups based on specific candlestick price action behavior. It is designed to highlight moments when the market may be rejecting extremes and preparing to reverse direction — but only after confirmation with the closing price.
🔍 How It Works:
Bullish Setup (Long Signal):
The previous candle is bearish (closes lower than it opens).
The current candle makes a lower low than the previous one.
The current candle closes above the previous candle’s close.
Bearish Setup (Short Signal):
The previous candle is bullish (closes higher than it opens).
The current candle makes a higher high than the previous one.
The current candle closes below the previous candle’s close.
Signals are only triggered after the bar is fully closed, to avoid premature entries.
🔔 The script includes alert conditions for both long and short setups so you can receive notifications instantly.
🎥 Inspiration:
The idea for this indicator came from the excellent educational content presented in this video:
"How to Read Candlesticks Like a Pro"
We highly recommend watching it to better understand the price action principles behind this signal.
Candle Height & Trend Probability DashboardDescription and Guide
Description:
This Pine Script for TradingView displays a dashboard that calculates the probability of price increases or decreases based on past price movements. It analyzes the last 30 candles (by default) and shows the probabilities for different timeframes (from 1 minute to 1 week). Additionally, it checks volatility using the ATR indicator.
Script Features:
Calculates probabilities of an upward (Up %) or downward (Down %) price move based on past candles.
Displays a dashboard showing probabilities for multiple timeframes.
Color-coded probability display:
Green if the upward probability exceeds a set threshold.
Red if the downward probability exceeds the threshold.
Yellow if neither threshold is exceeded.
Considers volatility using the ATR indicator.
Triggers alerts when probabilities exceed specific values.
How to Use:
Insert the script into TradingView: Copy and paste the script into the Pine Script editor.
Adjust parameters:
lookback: Number of past candles used for calculation (default: 30).
alertThresholdUp & alertThresholdDown: Thresholds for probabilities (default: 51%).
volatilityLength & volatilityThreshold: ATR volatility settings.
dashboardPosition: Choose where the dashboard appears on the chart.
Enable visualization: The dashboard will be displayed over the chart.
Set alerts: The script triggers notifications when probabilities exceed set thresholds.

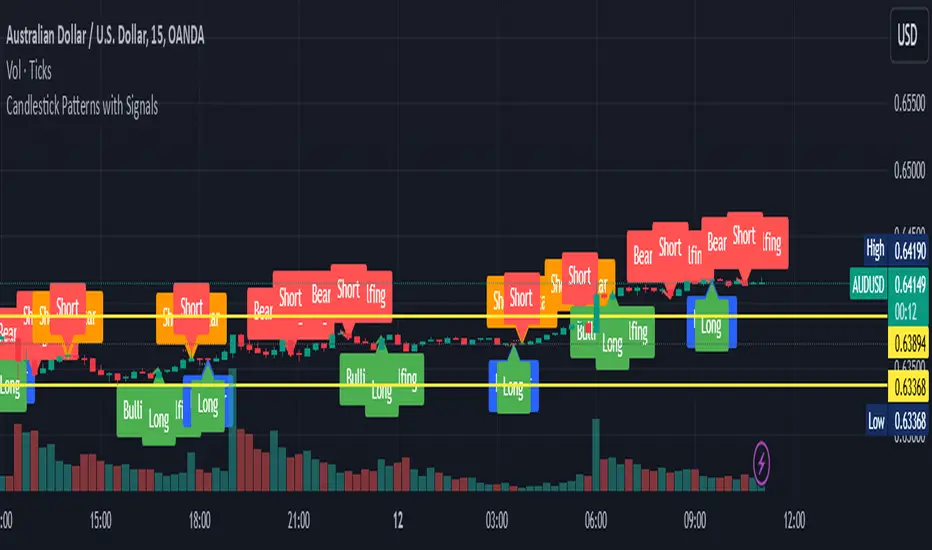
Candlestick Patterns with SignalsIdentified Patterns:
Bullish Engulfing: Indicates potential upward price movement, marked with green labels and lines.
Bearish Engulfing: Suggests potential downward price movement, marked with red labels and lines.
Hammer: A bullish reversal pattern, marked with blue labels.
Shooting Star: A bearish reversal pattern, marked with orange labels.
Signal Generation:
Long Signal: Triggered when a Bullish Engulfing or Hammer pattern is detected. A dotted green line marks the entry level.
Short Signal: Triggered when a Bearish Engulfing or Shooting Star pattern is detected. A dotted red line marks the entry level.
Visual Elements:
Labels indicating the candlestick pattern names appear at the relevant candles.
Lines connect the previous and current candles for engulfing patterns to highlight their range.
Dotted lines indicate potential entry levels for long or short trades.
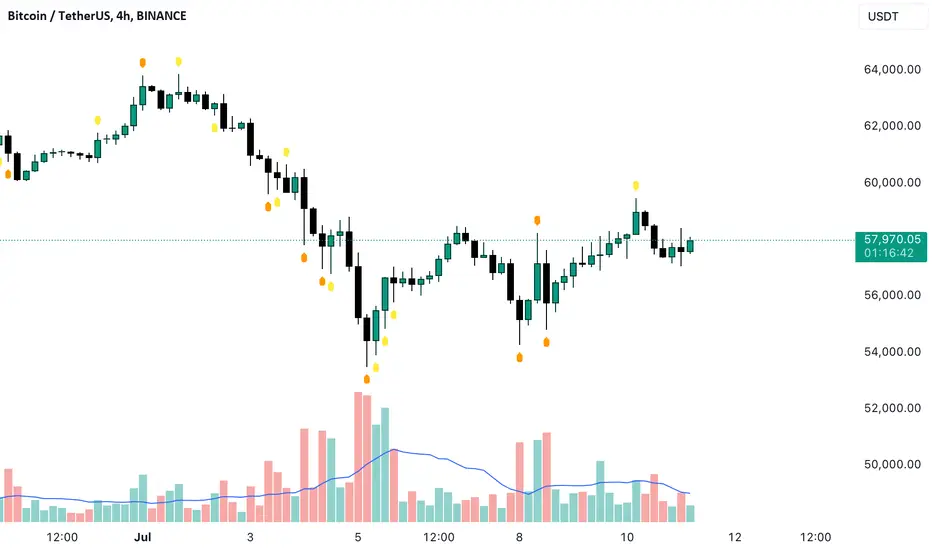
Candle Patterns with Volume ValidationHey Guys !
█ This indicator shows validated Hammer and Shooting Star candle patterns based on volume.
This indicator identifies Hammer and Shooting Star patterns and validates them using volume analysis.
Hammer and Shooting Star patterns are candlestick patterns that signal potential reversals in the market.
█ Usages:
A hammer is formed when in a session, the price has fallen, only to reverse and recover to close back near the opening price. This is a sign of strength with the selling having been absorbed in sufficient strength for the buyers to overwhelm the sellers, allowing the market to recover. The hammer is so called as it is ‘hammering out a bottom’, and just like the shooting star, is immensely powerful when combined with Volume Price Analysis (VPA).
The shooting star is a bearish reversal pattern that appears at the top of uptrends. It signifies that prices have peaked and a downward reversal is likely. The presence of high volume strengthens this signal, indicating that the insiders are offloading their positions.
When combined with volume analysis, these patterns become powerful signals. The volume provides context to the price action, helping traders confirm the validity of the pattern. For example, a hammer with high volume suggests strong buying interest, whereas a shooting star with high volume indicates strong selling pressure.
█ Features:
• Detects Hammer and Shooting Star patterns.
• Validates patterns with volume thresholds.
• Color codes patterns based on volume validation.
• Allows customization of volume thresholds and pattern criteria.
• Option to show or hide signals.
█ Parameters:
• Volume Average Period: The period used to calculate the average volume.
• Higher Volume Multiplier: Multiplier to define higher volume threshold.
• Much Higher Volume Multiplier: Multiplier to define much higher volume threshold.
• Enormous Volume Multiplier: Multiplier to define enormous volume threshold.
• Body/Shadow Ratio for Hammer and Shooting Star: Ratio of body to shadow for pattern validation.
• Upper Shadow Limit for Hammer: Upper shadow limit for Hammer pattern.
• Lower Shadow Limit for Shooting Star: Lower shadow limit for Shooting Star pattern.
• Show Hammer Signals: Display signals for Hammer patterns.
• Show Shooting Star Signals: Display signals for Shooting Star patterns.
Enjoy !
Candle Combo ScreenerThe Candle Combo Screener allows you to see candlestick combinations for up to 5 different tickers at the same time . If one of the candle combination is detected the corresponding cell will be highlighted to alert you.
Candle Combinations Detected
Bullish Kicker
Bullish & Bearish Oops Reversals
Open Equals High / Low
Inside Day
Select any 5 tickers. Colors and table settings are fully customizable to fit your style.
Bullish Kicker
The opening price of the current candle gaps up above the body of the prior day's candle AND the prior day's candle close was less than the open.
Oops Reversals
Bullish: Price opens below the prior day’s low and closes above.
Bearish: Price opens above the prior day's high and closes below.
Open Equals High / Low
The current candles opening price is equal to either the high or low of the day.
Inside Day
The current candles high and low are contained within the prior day's high and low.

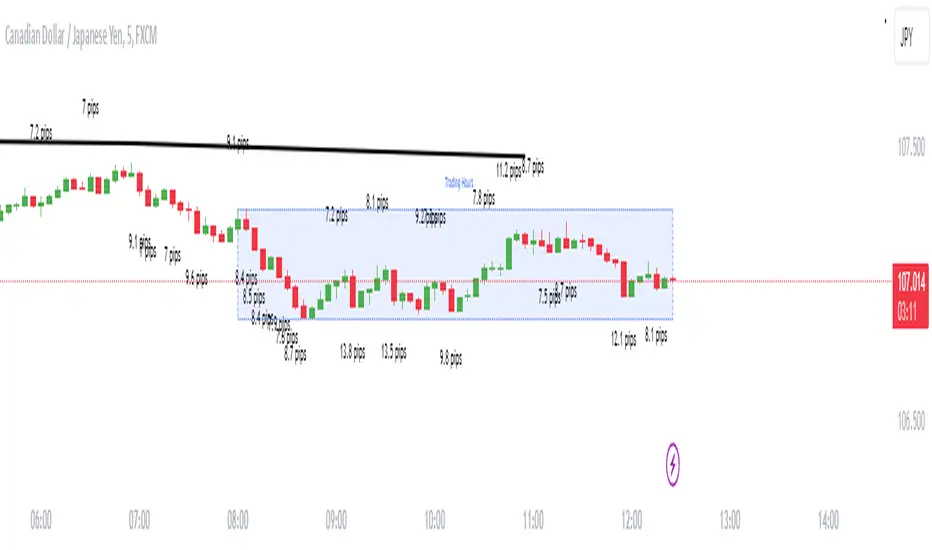
Candle size in pipsDescription
Enhance your trading strategy with precision using this script, designed to measure the range of a candle from wick to wick in pips. Whether you're implementing a specific pip requirement within a candle for your strategy, or simply seeking to better understand market dynamics, this tool provides valuable insights. The script is calculating the amount of pips between the high and the low then compares it to the minimal size you declared. If the amount of pips is more or equal to minimal size it will show the label.
Features
Alert Functionality: Opt to receive alerts by checking the checkbox (default: false).
Customizable Pip Threshold: Tailor the script to your needs by setting the minimum required pips to display on the screen (default: 12).
Different shape: circle, triangle up, triangle down, none
How to Use
Personalize your trading approach by integrating this script with your preferred strategy. For instance, in my strategy involving a 3M continuation, I leverage this tool to determine the pip count of the M15 candle before making entry decisions.
Note: Ensure you understand your strategy's requirements and adjust the script settings accordingly for optimal result s.
Feel free to reach out if you have any questions or require further assistance in maximizing the utility of this script.
Candle Volume Profile Marker# 📊 Candle Volume Profile Marker (CVPM)
**Transform your chart analysis with precision volume profile levels on every candle!**
The Candle Volume Profile Marker displays key volume profile levels (POC, VAH, VAL) for individual candles, giving you granular insights into price acceptance and rejection zones at the micro level.
## 🎯 **Key Features**
### **Core Levels**
- **POC (Point of Control)** - The price level with highest volume concentration
- **VAH (Value Area High)** - Upper boundary of the value area
- **VAL (Value Area Low)** - Lower boundary of the value area
- **Customizable Value Area** - Adjust percentage from 50% to 90%
### **Flexible Display Options**
- **Current Candle Only** or **Historical Lookback** (1-50 candles)
- **Multiple Visual Styles** - Lines, dots, crosses, triangles, squares, diamonds
- **Smart Line Extensions** - Right only, both sides, or left only
- **4 Line Length Modes** - Normal, Short, Ultra Short, Micro (for ultra-clean charts)
- **Full Color Customization** - Colors, opacity, line width
- **Adjustable Marker Sizes** - Tiny to Large
### **Advanced Calculation Methods**
Choose your POC calculation:
- **Weighted** - Smart estimation based on volume distribution (default)
- **Close** - Uses closing price
- **Middle** - High-Low midpoint
- **VWAP** - Volume weighted average price
### **Professional Tools**
- **Real-time Info Table** - Current levels display
- **Smart Alerts** - POC crosses and Value Area breakouts
- **Highlight Current Candle** - Extended dotted lines for current levels
- **Developing Levels** - Real-time updates for active candle
## 🚀 **Why Use CVPM?**
### **Precision Trading**
- Identify exact support/resistance on each candle
- Spot volume acceptance/rejection zones
- Plan entries and exits with micro-level precision
### **Clean & Customizable**
- Lines extend only right (eliminates confusion)
- Ultra-short line options for minimal chart clutter
- Professional appearance with full customization
### **Multiple Timeframes**
- Works on any timeframe from 1-minute to monthly
- Historical analysis with adjustable lookback
- Real-time developing levels
## 📈 **Perfect For**
- **Day Traders** - Micro-level entry/exit points
- **Swing Traders** - Key levels for position management
- **Volume Analysis** - Understanding price acceptance zones
- **Support/Resistance Trading** - Precise level identification
- **Breakout Trading** - Value area breakout alerts
## ⚙️ **Easy Setup**
1. Add indicator to your chart
2. Choose your preferred visual style (lines/dots)
3. Select line extension (right-only recommended)
4. Adjust line length (try "Ultra Short" for clean charts)
5. Customize colors and enable alerts
## 🎨 **Customization Groups**
- **Display Options** - What to show and how many candles
- **Calculation** - POC method and value area percentage
- **POC Visual** - Style, color, width, length for Point of Control
- **Value Area Visual** - Style, color, width, length for VAH/VAL
- **Line Settings** - Extension direction and length modes
- **Size** - Marker sizes and opacity
## 🔔 **Built-in Alerts**
- Price crosses above/below POC
- Value Area breakouts (up/down)
- Fully customizable alert messages
## 💡 **Pro Tips**
- Use "Right Only" extension to avoid confusion about which candle owns the levels
- Try "Ultra Short" or "Micro" line modes for cleaner charts
- Enable "Highlight Current Candle" for extended reference lines
- Combine with volume indicators for enhanced analysis
- Use different colors for easy POC/VAH/VAL identification
---
**Transform your volume analysis today with the most flexible and customizable candle-level volume profile indicator available!**
*Perfect for traders who demand precision and clean, professional charts.*

CANDLE RANGE THEORY (H1 Only)Hello traders.
This indicator identifies CRT candles
-Each candle is a range.
-Each candle has its own po3.
-Focus on specific times of the day. By recognizing the importance of time and price, we can capture high-quality trades. Together with HTF PD array, Look for 4-hour candles forming at specific times of the day. (1am - 5am - 9am EST)
-After the 1st candle, wait for the 2nd candle to clear the high/low of the 1st candle and then close inside the 1st candle range at a specific time (1-5-9) and look for entries in the LTF
Why choose 1 5 9 hours EST?
### **1. 1:00 AM (EST)**
- **Trading Session:** This is the time between the Tokyo (Asian) session and the Sydney (Australian) session. The Asian market is very active.
- **Characteristics:**
- Liquidity: Moderate, as only the Asian market is active.
- Volatility: Pairs involving JPY (Japanese Yen), AUD (Australian Dollar), and NZD (New Zealand Dollar) tend to have higher volatility.
- Trading Opportunities: Suitable for traders who like to trade trends or news in the Asian region.
- **Note:** Volatility may be lower than the London or New York session.
### **2. 5:00 AM (EST)**
- **Trading Session:** This is the time near the end of the Tokyo session and the London (European) session is about to open.
- **Characteristics:**
- Liquidity: Starts to increase due to the preparation of the European market.
- Volatility: This is the time between two trading sessions, there can be strong fluctuations, especially in major currency pairs such as EUR/USD, GBP/USD.
- Trading opportunities: Suitable for breakout trading strategies when liquidity increases.
- **Note:** The overlap between Tokyo and London can cause sudden fluctuations.
### **3. 9:00 AM (EST)**
- **Trading sessions:** This time is within the London session and near the beginning of the New York session.
- **Characteristics:**
- Liquidity: Very high, as this is the period between the two largest sessions – London and New York.
- Volatility: Extremely strong, especially for major currency pairs such as EUR/USD, GBP/USD, USD/JPY.
- Trading opportunities: Suitable for both news trading and trend trading, as this is the time when a lot of economic data is released (usually from the US or the European region).
- **Note:** High volatility can bring big profits, but also comes with high risks.
### **Summary of effects:**
- **1 AM (EST):** Moderate volatility, focusing on Asian currency pairs.
- **5 AM (EST):** Increased liquidity and volatility, suitable for breakout trading.
- **9 AM (EST):** High volatility and high liquidity, the best time for Forex trading.
==> How to trade, when the high/low of CRT is swept, move to LTF to wait for confirmation to enter the order
Only sell at high level and buy at discount price.
Find CE at specific important time. Trading CRT with HTF direction has better win rate.
The more inside bars, the higher the probability.
Place a partial and Move breakeven at 50% range.
Do a backtest and post your chart.

Candle AnalysisImportant Setup Note
Optimize Your Viewing Experience
To ensure the Candle Analysis Indicator displays correctly and to prevent any default chart colors from interfering with the indicator's visuals, please adjust your chart settings:
Right-Click on the Chart and select "Settings".
Navigate to the "Symbol" tab.
Set transparent default candle colors:
- Body
-Borders
- Wick
By customizing these settings, you'll experience the full visual benefits of the indicator without any overlapping colors or distractions.
Elevate your trading strategy with the Candle Analysis Indicator—a powerful tool designed to give you a focused view of the market exactly when you need it. Whether you're honing in on specific historical periods or testing new strategies, this indicator provides the clarity and control you've been looking for.
Key Features:
🔹 Custom Date Range Selection
Tailored Analysis: Choose your own start and end dates to focus on the market periods that matter most to you.
Historical Insights: Dive deep into past market movements to uncover hidden trends and patterns.
🔹 Dynamic Backtesting Simulation
Interactive Playback: Enable backtesting to simulate how the market unfolded over time.
Strategy Testing: Watch candles appear at your chosen interval, allowing you to test and refine your trading strategies in real-time scenarios.
🔹 Enhanced Visual Clarity
Focused Visualization: Only candles within your specified date range are highlighted, eliminating distractions from irrelevant data.
Distinct Candle Styling: Bullish and bearish candles are displayed with unique colors and transparency, making it easy to spot market sentiment at a glance.
🔹 User-Friendly Interface
Easy Setup: Simple input options mean you can configure the indicator quickly without any technical hassle.
Versatile Application: Compatible with various timeframes—whether you're trading intraday, daily, or weekly.
Candle volume analysis The indicator is designed for traders who are more interested in market structures and price action using volumes. Volume analysis can help traders build a clearer understanding of zones of buyer and seller interest, as well as places to capture liquidity (traders' stop levels).
Key Features:
The indicator highlights candle volumes in selected colors, where the volume is greater individually than the volumes of the trader's chosen number of preceding candles. Or the volume that is greater than the sum of volumes of the trader's chosen number of preceding candles.

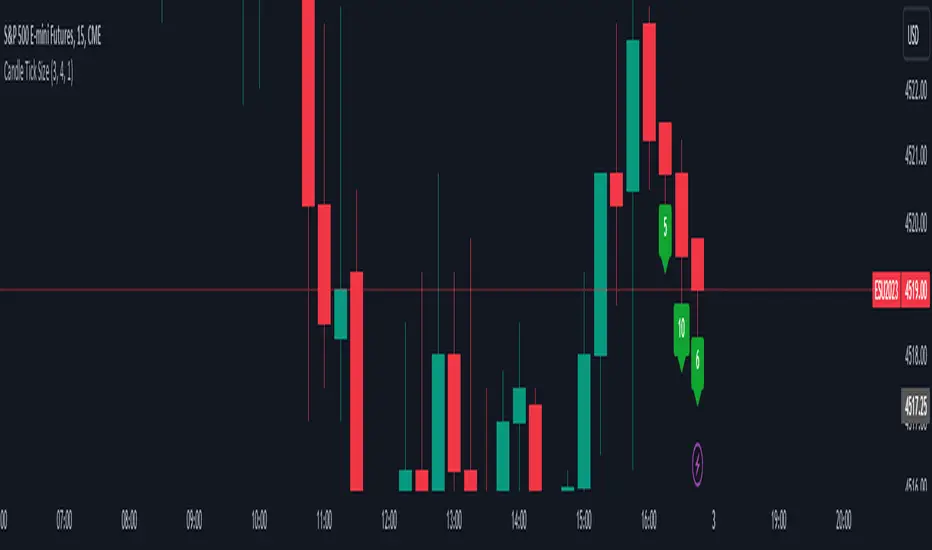
Candle Tick SizeHello everyone!
I dont think it exists, I couldnt find it any way I searched, maybe it is part of a bigger indicator. This is a really basic code, all it does, it shows the tick/pip size of the candles forming. You can adjust on how many candles should it show. Also because the code counts the point size of the candles from high to low, you can adjust that how many ticks are in one point, like for ES and NQ 4 ticks to a point, which is the basic setting. It helps me with entrys when I calculate the contract size so my risk/reward stays pretty much the same depending on the candle size for my entrys.
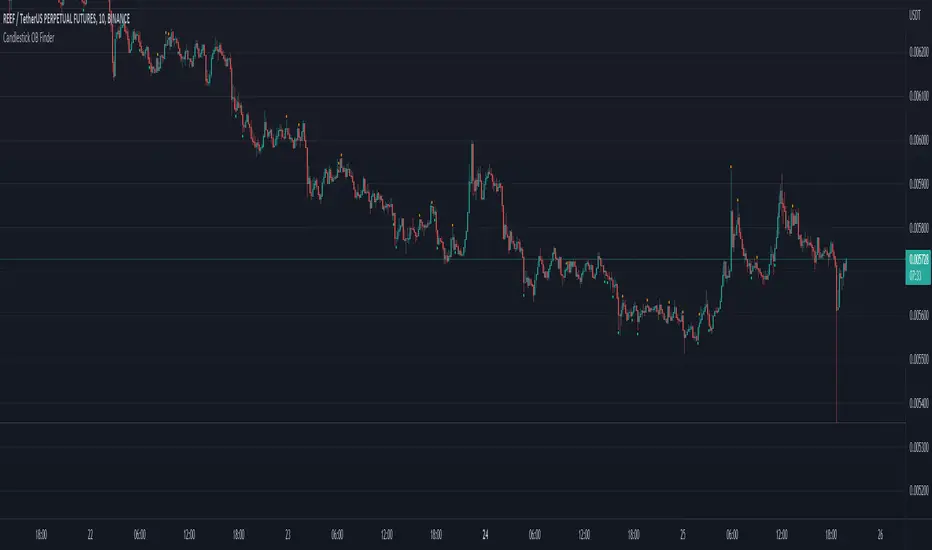
Candlestick OB FinderIntroduction
Hello, this here is a non-repainting candlestick indicator which is able to detect OB looking candlestick formations.
Usage
It can be used to confirm entries, but be aware that it produces a lot of false signals.
Somehow the swings tend to reverse at these points.
I recommend the 10–15 minutes timeframe.
I hope you enjoy this small indicator. :)
Candle Close ConfirmationTradingview doesn't provide a way to prevent unclosed candles from displaying in real time.
This script helps to reduce errors that span from reading unconfirmed candles by preventing the unconfirmed candle from displaying across all timeframes.
Ideal for traders with strategies that rely on candle confirmation signals.
NOTE: It works by drawing new candles based on the normal candles and stops just before the current unconfirmed candle, so you need to disable regular bar chart candles for this to work properly.
How to do that -
Chart Settings >
Symbols >
Candles >
Disable (Body, Borders, Wick)
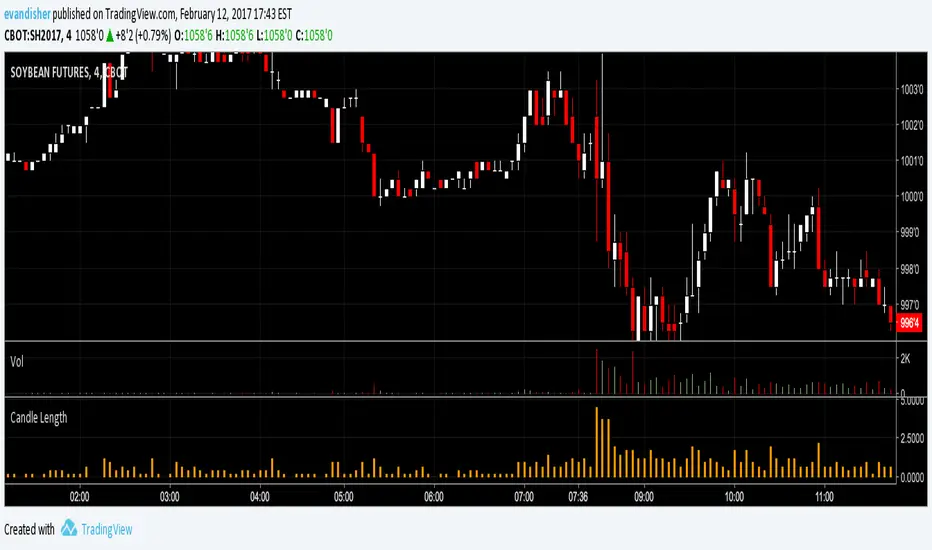
Candle Length by WiscoDishMeasure of the total candle length, including the upper and lower wicks. Works best as a histogram in my opinion. Used as a quick reference for the high minus the low of each candle.