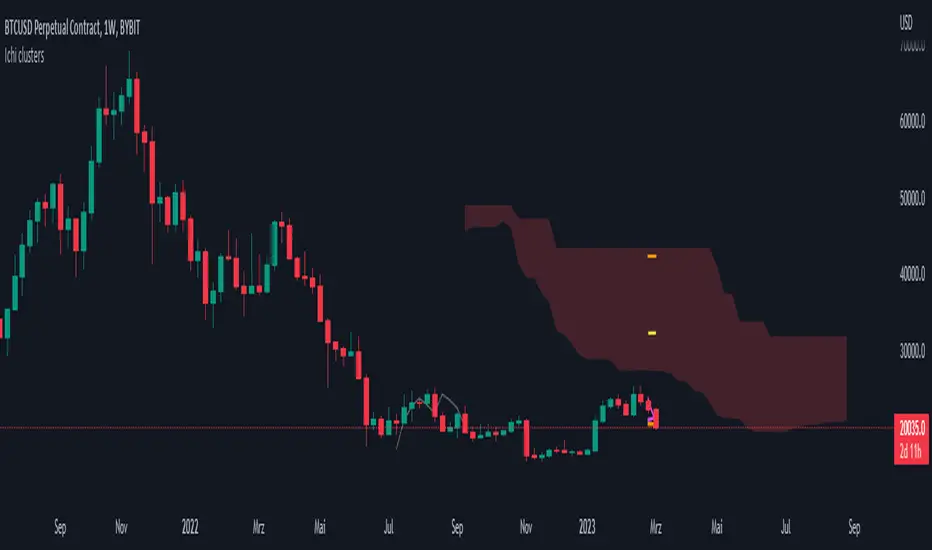
BTC Markup/Markdown Zones by Koenigsegg📈 BTC Markup/Markdown Zones
A handcrafted indicator designed to mark Bitcoin's most critical High Time Frame (HTF) structure shifts. This tool overlays true institutional-level Markup and Markdown Zones, selected manually after deep market review. Whether you're testing strategies or actively trading, this tool gives you the bigger picture at all times.
🔍 Key Features:
✅ HTF Markup & Markdown Zones
Every zone is manually selected — no indicators, no repainting. Just raw market history and real structure.
✅ Two Display Modes
• Background Zones — soft overlays with low opacity for visual context — with the option to increase opacity manually if desired.
• Start Candle Highlight — sharply highlighted candle marking the final pivot before a macro reversal.
✅ Custom Color Controls (Style Tab)
All visual styling lives in the Style tab, with clearly labeled fields:
• Markup Zone
• Markdown Zone
• Start Candle Highlight Markup
• Start Candle Highlight Markdown
✅ Minimal Input Section
Just one toggle: display mode. Everything else is kept clean and intuitive.
🧠 Purpose:
This script is made for any timeframe:
• Zoom into lower timeframes to know whether you're trading inside a Markup or Markdown
• Use it during strategy testing for true structural awareness
📅 Handpicked Macro Turning Points:
Each zone originates from a manually confirmed candle — the last meaningful candle before a shift in control between bulls and bears:
• FRI 19 AUG 2011 12PM – MARK DOWN
• THU 20 OCT 2011 12AM – MARK UP
• WED 10 APR 2013 12PM – MARK DOWN
• FRI 12 APR 2013 12PM – MARK UP
• SAT 30 NOV 2013 12AM – MARK DOWN
• WED 14 JAN 2015 12PM – MARK UP
• SUN 17 DEC 2017 12PM – MARK DOWN
• SAT 15 DEC 2018 12PM – MARK UP
• WED 14 APR 2021 4AM – MARK DOWN
• TUE 22 JUN 2021 12PM – MARK UP
• WED 10 NOV 2021 12PM – MARK DOWN
• MON 21 NOV 2022 8PM – MARK UP
• THU 14 MAR 2024 4AM – MARK DOWN
• MON 5 AUG 2024 12PM – MARK UP
• MON 20 JAN 2025 4AM – MARK DOWN
💡 Zones are manually updated by me after each new confirmed Markup or Markdown.
🧬 Fractal Structure for MTF Systems
Price is fractal — meaning the same principles of structure repeat across all timeframes. In Version 2, this tool evolves by introducing manually selected sub-zones inside each High Time Frame (HTF) Markup or Markdown. These sub-zones reflect Medium Timeframe (MTF) structure shifts, offering precision for traders who operate on both intraday and swing levels.
This makes the indicator ideal for low timeframe (LTF) Markup/Markdown awareness — whether you're managing 15m entries or building multi-timeframe confluence systems.
No auto-zones. No guesswork. Just clean, intentional structure division within the broader trend, handpicked for maximum clarity and edge.
💡 Pro Tip:
When price is inside a Markup Zone, shorting becomes riskier — you're trading against a macro bullish structure.
When inside a Markdown Zone, longing becomes riskier — you're fighting against confirmed bearish momentum.
Use this tool to stay aligned with the broader move, especially when zoomed into smaller timeframes or managing entries/exits during intraday setups.
📈 Markup Phase – Bullish Sentiment
Definition: A period where price makes higher highs and higher lows — the uptrend is in full force.
Why sentiment is bullish:
- Institutions and smart money are already positioned long.
- Public/institutional demand drives prices up.
- Momentum is supported by positive news, breakouts, and FOMO.
- Higher highs confirm buyers are in control.
📉 Markdown Phase – Bearish Sentiment
Definition: A period where price makes lower lows and lower highs — clear downtrend.
Why sentiment is bearish:
- Distribution has already occurred, and supply outweighs demand.
- Smart money is short or sidelined, waiting for deeper prices.
- Panic selling or trend-following traders add downside momentum.
- Lower lows confirm sellers are in control.
❌ Trading Against the Trend — Consequences:
-Reduced Probability of Success
-You’re fighting the dominant flow. Most participants are pushing in the opposite direction.
-Drawdowns & Stop-Outs
-Countertrend trades often get wicked or flushed before any meaningful move, especially without structure-based entries.
-Low Risk-Reward Ratio
-Trends offer sustained moves. Countertrend trades may have small take-profit zones or chop.
-Mental Drain & Doubt
-Fighting momentum causes anxiety, second-guessing, and emotional reactions.
-Missed Opportunities
-Focusing on fighting the trend makes you blind to the high-probability setups with the trend.
-Increased Transaction Costs
-More stop-outs and re-entries mean more fees, more friction.
-FOMO from Watching the Trend Run
-Entering countertrend means you might watch the trend explode without you.
-Confirmation Bias & Stubbornness
-Countertrend traders often look for reasons to justify staying in the wrong direction — leading to bigger losses.
🧠 Summary
In markup = bulls dominate → you swim with the current.
In markdown = bears dominate → going long is like pushing a rock uphill.
Trading with the trend is not just safer, it's smarter. The edge lives in momentum — not ego.
⚠️ Disclaimer
This indicator is for educational and analytical use only. It is not financial advice and should not be relied on for decision-making without personal analysis.
This is not a predictive tool. No indicator can forecast upcoming price movements.
What you see here is based purely on past market behavior — specifically, historical tops and bottoms that marked the start of confirmed reversals.
This script does not know where the next reversal begins, nor can it determine where a new Markup or Markdown starts or ends. It is designed to provide context, not prediction.
Always trade with responsibility and perform your own due diligence.
Cari dalam skrip untuk "mtf"
Trend Matrix Multi-Timeframe Dashboard(TechnoBlooms)Trend Matrix Multi-Timeframe Dashboard is a Minimalist Multi-Timeframe Trend Analyzer with Smart Indicator Integration. Trend Matrix MTF Dashboard is a clean, efficient, and visually intuitive trend analyzer built for traders who value simplicity without compromising on technical depth.
This dashboard empowers you to track trend direction across multiple timeframes using a curated set of powerful technical indicators—all from one compact visual panel. The design philosophy is simple: eliminate clutter, highlight trend clarity, and accelerate your decision-making process.
Key Features
✅ Minimalist Design with Maximum Insight
A compact dashboard view designed for clean charts and focused trading
Optimized layout shows everything you need—nothing you don’t
✅ Multi-Timeframe Access at a Glance
Instantly read the trend direction of selected indicators on multiple timeframes (e.g., 15m, 1h, 4h, 1D)
Customize the timeframe stack to fit scalping, intraday, swing, or positional strategies
✅ Robust Technical Indicators Built In
Each one is hand-picked for trend reliability:
MACD – Momentum and crossover confirmation
RSI – Overbought/oversold and directional shift
EMA – Dynamic support/resistance and trend bias
Bollinger Bands – Volatility structure and trend containment
PVT – Volume-Weighted Trend Confirmation
Supertrend – Price-following trend tracker
✅ Live Updates & Lightweight Performance
Built to update efficiently on every bar close
Minimal performance impact even with multiple timeframes active
By offering multi-timeframe (MTF) access to proven trend-following indicators, Trend Matrix helps you confidently align with the market’s dominant direction—without jumping between charts or analyzing indicators one by one.
This indicator offers customizable settings. The trader can choose the input parameters timeframes as per the choice.
Trend Matrix Multi-Timeframe Dashboard helps traders to identify trend based on technical indications. Trader can refer this while taking trading decisions.
🧠 Ideal For
Scalpers who need higher timeframe confirmation
Swing traders identifying clean entries aligned with the macro trend
Trend followers seeking clarity before committing capital
Price action & SMC traders validating market structure setups
Beginners who want a high-level trend guide without messy indicators
Multi-Timeframe PSAR Indicator ver 1.0Enhance your trend analysis with the Multi-Timeframe Parabolic SAR (MTF PSAR) indicator! This powerful tool displays the Parabolic SAR (Stop and Reverse) from both the current chart's timeframe and a higher timeframe, all in one convenient view. Identify potential trend reversals and set dynamic trailing stops with greater confidence by understanding the broader market context.
Key Features:
Dual Timeframe Analysis: Simultaneously visualize the PSAR on your current chart and a user-defined higher timeframe (e.g., see the Daily PSAR while trading on the 1-hour chart). This helps you align your trades with the dominant trend.
Customizable PSAR Settings: Fine-tune the PSAR calculation with adjustable Start, Increment, and Maximum values. Optimize the indicator's sensitivity to match your trading style and the volatility of the asset.
Independent Timeframe Control: Choose to display either or both the current timeframe PSAR and the higher timeframe PSAR. Focus on the information most relevant to your analysis.
Clear Visual Representation: Distinct colors for the current and higher timeframe PSAR dots make it easy to differentiate between the two. Quickly identify potential entry and exit points.
Configurable Colors You can easily change colors of Current and HTF PSAR.
Standard PSAR Logic: Uses the classic Parabolic SAR algorithm, providing a reliable and widely-understood trend-following indicator.
lookahead=barmerge.lookahead_off used in the security function, there is no data leak or repainting.
Benefits:
Improved Trend Identification: Spot potential trend changes earlier by observing divergences between the current and higher timeframe PSAR.
Enhanced Risk Management: Use the PSAR as a dynamic trailing stop-loss to protect profits and limit potential losses.
Greater Trading Confidence: Make more informed decisions by considering the broader market trend.
Reduced Chart Clutter: Avoid the need to switch between multiple charts to analyze different timeframes.
Versatile Application: Suitable for various trading styles (swing trading, day trading, trend following) and markets (stocks, forex, crypto, etc.).
How to Use:
Add to Chart: Add the "Multi-Timeframe PSAR" indicator to your TradingView chart.
Configure Settings:
PSAR Settings: Adjust the Start, Increment, and Maximum values to control the PSAR's sensitivity.
Multi-Timeframe Settings: Select the desired "Higher Timeframe PSAR" resolution (e.g., "D" for Daily). Enable or disable the display of the current and/or higher timeframe PSAR using the checkboxes.
Interpret Signals:
Current Timeframe PSAR: Dots below the price suggest an uptrend; dots above the price suggest a downtrend.
Higher Timeframe PSAR: Provides context for the overall trend. Agreement between the current and higher timeframe PSAR strengthens the trend signal. Divergences may indicate potential reversals.
Trade Management:
Use PSAR dots as dynamic trailing stop.
Example Use Cases:
Confirming Trend Strength: A trader on a 1-hour chart sees the 1-hour PSAR flip bullish (dots below the price). They check the MTF PSAR and see that the Daily PSAR is also bullish, confirming the strength of the uptrend.
Identifying Potential Reversals: A trader sees the current timeframe PSAR flip bearish, but the higher timeframe PSAR remains bullish. This divergence could signal a potential pullback within a larger uptrend, or a warning of a more significant reversal.
Trailing Stops: A trader enters a long position and uses the current timeframe PSAR as a trailing stop, moving their stop-loss up as the PSAR dots rise.
Disclaimer: The Parabolic SAR is a lagging indicator and may produce false signals, especially in ranging markets. It is recommended to use this indicator in conjunction with other technical analysis tools and risk management strategies. Past performance is not indicative of future results.
Ichimoku MTF (best MTF 4H - Entry 15M)The Ichimoku Cloud is a collection of technical indicators that show support and resistance levels, as well as momentum and trend direction. It does this by taking multiple averages and plotting them on a chart. It also uses these figures to compute a “cloud” that attempts to forecast where the price may find support or resistance in the future.
The technical indicator shows relevant information at a glance by using averages.
The overall trend is up when the price is above the cloud, down when the price is below the cloud, and trendless or transitioning when the price is in the cloud.
Charles G. Koonitz. “Ichimoku Analysis & Strategies: The Visual Guide to Spot the Trends in Stock Market, Cryptocurrency and Forex Using Technical Analysis and Cloud Charts," Tripod Solutions Inc., 2019.
When Leading Span A is rising and above Leading Span B, this helps to confirm the uptrend and the space between the lines is typically colored green. When Leading Span A is falling and below Leading Span B, this helps confirm the downtrend. The space between the lines is typically colored red in this case.1
Traders will often use the Ichimoku Cloud as an area of support and resistance depending on the relative location of the price. The cloud provides support/resistance levels that can be projected into the future. This sets the Ichimoku Cloud apart from many other technical indicators that only provide support and resistance levels for the current date and time.
Traders should use the Ichimoku Cloud in conjunction with other technical indicators to maximize their risk-adjusted returns. For example, the indicator is often paired with the relative strength index (RSI), which can be used to confirm momentum in a certain direction. It’s also important to look at the bigger trends to see how the smaller trends fit within them. For example, during a very strong downtrend, the price may push into the cloud or slightly above it, temporarily, before falling again. Only focusing on the indicator would mean missing the bigger picture that the price was under strong longer-term selling pressure.
Crossovers are another way that the indicator can be used. Watch for the conversion line to move above the base line, especially when the price is above the cloud. This can be a powerful buy signal. One option is to hold the trade until the conversion line drops back below the base line. Any of the other lines could be used as exit points as well.
Multi-timeframe 24 moving averages + BB+SAR+Supertrend+VWAP █ OVERVIEW
The script allows to display up to 24 moving averages ("MA"'s) across 5 timeframes plus two bands (Bollinger Bands or Supertrend or Parabolic SAR or VWAP bands) each from its own timeframe.
The main difference of this script from many similar ones is the flexibility of its settings:
- Bulk enable/disable and/or change properties of several MAs at once.
- Save 3 of your frequently used templates as presets using CSV text configurations.
█ HOW TO USE
Some use examples:
In order to "show 31, 50, 200 EMAs and 20, 100, 200 SMAs for each of 1H, 4H, D, W, M timeframes using blue for short MA, yellow for mid MA and red for long MA" use the settings as shown on a screenshot below.
In order to "Show a band of chart timeframe MA's of lengths 5, 8, 13, 21, 34, 55, 100 and 200 plus some 1H, 4H, D and W MAs. Be able to quickly switch off the band of chart tf's MAs. For chart timeframe MA's only show labels for 21, 100 and 200 EMAs". You can set TF1 and TF2 to chart's TF and set you fib MAs there and configure fixed higher timeframe MAs using TF3, TF4 and TF5 (e.g. using 1H, D and W timeframes and using 1H 800 in place of 4H 200 MA). However, quicker way may be using CSV - the syntax is very simple and intuitive, see Preset 2 as it comes in the script. You can easily switch chart tf's band of MAs by toggling on/off your chart timeframe TF's (in our example, TF1 and TF2).
The settings are either obvious or explained in tooltips.
Note 1: When using group settings and CSV presets do not forget that individual setting affected will no have any effect. So, if some setting does not work, check whether it is overridden with some group setting or a CSV preset.
Note 2: Sometimes you can notice parts of MA's hanging in the air, not lasting up to the last bar. This is not a bug as explained on this screenshot:
█ FOR DEVELOPERS
The script is a use case of my CSVParser library, which in turn uses Autotable library, both of which I hope will be quite helpful. Autotable is so powerful and comprehensive that you will hardly ever wish to use normal table functions again for complex tables.
The indicator was inspired by Pablo Limonetti's url=https://www.tradingview.com/script/nFs56VUZ/]Multi Timeframe Moving Averages and Raging @RagingRocketBull's # Multi SMA EMA WMA HMA BB (5x8 MAs Bollinger Bands) MAX MTF - RRB
Directional Volume EStimate from Price Action (RedK D_VESPA)The "Directional Volume EStimate from Price Action (RedK D_VESPA)" is another weapon for the VPA (Volume Price Analysis) enthusiasts and traders who like to include volume-based insights & signals to their trading. The basic concept is to estimate the sell and buy split of the traded volume by extrapolating the price action represented by the shape of the associated price bar. We then create and plot an average of these "estimated buy & sell volumes" - the estimated average Net Volume is the balance between these 2 averages.
D_VESPA uses clear visualizations to represent the outcomes in a less distracting and more actionable way.
How does D_VESPA work?
-------------------------------------
The key assumption is that when price moves up, this is caused by "buy" volume (or increasing demand), and when the price moves down, this is due to "selling" volume (or increasing supply). Important to note that we are making our Buy/sell volume estimates here based on the shape of the price bar, and not looking into lower time frame volume data - This is a different approach and is still aligned to the key concepts of VPA.
Originally this work started as an improvement to my Supply/Demand Volume Viewer (V.Viewer) , I ended up re-writing the whole thing after some more research and work on VPA, to improve the estimation, visualization and usability / tradability.
Think of D_VESPA as the "Pro" version of V.Viewer -- and please go back and review the details of V.Viewer as the root concepts are the same so I won't repeat them here (as it comes to exploring Balance Zone and finding Price Convergence/Divergence)
Main Features of D_VESPA
--------------------------------------
- Update Supply/Demand calculation to include 2-bar gaps (improved algo)
- Add multiple options for the moving average (MA type) for the calculation - my preference is to use WMA
- Add option to show Net Volume as 3-color bars
- Visual simplification and improvements to be less distracting & more actionable
- added options to display/hide main visuals while maintaining the status line consistency (Avg Supply, Avg Demand, Avg Net)
- add alerts for NetVol moving into Buy (crosses 0 up) or Sell (crosses 0 down) modes - or swing from one mode to the other
(there are actually 2 sets of alerts, one set for the main NetVol plot, and the other for the secondary TF NetVol - give user more options on how to utilize D_VESPA)
Quick techie piece, how does the estimated buy/sell volume algo work ?
------------------------------------------------------------------------------------------
* per our assumption, buy volume is associated with price up-moves, sell volume is associated with price down-moves
* so each of the bulls and bears will get the equivalent of the top & bottom wicks,
* for up bars, bulls get the value of the "body", else the bears get the "body"
* open gaps are allocated to bulls or bears depending on the gap direction
The below sketch explains how D_VESPA estimates the Buy/Sell Volume split based on the bar shape (including gap) - the example shows a bullish bar with an opening gap up - but the concept is the same for a down-bar or a down-gap.
I kept both the "Volume Weighted" and "2-bar Gap Impact" as options in the indicator settings - these 2 options should be always kept selected. They are there for those who would like to experiment with the difference these changes have on the buy/sell estimation. The indicator will handle cases where there is no volume data for the selected symbol, and in that case, it will simply reflect Average Estimated Bull/Bear ratio of the price bar
The Secondary TF Est Average Net Volume:
---------------------------------------------------------
I added the ability to plot the Estimate Average Net Volume for a secondary timeframe - options 1W, 1D, 1H, or Same as Chart.
- this feature provides traders the confidence to trade the lower timeframes in the same direction as the prevailing "market mode"
- this also adds more MTF support beyond the existing TradingView's built-in MTF support capability - experiment with various settings between exposing the indicator's secondary TF plot, and changing the TF option in the indicator settings.
Note on the secondary TF NetVol plot:
- the secondary TF needs to be set to same as or higher TF than the chart's TF - if not, a warning sign would show and the plot will not be enabled. for example, a day trader may set the secondary TF to 1Hr or 1Day, while looking at 5min or 15min chart. A swing/trend trader who frequently uses the daily chart may set the secondary TF to weekly, and so on..
- the secondary TF NetVol plot is hidden by default and needs to be exposed thru the indicator settings.
the below chart shows D_VESPA on a the same (daily) chart, but with secondary TF plot for the weekly TF enabled
Final Thoughts
-------------------
* RedK D_VESPA is a volume indicator, that estimates buy/sell and net volume averages based on the price action reflected by the shape of the price bars - this can provide more insight on volume compared to the classic volume/VolAverage indicator and assist traders in exploring the market mode (buyers/sellers - bullish/bearish) and align trades to it.
* Because D_VESPA is a volume indicator, it can't be used alone to generate a trading signal - and needs to be combined with other indicators that analysis price value (range), momentum and trend. I recommend to at least combine D_VESPA with a variant of MACD and RSI to get a full view of the price action relative to the prevailing market and the broader trend.
* I found it very useful to take note and "read" how the Est Buy vs Est Sell lines move .. they sort of "tell a story" - experiment with this on your various chart and note the levels of estimate avg demand vs estimate avg supply that this indicator exposes for some very valuable insight about how the chart action is progressing. Please feel free to share feedback below.
The Strat [LuxAlgo]The Strat indicator is a full toolkit regarding most of the concepts within "The Strat" methodology with features such as candle numbering, pivot machine gun (PMG) highlighting, custom combo highlighting, and various statistics included.
Alerts are also included for the detection of specific candle numbers, custom combos, and PMGs.
🔶 SETTINGS
Show Numbers on Chart: Shows candle numbering on the chart.
Style Candles: Style candles based on the detected number. Only effective on non-line charts and if the script is brought to the front.
🔹 Custom Combo Search
Combo: User defined combo to be searched by the script. Combos can be composed of any series of numbers including (1, 2, -2, 3), e.g : 2-21. No spaces or other characters should be used.
🔹 Pivot Machine Gun
Show Labels: Highlight detected PMGs with a label.
Min Sequence Length: Minimum sequence length of consecutive higher lows/lower highs required to detect a PMG.
Min Breaks: Minimum amount of broken previous highs/lows required to detect a PMG.
Show Levels: Show levels of the broken highs/lows.
🔹 Pivot Combos
Pivot Lookback: Lookback period used for detecting pivot points.
Right Bars Scan: Number of bars scanned to the right side of a detected pivot.
Left Bars Scan: Number of bars scanned to the left side of a detected pivot.
🔹 Dashboard
Show Dashboard: Displays statistics dashboard on chart.
Numbers Counter: Displays the numbers counter section on the dashboard.
Pivot Combos: Displays pivots combo section on the dashboard.
%: Display the percentage of detected pivot combos on the dashboard instead of absolute numbers.
Pivot Combos Rows: Number of rows displayed by the "Pivots Combo" dashboard section.
Show MTF: Showa MTF candle numbering on the dashboard.
Location: Location of the dashboard on the chart.
Size: Size of the displayed dashboard.
🔶 USAGE
This script allows users with an understanding of The Strat to quickly highlight elements such as candle numbers, pivot machine guns, and custom combos. The usage for these concepts is given in the sub-sections below.
🔹 Candle Numbers
The Strat assigns a number to individual candles, this number is determined by the current candle position relative to the precedent candle, these include:
Number 1 - Inside bar, occurs when the previous candle range engulfs the current one.
Number 2 Up - Upside Directional Bar, occurs when the current price high breaks the previous high while the current low is lower than the previous high.
Number 2 Down - Downside Directional Bar, occurs when the current price low breaks the previous low while the current high is higher than the previous low.
Number 3 - Outside bar, occurs when the current candle range engulfs the previous one.
The script can highlight the number of a candle by using labels but can also style candles by depending on the candle number. Inside bars (1) only have their candle wick highlighted, directional bars (2) (-2) only have their candle body highlighted. Outside bars have their candle range highlighted.
Note that downside directional bars are highlighted with the number -2.
Users can see the total amount of times a specific candle number is detected on the historical data on the dashboard available within the settings, as well as the number of times a candle number is detected relative to the total amount of detected candle numbers expressed as a percentage.
It is also possible to see the current candle numbers returned by multiple timeframes on the dashboard.
🔹 Searching For Custom Combos
Combos are made of a sequence of two or more candle numbers. These combos can highlight multiple reversals/continuation scenarios. Various common combos are documented by The Strat community.
This script allows users to search for custom combos by entering them on the Combo user setting field.
When a user combo is found, it is highlighted on the chart as a box highlighting the combo range.
🔹 Pivot Combos
It can be of interest to a user to display the combo associated with a pivot high/low. This script will highlight the location of pivot points on the chart and display its associated combo by default. These are based on the Pivot Combo lookback and not displayed in real-time.
Users can see on the dashboard the combos associated with a pivot high/low, these are ranked by frequency.
🔹 Pivot Machine Gun (PMG)
Pivot Machine Guns (PMG)s describe the scenario where a single price variation breaks the value of multiple past successive higher lows/lower highs. This can highlight a self-exciting behavior, where even more past successive higher lows/lower highs get broken.
Users can select the minimum sequence length of successive higher lows/lower highs required for a PMG to be detected, as well the amount of these successive higher lows/lower highs that must be broken.
TMO ScalperTMO - (T)rue (M)omentum (O)scillator) MTF Scalper Version
TMO Scalper is a special custom version of the popular TMO Oscillator. Scalper version was designed specifically for the lower time frames (1-5min intraday scalps). This version prints in the signals directly on top of the oscillator only when the higher aggregations are aligned with the current aggregation (the big wheels must be spinning in order for a small wheel to spin). The scalper consist of three MTF TMO oscillators. First one is the one that plot signals (should be the fastest aggregation), second serves as a short term trend gauge (good rule of thumb is to us 2-5x of the chart time frame or the first aggregation). The third one (optional) is shaded in the background & should only serve as a trend gauge for the day (usually higher time frames 30min+).
Time Frames Preffered by Traders:
1. 1m / 5m / 30m - This one is perfect for catching the fastest moves. However, during choppy days the 1min can produce more false signals..
2. 2m / 10m / 30m - Healthy middle, the 2min aggregation nicely smooths out the 1min mess. Short term gauge is turning slowly (10min for a signal to confirm).
3. 3m / 30m / 60m - This TF is awesome for day traders that prefer to take it slow. Obviously, this combination will produce far less signals during the day.
Hope it helps.
LutrewMTF// ————— Plots
var cMarkerUp = color.new(color.lime, 0)
var cMarkerDn = color.new(color.red, 0)
plotshape(A1U, "Marker 1 Up", shape.triangleup, location.belowbar, cMarkerUp, size = size.tiny, text = "1")
plotshape(A2D, "Marker 2 Dn", shape.triangledown, location.abovebar, cMarkerDn, size = size.tiny, text = "2")
plotshape(A3U, "Marker 3 Up", shape.triangleup, location.belowbar, cMarkerUp, size = size.tiny, text = "\n3")
plotshape(A4D, "Marker 4 Dn", shape.triangledown, location.abovebar, cMarkerDn, size = size.tiny, text = "4\n")
plotshape(A5U, "Marker 5 Up", shape.triangleup, location.belowbar, cMarkerUp, size = size.tiny, text = "\n\n5")
plotshape(A6D, "Marker 6 Dn", shape.triangledown, location.abovebar, cMarkerDn, size = size.tiny, text = "6\n\n")
plotshape(A7U, "Marker 7 Up", shape.triangleup, location.belowbar, cMarkerUp, size = size.tiny, text = "\n\n7")
plotshape(A8D, "Marker 8 Dn", shape.triangledown, location.abovebar, cMarkerDn, size = size.tiny, text = "8\n\n")
// ————— Alert
alertcondition( A1U or A2D or A3U or A4D or A5U or A6D or A7U or A8D, "Pivots MTF: Configured Markers", "Pivots MTF Alert")
// }
PFCC - Pivot Fractal Chaos Channel [Open Source]With the release of my indicator "TOTC - Trade outside the Channel" , the Pivot Fractal Chaos Channel used there has attracted significant interest.
Due to requests from some users, I am happy to publish the source code of the PFCC - although it is not "new" and has been implemented in many other scripts in one way or another. Some Examples:
Support and Resistance Levels with Breaks:
Support Resistance MTF:
Pivot Points High Low (HH/HL/LH/LL):
The code is briefly commented. Please feel free to use or further customize it ... And, of course, I would be happy to be named and/or linked. If you're satisfied, maybe buy me a coffee ;-)
I'm curious to see how this indicator will develop with more ideas - Please keep me updated by commenting below or by sending me a message.
Let's take a quick look at the function and idea
PFCC - "Pivot Fractal Chaos Channel" or also known as "Fractal Chaos Band" can serve as a baseline trend indicator for your strategy.
Essentially, the "Fractal Chaos Channel" shows an overall panorama of price action. As they filter out the insignificant price fluctuations. The upper level is created by drawing price highs and the lower level is created by drawing price lows.
Two Ideas, how this indicator can be used
Trend indicator: If the price breaks the upper line, it could be taken as a buy signal. If the price breaks the lower line, it could be taken as a sell signal.
Trailing Stop Loss: You can track the stop loss with the rising line in case of a buy trade. On the other hand, you can track the stop loss with the falling fractal line in case of a sell trade.
What do I need to consider?
It may be advisable to add further indicators and an analysis of the market structure in order to confirm the signals issued by the indicator. Please note that when you make adjustments to any strategy, you always carry out particularly detailed tests.
You would like to use this indicator, but you have adjustment requests, you want to have additional filters or features implemented, ...?
I am happy to create individual indicators based on "PFCC - Pivot Fractal Chaos Channel" or your ideas. Write me a message and we will discuss the details and conditions.
Order Block FinderAfter finding a huge amount of use from TV user's wugamlo script Order Block Finder (Experimental) , I decided to make some much needed upgrades! Added support for plotting the last X number of Order Blocks and am currently working on a multi-timeframe version.
If you'd like to contribute to the MTF analysis portion, that would benefit tons of other scripts and open the possibility to more "MTF Panel" style indicators.
Please visit the original script page (link at top) to review how the indicator is used in trading.
Technical Ratings█ OVERVIEW
This indicator calculates TradingView's well-known "Strong Buy", "Buy", "Neutral", "Sell" or "Strong Sell" states using the aggregate biases of 26 different technical indicators.
█ FEATURES
Differences with the built-in version
• You can adjust the weight of the Oscillators and MAs components of the rating here.
• The built-in version produces values matching the states displayed in the "Technicals" ratings gauge; this one does not always, where weighting is used.
• A strategy version is also available as a built-in; this script is an indicator—not a strategy.
• This indicator will show a slightly different vertical scale, as it does not use a fixed scale like the built-in.
• This version allows control over repainting of the signal when you do not use a higher timeframe. Higher timeframe (HTF) information from this version does not repaint.
• You can configure markers on signal breaches of configurable levels, or on advances declines of the signal.
The indicator's settings allow you to:
• Choose the timeframe you want calculations to be made on.
• When not using a HTF, you can select a repainting or non-repainting signal.
• When using both MAs and Oscillators groups to calculate the rating, you can vary the weight of each group in the calculation. The default is 50/50.
Because the MAs group uses longer periods for some of its components, its value is not as jumpy as the Oscillators value.
Increasing the weight of the MAs group will thus have a calming effect on the signal.
• Alerts can be created on the indicator using the conditions configured to control the display of markers.
Display
The calculated rating is displayed as columns, but you can change the style in the inputs. The color of the signal can be one of three colors: bull, bear, or neutral. You can choose from a few presets, or check one and edit its color. The color is determined from the rating's value. Between 0.1 and -0.1 it is in the neutral color. Above/below 0.1/-0.1 it will appear in the bull/bear color. The intensity of the bull/bear color is determined by cumulative advances/declines in the rating. It is capped to 5, so there are five intensities for each of the bull/bear colors.
The "Strong Buy", "Buy", "Neutral", "Sell" or "Strong Sell" state of the last calculated value is displayed to the right of the last bar for each of the three groups: All, MAs and Oscillators. The first value always reflects your selection in the "Rating uses" field and is the one used to display the signal. A "Strong Buy" or "Strong Sell" state appears when the signal is above/below the 0.5/-0.5 level. A "Buy" or "Sell" state appears when the signal is above/below the 0.1/-0.1 level. The "Neutral" state appears when the signal is between 0.1 and -0.1 inclusively.
Five levels are always displayed: 0.5 and 0.1 in the bull color, zero in the neutral color, and -0.1 and - 0.5 in the bull color.
The levels that can be used to determine the breaches displaying long/short markers will only be visible when their respective long/short markers are turned on in the "Direction" input. The levels appear as a bright dotted line in bull/bear colors. You can control both levels separately through the "Longs Level" and "Shorts Level" inputs.
If you specify a higher timeframe that is not greater than the chart's timeframe, an error message will appear and the indicator's background will turn red, as it doesn't make sense to use a lower timeframe than the chart's.
Markers
Markers are small triangles that appear at the bottom and top of the indicator's pane. The marker settings define the conditions that will trigger an alert when you configure an alert on the indicator. You can:
• Choose if you want long, short or both long and short markers.
• Determine the signal level and/or the number of cumulative advances/declines in the signal which must be reached for either a long or short marker to appear.
Reminder: the number of advances/declines is also what controls the brightness of the plotted signal.
• Decide if you want to restrict markers to ones that alternate between longs and shorts, if you are displaying both directions.
This helps to minimize the number of markers, e.g., only the first long marker will be displayed, and then no more long markers will appear until a short comes in, then a long, etc.
Alerts
When you create an alert from this indicator, that alert will trigger whenever your marker conditions are confirmed. Before creating your alert, configure the makers so they reflect the conditions you want your alert to trigger on.
The script uses the alert() function, which entails that you select the "Any alert() function call" condition from the "Create Alert" dialog box when creating alerts on the script. The alert messages can be configured in the inputs. You can safely disregard the warning popup that appears when you create alerts from this script. Alerts will not repaint. Markers will appear, and thus alerts will trigger, at the opening of the bar following the confirmation of the marker condition. Markers will never disappear from the bar once they appear.
Repainting
This indicator uses a two-pronged approach to control repainting. The repainting of the displayed signal is controlled through the "Repainting" field in the script's inputs. This only applies when you have "Same as chart" selected in the "Timeframe" field, as higher timeframe data never repaints. Regardless of that setting, markers and thus alerts never repaint.
When using the chart's timeframe, choosing a non-repainting signal makes the signal one bar late, so that it only displays a value once the bar it was calculated has elapsed. When using a higher timeframe, new values are only displayed once the higher timeframe completes.
Because the markers never repaint, their logic adapts to the repainting setting used for the signal. When the signal repaints, markers will only appear at the close of a realtime bar. When the signal does not repaint (or if you use a higher timeframe), alerts will appear at the beginning of the realtime bar, since they are calculated on values that already do not repaint.
█ CALCULATIONS
The indicator calculates the aggregate value of two groups of indicators: moving averages and oscillators.
The "MAs" group is comprised of 15 different components:
• Six Simple Moving Averages of periods 10, 20, 30, 50, 100 and 200
• Six Exponential Moving Averages of the same periods
• A Hull Moving Average of period 9
• A Volume-weighed Moving Average of period 20
• Ichimoku
The "Oscillators" group includes 11 components:
• RSI
• Stochastic
• CCI
• ADX
• Awesome Oscillator
• Momentum
• MACD
• Stochastic RSI
• Wiliams %R
• Bull Bear Power
• Ultimate Oscillator
The state of each group's components is evaluated to a +1/0/-1 value corresponding to its bull/neutral/bear bias. The resulting value for each of the two groups are then averaged to produce the overall value for the indicator, which oscillates between +1 and -1. The complete conditions used in the calculations are documented in the Help Center .
█ NOTES
Accuracy
When comparing values to the other versions of the Rating, make sure you are comparing similar timeframes, as the "Technicals" gauge in the chart's right pane, for example, uses a 1D timeframe by default.
For coders
We use a handy characteristic of array.avg() which, contrary to avg() , does not return na when one of the averaged values is na . It will average only the array elements which are not na . This is useful in the context where the functions used to calculate the bull/neutral/bear bias for each component used in the rating include special checks to return na whenever the dataset does not yet contain enough data to provide reliable values. This way, components gradually kick in the calculations as the script calculates on more and more historical data.
We also use the new `group` and `tooltip` parameters to input() , as well as dynamic color generation of different transparencies from the bull/bear/neutral colors selected by the user.
Our script was written using the PineCoders Coding Conventions for Pine .
The description was formatted using the techniques explained in the How We Write and Format Script Descriptions PineCoders publication.
Bits and pieces were lifted from the PineCoders' MTF Selection Framework .
Look first. Then leap.
TreLThis indicator based on linear regression trend
blue line is trend postive or buy trend. red line trend is sell
there is MTF non repiant to add for it so you can see the trend at differnt TF
upper and lower of chanel are i gray line
very simple and effective way to use linear regression in a diffrent approach
tesla
withot mtf
Ema TRXthis indicator based on EMA with modification of buy and sell power
it has no security MTF so no repaint here.
alerts and signal included
The indicator try to detect the force of buy ad sell and by that make the signal
you can try differnt length or differnt MTF to see which one beter suit your need
Past and Present 1this is modification of my older script
the idea is that when present close is above back close (let say 100 candles before) then the asset is bullish and vice versa
you can control the back track by back option
i use non security MTF to look on lower TF with larger time frame
there is option for signal and alerts
lime =bullish
red bearish
very simple script
here example of 1 day MTF on 1 hour with signals
stock
Trend M ver1this simple tool a helper for trader in order to put your target at the correct places:)
so script based on Trend M (open script in my page)
the script based on non security MTF that allow us to detect the M = mean average of resistance and support by MTF
best setting is either monthly or weekly
when you go on lower chart just put in the min the exact TF that you on. 60 min =60
2 hour 120
5 min =5
etc
when ever the trend is above the mean or M then it bullish =lime color. bellow the M is bearish =red color
the R1 and S level are % from the mean . so it can act for us either target or as stop loss
you can set the R1 or S1 as you like by % ratio . so 0.01 is 1%
0.1 is 10 % etc
all you need to find is the weekly or monthly range of the asset then put the % ratio that you wish up or down
you can use it with trend lines or other method .it just another tool to make you trade smarter
Past and Presentas my old teacher used to say :
"We come from the past to search for the future.. but we stuck in the present looking on what lie ahead"
So this indicator based on non security MTF (HTF) set to daily
there are two type of bands
first is the present ones (color gray and red)
next is past one (based on 100 candle)
as we can that the price of the past bands and present band try to get equilibrium
once the bands depart from each other -present cross up the past then it will be bullish signal and vice versa when price depart from present band it will tend to fall to the level of our past band
since it based on EMA 100 and organised to detect resistance and support
then it easy to see when price collapse or price rise
so this is theory behind this indicator
you can try different length or different TF for better results
same 4 hour chart with week MTF
[NLX-L2] Hurst Exponent Signal Filter- Hurst Exponent Signal Filter -
The Hurst Exponent Signal Filter is meant to be used with an external signal source, this can be any indicator with a signal plot output (-1 Sell / 1 Buy)
It filters out a lot of noisy signals and improves the performance of many indicators.
- Example: How to Use -
1. Add a trend Indicator like Trend Index MTF to your chart
2. Add an indicator with a signal plot like Fishers Stochastic Center of Gravity to your Chart and select the Trend Index MTF with Type L1 in the Settings as Signal Source
3. Add this Hurst Signal Filter to your Chart and select the Fishers Stochastic Center of Gravity with Type L2 in the Settings as Signal Source
4. Add the Backtest Module to your Chart and select the Hurst Signal Filter with Type L2 as Source
- Alerts for Automated Trading -
See my signature below. Contact me for the Alert module.
[NLX-L2] Fisher Stochastic Center of Gravity (v4)- Fisher Stochastic Center of Gravity-
This is Fisher's Stochastic Center of Gravity converted to pine v4 by blackcat. A very powerful entry indicator!
The original was published by DasanC & EmpiricalFX and it's a very interesting take on FSCG.
All the credit for the indicator goes to the authors and inventor of FSCG, this is just a mod to be used with my NLX Modular Trading Framework .
- How to Use -
1. Add a Trend Indicator like Trend Index MTF to your chart
2. Add " Fisher Stochastic Center of Gravity" Indicator to your Chart and select the Trend Index MTF with Type L1 in the Settings as Source
2. Add the Backtest to your Chart and select the FSCG Signal with Type L2 as Source
- Alerts for Automated Trading -
See my signature below for more information. Contact me for the Alert module.
Log trend Very nice Log trend with alerts, signals
this version is MTF version with no repaint
i just took the logic of a super trend and converted it to a log type trend
you will find in menue (MTF - this for control of trend up or down)
HTF (no security type ) for close
try to play with either to find best settings
alerts are activated by alerts menue
Rain On Me PRO 3/3This is the part 3 of Rain On Me PRO. It follow my two other indicators "Rain On Me" and "Rain On Me V2". This version is called "PRO" because it is less "user-friendly" than the two previous versions. But it is more faster, and cleaner than ever!
This indicator is separated into 3 parts. You can find all parts into my profile in the « Scripts » section. Once the 3 parts together, the indicator is complete.
Here are the features for this part:
-MTF Fibonacci on 10 levels with level 0 in the middle and an "info panel" to indicate you the key levels. You can set an alert for each level cross.
-MTF High/Low (Red dots is last low and green dots is last high).
-Bollinger.
-Ichimoku Cloud with baseline (red) and alerts (SenkouA and SenkouB Cross or Tenkan and Kijun Cross).
Everything is fully customizable in settings.
To place an alert, always choose the "Once per bar" option.
Many functions are still to come. So don't hesitate to report bugs, suggestions and follow me to always be kept informed of the next updates to come!
//ALWAYS DELETE INDICATOR AND ALERTS AND RESET THEM AFTER AN UPDATE!
Thank again everyone for your support!
A BIG THANKS TO QUANTNOMAD FOR GIVING ME ITS AUTHORIZATION TO USE, MODIFY AND REPUBLIC ITS "Ultimate Pivot Points Alerts" script indicator:
Good trade everyone! And remember, money management is the most important!
Rain On Me PRO 2/3This is the part 2 of Rain On Me PRO. It follow my two other indicators "Rain On Me" and "Rain On Me V2". This version is called "PRO" because it is less "user-friendly" than the two previous versions. But it is more faster, and cleaner than ever!
This indicator is separated into 3 parts. You can find all parts into my profile in the « Scripts » section. Once the 3 parts together, the indicator is complete.
Here are the features for this part:
-Support/Resistance and Range lines (Red is Resistance, Yellow is Range, Green is Support).
-MTF Trend Line following the trend with red color for bearish trend and green color for bullish trend (Based on volume so it work only where the volume information flux is available).
-MTF Fractals with alerts. (Zigzag based on high and low).
Everything is fully customizable in settings.
To place an alert, always choose the "Once per bar" option.
Many functions are still to come. So don't hesitate to report bugs, suggestions and follow me to always be kept informed of the next updates to come!
//ALWAYS DELETE INDICATOR AND ALERTS AND RESET THEM AFTER AN UPDATE!
Thank again for your support!
Good trade everyone! And remember, money management is the most important!
Ichimoku Kinko Hyo + FractalsIn contrast to my Ichimoku ++ Study this is a pure Ichimoku Konko Hyo Study with Bill Williams Fractals (I couldn't leave out the fractals as these levels are too important for Ichimoku trading).
In this study you can find many visualisation options for the Ichimoku Indicator and the signals the Ichimoku Tradingsystem can provide.
Tenkan-sen and Kijun-sen are provided optionally as mtf levels.
An mtf price cloud relationship is shown in the upper right.
The included signals are:
B1/S1 is a strong filtered signal. The condition for long entry is:
price > Kumo AND Chikou > price AND Chikou > Kumo AND Tenkan > Kijun AND Komo is green
B2/S2 is a less filtered signal. The condition for long entry is:
price > Kumo AND Chikou > price AND Tenkan > Kijun
IB/IS is a confluence signal. The condition for a long/short entry is: more than 50% of the 8 defined conditions must trigger a long signal. Below 50% long, it is a short signal because more than 50% of the entry conditions have triggered a short signal.