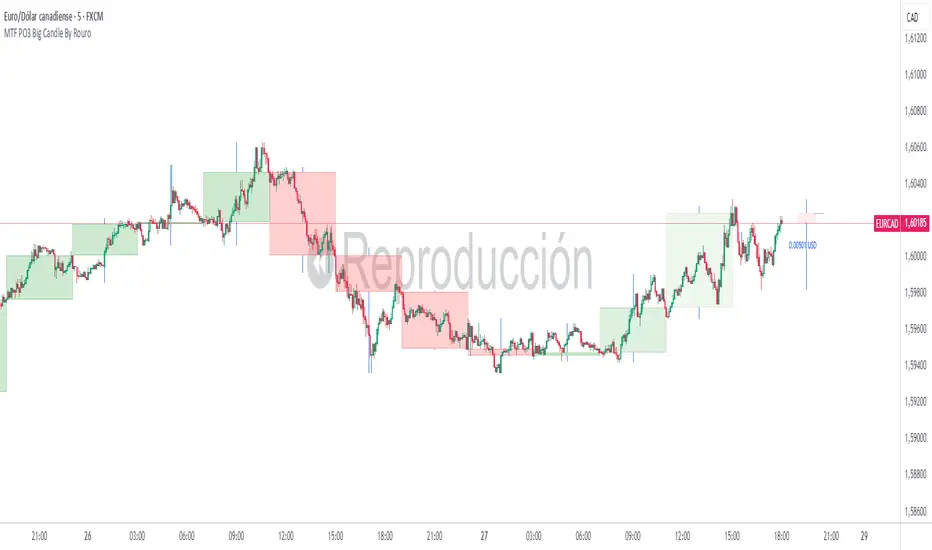
MTF PO3 Big Candle By Rouro📊 MTF PO3 Big Candle By Rouro
This indicator allows you to visualize candles from higher timeframes (HTF) directly on lower timeframe charts.
It draws:
📉 Past candles from the selected HTF.
📈 A projected current candle of a chosen timeframe, extended to the right of the chart.
It's ideal for traders who want to align decisions on lower timeframes with key HTF structures.
⚙️ Inputs & Configuration
🕐 Past Candle Timeframe
Selects the timeframe to visualize historical candles.
(e.g., 4H on a 5-minute chart)
📅 Projected Candle Timeframe
Chooses the timeframe for the current (live) candle that is drawn to the right of the chart.
(e.g., 1D)
➡️ Right Displacement (bars)
Controls how far to the right the projected candle is drawn.
🟩 Bullish Body Color
Defines the color of bullish candle bodies.
🟥 Bearish Body Color
Defines the color of bearish candle bodies.
🔵 Wick Color
Color of the high/low wicks.
🔲 Body Transparency (0–100)
Controls the transparency of the candle body fill.
📌 Show Wicks
Enables or disables drawing of the wicks on all candles.
💡 Notes
If the projected candle is from a very large timeframe (e.g., 1D) and you are on a small timeframe (e.g., 5m), the projection length is limited to avoid overlapping the chart.
All candle shapes update in real time.
The indicator is optimized for performance and includes fail-safes for TradingView's limits.
💬 Support
If you have any questions, feel free to ask in the comments.
If this indicator has been useful or valuable for your trading, please leave a comment saying so — your feedback helps the community and supports the publication process.
✅ Compliant with TradingView’s house rules: No ads, sales, links, or misleading claims.
📌 This is a visual utility tool designed to support multi-timeframe analysis.
Cari dalam skrip untuk "mtf"
MTF Pivot Fib Speed Resistance FansOverview
This Pine Script indicator, titled "MTF Pivot Fib Speed Resistance Fans", is a multi-timeframe tool that automatically plots Fib Speed Resistance Fan lines based on pivot structures derived from higher timeframes. It mirrors the functionality of TradingView’s built-in “Fib Speed Resistance Fan” drawing tool, but in a dynamic, programmatic way. It uses pivot highs and lows to anchor fan projections, drawing forward-facing trend lines that align with well-known Fibonacci ratios and their extensions.
Pivot Detection Logic
The script identifies pivots by comparing the current bar’s high and low against the highest and lowest prices over a user-defined pivot period. This pivot detection occurs on a higher timeframe of your choice, giving a broader and more strategic view of price structure. The script tracks direction changes in the pivot trend and stores only the most recent few pivots to maintain clean and meaningful fan drawings.
Fan Direction Control
The user can select whether to draw fans for "Buys", "Sells", or "Both". The script only draws fan lines when a new directional move is detected based on the pivot structure and the selected bias. For example, in “Buys” mode, a rising pivot followed by another higher low will trigger upward fan projections.
Fib Speed Resistance Levels
Once two pivots are identified, the script draws multiple fan lines from the first pivot outward, at angles defined by a preset list of Fibonacci levels. These fan lines help visualize speed and strength of a price move.
The script also draws a horizontal line from the pivot for additional confluence at the base level (1.0).
Price Level Plotting
In addition to drawing fan lines, the indicator also plots their price levels on the right-hand price scale. This makes it easier for users to visually reference the projected support and resistance levels without needing to trace the lines manually across the chart.
Mapping to TradingView’s "Fib Speed Resistance Fan"
The expanded set of values used in this script is not arbitrary—they closely align with the default and extended levels available in TradingView's built-in "Fib Speed Resistance Fan" tool.
TradingView’s Fib Fan tool offers several levels by default, including traditional Fibonacci ratios like 0.382, 0.5, 0.618, and 1. However, if you right-click the tool and open its settings, you’ll find additional toggles for levels like 1.618, 2.000, 2.618, and even 4.000. These deeper levels are used to project stronger trend continuations beyond the standard retracement zones.
The inclusion of levels such as 0.25, 0.75, and 1.34 reflects configurations that are available when you manually add or customize levels in TradingView’s fan tool. While 1.34 is not a canonical Fibonacci ratio, it is often found in hybrid Gann/Fib methods and is included in some preset templates in TradingView’s drawing tool for advanced users.
By incorporating these levels directly into the Pine Script, the indicator faithfully reproduces the fan structure users would manually draw using TradingView’s graphical Fib Fan tool—but does so programmatically, dynamically, and with multi-timeframe control. This eliminates manual errors, allows for responsive updating, and adds custom visual tracking via the price scale.
These values are standardized within the context of TradingView's Fib Fan tool and not made up. This script automates what the manual drawing tool achieves, with added precision and flexibility.

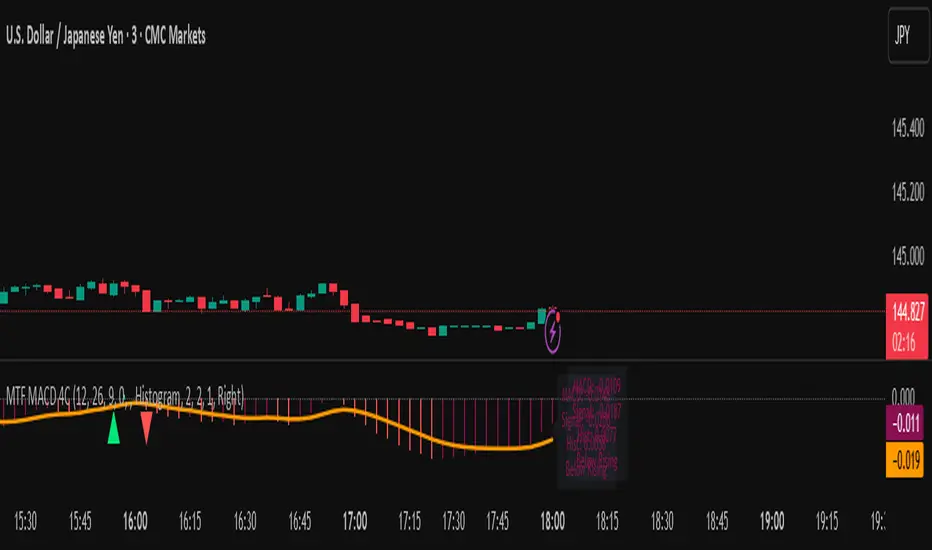
MTF MACD 4-Color Momentum System🎯 Overview
The MTF MACD 4-Color Momentum System is an advanced MACD indicator that provides crystal-clear momentum visualization through an innovative 4-color state system. Unlike traditional MACD indicators that only show positive/negative values, this indicator identifies four distinct market states to help traders make more informed decisions.
📊 Key Features
1. Four-State Color System:
🟢 Lime: Above zero + Rising (Strong Bullish Momentum)
🟢 Dark Green: Above zero + Falling (Weakening Bullish Momentum)
🔴 Red: Below zero + Falling (Strong Bearish Momentum)
🔴 Maroon: Below zero + Rising (Weakening Bearish Momentum)
2. Multi-Timeframe Analysis:
View higher timeframe MACD on lower timeframe charts
Confirm trends across multiple timeframes
Reduce false signals with multi-timeframe confluence
3. Flexible Display Options:
Three visualization styles: Histogram, Columns, or Line
Toggle individual color states on/off
Customizable colors and line widths
4. Advanced Features:
Optional histogram smoothing to reduce noise
Zero-cross alerts with visual markers
Color state change alerts
Real-time value display
Customizable signal line overlay
💡 How to Use
1. Momentum Identification:
Lime bars indicate strong upward momentum - ideal for long entries
Dark green suggests momentum is slowing - consider taking profits
Red bars show strong downward momentum - ideal for short entries
Maroon indicates potential reversal brewing - prepare for direction change
2. Zero Line Crosses:
Blue triangles mark bullish crosses above zero
Pink triangles mark bearish crosses below zero
Use these as confirmation signals with other indicators
3. Multi-Timeframe Confirmation:
Set to higher timeframe (e.g., 4H on 15m chart)
Look for alignment between timeframes before entering trades
Avoid trades against higher timeframe momentum
⚙️ Settings Guide
MACD Parameters:
Fast EMA: 12 (default) - Adjust for more/less sensitivity
Slow EMA: 26 (default) - Standard MACD setting
Signal: 9 (default) - Smoothing period
Display Customization:
Choose between Histogram, Columns, or Line display
Enable/disable specific color states
Adjust visual properties to match your chart theme
Alerts:
Zero cross alerts for trend changes
Color state alerts for momentum shifts
📈 Trading Strategies
1. Momentum Continuation:
Enter longs when MACD turns lime (above zero + rising)
Enter shorts when MACD turns red (below zero + falling)
Exit when color shifts to "weakening" state
2. Reversal Trading:
Watch for maroon in downtrends (potential bottom)
Watch for dark green in uptrends (potential top)
Confirm with price action and support/resistance
3. Multi-Timeframe Confluence:
Use daily MACD on 1H chart for trend direction
Enter on lower timeframe signals in direction of higher timeframe
Avoid counter-trend trades when higher timeframe shows strong momentum
🎓 Pro Tips
Combine with volume indicators for confirmation
Use with support/resistance levels for better entries
Enable smoothing in choppy markets to reduce false signals
Pay attention to divergences between price and MACD
⚠️ Risk Disclaimer
This indicator is for educational purposes only. Always use proper risk management and combine with other analysis methods. Past performance does not guarantee future results.
MTF Stochastic RSIOverview: MTF Stochastic RSI
is a momentum-tracking tool that plots the Stochastic RSI oscillator for up to four user-
defined timeframes on a single panel. It provides a compact yet powerful view of how
momentum is aligning or diverging across different timeframes, making it suitable for both
scalpers and swing traders looking for multi-timeframe confirmation.
What it does:
Calculates Stochastic RSI values using the RSI of price as the base input and applies
smoothing for stability.
Aggregates and displays the values for four customizable TF (e.g., 5min, 15min, 1h, 4h).
Highlights potential support and resistance zones in the oscillator space using adaptive zone
logic.
Optionally draws dynamic support/resistance zone lines in the oscillator space based on
historical turning points.
How it works:
Each timeframe uses the same RSI and Stoch calculation settings but runs independently via
the request.security() function.
Stochastic RSI is calculated by first applying the RSI to price, then applying a stochastic
formula on the RSI values, and finally smoothing the %K output.
Adaptive overbought and oversold thresholds adjust based on ATR-based volatility and simple
trend filtering (e.g., price vs EMA).
When a crossover above the oversold zone or a crossunder below the overbought zone
occurs, the script checks for proximity to previously stored zones and either adjusts or
records a new one.
These zones are stored and re-plotted as dotted support/resistance levels within the
oscillator space.
What it’s based on:
The indicator builds upon traditional Stochastic RSI by applying it to multiple timeframes in
parallel.
Zone detection logic is inspired by the idea of oscillator-based support/resistance levels.
Volatility-adjusted thresholds are based on ATR (Average True Range) to make the
overbought/oversold zones responsive to market conditions.
How to use it:
Look for alignment across timeframes (e.g., all four curves pushing into the overbought
region suggests strong trend continuation).
Reversal risk increases when one or more higher timeframes are diverging or showing signs of
cooling while lower timeframes are still extended.
Use the zone lines as soft support/resistance references within the oscillator—retests of
these zones can indicate strong reversal opportunities or continuation confirmation.
This script is provided for educational and informational purposes only. It does not constitute financial advice, trading recommendations, or an offer to buy or sell any financial instrument. Always perform your own due diligence, use proper risk management, and consult a qualified financial professional before making any trading decisions. Past performance does not guarantee future results. Use this tool at your own discretion and risk.

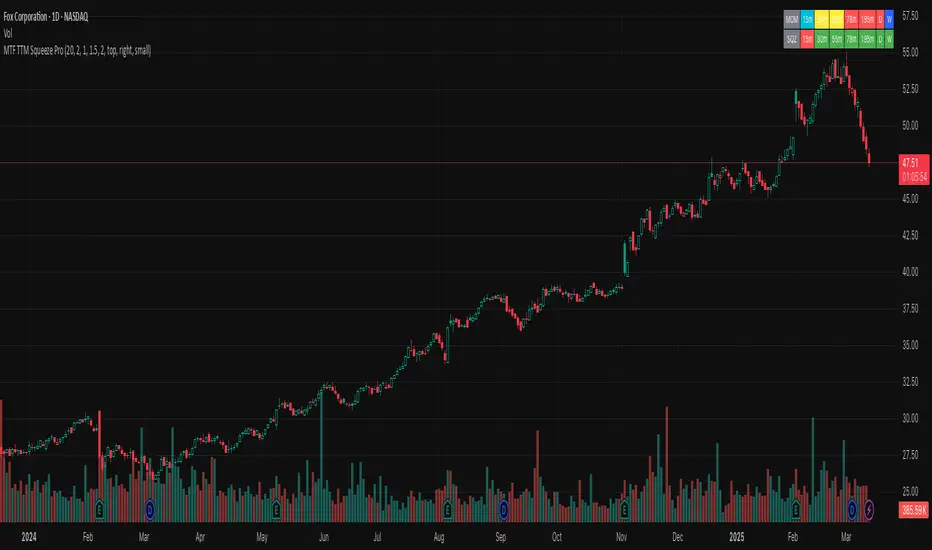
MTF TTM Squeeze ProOverview
The MTF TTM Squeeze Pro indicator helps traders identify market compression (squeeze) conditions and analyze momentum across multiple timeframes. It is based on the TTM Squeeze concept, which uses Bollinger Bands and Keltner Channels to detect price consolidation periods that often precede strong breakouts.
This script enhances the standard TTM Squeeze by providing a multi-timeframe view, allowing traders to assess market conditions across intraday, daily, and weekly charts simultaneously.
⸻
How It Works
1. Squeeze Detection using Bollinger Bands & Keltner Channels
• High Compression Squeeze (Orange): Strongest squeeze, indicating extreme consolidation.
• Medium Compression Squeeze (Red): Moderate squeeze, potential breakout setup.
• Low Compression Squeeze (Black): Mild squeeze, possible momentum shift.
• No Squeeze (Green): Market is trending, no consolidation detected.
2. Momentum Analysis
The script features a custom linear regression momentum oscillator to gauge market direction:
• Positive rising momentum (Aqua) suggests bullish acceleration.
• Positive falling momentum (Blue) indicates slowing bullish momentum.
• Negative rising momentum (Red) signals bearish weakening.
• Negative falling momentum (Yellow) represents strengthening bearish momentum.
3. Multi-Timeframe Display
The indicator provides a table panel showing squeeze conditions and momentum colors for:
✅ 15m, 30m, 55m, 78m, 195m, Daily (D), and Weekly (W) timeframes.
This makes it easier to spot confluences across different periods, helping traders align their entries with larger trends.
⸻
How to Use
✔️ Look for a high compression squeeze (orange dots) as potential breakout zones.
✔️ Check if momentum colors are aligned across multiple timeframes to confirm direction.
✔️ Trade in the direction of momentum once the squeeze is released.
Best Used For:
📈 Swing Trading – Identify multi-day setups using the D/W squeeze signals.
📉 Intraday Trading – Use 15m-78m signals for faster entries and exits.
⸻
Credits & Open-Source Compliance
This script is inspired by the original TTM Squeeze Pro and based on open-source contributions from the TradingView community. Significant modifications include:
✔️ Improved multi-timeframe data request for momentum & squeeze.
✔️ Enhanced visual display with a compact and informative table panel.
✔️ Added detailed documentation for better usability.
📌 Original Source: TradingView Script by Beardy_Fred
⸻
Final Notes
✅ Designed for stocks, forex, and crypto.
✅ Fully customizable squeeze & momentum settings.
Enjoy trading, and may the squeeze be with you! 🚀
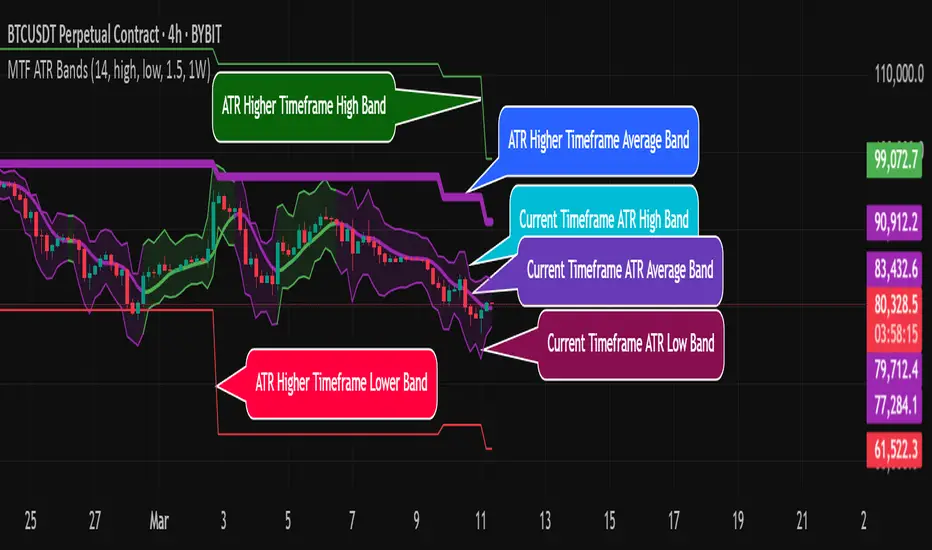
MTF ATR BandsA simple but effective MTF ATR bands indicator.
The script calculate and display ATR bands low and high of the current timeframe using high, low inputs and an RMA moving average, adding to it ATR of the period multiplied with the user multiplier, default is set to 1.5.
Than is calculated a smoothed average of the range and the color of it based on its slope, same color is used to fill the atr bands.
Than the higher timeframe bands are calculated and displayed on the chart.
How can be used ?
The higher timeframe average and bands can give you long term direction of the trend and the current timeframes moving average and filling short term trend, for example using the 15 min chart with a 4h HTF bands, or an 1h with a daily, or a daily with an weekly or weekly with bi-monthly atr bands.
Also can be used as a stop loss indicator.
Hope you will like it, any question send me a PM.
MTF Fractals [RunRox]🔽 MTF Fractals is a powerful indicator designed to visualize fractals from multiple timeframes directly on your chart, highlight liquidity sweeps at these fractal levels, and provide several additional features we’ll cover in detail below.
We created this indicator because we couldn’t find a suitable tool that met our specific needs on TradingView. Therefore, we decided to develop a valuable indicator for the entire TradingView community, combining simplicity and versatility.
⁉️ WHAT IS A FRACTALS?
In trading, a fractal is a technical analysis pattern composed of five consecutive candles, typically highlighting local market turning points. Specifically, a fractal high is formed when a candle’s high is higher than the highs of the two candles on either side, whereas a fractal low occurs when a candle’s low is lower than the lows of the two adjacent candles on both sides.
Traders use fractals as reference points for identifying significant support and resistance levels, potential reversal areas, and liquidity zones within price action analysis. Below is a screenshot illustrating clearly formed fractals on the chart.
📙 FRACTAL FORMATION
Here’s how fractals form depending on your chosen setting (3, 5, 7, or 9):
▶️ 3-bar fractal – forms when the central candle is higher (for highs) or lower (for lows) than one candle on each side.
▶️ 5-bar fractal – forms when the central candle is higher or lower than two candles on both sides.
▶️ 7-bar fractal – forms when the central candle is higher or lower compared to the three candles on each side.
▶️ 9-bar fractal – forms similarly but requires four candles on each side, making the fractal significantly more reliable and robust.
A higher number of bars ensures stronger fractal levels, highlighting more significant potential reversal points on the chart.
Now that we’ve covered the theory behind fractal formation, let’s explore the indicator’s functionality in more detail.
Below, I’ll explain each feature clearly and illustrate how you can effectively utilize this indicator in your trading.
🕐 MULTI-TIMEFRAME FRACTALS
We realized that displaying fractals only from the current timeframe isn’t always convenient, so we’ve introduced Multi-Timeframe Fractals into this indicator.
Now you can easily display fractals from higher timeframes directly on your current chart, providing you with broader market context and clearer trading signals.
Fractals from Current Timeframe – Fractals identified directly on the chart’s current timeframe.
Fractals from Higher Timeframes – Fractals sourced from higher timeframes and displayed clearly on your current chart for enhanced market perspective.
📈 FRACTAL LINES
Since fractals represent areas of high liquidity, we’ve added an option to extend fractal levels horizontally as Fractal Lines across your chart.
This feature allows you to clearly visualize critical liquidity areas from higher timeframes, directly on your current timeframe chart, as demonstrated in the screenshot below.
With this approach, you can clearly visualize significant fractal levels from higher timeframes directly on your current chart - for example, projecting fractals from the 1-hour (1H) timeframe onto a 3-minute (3m) chart. ✅ This helps you easily identify critical liquidity areas and potential reversal zones without the need to switch between multiple timeframes.
💰 LIQUDITY SWEEP (LIQUDITY GRAB)
To enhance your trading experience, we’ve introduced a feature that clearly identifies liquidity sweeps of fractal levels.
A Liquidity Sweep occurs when a candle closes beyond a fractal line, leaving a wick that pierces through it, signaling that liquidity has been collected at this level.
Below, you’ll find two examples illustrating this functionality:
▶️ Fractal lines from the current timeframe
▶️ Fractal lines projected from higher timeframes
The first example illustrates liquidity being swept from fractals on the current timeframe .
Here, the candle clearly closes beyond the fractal line, leaving a wick through it. This indicates a liquidity sweep at the fractal level, visually highlighting a potential reversal or continuation opportunity directly on your chart.
In the second example, fractals from the higher timeframe are projected onto your current chart.
When a candle on your current timeframe closes beyond an HTF fractal line - leaving a wick through this level - the indicator highlights it clearly. This signals to traders a potential reversal zone, indicating that liquidity has been swept, and price may reverse or significantly react from this area.
You can also enable the display of additional labels on the chart. These labels clearly mark liquidity sweeps at fractal levels, making it easier to visually identify potential reversal points directly on your chart.
⚙️ SETTINGS
Below are the indicator settings with detailed explanations for each parameter.
🔷 Bars in Fractal – Number of candles to the right and left required to form a fractal.
🔷 Fractal Timeframe – Select the timeframe from which you want to display fractals on the current chart.
🔷 Max Age, bars – Number of bars during which the fractal will remain active.
🔷 Show Fractal Line – Display or hide fractal lines.
🔷 Line Style – Choose the style of the line displayed on the chart.
🔷 Line Width – Thickness of the fractal line.
🔷 High Fractal – Style and color of bearish fractals.
🔷 Low Fractal – Style and color of bullish fractals.
🔷 Fractal Label Size – Select the size of fractal labels.
🔷 Show Sweep Labels – Option to display labels when a liquidity sweep occurs.
🔷 Label Color – Color and transparency of the area marked on the chart during a sweep.
🔷 Shade Sweep Area – Show or hide the sweep area shading.
🔷 Area Color – Color and transparency settings for the sweep area.
🔶 We’d love to hear your feedback and any suggestions for additional features you’d like to see in this indicator. We’ll be happy to consider your ideas and continue improving the indicator!

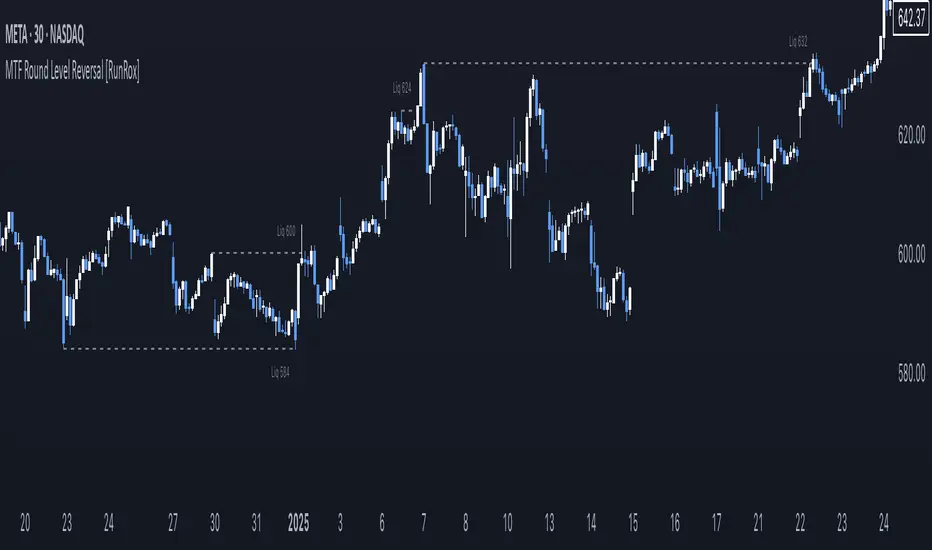
MTF Round Level Reversal [RunRox]🧲 MTF Round Level Reversal is an indicator designed to highlight price levels on the chart where the market encountered significant resistance or support at round numbers, failing to break through large clusters of orders.
In many cases, price revisits these round-number levels to absorb the remaining liquidity, offering potential reversal or continuation trade opportunities.
✏️ EXAMPLE
Here’s an example demonstrating how this indicator works and how its logic is structured:
As shown in the screenshot above, price encountered resistance at round-number levels, clearly reacting off these areas.
Afterward, the market pulled back, presenting opportunities to enter trades targeting these previously established open levels.
This logic is based on the observation that price often seeks to revisit these open round-number levels due to the residual liquidity resting there.
While effective across various markets, this indicator performs particularly well with stocks or assets priced at higher values.
For a level to appear on the chart, price must first encounter a round-number value and clearly reverse from it, leaving a visible reaction on the chart. After this occurs, the indicator will mark this level as fully formed and display it as an active reversal area.
⚙️ SETTINGS
🔷 Timeframe – Choose any timeframe from which you’d like the indicator to source level data.
🔷 Period – Defines the number of candles required on both sides (left and right) to confirm and fully form a level.
🔷 Rounding Level – Adjusts price rounding precision when detecting levels (from 0.0001 up to 5000).
🔷 Color – Customize the color and transparency of displayed levels.
🔷 Line Style – Select the desired line style for level visualization.
🔷 Label Size – Set the font size for the level labels displayed on the chart.
🔷 Move Label to the Right – Move level labels to the right side of the screen for better visibility.
🔷 Label Offset – Specifies how many bars labels should be offset from the chart’s right edge.
🔷 Delete Filled Level – Automatically removes levels from the chart after they’ve been revisited or filled.
🔷 Calculation Bars – Determines the number of recent bars considered when calculating and identifying levels.
🔶 There are numerous ways to apply this indicator in your trading strategy. You can look for trades targeting these round-number levels or identify reversal setups forming at these high-liquidity zones. The key insight is understanding that these levels represent significant liquidity areas, which price frequently revisits and retests.
We greatly appreciate your feedback and suggestions to further improve and enhance this indicator!
MTF EHMA & HMA Insights [FibonacciFlux]MTF EHMA & HMA Insights
Overview
The Multi-Timeframe EHMA, HMA, and Midline with Fill script is a powerful technical analysis tool designed for traders seeking to enhance their market insights and decision-making processes. By integrating two advanced moving averages—Exponential Hull Moving Average (EHMA) and Hull Moving Average (HMA)—along with a dynamic midline, this indicator provides a comprehensive view of market trends across multiple timeframes.
Key Features
1. Dual Moving Averages
- Exponential Hull Moving Average (EHMA) :
- Offers a rapid response to price changes, making it particularly useful for identifying short-term trends.
- Utilizes a unique calculation method that reduces lag, allowing traders to react quickly to market movements.
- Hull Moving Average (HMA) :
- Known for its smoothness and ability to filter out noise, the HMA presents a clear picture of the underlying trend.
- The HMA is specifically designed to achieve a balance between responsiveness and smoothness, enabling traders to make informed decisions.
2. Midline Calculation
- Dynamic Midline (m) :
- The midline is calculated as the average of EHMA and HMA, providing a neutral reference point for evaluating price movements.
- It visually represents market sentiment; a rising midline suggests bullish conditions, while a declining midline indicates bearish trends.
3. Visual Components
- Fill Areas :
- Color-coded fills between the EHMA and HMA enhance visual clarity by indicating the relative position of these moving averages.
- The fill color dynamically changes based on the relationship between the two averages (green for EHMA below HMA and red for EHMA above HMA), allowing traders to quickly assess market conditions.
4. Signal Generation and Alerts
- Buy/Sell Signals :
- The indicator generates buy signals when the midline crosses above its previous value, indicating a potential upward trend.
- Conversely, sell signals are triggered when the midline crosses below its previous value, suggesting a possible downward movement.
- Alert Conditions :
- Built-in alerts notify traders in real-time when significant changes occur, allowing them to act swiftly on potential trading opportunities.
- Customizable alert messages ensure traders receive relevant information tailored to their strategies.
Technical Details
Input Parameters
- Timeframe Settings :
- Traders can customize the timeframes for both EHMA and HMA, enabling them to adapt the indicator to different trading styles and market conditions.
- Length Settings :
- Adjustable lengths for both moving averages impact their sensitivity, allowing traders to optimize their performance based on volatility and market dynamics.
Plotting and Visualization
- Plotting :
- The script plots the EHMA, HMA, and midline directly on the chart for easy visualization.
- Signal labels (BUY and SELL) are displayed prominently, helping traders to identify potential entry and exit points without ambiguity.
Benefits
1. Clarity and Insight
- The combination of EHMA, HMA, and midline provides a clear and concise visual representation of market trends, aiding traders in making informed decisions.
2. Flexibility
- Customizable parameters allow traders to tailor the indicator to their specific needs, making it suitable for various market conditions and trading styles.
3. Efficiency
- Real-time alerts and visual signals minimize response times, enabling traders to capitalize on opportunities as they arise.
4. Enhanced Trading Conditions
- When utilizing the Fibonacci number 144 on a daily chart, the indicator facilitates optimal trading conditions:
- "The entry was made before the bubble began, using 144 as the Fibonacci variable."
- "The exit occurred right before the bubble burst, or alternatively, a short position was initiated."
- "When the next bubble started, a long entry was made again."
- "Despite some lag, the position was exited and a long entry was made."
- "The exit or short entry took place at the second double top peak."
- "A short position was already established before the double top formation occurred."
- On a 4-hour chart, traders can effectively set stop losses at HMA levels, achieving a risk-reward ratio between 4 and 8.
- Additionally, analyzing the 15-minute chart with a multi-timeframe approach allows for more precise entry points.
Conclusion
The Multi-Timeframe EHMA, HMA, and Midline with Fill script is a robust tool for traders looking to enhance their technical analysis capabilities. By combining multiple moving averages with a dynamic midline and alert system, this indicator offers a comprehensive approach to understanding market trends. Its flexibility, clarity, and efficiency make it an invaluable asset for both novice and experienced traders alike.
Important Note
As with any trading tool, it is crucial to conduct thorough analysis and risk management when using this indicator. Past performance does not guarantee future results, and traders should always be prepared for potential market fluctuations.

MTF RSI+CMO PROThis RSI+CMO script combines the Relative Strength Index (RSI) and Chande Momentum Oscillator (CMO), providing a powerful tool to help traders analyze price momentum and spot potential turning points in the market. Unlike using RSI alone, the CMO (especially with a 14-period length) moves faster and accentuates price pops and dips in the histogram, making price shifts more apparent.
Indicator Features:
➡️RSI and CMO Combined: This indicator allows traders to track both RSI and CMO values simultaneously, highlighting differences in their movement. RSI and CMO values are both plotted on the histogram, while CMO values are also drawn as a line moving through the histogram, giving a visual representation of their relationship. The often faster-moving CMO accentuates short-term price movements, helping traders spot subtle shifts in momentum that the RSI might smooth out.
➡️Multi-Time Frame Table: A real-time, multi-time frame table displays RSI and CMO values across various timeframes. This gives traders an overview of momentum across different intervals, making it easier to spot trends and divergences across short and long-term time frames.
➡️Momentum Chart Label: A chart label compares the current RSI and CMO values with values from 1 and 2 bars back, providing an additional metric to gauge momentum. This feature allows traders to easily see if momentum is increasing or decreasing in real-time.
➡️RSI/CMO Bullish and Bearish Signals: Colored arrow plot shapes (above the histogram) indicate when RSI and CMO values are signaling bullish or bearish conditions. For example, green arrows appear when RSI is above 65, while purple arrows show when RSI is below 30 and CMO is below -40, indicating strong bearish momentum.
➡️Divergences in Histogram: The histogram can make it easier for traders to spot divergences between price and momentum. For instance, if the price is making new highs but the RSI or CMO is not, a bearish divergence may be forming. Similarly, bullish divergences can be spotted when prices are making lower lows while RSI or CMO is rising.
➡️Alert System: Alerts are built into the indicator and will trigger when specific conditions are met, allowing traders to stay informed of potential entry or exit points based on RSI and CMO levels without constantly monitoring the chart. These are set manually. Look for the 3 dots in the indicator name.
How Traders Can Use the Indicator:
💥Identifying Momentum Shifts: The RSI+CMO combination is ideal for spotting momentum shifts in the market. Traders can monitor the histogram and the CMO line to determine if the market is gaining or losing strength.
💥Confirming Trade Entries/Exits: Use the real-time RSI and CMO values across multiple time frames to confirm trades. For instance, if the 1-hour RSI is above 70 but the 1-minute RSI is turning down, it could indicate short-term overbought conditions, signaling a potential exit or reversal.
💥Spotting Divergences: Divergences are critical for predicting potential reversals. The histogram can be used to spot divergences when RSI and CMO values deviate from price action, offering an early signal of market exhaustion.
💥Tracking Multi-Time Frame Trends: The multi-time frame table provides insight into the market’s overall trend across several timeframes, helping traders ensure their decisions align with both short and long-term trends.
RSI vs. CMO: Why Use Both?
While both RSI and CMO measure momentum, the CMO often moves faster with a value of 14 for example, reacting to price changes more quickly. This makes it particularly effective for detecting sharp price movements, while RSI helps smooth out price action. By using both, traders get a clearer picture of the market's momentum, particularly during volatile periods.
Confluence and Price Fluidity:
One of the powerful ways to enhance the effectiveness of this indicator is by using it in conjunction with other technical analysis tools to create confluence. Confluence occurs when multiple indicators or price action signals align, providing stronger confirmation for a trade decision. For example:
🎯Support and Resistance Levels: Traders can use RSI+CMO in combination with key support and resistance zones. If the price is nearing a support level and RSI+CMO values start to signal a bullish reversal, this alignment strengthens the case for entering a long position.
🎯Moving Averages: When the RSI+CMO signals a potential trend reversal and this is confirmed by a crossover in moving averages (such as a 50-day and 200-day moving average), traders gain additional confidence in the trade direction.
🎯Momentum Indicators: Traders can also look for momentum indicators like the MACD to confirm the strength of a trend or potential reversal. For instance, if the RSI+CMO values start to decrease rapidly while both the RSI+CMO also shows overbought conditions, this could provide stronger confirmation to exit a long trade or enter a short position.
🎯Candlestick Patterns: Price fluidity can be monitored using candlestick formations. For example, a bearish engulfing pattern with decreasing RSI+CMo values offers confluence, adding confidence to the signal to close or short the trade.
By combining the MTF RSI+CMO PRO with other tools, traders ensure that they are not relying on a single indicator. This layered approach can reduce the likelihood of false signals and improve overall trading accuracy.

MTF HalfTrendIntroduction
A half-trend indicator is a technical analysis tool that uses moving averages and price data to find potential trend reversal and entry points in the form of graphical arrows showing market turning points.
The salient features of this indicator are:
- It uses the phenomenon of moving averages.
- It is a momentum indicator.
- It can indicate a trend change.
- It is capable of detecting a bullish or bearish trend reversal.
- It can signal to sell/buy.
- It is a real-time indicator.
Multi-Timeframe Application
A standout feature is its flexibility across timeframes. Traders have the liberty to choose any timeframe on the chart, enhancing the tool's versatility and making it suitable for both short-term and long-term analyses.
Principle of the Half Trend indicator
This indicator is based on the moving averages. The moving average is the average of the fluctuation or change in the price of an asset. These averages are taken for a time interval.
So, a half-trend indicator takes the moving averages phenomenon as its principle for working. The most commonly used moving averages in a half trend indicator are:
- Relative strength index (RSI)
- EMA (estimated moving average)
Components of a Half Trend indicator
There are two main components of a half trend indicator:
- Half trend line
- Arrows
- ATR lines
Half trend line
Half trend line represents this indicator on a candlestick chart. This line shows the trend of a chart in real-time. A half-trend line is based on the moving averages.
There are two further components of a half-trend line:
- Redline
- Blue line
A red line represents a bearish trend. When the half-trend line turns red, a trend is facing a dip. It is time for the bears to take control of the market. A bearish control of the market represents the domination of sellers in the market.
On the other hand, the blue line represents the bullish nature of the market. It tells a trader that the bullish sentiment of the market is prevailing. A bullish market means the number of buyers is significantly greater than the number of sellers.
Moreover, a trader can change these colors to his choice by customization.
Arrows
There are two types of arrows in this indicator which help a trader with the entry and exit points. These arrows are,
- Blue arrow
- Red arrow
A blue arrow signals a buying trade; on the other hand, a red arrow tells a trader about the selling of the assets. These arrows work with the moving average line to formulate a trading strategy.
The color of these arrows is changed if a trader desires so.
ATR lines
The ATR blue and red lines represent the Average True Range of the Half trend line. They may be used as stop loss or take profit levels.
Pros and Cons
Pros
- It is a very easy to eyes indicator.
- This is a very useful friendly indicator.
- It provides sufficient information to beginner traders.
- It provides sufficient information for entry points in a trade.
- A half-trend indicator provides a good exit strategy for a trader.
- It provides information about market reversals.
- It helps a trader to find a bullish and bearish sentiment in the market.
Cons
- It is a real-time indicator. So, it can lag.
- The lagging of this indicator can lead to miss opportunities.
- The most advanced and professional traders may not rely on this indicator for crucial trading decisions.
- The lagging of this indicator can predict false reversals of the market.
- It can create false signals.
- It requires the confluence of the other technical tools for a better success ratio.
Settings for Half Trend indicator
The default settings for half trend indicator are:
Amplitude = 2
Channel deviation = 2
Different markets or financial instruments may require different settings for optimal execution.
Amplitude: The degree that the Half trend line takes the internal variables into consideration. The higher the number, the fewer trades. The default value is 2.
Channel deviation: The ATR value calculation from the Half trend line. The default value is 2.
Trading strategy
It is an effective indicator in terms of strategy formation for a trading setup. The new and beginner trades can take benefit from this indicator for the formulation of a good trading setup. This indicator also helps seasoned and professional traders formulate a good trading setup with other technical tools.
The trading strategy involving a half-trend indicator is divided into three parts:
- Entry and exit
- Risk management
- Take profit
Entry and exit
It is an effective indicator that provides sufficient information about the entry and exit points in a trading setup. The profit of a trader is directly proportional to the appropriate entry and exit points. So, it is a crucial step in any trading setup.
The blue and red arrows provide information about the entry and exit points in a trading setup. Furthermore, the entry and exit for the bullish and bearish setups are as follows.
Entry and exit for a bullish setup
If a blue arrow appears under the half-trend line, it means the bullish sentiment of the market is getting stronger in the future. So, it is a signal for entry in a bullish setup.
As the red arrow appears on the chart, it is a signal to exit your trade. The red arrow represents a reversal in the market, so it is a good opportunity to close your trade in a bullish setup.
Entry and exit for a bearish setup
Suppose a red arrow appears above the red moving average line. It is a good opportunity to enter a trade in a bearish setup. The red line represents that sooner the sellers are going to take control and the value of the asset is about to face a dip. So it is the best time to make your move.
As the opposite arrow appears in the chart, it is time to exit from a bearish trade setup.
Re-entering a position
Bullish setup
- The half-trend line is blue.
- At least one candle closes below the blue half-trend line.
- Enter on the candle that closes above the blue half-trend line.
Bearish setup
- The half-trend line is red.
- At least one candle closes above the red half-trend line.
- Enter on the candle that closes below the red half-trend line.
Risk management
Risk management is an integral part of a trading setup. It is an important step to protect your potential profits and losses.
When trading in a bullish market, place the stop loss at the prior swing low. It will help you to cut your losses in case the prices move to the lower end.
In the case of a bearish market, place your stop loss above the prior swing high.
A trader may trail the stop loss using the ATR lines.
The new trader often makes mistakes in the placement of the stop loss. If you don’t place the stop loss at an appropriate point. It can drain your bank account and ruin your trading experience. Is is recommended not to risk more than 2% of your trading account, per trade.
Take profit
The blue ATR line may be used as one take profit level on a bullish setup followed by the previous swing high. The signal reversal would indicate the final take profit and closing of any position.
The red ATR line may be used as one take profit level on a bearish setup followed by the previous swing low. The signal reversal would indicate the final take profit and closing of any position.
Conclusion
A half trend indicator is a decent indicator that can transform your trading experience. It is a dual indicator that is based on the moving averages as well as helps you to form a trading strategy. If you are a new trader, this indicator can help you to learn and flourish in the trading universe. If you are a seasoned trader, I recommend you use this indicator with other technical analysis tools to enhance your success ratio.
All credits go to:
- @everget the original creator of this indicator (I just added the MTF capability).
- Ali Muhammad original author of much of the description used.

MTF TREND-PANEL-(AS)
0). INTRODUCTION: "MTF TREND-PANEL-(AS)" is a technical tool for traders who often perform multi-timeframe analysis.
This simple tool is meant for traders who wish to monitor and keep track of trend directions simultaneously on various timeframes, ranging from 1MIN to 3MONTHS (or other - 'DIFF')
script enhances decision-making efficiency and provides a clearer picture of market condition by integrating multiple timeframe analysis into a single panel.
1). WARNING!:
-script doesn't make any calculations on its own really but is more of a tool for traders to remember what is happening on other time frames
- use tooltips to navigate settings easier
2). MAIN OPTIONS:
- Keeps track of up to 7 timeframes. (NUMBER of TimeFrames setting, from 1-7)
- Customizable Display: Choose to display nothing, upward/downward arrows, or a range indication for each timeframe.
- timeframe options: '1-MIN','5-MIN','15-MIN','30-MIN','1H','4H','1D','1W','1M','3M','DIFF'
- Color Coding: Define your preferred colors for each timeframe
- set position of the table and size of text (Position/text)
- Personal Touch: Add your own trading maxim or motto for inspiration to show up when SHOW TEXT is turned on
3. )OPTIONS:
-NUMBER of TimeFrames setting: from 1-7 - how many rows to show
-SHOW TABLE: Toggle to display or hide the trend table panel.
-SHOW TEXT: Show or hide your personalized trading maxim.
-SHOW TREND: Enable to display trend direction arrows.
-SHOW_CLRS: Turn on to activate color coding for each timeframe.
-position/text size for table
-settings for each timeframe:color,time,trend
-place to type ur own text
5). How to Use the Script:
-After adding the script to your chart, use the 'NUMBER of TimeFrames' setting to select how many timeframes you want to track (1 to 7).
-Customize the appearance of each timeframe row using the color and arrow options.
-For trend analysis, the script offers arrows to indicate upward, downward, or ranging markets.
-decide what trend dominates particular TF (using other tools - script does not calculate trend on its own )
- mark trends on panel to keep track of all TF
-Enable or disable various features like the table panel, trader maxim, and color coding using the ON/OFF options.
6). just in case:
- ask me anything about the code
-don't be shy to report any bugs or offer improvements of any kind.
- originally created for @ict_whiz and made public at his request

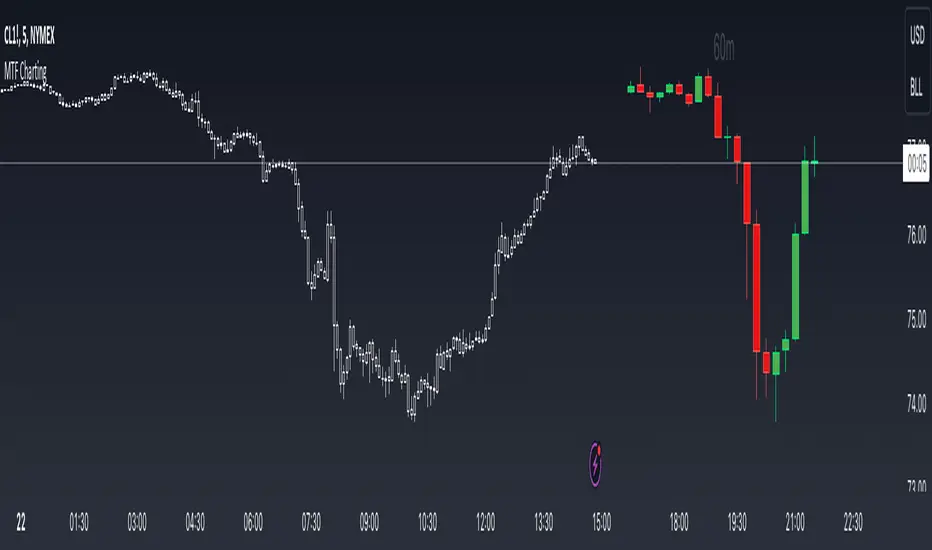
MTF ChartingKey Features
Visual Settings: The script allows customization of the visual aspects of the candlesticks. Traders can select colors for the bodies, borders, and wicks of bullish (rising) and bearish (falling) candles. This customization enhances readability and personal preference alignment.
Timeframe Settings: Traders can choose up to five different timeframes (labeled as HTF 1 to HTF 5) to display on the main chart. For each selected timeframe, traders can specify the number of candlesticks (bars) to display.
Candlestick Representation: The script redraws the candlesticks from the selected timeframes onto the main chart. This redrawing includes the high, low, opening, and closing prices of the candlesticks for each timeframe, providing a multi-dimensional view of market trends.
Labeling: The script includes an option to label each set of candlesticks with their respective timeframe for easy identification.
Practical Usage for Traders
Market Analysis: By displaying candlesticks from different timeframes, traders can analyze the market more comprehensively. For instance, while the main chart might show a short-term trend, the MTF charting can reveal a different longer-term trend, aiding in more informed decision-making.
Trend Confirmation: Viewing multiple timeframes simultaneously helps in confirming trends. If multiple timeframes show a similar trend, it might indicate a stronger, more reliable trend.
Identifying Reversals: The script can be useful in spotting potential trend reversals. For example, if the lower timeframe shows a bearish trend while the higher timeframe remains bullish, it might signal a potential reversal.
Customization for Strategy Alignment: Traders can customize the timeframes and the number of bars to align with their specific trading strategies, whether they are short-term day traders or long-term position traders.
Technical Aspects
The script uses arrays to store and manipulate candlestick data for each timeframe. This approach ensures efficient handling of data and updates.
Examples
- Display up to 5 timeframes on your main price chart. You are able to get a zoomed out view of the market without taking up too much screen real estate.
- Show a lower timeframe on your primary chart. In this instance maybe you primarily look at the 5 minute chart, but like to refine your entries on the 1 minute. Here you can do it with one chart.
- Look at how the daily candle is forming relative to the timeframe that you are currently on. You can more easily spot where price closed and opened on certain days.
MTF Moving AveragesThe MTF Moving Averages indicator allows users to plot multiple moving averages on different timeframes within the same chart on TradingView. This indicator supports four different timeframes: daily, weekly, monthly, and intraday.
For each timeframe, users can choose up to four moving averages to plot. They can also select the type of moving average (SMA, EMA, or WMA), the source (e.g., close price), and the length of each moving average. Additionally, users have the option to enable a "Trend Suite" for the second moving average on the daily timeframe. The Trend Suite adds 2 moving averages with source low and high.
In the intraday timeframe, the second moving average is calculated and plotted based on the daily timeframe.
The indicator provides customization options for colors, allowing users to define the colors for each moving average line.
The settings in the indicator are designed in a clear and organized manner.
Have fun

MTF Breakout/RetestIntroducing the MTF (Multi Timeframe) Breakout and Retest Indicator:
This indicator is designed to enhance your trading strategy by providing a clear view of support and resistance levels across multiple timeframes. What this simply means is that you can input your levels, and be on a lower timeframe such as the 1 minute timeframe, and are able to see when your support or resistance level has a breakout
📈 Short Trade Breakout Condition:
- Definition: A short breakout occurs when a candle closes below your specified support level on any chosen timeframe.
- Confirmation: It confirms as a valid short signal when a second candle closes below the support level without retesting.
- Visual Clarity: The indicator highlights the timeframe in which this breakout has occurred.
(Long conditions are same but reversed, and will be displayed in color green)
📊 Multi-Timeframe Insights:
- Scope: You can analyze support and resistance levels across various timeframes, including 5, 15, 30, and 60 minutes, while trading on a lower timeframe like 1 minute.
🎨 Dynamic Color-Coding:
- Visual Signaling: The indicator employs color-coding to visually signal breakout events. When a short breakout occurs on any timeframe the timeframe color will highlight red, and vice versa for long will highlight green. The physical line will change color based on the current timeframe you are viewing
- Real-Time Tracking: Colors reset when a level is retested, helping you track market sentiment in real-time.
🪙 Need Your Help
- I am still very much new to coding, and this code is clearly not optimized well. This code was mainly the based idea, and over the next coming months I will be working to enhance the code but I need tradingview help. If you are a coder and see a way to optimize this code please please let me know :)

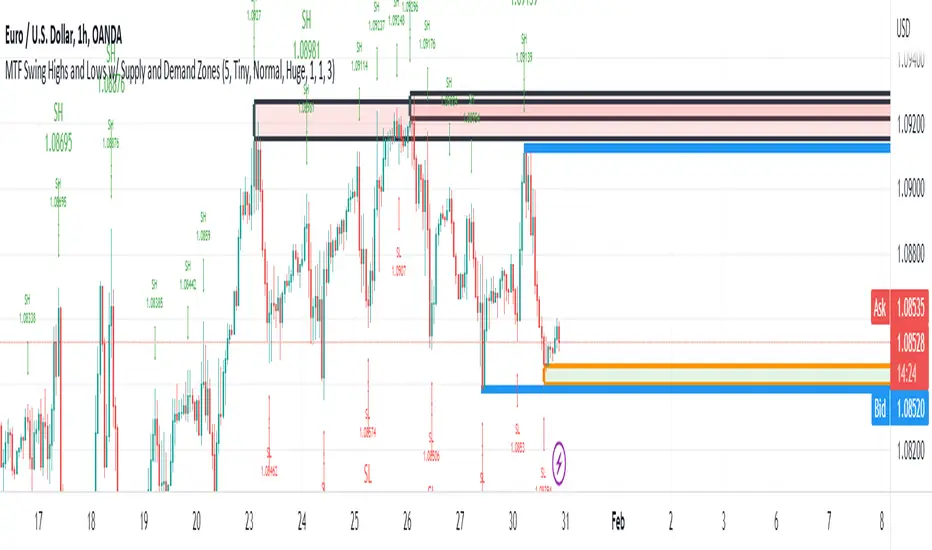
MTF Swing Highs and Lows w/ Supply and Demand ZonesI designed this indicator out of necessity for the Market structure/Price action trading strategy I use.
I thought I'd share. :)
For the fans of my Multi Timeframe Swing High and Low indicator, I have added Supply and Demand Zones!
The Supply and Demand Zones are based on the Swing Highs and Lows of my MTF Swing Highs and Lows Indicator.
The S/D Zones are created on the wicks of the Swing Highs and Lows.
You can choose whether to display the Chart, Higher and/or Highest timeframes as in the chart below.
You can also choose to display up to 3 S/D Zones from the past 3 Swing Highs and Lows.
The default setting is to display 1 chart timeframe S/D Zone, 2 higher and 3 highest, as I found this to be most effective without
cluttering the screen too much
The Chart Timeframe S/D Zones have an orange border, higher timeframe have a blue border and the highest have a black border.
Supply zones based on Swing Highs are red and Demand Zones based on Swing Lows are green.
This indicator displays Swing Highs and Lows on 3 timeframes based on the Chart timeframe, as follows:
Chart TF Higher TF Highest TF
1m 5m 15m
5m 15m 60m
15m 60m 240m
60m 240m Daily
240m Daily Weekly
Daily Weekly Monthly
You can change the font size of the labels as you'd prefer.
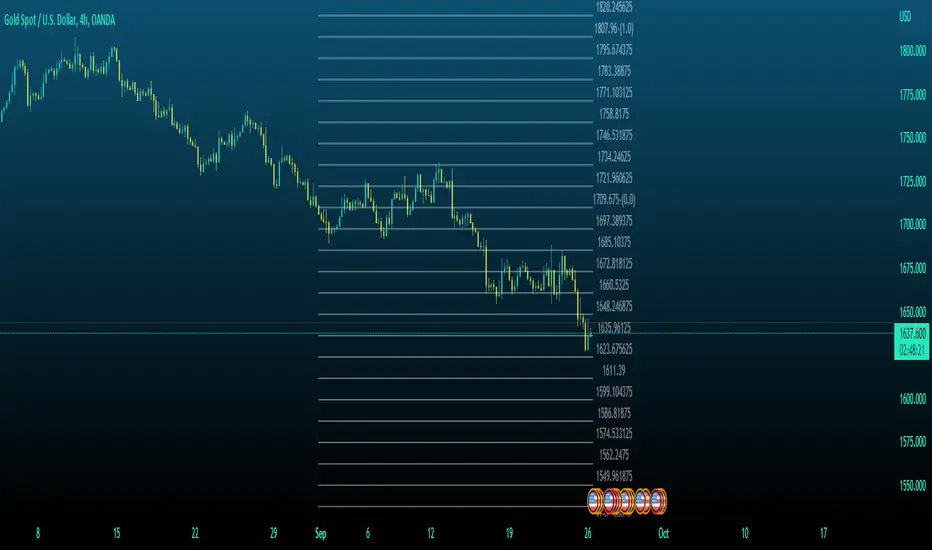
MTF High and Low FractionsMTF High and Low Fractions
Description
An experimental script that prints 1/3, 1/4 and 1/8 levels of the previous timeframe's high and low to the current timeframe. The idea is quite simple. It mirrors the the previous high and low with user selected levels. The default setting is the previous daily high and low but can be customized on user discretion.
New levels are printed after the close of the previous timeframe and open of the new timeframe (user's timeframe setting).
How To Use
Levels should not be used blindly. Levels can be used as confluence when aligned with high probability supply and demand zones, support, resistance, order blocks, and so on.
MTF fair value gap v2 thigh gaps yumwell load in 2 FVG indicators one for current chart then one for MTF of interest.
Higher timeframe FVGs are more important and can be used for bias or even targets for internal liquidity.
big thanks @shanxia for basically re-doing the FVGs into arrays hehehe..
Can now delete mitigated or change mitigated color..
I dont know who uses extensions but if you want to suffer in your private time then go ahead...
pre sure this is the sexiest FVG indicator validate me in the description pls
MTF DSS (Double Smoothed Stochastic) [TH]The Double Smoothed Stochastic indicator was created by William Blau.
The DSS ranges from 0 to 100, like the standard Stochastic Oscillator.
The same rules of interpretation apply to Stochastics can be applied to DSS, although the DSS offers a much smoother curve than the raw Stochastic.
How it works:
It applies Exponential Moving Averages (EMAs) of two different periods to a standard Stochastic %K.
The components that construct the Stochastic Oscillator are first smoothed with the two EMAs.
Then, the smoothed components are plugged into the standard Stochastic formula to calculate the indicator.
Calculation:
EMA of the ( EMA of the (Close – Lowest Low for the specified period) )
Divided by
EMA of the ( EMA of the (Highest High for the specified period – Lowest Low for the specified period) )
X 100
How to add alerts:
Check off each piece of criteria you want for the alerts, then select Okay.
Then go to 'Create Alert' and set the condition to 'MTF DSS', select create.

MTF Ichimoku Analysis[tanayroy]Ichimoku can state market conditions better than any indicator or group of indicators(My own perspective). Ichimoku works seamlessly in different timeframes. Analysis of Ichimoku in different timeframes can give you the bigger picture of the market.
This indicator analyzes six different timeframes with Ichimoku in depth. Default timeframes are 5M, 30M, 60M, D, W, and M. You can change the default timeframes from the setting.
As we are dealing with many relations, we can define the relationship with a simple score to get the trend strength.
Ichimoku Analysis:
Relationship of Price(P) with Ichimoku indicators: Here we are analyzing the current price and Ichimoku indicators. The position of price with respect to Ichimoku indicators states the market condition clearly.
Price(P) and Kumo(C): P > C = Bullish (↑). P < C = Bearish (↓). P <> C = consolidation or no trend(↔). Score: ±2
Price(P) and Tenkan Sen(T): P >= T = Bullish (↑). P < T = Bearish (↓). Score: ±0.5
Price(P) and Kijun Sen(K): P >= K = Bullish (↑). P < T = Bearish (↓). Score: ±0.5
Price(26 bars ago) and Chiku(L): L >= P(26) = Bullish (↑). L < P(26) = Bearish (↓). Score: ±0.5
Tenkan Sen and Kijun Sen Relation. Tenkan Sen depicts short-term trends and Kijun depicts mid-term trends. So this relationship is important for analyzing the current trend of the market.
Tenkan Sen(T) and Kijun Sen(K): T >= K = Bullish (↑). T < K = Bearish (↓). Score: ±2
Direction of Ichimoku indicators.
The direction of Ichimoku indicators helps us to understand the trend strength.
Tenkan Sen's(T) direction: Upward slope = Bullish (↑). Downward slope = Bearish (↓). Flat=consolidation or no trend(↔). Score: ±0.5
Kijun Sen's(K) direction: Upward slope = Bullish (↑). Downward slope = Bearish (↓). Flat=consolidation or no trend(↔). Score: ±0.5
Senkou A(A) direction: Upward slope = Bullish (↑). Downward slope = Bearish (↓). Flat=consolidation or no trend(↔). Score: ±0.5
Senkou B(A) direction: Upward slope = Bullish (↑). Downward slope = Bearish (↓). Flat=consolidation or no trend(↔). Score: ±0.5
Cloud and other Ichimoku indicators:
Kumo or Cloud is very important in the Ichimoku system. Analyzing its relation with other indicators is important to detect the overall market condition.
Kumo(C) and Tenkan Sen(T): T >= C = Bullish (↑). T < C = Bearish (↓). T <> C = consolidation or no trend(↔). Score: ±0.5
Kumo(C) and Kijun Sen(K): K >= C = Bullish (↑). K < C = Bearish (↓). K <> C = consolidation or no trend(↔). Score: ±0.5
Kumo(C) and Chiku(L): L >= C = Bullish (↑). L < C = Bearish (↓). L <> C = consolidation or no trend(↔). Score: ±0.5
Kumo(C) Shadow: By analyzing the last 252 bars(you can change this option) we are analyzing the Kumo shadow behind the current price. If Kumo shadow is present behind the price, trend strength will be weakened. Score: ±0.5
Kumo(C) Future (Senkou A(A) and Senkou B(B)): A >= B = Bullish (↑). A < B = Bearish (↓). Score: ±0.5
Chiku(L) Analysis:
Vertical and Horizontal Chiku analysis will tell us about the possible consolidation of the price.
Chiku Vertical: if the price consolidates for the next 5 bars(You can change this option) will it run into the price. Please remember we are placing the current price 26 bars ago and we are interested to see the current price in open space for a clear trend. Score: ±0.5
Chikou Horizontal: If Chiku is in open space (Not running into the price), we want to review Chiku vertically i.e how much percentage of fall or rise of the current price can cause Chiku to run into the price.
So, the maximum trend score is ±10.5.
Ichimoku signals:
We know, that the crossover of Ichimoku indicators provides important signals. In this section, you can see all the crossover i.e when they happened (Bars ago)
Distance between price and Tenkan Sen and Kijun Sen: We know, the price come back to Tenkan/Kijun if it goes far away from Tenkan/Kijun. So it is important to note the distance between Tenkan and Price.
Please note that this indicator is not a strategy or buy/sell signal. It just shows you the picture of Ichimoku in multiple timeframes. I am working on some strategies of Ichimoku and will publish the same when my research is complete.
If you want to analyze Ichimoku in a single timeframe, please review the following indicator.
To maintain the table size you can use the shorthand notation from the setting.
Table with detailed analysis:
Table with shorthand notation:
Please comment if you want any clarification or found any bugs to report.

MTF 3 Moving Averages (EMA & SMA)Hi, for those of you that like trading with Moving averages, here's a script to view 3 of them at once on MTF scale.
I added the option to switch between EMA and SMA or to view all of them at the same time.
I use the 1D moving averages to look for support and resistance levels on smaller timeframes (1H,4H)
Enjoy!
MM :)

MTF EMA TrendThe indicator plots directional arrows on top of the chart to visualize the market's price trend. The plots are based on candle closing below all three multitimeframe EMAs, downtrend, when the EMAs are also in order (1 below 2 and 2 below 3). Opposite situation is uptrend.
It also marks a breakdown when the price closes under the third (supposedly always the slowest) EMA outside of aforementioned downtrend situation. Opposite is true for breakup to be marked.
Please always make sure, that the three EMAs are in order of EMA 1 being the fastest and 3rd the slowest. Default settings are used on the 5 minute timeframe.
Indicator can be used to quickly check the overall trend of the market as told by three MTF EMAs without needing to clutter the chart with the actual EMA plots. This is useful, for example, if you mainly base your scalping trades on other types of indicators, but you want a quick peek of the market direction or indecision.
MTF Market Structure Highs and LowsThe indicator marks the last fractal highs and lows (W,D,4H and 1H options) to help determine current market structure. The script was created to help with directional bias but also as a MTF visual aid for stop hunts/liquidity raids.
Liquidity areas are where we assume trader's stop losses would be when buying or selling. Liquidity lies above and below swing points and institutions need liquidity to fill large orders.
Monitor price action as it hits these areas for a potential reversal trade.
