TechniTrendMasterIntroducing "TechniTrendMaster"
The TechniTrendMaster indicator is designed to bring clarity and depth to your trading strategy. This indicator combines robust trend analysis with volume insights, giving you a comprehensive view of the market’s pulse. Let's break down the features.
🔵 Analysis Mode
TechniTrendMaster's Analysis Mode provides various configurations tailored to specific market behaviors. Here are the options you can utilize:
🔹Strong Movements: Focuses on powerful market shifts, ideal for capturing major trend changes and high-momentum moves. Perfect for identifying strong breakout opportunities.
🔹Reversal: Detects potential turning points in the market, signaling when a trend might be about to change direction, allowing for well-timed entries and exits.
🔹Consolidations: Spots periods of low volatility where the market moves sideways, helping you avoid trading traps and anticipate breakout scenarios.
🔹Momentum-Driven: Prioritizes momentum in the market, identifying when the force behind price movement is accelerating or decelerating.
🔹Balanced: Offers a well-rounded view of the market by weighing both trend direction and volume equally, making it suitable for stable market conditions.
🔹Volatility Adapted: Adjusts to periods of increased or decreased volatility, providing accurate signals regardless of market conditions.
🔹Trend Confirmation: Confirms the strength and sustainability of a trend, allowing traders to enter trades with higher confidence.
🔹Short-Term Scalping: Tailored for traders who focus on Short-Term and Scalp trades, offering rapid insights for intraday or short-term trading strategies.
🔵 Trend Analysis Mode
The Trend Analysis Mode allows you to customize how trends are detected and analyzed:
🔹Default: A balanced mode for general use, offering reliable trend identification across different market conditions.
🔹Aggressive: A more sensitive setting that reacts quickly to market changes, ideal for traders looking to capitalize on smaller, quicker movements.
🔹Conservative: Takes a cautious approach, favoring long-term stability over short-term fluctuations, perfect for risk-averse traders.
🔹Volatility Aware: Focuses on adapting to volatility shifts, giving accurate trend signals even in erratic markets.
🔹Range Bound: Targets horizontal price movements and channel trades, helping traders take advantage of well-defined ranges.
🔵 Divergence
Divergence is a powerful tool within TechniTrendMaster, highlighting discrepancies between price movement and underlying volume. These differences can indicate potential reversals or trend continuations before they are visible on price charts alone.
🔵 Hidden Divergence
Hidden divergence is a subtle yet crucial signal that reveals when an existing trend might resume after a temporary correction. This mode provides early detection of trend continuity opportunities, giving traders a significant advantage in timing.
🔵 Divergence Mode
TechniTrendMaster includes different divergence detection settings to suit your analysis style:
🔹Standard: Captures typical divergence patterns for general analysis.
🔹Short-Term Focused: Concentrates on short-lived divergences, offering rapid detection of shifts for active traders.
🔹Long-Term Analysis: Highlights divergence in a broader context, which is better for understanding the overall market direction.
🔹High Sensitivity: Prioritizes capturing even the smallest shifts in the market, making it excellent for high-frequency trading or volatile environments.
🔹Low Sensitivity: Reduces market noise, only reacting to more significant changes in trend or volume. It’s perfect for traders who seek higher accuracy with fewer false signals.
🔵 Dynamic Channel
TechniTrendMaster features a Dynamic Channel, that automatically adapts to market conditions. This channel provides a visual guide to price action, adjusting in real-time based on current trends and volatility. It identifies key support and resistance zones, making it easier to spot breakouts, trend continuations, or potential reversals.
🔵 Volume Integration
Volume is a critical part of TechniTrendMaster, offering deeper insights beyond just price movement. By analyzing volume patterns alongside trends, the indicator highlights the strength and reliability of market shifts. This integration ensures that traders can distinguish between genuine movements backed by solid volume and weak trends that might not hold.
🔵 A Solution for All Trading Styles
TechniTrendMaster’s strength lies in its versatility. No matter your trading approach—be it scalping, swing trading, trend following, or range trading—this indicator adapts to your needs. Here's how it caters to different trader profiles:
🔹Scalpers get precise, quick-response insights through the Short-Term Scalping and High Sensitivity settings, helping them capture minute price movements.
🔹Swing Traders benefit from modes like Reversal, Balanced, and Momentum-Driven, which focus on identifying trends and shifts that occur over several days.
🔹Long-Term Investors will find the Conservative, Low Sensitivity, and Long-Term Analysis modes ideal for filtering noise and sticking to broader market trends.
🔹Volatility Traders can rely on the Volatility Adapted and Volatility Aware options to get accurate signals even during unpredictable periods.
🔓 Unlock Access :
Check out the Author's Instructions or Dm me to Unlock the Access.
Cari dalam skrip untuk "scalp"

Bayesian Order Flow Predictor📌 Bayesian Order Flow Predictor — Advanced Probability Engine for Nasdaq and Futures
This indicator is a next-generation probabilistic forecasting system designed for Nasdaq traders who rely on Order Flow, Auction Market Theory, Value Area dynamics, market structure, DOM imbalance, and Bayesian probability models.
It combines 7 professional-grade factors (DOM, CVD, RSI, EMA trend, ATR volatility, Market Structure, Value Area positioning) into a unified Bayesian probability panel that outputs a clean bullish/bearish probability curve with high-confidence reversal and trend-continuation signals.
Engineered for scalpers, day traders, futures traders, and ICT-style order flow technicians, it delivers real-time directional probability, session-aware signals, and optional news-filter exclusion.
⭐ Features
Bayesian Probability Model (0–100%)
DOM imbalance scoring across dynamic depth levels
Cumulative Volume Delta (CVD) scoring
Market structure detection (HH/LL micro-trend shifts)
RSI momentum and overbought/oversold scoring
EMA directional bias + ATR-normalized deviation
Value Area positioning (VAH / VAL / POC) with optional previous-session mode
Session filtering (only signals during active hours)
Automated news filter (exclude signals around scheduled macro events)
Bull/Bear probability zones with background coloring
Anti-repetition system (no double signals in same direction)
Designed for future scalping, futures order flow, and high-precision timing
🧠 Bayesian Probability Engine — How It Works
The model evaluates 7 independent market factors simultaneously:
DOM imbalance
CVD pressure
Market structure
RSI deviation
EMA trend
Value Area position
ATR volatility shift
Each factor is transformed into a normalized score, multiplied by its weighting parameter, and aggregated into a global score.
This score is then passed through a Bayesian logistic function to convert uncertainty into a smooth probability curve, giving traders a clean, mathematically stable, and noise-resistant forecast.
📈 Buy & Sell Signal Logic
Signals trigger when:
Bullish Probability crosses above the user threshold
Bearish Probability crosses below the opposite threshold
Session is active
No protected news event is occurring
This avoids noise, prevents over-signaling, and focuses only on high-confidence inflection points.
🎯Fully compatible with the indicator: ➡️ AI Probabilistic Orderflow scalper
Both indicators synchronize perfectly when used together:
Bayesian panel → trend probability
Scalper v1 → timing + TP/SL engine
Together they create a complete probability-driven revenue management system for scalping Future.
📘 How to Use
Add the indicator to your chart
Set your trading session (e.g., 09:30–16:00 EST)
Adjust weights depending on your style (Order Flow / Momentum / Value Area)
Watch the probability curve:
Above threshold → bullish bias
Below threshold → bearish bias
Take signals when the curve crosses thresholds, not when flat
Combine with "AI Probabilistic Orderflow scalper" indicator for execution timing
Avoid high-impact news using the News Filter
💎 Advantages
Professional-grade Bayesian model
Works in all volatility regimes
Noise-resistant and smoother than traditional oscillators
Integrates Order Flow + Auction Theory + Momentum + Volatility
Perfect for NQ scalpers seeking an AI-style probability dashboard
Reduces emotional decision-making
Compatible with any execution strategy
Optimized for high winrate scalping and sniper entries

XAUUSD 9-Grid Scalper (9-levels, 3pt TP)📈 Overview
The XAUUSD 9-Grid Scalper is a precision-based intraday strategy designed for gold scalping around key 9-based price zones. Gold (XAUUSD) often reacts strongly to levels that are multiples of 9, and this script builds a dynamic grid of 18 levels around the current price to capture short-term momentum moves.
This strategy uses 9-point take profits (TP) and configurable stop-loss levels, allowing for fast in-and-out scalps within volatile gold sessions. It’s optimized for short-term traders who focus on 1M–5M charts.
⚙️ Core Logic
Dynamic 9-Multiples Grid: Automatically plots 18 nearby levels spaced by multiples of 9.
Entry Signals:
Long when price breaks above a 9-level.
Short when price breaks below a 9-level.
Take Profit: Fixed at 9 points (configurable).
Stop Loss: Adjustable for flexible risk management.
Backtest-Ready: Uses strategy() for full performance analytics (win rate, profit factor, drawdown).
💡 Best Use Cases
Ideal for gold scalpers during London and New York sessions.
Works best on 1M–5M timeframes with high volatility.
Combine with volume or trend filters (e.g., RSI, MA slope) for improved accuracy.
🧠 Customization Options
Number of grid levels (default: 18)
Take profit & stop loss distance (default: 9pt TP)
Display toggle for 9-grid visualization
Optional filters for session time or volatility
⚠️ Disclaimer
This strategy is for educational and research purposes only.
Past performance does not guarantee future results. Always test on demo before trading live.

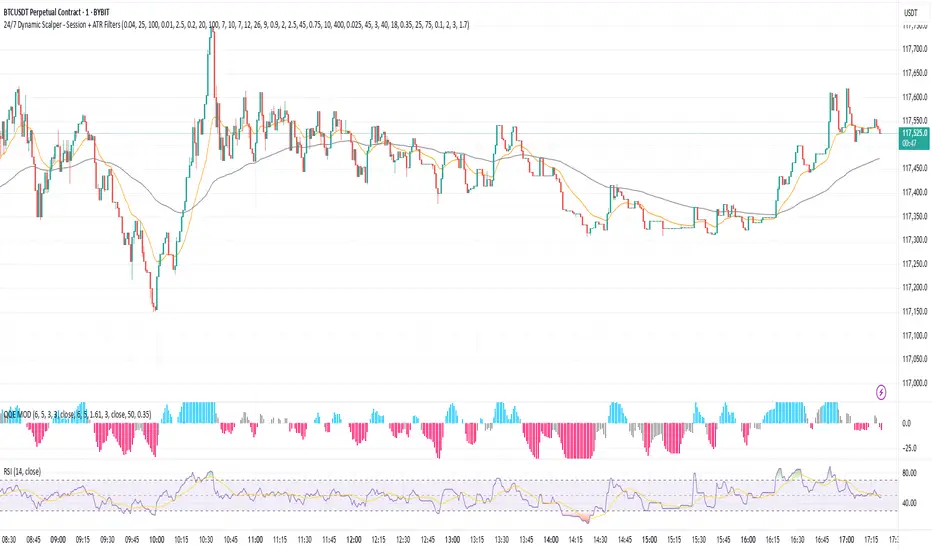
24/7 Dynamic Scalper - Session + ATR Filters24/7 Dynamic Scalper — Session + ATR Filters
The only scalping strategy you’ll need for non-stop, high-precision trading — engineered for automation and hands-off profits!
Session Filtering: Trade only during the hottest market hours (Asia Open & EU Session) — fully automatic.
ATR Stability & Dynamic Risk: Filters out chop and volatility spikes for cleaner, higher-probability entries.
Momentum & Exhaustion Protection: Built-in RSI & MACD logic blocks overbought/oversold traps and weak signals.
Time-in-Trade Auto-Exit: No more stale trades — get capped exposure for every position.
Auto Alerts: Sends structured, ready-to-automate alerts (BUY/SELL/EXIT) — perfect for webhook and bot traders.
Optional Volume/TP Filters: Toggle volume spikes, dynamic ATR-based TP, and even “big candle” protection.
Fully Customizable: Fine-tune everything from leverage to max stop loss (in USDT), bar/range filters, and much more.
Best for: Fast scalpers, algo traders, automation junkies, and anyone who wants a robust, hands-off approach to perpetual futures.
👇 How it Works (Feature Breakdown):
Session Filters: Restricts signals to the highest liquidity hours (Asia/EU), or trade 24/7 — your choice!
ATR + Range Filters: Ensures every entry has real volatility and avoids dangerous chop.
Momentum Logic: Combines EMA, MACD slope, and RSI direction to hunt for real breakouts only.
Exhaustion Safeguards: Avoids classic scalp reversals by blocking overbought/oversold and exhausted MACD/RSI momentum.
Drawdown Defense: Detects “big candle” traps, ATR surges, and lets you cap stop-loss by percent or by max USDT.
Hands-Off Management: All exits (TP/SL/trailing) are managed by your backend/bot via structured alerts — the script keeps charts clean and exits only by time cap (so no backend/strategy overlap).
Ready for Webhook Automation: Clean JSON alerts for BUY, SELL, and CLOSE — drop them straight into your bot for instant auto-trading.
No repaint, no nonsense — just cold, fast, high-frequency scalping with robust, smart filters.
🚀 Plug, Play, Automate.
Copy to your chart, tweak your session/ATR/settings, and wire up your alert to your favorite webhook bot.
Perfect for Bybit, MEXC, Binance, and anywhere you can automate.
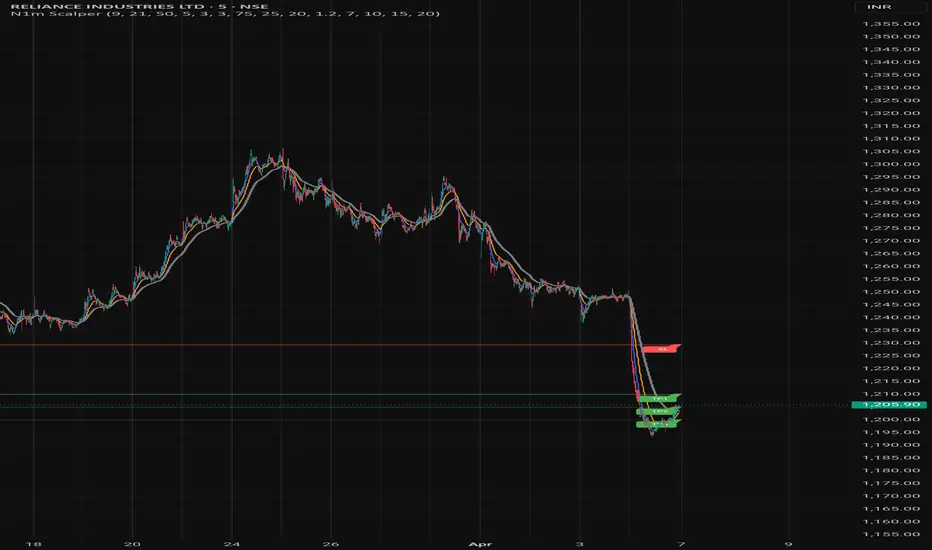
Nifty 1m EMA Pullback Scalper Signals
### **Master the Market with the Sniper Scalping Strategy for Nifty (1-Minute Timeframe)**
Unlock the power of precision trading with this expertly crafted **Sniper Scalping Strategy**, designed specifically for the Nifty index on a lightning-fast 1-minute timeframe. Perfect for traders who thrive on quick decisions and small, consistent profits, this strategy combines multiple indicators to deliver razor-sharp entries and exits—ideal for India’s dynamic market.
#### **Why This Strategy Stands Out**
- **Pinpoint Accuracy**: Harness the synergy of the **5 EMA and 10 EMA crossover** to lock onto the short-term trend, while the **Stochastic Oscillator (14,3,3)** times your entries and exits with surgical precision.
- **Fast and Effective**: Tailored for the 1-minute chart, this strategy capitalizes on Nifty’s volatility, targeting **10-point profits** with a tight **5-point stop-loss**—keeping your risk low and rewards high.
- **Trend + Momentum**: Blend trend-following (EMAs) with momentum signals (Stochastic) for a robust, multi-dimensional approach that cuts through market noise.
#### **How It Works**
- **Buy Signal**: Enter long when the 5 EMA crosses above the 10 EMA and the Stochastic rises above 20—catching the uptrend at its sweet spot.
- **Sell Signal**: Go short when the 5 EMA dips below the 10 EMA and the Stochastic falls below 80—riding the downtrend with confidence.
- **Exit Like a Pro**: Take profits at 10 points or when the Stochastic hits overbought/oversold extremes, ensuring you’re in and out before the market shifts.
#### **Perfect for Nifty Scalpers**
Built for the fast-paced world of Nifty trading, this strategy shines during high-volatility sessions like the market open or global overlaps. Whether you’re a beginner honing your skills or a seasoned trader seeking consistency, the Sniper Scalping Strategy offers a clear, actionable framework to scalp profits with discipline and precision.
#### **Get Started**
Test it in a demo account, refine it to your style, and watch your scalping game soar. Trade smart, stay focused, and let the Sniper Scalping Strategy turn Nifty’s 1-minute moves into your edge!
Higher Timeframe Price Action ScannerThis is a higher timeframe scanner that detects the price action trend on multiple timeframes and displays them all as red or green dots. You’ll be able to see the real time and historical price action trends so you can trade in the same direction of the overall trend on higher timeframes. You can also set it to scan a different ticker if you choose. If you find pairs that correlate very well, you can use two scanners and look at both of them for extra trend confluence.
CALCULATIONS
This scanner uses the same price action formula from our other indicator titled 1 Minute Scalping Indicator which can be found on our profile. It has Scalp Mode and Swing Mode. Both modes use the exact same price action parameters for signals, but Swing Mode will only give signals when the price action parameters are met AND the close is higher than the previous high for bull signals or when the close is lower than the previous low for bear signals.
HOW TO USE
The top line of the scanner shows the price action trend for the current chart timeframe and the rest are using the higher timeframe that you set in the input settings. They start with higher timeframe #1 as the second line from the top and go down from there.
When most or all of the dots are green, you should be looking for long positions and when most or all of the dots are red, you should be looking for short positions.
Since this scanner is using pure price action to identify trends, it’s a reliable way to see what multiple timeframes are doing.
PAIRINGS
Use this with the 1 Minute Scalping Indicator so you can get the signals and candles colored per the price action on your chart as well as see the higher timeframe price action trend from the scanner. Using both together will help you make better trading decisions.
MARKETS
You can use this scanner on any market.
TIMEFRAMES
This scanner will scan the current chart timeframe and display the result on the top line, then the lines below that will display the results from the higher timeframes you choose in the settings. It has timeframes from 1 minute all the way up to 1 year.

RSI Scalping & Swing Signals With AlertsThis RSI indicator shows a green or red ribbon when the smoothed RSI is bullish or bearish. It also includes a long moving average for overall trend confirmation. Wait until the ribbon holds above or below the long moving average and take positions in that direction.
To get an easier to read RSI indicator, I smoothed the RSI out and paired it next to a short term RMA. These two together form the ribbon that will show you early reversals and trend direction. The long moving average is used as an overall trend detector and confirmation for longer term trends.
***HOW TO USE***
Scalping: Enter longs when the ribbon turns green and enter shorts when the ribbon turns red. Exit positions when the ribbon turns the opposite color or crosses the long moving average.
Swing Trading: When the ribbon holds above the long moving average or breaks out and retests it, look for long positions and exit when the ribbon turns red or crosses the long moving average. When the ribbon holds below the long moving average or breaks down and retests it, look for short positions and exit when the ribbon turns green or crosses the long moving average.
***DETAILS***
This indicator gives early reversal signals very well and waiting for the RSI ribbon to cross the long moving average helps to get you into positions when the market is ready to really move while filtering out some of the noise.
The ribbon and background will change to green or red depending on whether it is currently bullish or bearish.
There is also a label that changes colors and tells you if RSI is bullish or bearish and also whether the RSI ribbon is above or below the long moving average.
Green or red circles will appear on the indicator when there is a bullish or bearish cross of the RSI ribbon and the long moving average.
It also has alerts that trigger when RSI is turning bullish/bearish or when the RSI ribbon is crossing the long moving average.
***CUSTOMIZATION***
Each piece of this indicator can be customized to suit your preferences including the RSI source, length, smoothing length, short moving average length and long moving average length. You can also turn off the labels, signals and long moving average. All of these settings can be managed within the indicator settings input tab.
***MARKETS***
This indicator can be used as a signal on all markets, including stocks, crypto, futures and forex.
***TIMEFRAMES***
This RSI Scalping & Swing Signals indicator can be used on all timeframes.
***TIPS***
Try using numerous indicators of ours on your chart so you can instantly see the bullish or bearish trend of multiple indicators in real time without having to analyze the data. Some of our favorites are Trend Friend Scalp & Swing Trade Signals, Volume Spike Scanner, Buy & Sell Pressure Volume Profile, and Momentum Scalper in combination with this RSI indicator. They all have real time Bullish and Bearish labels as well so you can immediately understand each indicator's trend.

Momentum Scalping & Swing Signals With AlertsThis Momentum indicator shows a green or red ribbon when smoothed momentum is bullish or bearish. It also includes a long moving average for overall trend confirmation. Wait until the ribbon holds above or below the long moving average and take positions in that direction.
To get an easier to read momentum indicator, I smoothed the momentum out and paired it next to a short term RMA. These two together form the ribbon that will show you early reversals and trend direction. The long moving average is used as an overall trend detector and confirmation for longer term trends.
***HOW TO USE***
Scalping: Enter longs when the ribbon turns green and enter shorts when the ribbon turns red. Exit positions when the ribbon turns the opposite color or crosses the long moving average.
Swing Trading: When the ribbon holds above the long moving average or breaks out and retests it, look for long positions and exit when the ribbon turns red or crosses the long moving average. When the ribbon holds below the long moving average or breaks down and retests it, look for short positions and exit when the ribbon turns green or crosses the long moving average.
***DETAILS***
This indicator gives early reversal signals very well and waiting for the momentum ribbon to cross the long moving average helps to get you into positions when the market is ready to really move while filtering out some of the noise.
The ribbon and background will change to green or red depending on whether it is currently bullish or bearish.
There is also a label that changes colors and tells you if momentum is bullish or bearish and also whether the momentum ribbon is above or below the long moving average.
Green or red circles will appear on the indicator when there is a bullish or bearish cross of the momentum ribbon and the long moving average.
It includes alerts that trigger when momentum is turning bullish/bearish or when the momentum ribbon is crossing the long moving average.
***CUSTOMIZATION***
Each piece of this indicator can be customized to suit your preferences including the momentum source, length, smoothing length, short moving average length and long moving average length. You can also turn off the labels, signals and long moving average. All of these settings can be managed within the indicator settings input tab.
***MARKETS***
This indicator can be used as a signal on all markets, including stocks, crypto, futures and forex.
***TIMEFRAMES***
This Momentum Scalping & Swing Signals indicator can be used on all timeframes.
***TIPS***
Try using numerous indicators of ours on your chart so you can instantly see the bullish or bearish trend of multiple indicators in real time without having to analyze the data. Some of our favorites are Trend Friend Scalp & Swing Trade Signals, Volume Spike Scanner, Buy & Sell Pressure Volume Profile, and RSI Scalper in combination with this momentum indicator. They all have real time Bullish and Bearish labels as well so you can immediately understand each indicator's trend.

TrendLineScalping-BasicDear Traders,
Here is the thought which came to my mind on the trendline break scalping. sometimes during the trade we do plot trendlines and we do anticipate for the line to break and take a trade. with the same thing in mind I had created this basic script to help you and other to create based on the logic used in the script.
This is just a logic based script and doesn't do any kind of wonders. Hence you may use it as necessary.
Regards....

Faraz Perfect Structure Scalper + Long Short (Indicator Alerts)XL/XS = Swing-quality trend continuation signals
Buy/Sell Scalp = TEMA+MACD-based fast scalp entries
Designed for MNQ/NQ but can be used on any instrument.
_______
What this script does
Plots structure-based levels (support/resistance, breakout, stop levels).
Marks perfect trend entries as XL (long) and XS (short) using structure + RSI + MACD + 200 EMA trend.
Marks base Long/Short signals as earlier, more aggressive entries.
Adds scalper signals (Buy Scalp / Sell Scalp) based on a TEMA + MACD momentum engine (inspired by ITG style logic) for fast in–out trades.
________
How I use it
I trade scalps primarily from the Buy/Sell Scalp triangles.
I use XL/XS and the structure bands to understand higher-quality swing entries and where price is likely to react.
I avoid trading when price is in the orange “no-add zone” between structure and breakout.
Warning
Futures are highly leveraged. Backtest and forward-test any setup first.
Scalper signals are designed for quick execution with tight risk management.

GB · Set upUp & Confirmation (Lower Pane)The GB Set-Up & Confirmation Indicator transforms raw momentum into a clear, color-coded decision framework for intraday scalping.
It’s the heartbeat monitor of 0DTE trading — revealing when momentum quietly shifts and when it explodes into confirmation.
Milliseconds Ahead: Confirm-on-Prior mode mimics predictive confirmation, letting traders catch reversals before the lag candle.
Noise-Adaptive: Near-zero band filtering reduces false breaks from micro volatility.
Visual Precision: Dual markers and labeled confirmations remove hesitation in execution.
Configurable Latency: Sensitivity presets + fine-tune ensure adaptability from SPX 1-min charts to QQQ 5-min momentum waves.
Platform: Designed for lower-pane deployment beneath the main price chart.
Primary Use: Time-sensitive momentum confirmation for 0DTE SPX/SPY/QQQ scalps.
Typical Workflow:
Wait for Early (Set-Up) triangle near the zero band → signals momentum shift.
Enter on the Confirmed triangle (or one candle prior if using “Confirm on Prior”).
Exit when opposite signal fires or wave color fades (momentum exhaustion).
Complementary Indicators: Pairs seamlessly with GB TMA Overlay, GB ORB Shading, or Phoenix Fire Confluence for full-stack entry validation.
Adaptive Sensitivity Presets
- Aggressive: reacts early to momentum pulses (scalp mode).
- Balanced: optimized for intraday consistency.
- Strict: waits for full trend maturity (swing mode).

ATAI Volume analysis with price action V 1.00ATAI Volume Analysis with Price Action
1. Introduction
1.1 Overview
ATAI Volume Analysis with Price Action is a composite indicator designed for TradingView. It combines per‑side volume data —that is, how much buying and selling occurs during each bar—with standard price‑structure elements such as swings, trend lines and support/resistance. By blending these elements the script aims to help a trader understand which side is in control, whether a breakout is genuine, when markets are potentially exhausted and where liquidity providers might be active.
The indicator is built around TradingView’s up/down volume feed accessed via the TradingView/ta/10 library. The following excerpt from the script illustrates how this feed is configured:
import TradingView/ta/10 as tvta
// Determine lower timeframe string based on user choice and chart resolution
string lower_tf_breakout = use_custom_tf_input ? custom_tf_input :
timeframe.isseconds ? "1S" :
timeframe.isintraday ? "1" :
timeframe.isdaily ? "5" : "60"
// Request up/down volume (both positive)
= tvta.requestUpAndDownVolume(lower_tf_breakout)
Lower‑timeframe selection. If you do not specify a custom lower timeframe, the script chooses a default based on your chart resolution: 1 second for second charts, 1 minute for intraday charts, 5 minutes for daily charts and 60 minutes for anything longer. Smaller intervals provide a more precise view of buyer and seller flow but cover fewer bars. Larger intervals cover more history at the cost of granularity.
Tick vs. time bars. Many trading platforms offer a tick / intrabar calculation mode that updates an indicator on every trade rather than only on bar close. Turning on one‑tick calculation will give the most accurate split between buy and sell volume on the current bar, but it typically reduces the amount of historical data available. For the highest fidelity in live trading you can enable this mode; for studying longer histories you might prefer to disable it. When volume data is completely unavailable (some instruments and crypto pairs), all modules that rely on it will remain silent and only the price‑structure backbone will operate.
Figure caption, Each panel shows the indicator’s info table for a different volume sampling interval. In the left chart, the parentheses “(5)” beside the buy‑volume figure denote that the script is aggregating volume over five‑minute bars; the center chart uses “(1)” for one‑minute bars; and the right chart uses “(1T)” for a one‑tick interval. These notations tell you which lower timeframe is driving the volume calculations. Shorter intervals such as 1 minute or 1 tick provide finer detail on buyer and seller flow, but they cover fewer bars; longer intervals like five‑minute bars smooth the data and give more history.
Figure caption, The values in parentheses inside the info table come directly from the Breakout — Settings. The first row shows the custom lower-timeframe used for volume calculations (e.g., “(1)”, “(5)”, or “(1T)”)
2. Price‑Structure Backbone
Even without volume, the indicator draws structural features that underpin all other modules. These features are always on and serve as the reference levels for subsequent calculations.
2.1 What it draws
• Pivots: Swing highs and lows are detected using the pivot_left_input and pivot_right_input settings. A pivot high is identified when the high recorded pivot_right_input bars ago exceeds the highs of the preceding pivot_left_input bars and is also higher than (or equal to) the highs of the subsequent pivot_right_input bars; pivot lows follow the inverse logic. The indicator retains only a fixed number of such pivot points per side, as defined by point_count_input, discarding the oldest ones when the limit is exceeded.
• Trend lines: For each side, the indicator connects the earliest stored pivot and the most recent pivot (oldest high to newest high, and oldest low to newest low). When a new pivot is added or an old one drops out of the lookback window, the line’s endpoints—and therefore its slope—are recalculated accordingly.
• Horizontal support/resistance: The highest high and lowest low within the lookback window defined by length_input are plotted as horizontal dashed lines. These serve as short‑term support and resistance levels.
• Ranked labels: If showPivotLabels is enabled the indicator prints labels such as “HH1”, “HH2”, “LL1” and “LL2” near each pivot. The ranking is determined by comparing the price of each stored pivot: HH1 is the highest high, HH2 is the second highest, and so on; LL1 is the lowest low, LL2 is the second lowest. In the case of equal prices the newer pivot gets the better rank. Labels are offset from price using ½ × ATR × label_atr_multiplier, with the ATR length defined by label_atr_len_input. A dotted connector links each label to the candle’s wick.
2.2 Key settings
• length_input: Window length for finding the highest and lowest values and for determining trend line endpoints. A larger value considers more history and will generate longer trend lines and S/R levels.
• pivot_left_input, pivot_right_input: Strictness of swing confirmation. Higher values require more bars on either side to form a pivot; lower values create more pivots but may include minor swings.
• point_count_input: How many pivots are kept in memory on each side. When new pivots exceed this number the oldest ones are discarded.
• label_atr_len_input and label_atr_multiplier: Determine how far pivot labels are offset from the bar using ATR. Increasing the multiplier moves labels further away from price.
• Styling inputs for trend lines, horizontal lines and labels (color, width and line style).
Figure caption, The chart illustrates how the indicator’s price‑structure backbone operates. In this daily example, the script scans for bars where the high (or low) pivot_right_input bars back is higher (or lower) than the preceding pivot_left_input bars and higher or lower than the subsequent pivot_right_input bars; only those bars are marked as pivots.
These pivot points are stored and ranked: the highest high is labelled “HH1”, the second‑highest “HH2”, and so on, while lows are marked “LL1”, “LL2”, etc. Each label is offset from the price by half of an ATR‑based distance to keep the chart clear, and a dotted connector links the label to the actual candle.
The red diagonal line connects the earliest and latest stored high pivots, and the green line does the same for low pivots; when a new pivot is added or an old one drops out of the lookback window, the end‑points and slopes adjust accordingly. Dashed horizontal lines mark the highest high and lowest low within the current lookback window, providing visual support and resistance levels. Together, these elements form the structural backbone that other modules reference, even when volume data is unavailable.
3. Breakout Module
3.1 Concept
This module confirms that a price break beyond a recent high or low is supported by a genuine shift in buying or selling pressure. It requires price to clear the highest high (“HH1”) or lowest low (“LL1”) and, simultaneously, that the winning side shows a significant volume spike, dominance and ranking. Only when all volume and price conditions pass is a breakout labelled.
3.2 Inputs
• lookback_break_input : This controls the number of bars used to compute moving averages and percentiles for volume. A larger value smooths the averages and percentiles but makes the indicator respond more slowly.
• vol_mult_input : The “spike” multiplier; the current buy or sell volume must be at least this multiple of its moving average over the lookback window to qualify as a breakout.
• rank_threshold_input (0–100) : Defines a volume percentile cutoff: the current buyer/seller volume must be in the top (100−threshold)%(100−threshold)% of all volumes within the lookback window. For example, if set to 80, the current volume must be in the top 20 % of the lookback distribution.
• ratio_threshold_input (0–1) : Specifies the minimum share of total volume that the buyer (for a bullish breakout) or seller (for bearish) must hold on the current bar; the code also requires that the cumulative buyer volume over the lookback window exceeds the seller volume (and vice versa for bearish cases).
• use_custom_tf_input / custom_tf_input : When enabled, these inputs override the automatic choice of lower timeframe for up/down volume; otherwise the script selects a sensible default based on the chart’s timeframe.
• Label appearance settings : Separate options control the ATR-based offset length, offset multiplier, label size and colors for bullish and bearish breakout labels, as well as the connector style and width.
3.3 Detection logic
1. Data preparation : Retrieve per‑side volume from the lower timeframe and take absolute values. Build rolling arrays of the last lookback_break_input values to compute simple moving averages (SMAs), cumulative sums and percentile ranks for buy and sell volume.
2. Volume spike: A spike is flagged when the current buy (or, in the bearish case, sell) volume is at least vol_mult_input times its SMA over the lookback window.
3. Dominance test: The buyer’s (or seller’s) share of total volume on the current bar must meet or exceed ratio_threshold_input. In addition, the cumulative sum of buyer volume over the window must exceed the cumulative sum of seller volume for a bullish breakout (and vice versa for bearish). A separate requirement checks the sign of delta: for bullish breakouts delta_breakout must be non‑negative; for bearish breakouts it must be non‑positive.
4. Percentile rank: The current volume must fall within the top (100 – rank_threshold_input) percent of the lookback distribution—ensuring that the spike is unusually large relative to recent history.
5. Price test: For a bullish signal, the closing price must close above the highest pivot (HH1); for a bearish signal, the close must be below the lowest pivot (LL1).
6. Labeling: When all conditions above are satisfied, the indicator prints “Breakout ↑” above the bar (bullish) or “Breakout ↓” below the bar (bearish). Labels are offset using half of an ATR‑based distance and linked to the candle with a dotted connector.
Figure caption, (Breakout ↑ example) , On this daily chart, price pushes above the red trendline and the highest prior pivot (HH1). The indicator recognizes this as a valid breakout because the buyer‑side volume on the lower timeframe spikes above its recent moving average and buyers dominate the volume statistics over the lookback period; when combined with a close above HH1, this satisfies the breakout conditions. The “Breakout ↑” label appears above the candle, and the info table highlights that up‑volume is elevated relative to its 11‑bar average, buyer share exceeds the dominance threshold and money‑flow metrics support the move.
Figure caption, In this daily example, price breaks below the lowest pivot (LL1) and the lower green trendline. The indicator identifies this as a bearish breakout because sell‑side volume is sharply elevated—about twice its 11‑bar average—and sellers dominate both the bar and the lookback window. With the close falling below LL1, the script triggers a Breakout ↓ label and marks the corresponding row in the info table, which shows strong down volume, negative delta and a seller share comfortably above the dominance threshold.
4. Market Phase Module (Volume Only)
4.1 Concept
Not all markets trend; many cycle between periods of accumulation (buying pressure building up), distribution (selling pressure dominating) and neutral behavior. This module classifies the current bar into one of these phases without using ATR , relying solely on buyer and seller volume statistics. It looks at net flows, ratio changes and an OBV‑like cumulative line with dual‑reference (1‑ and 2‑bar) trends. The result is displayed both as on‑chart labels and in a dedicated row of the info table.
4.2 Inputs
• phase_period_len: Number of bars over which to compute sums and ratios for phase detection.
• phase_ratio_thresh : Minimum buyer share (for accumulation) or minimum seller share (for distribution, derived as 1 − phase_ratio_thresh) of the total volume.
• strict_mode: When enabled, both the 1‑bar and 2‑bar changes in each statistic must agree on the direction (strict confirmation); when disabled, only one of the two references needs to agree (looser confirmation).
• Color customisation for info table cells and label styling for accumulation and distribution phases, including ATR length, multiplier, label size, colors and connector styles.
• show_phase_module: Toggles the entire phase detection subsystem.
• show_phase_labels: Controls whether on‑chart labels are drawn when accumulation or distribution is detected.
4.3 Detection logic
The module computes three families of statistics over the volume window defined by phase_period_len:
1. Net sum (buyers minus sellers): net_sum_phase = Σ(buy) − Σ(sell). A positive value indicates a predominance of buyers. The code also computes the differences between the current value and the values 1 and 2 bars ago (d_net_1, d_net_2) to derive up/down trends.
2. Buyer ratio: The instantaneous ratio TF_buy_breakout / TF_tot_breakout and the window ratio Σ(buy) / Σ(total). The current ratio must exceed phase_ratio_thresh for accumulation or fall below 1 − phase_ratio_thresh for distribution. The first and second differences of the window ratio (d_ratio_1, d_ratio_2) determine trend direction.
3. OBV‑like cumulative net flow: An on‑balance volume analogue obv_net_phase increments by TF_buy_breakout − TF_sell_breakout each bar. Its differences over the last 1 and 2 bars (d_obv_1, d_obv_2) provide trend clues.
The algorithm then combines these signals:
• For strict mode , accumulation requires: (a) current ratio ≥ threshold, (b) cumulative ratio ≥ threshold, (c) both ratio differences ≥ 0, (d) net sum differences ≥ 0, and (e) OBV differences ≥ 0. Distribution is the mirror case.
• For loose mode , it relaxes the directional tests: either the 1‑ or the 2‑bar difference needs to agree in each category.
If all conditions for accumulation are satisfied, the phase is labelled “Accumulation” ; if all conditions for distribution are satisfied, it’s labelled “Distribution” ; otherwise the phase is “Neutral” .
4.4 Outputs
• Info table row : Row 8 displays “Market Phase (Vol)” on the left and the detected phase (Accumulation, Distribution or Neutral) on the right. The text colour of both cells matches a user‑selectable palette (typically green for accumulation, red for distribution and grey for neutral).
• On‑chart labels : When show_phase_labels is enabled and a phase persists for at least one bar, the module prints a label above the bar ( “Accum” ) or below the bar ( “Dist” ) with a dashed or dotted connector. The label is offset using ATR based on phase_label_atr_len_input and phase_label_multiplier and is styled according to user preferences.
Figure caption, The chart displays a red “Dist” label above a particular bar, indicating that the accumulation/distribution module identified a distribution phase at that point. The detection is based on seller dominance: during that bar, the net buyer-minus-seller flow and the OBV‑style cumulative flow were trending down, and the buyer ratio had dropped below the preset threshold. These conditions satisfy the distribution criteria in strict mode. The label is placed above the bar using an ATR‑based offset and a dashed connector. By the time of the current bar in the screenshot, the phase indicator shows “Neutral” in the info table—signaling that neither accumulation nor distribution conditions are currently met—yet the historical “Dist” label remains to mark where the prior distribution phase began.
Figure caption, In this example the market phase module has signaled an Accumulation phase. Three bars before the current candle, the algorithm detected a shift toward buyers: up‑volume exceeded its moving average, down‑volume was below average, and the buyer share of total volume climbed above the threshold while the on‑balance net flow and cumulative ratios were trending upwards. The blue “Accum” label anchored below that bar marks the start of the phase; it remains on the chart because successive bars continue to satisfy the accumulation conditions. The info table confirms this: the “Market Phase (Vol)” row still reads Accumulation, and the ratio and sum rows show buyers dominating both on the current bar and across the lookback window.
5. OB/OS Spike Module
5.1 What overbought/oversold means here
In many markets, a rapid extension up or down is often followed by a period of consolidation or reversal. The indicator interprets overbought (OB) conditions as abnormally strong selling risk at or after a price rally and oversold (OS) conditions as unusually strong buying risk after a decline. Importantly, these are not direct trade signals; rather they flag areas where caution or contrarian setups may be appropriate.
5.2 Inputs
• minHits_obos (1–7): Minimum number of oscillators that must agree on an overbought or oversold condition for a label to print.
• syncWin_obos: Length of a small sliding window over which oscillator votes are smoothed by taking the maximum count observed. This helps filter out choppy signals.
• Volume spike criteria: kVolRatio_obos (ratio of current volume to its SMA) and zVolThr_obos (Z‑score threshold) across volLen_obos. Either threshold can trigger a spike.
• Oscillator toggles and periods: Each of RSI, Stochastic (K and D), Williams %R, CCI, MFI, DeMarker and Stochastic RSI can be independently enabled; their periods are adjustable.
• Label appearance: ATR‑based offset, size, colors for OB and OS labels, plus connector style and width.
5.3 Detection logic
1. Directional volume spikes: Volume spikes are computed separately for buyer and seller volumes. A sell volume spike (sellVolSpike) flags a potential OverBought bar, while a buy volume spike (buyVolSpike) flags a potential OverSold bar. A spike occurs when the respective volume exceeds kVolRatio_obos times its simple moving average over the window or when its Z‑score exceeds zVolThr_obos.
2. Oscillator votes: For each enabled oscillator, calculate its overbought and oversold state using standard thresholds (e.g., RSI ≥ 70 for OB and ≤ 30 for OS; Stochastic %K/%D ≥ 80 for OB and ≤ 20 for OS; etc.). Count how many oscillators vote for OB and how many vote for OS.
3. Minimum hits: Apply the smoothing window syncWin_obos to the vote counts using a maximum‑of‑last‑N approach. A candidate bar is only considered if the smoothed OB hit count ≥ minHits_obos (for OverBought) or the smoothed OS hit count ≥ minHits_obos (for OverSold).
4. Tie‑breaking: If both OverBought and OverSold spike conditions are present on the same bar, compare the smoothed hit counts: the side with the higher count is selected; ties default to OverBought.
5. Label printing: When conditions are met, the bar is labelled as “OverBought X/7” above the candle or “OverSold X/7” below it. “X” is the number of oscillators confirming, and the bracket lists the abbreviations of contributing oscillators. Labels are offset from price using half of an ATR‑scaled distance and can optionally include a dotted or dashed connector line.
Figure caption, In this chart the overbought/oversold module has flagged an OverSold signal. A sell‑off from the prior highs brought price down to the lower trend‑line, where the bar marked “OverSold 3/7 DeM” appears. This label indicates that on that bar the module detected a buy‑side volume spike and that at least three of the seven enabled oscillators—in this case including the DeMarker—were in oversold territory. The label is printed below the candle with a dotted connector, signaling that the market may be temporarily exhausted on the downside. After this oversold print, price begins to rebound towards the upper red trend‑line and higher pivot levels.
Figure caption, This example shows the overbought/oversold module in action. In the left‑hand panel you can see the OB/OS settings where each oscillator (RSI, Stochastic, Williams %R, CCI, MFI, DeMarker and Stochastic RSI) can be enabled or disabled, and the ATR length and label offset multiplier adjusted. On the chart itself, price has pushed up to the descending red trendline and triggered an “OverBought 3/7” label. That means the sell‑side volume spiked relative to its average and three out of the seven enabled oscillators were in overbought territory. The label is offset above the candle by half of an ATR and connected with a dashed line, signaling that upside momentum may be overextended and a pause or pullback could follow.
6. Buyer/Seller Trap Module
6.1 Concept
A bull trap occurs when price appears to break above resistance, attracting buyers, but fails to sustain the move and quickly reverses, leaving a long upper wick and trapping late entrants. A bear trap is the opposite: price breaks below support, lures in sellers, then snaps back, leaving a long lower wick and trapping shorts. This module detects such traps by looking for price structure sweeps, order‑flow mismatches and dominance reversals. It uses a scoring system to differentiate risk from confirmed traps.
6.2 Inputs
• trap_lookback_len: Window length used to rank extremes and detect sweeps.
• trap_wick_threshold: Minimum proportion of a bar’s range that must be wick (upper for bull traps, lower for bear traps) to qualify as a sweep.
• trap_score_risk: Minimum aggregated score required to flag a trap risk. (The code defines a trap_score_confirm input, but confirmation is actually based on price reversal rather than a separate score threshold.)
• trap_confirm_bars: Maximum number of bars allowed for price to reverse and confirm the trap. If price does not reverse in this window, the risk label will expire or remain unconfirmed.
• Label settings: ATR length and multiplier for offsetting, size, colours for risk and confirmed labels, and connector style and width. Separate settings exist for bull and bear traps.
• Toggle inputs: show_trap_module and show_trap_labels enable the module and control whether labels are drawn on the chart.
6.3 Scoring logic
The module assigns points to several conditions and sums them to determine whether a trap risk is present. For bull traps, the score is built from the following (bear traps mirror the logic with highs and lows swapped):
1. Sweep (2 points): Price trades above the high pivot (HH1) but fails to close above it and leaves a long upper wick at least trap_wick_threshold × range. For bear traps, price dips below the low pivot (LL1), fails to close below and leaves a long lower wick.
2. Close break (1 point): Price closes beyond HH1 or LL1 without leaving a long wick.
3. Candle/delta mismatch (2 points): The candle closes bullish yet the order flow delta is negative or the seller ratio exceeds 50%, indicating hidden supply. Conversely, a bearish close with positive delta or buyer dominance suggests hidden demand.
4. Dominance inversion (2 points): The current bar’s buyer volume has the highest rank in the lookback window while cumulative sums favor sellers, or vice versa.
5. Low‑volume break (1 point): Price crosses the pivot but total volume is below its moving average.
The total score for each side is compared to trap_score_risk. If the score is high enough, a “Bull Trap Risk” or “Bear Trap Risk” label is drawn, offset from the candle by half of an ATR‑scaled distance using a dashed outline. If, within trap_confirm_bars, price reverses beyond the opposite level—drops back below the high pivot for bull traps or rises above the low pivot for bear traps—the label is upgraded to a solid “Bull Trap” or “Bear Trap” . In this version of the code, there is no separate score threshold for confirmation: the variable trap_score_confirm is unused; confirmation depends solely on a successful price reversal within the specified number of bars.
Figure caption, In this example the trap module has flagged a Bear Trap Risk. Price initially breaks below the most recent low pivot (LL1), but the bar closes back above that level and leaves a long lower wick, suggesting a failed push lower. Combined with a mismatch between the candle direction and the order flow (buyers regain control) and a reversal in volume dominance, the aggregate score exceeds the risk threshold, so a dashed “Bear Trap Risk” label prints beneath the bar. The green and red trend lines mark the current low and high pivot trajectories, while the horizontal dashed lines show the highest and lowest values in the lookback window. If, within the next few bars, price closes decisively above the support, the risk label would upgrade to a solid “Bear Trap” label.
Figure caption, In this example the trap module has identified both ends of a price range. Near the highs, price briefly pushes above the descending red trendline and the recent pivot high, but fails to close there and leaves a noticeable upper wick. That combination of a sweep above resistance and order‑flow mismatch generates a Bull Trap Risk label with a dashed outline, warning that the upside break may not hold. At the opposite extreme, price later dips below the green trendline and the labelled low pivot, then quickly snaps back and closes higher. The long lower wick and subsequent price reversal upgrade the previous bear‑trap risk into a confirmed Bear Trap (solid label), indicating that sellers were caught on a false breakdown. Horizontal dashed lines mark the highest high and lowest low of the lookback window, while the red and green diagonals connect the earliest and latest pivot highs and lows to visualize the range.
7. Sharp Move Module
7.1 Concept
Markets sometimes display absorption or climax behavior—periods when one side steadily gains the upper hand before price breaks out with a sharp move. This module evaluates several order‑flow and volume conditions to anticipate such moves. Users can choose how many conditions must be met to flag a risk and how many (plus a price break) are required for confirmation.
7.2 Inputs
• sharp Lookback: Number of bars in the window used to compute moving averages, sums, percentile ranks and reference levels.
• sharpPercentile: Minimum percentile rank for the current side’s volume; the current buy (or sell) volume must be greater than or equal to this percentile of historical volumes over the lookback window.
• sharpVolMult: Multiplier used in the volume climax check. The current side’s volume must exceed this multiple of its average to count as a climax.
• sharpRatioThr: Minimum dominance ratio (current side’s volume relative to the opposite side) used in both the instant and cumulative dominance checks.
• sharpChurnThr: Maximum ratio of a bar’s range to its ATR for absorption/churn detection; lower values indicate more absorption (large volume in a small range).
• sharpScoreRisk: Minimum number of conditions that must be true to print a risk label.
• sharpScoreConfirm: Minimum number of conditions plus a price break required for confirmation.
• sharpCvdThr: Threshold for cumulative delta divergence versus price change (positive for bullish accumulation, negative for bearish distribution).
• Label settings: ATR length (sharpATRlen) and multiplier (sharpLabelMult) for positioning labels, label size, colors and connector styles for bullish and bearish sharp moves.
• Toggles: enableSharp activates the module; show_sharp_labels controls whether labels are drawn.
7.3 Conditions (six per side)
For each side, the indicator computes six boolean conditions and sums them to form a score:
1. Dominance (instant and cumulative):
– Instant dominance: current buy volume ≥ sharpRatioThr × current sell volume.
– Cumulative dominance: sum of buy volumes over the window ≥ sharpRatioThr × sum of sell volumes (and vice versa for bearish checks).
2. Accumulation/Distribution divergence: Over the lookback window, cumulative delta rises by at least sharpCvdThr while price fails to rise (bullish), or cumulative delta falls by at least sharpCvdThr while price fails to fall (bearish).
3. Volume climax: The current side’s volume is ≥ sharpVolMult × its average and the product of volume and bar range is the highest in the lookback window.
4. Absorption/Churn: The current side’s volume divided by the bar’s range equals the highest value in the window and the bar’s range divided by ATR ≤ sharpChurnThr (indicating large volume within a small range).
5. Percentile rank: The current side’s volume percentile rank is ≥ sharp Percentile.
6. Mirror logic for sellers: The above checks are repeated with buyer and seller roles swapped and the price break levels reversed.
Each condition that passes contributes one point to the corresponding side’s score (0 or 1). Risk and confirmation thresholds are then applied to these scores.
7.4 Scoring and labels
• Risk: If scoreBull ≥ sharpScoreRisk, a “Sharp ↑ Risk” label is drawn above the bar. If scoreBear ≥ sharpScoreRisk, a “Sharp ↓ Risk” label is drawn below the bar.
• Confirmation: A risk label is upgraded to “Sharp ↑” when scoreBull ≥ sharpScoreConfirm and the bar closes above the highest recent pivot (HH1); for bearish cases, confirmation requires scoreBear ≥ sharpScoreConfirm and a close below the lowest pivot (LL1).
• Label positioning: Labels are offset from the candle by ATR × sharpLabelMult (full ATR times multiplier), not half, and may include a dashed or dotted connector line if enabled.
Figure caption, In this chart both bullish and bearish sharp‑move setups have been flagged. Earlier in the range, a “Sharp ↓ Risk” label appears beneath a candle: the sell‑side score met the risk threshold, signaling that the combination of strong sell volume, dominance and absorption within a narrow range suggested a potential sharp decline. The price did not close below the lower pivot, so this label remains a “risk” and no confirmation occurred. Later, as the market recovered and volume shifted back to the buy side, a “Sharp ↑ Risk” label prints above a candle near the top of the channel. Here, buy‑side dominance, cumulative delta divergence and a volume climax aligned, but price has not yet closed above the upper pivot (HH1), so the alert is still a risk rather than a confirmed sharp‑up move.
Figure caption, In this chart a Sharp ↑ label is displayed above a candle, indicating that the sharp move module has confirmed a bullish breakout. Prior bars satisfied the risk threshold — showing buy‑side dominance, positive cumulative delta divergence, a volume climax and strong absorption in a narrow range — and this candle closes above the highest recent pivot, upgrading the earlier “Sharp ↑ Risk” alert to a full Sharp ↑ signal. The green label is offset from the candle with a dashed connector, while the red and green trend lines trace the high and low pivot trajectories and the dashed horizontals mark the highest and lowest values of the lookback window.
8. Market‑Maker / Spread‑Capture Module
8.1 Concept
Liquidity providers often “capture the spread” by buying and selling in almost equal amounts within a very narrow price range. These bars can signal temporary congestion before a move or reflect algorithmic activity. This module flags bars where both buyer and seller volumes are high, the price range is only a few ticks and the buy/sell split remains close to 50%. It helps traders spot potential liquidity pockets.
8.2 Inputs
• scalpLookback: Window length used to compute volume averages.
• scalpVolMult: Multiplier applied to each side’s average volume; both buy and sell volumes must exceed this multiple.
• scalpTickCount: Maximum allowed number of ticks in a bar’s range (calculated as (high − low) / minTick). A value of 1 or 2 captures ultra‑small bars; increasing it relaxes the range requirement.
• scalpDeltaRatio: Maximum deviation from a perfect 50/50 split. For example, 0.05 means the buyer share must be between 45% and 55%.
• Label settings: ATR length, multiplier, size, colors, connector style and width.
• Toggles : show_scalp_module and show_scalp_labels to enable the module and its labels.
8.3 Signal
When, on the current bar, both TF_buy_breakout and TF_sell_breakout exceed scalpVolMult times their respective averages and (high − low)/minTick ≤ scalpTickCount and the buyer share is within scalpDeltaRatio of 50%, the module prints a “Spread ↔” label above the bar. The label uses the same ATR offset logic as other modules and draws a connector if enabled.
Figure caption, In this chart the spread‑capture module has identified a potential liquidity pocket. Buyer and seller volumes both spiked above their recent averages, yet the candle’s range measured only a couple of ticks and the buy/sell split stayed close to 50 %. This combination met the module’s criteria, so it printed a grey “Spread ↔” label above the bar. The red and green trend lines link the earliest and latest high and low pivots, and the dashed horizontals mark the highest high and lowest low within the current lookback window.
9. Money Flow Module
9.1 Concept
To translate volume into a monetary measure, this module multiplies each side’s volume by the closing price. It tracks buying and selling system money default currency on a per-bar basis and sums them over a chosen period. The difference between buy and sell currencies (Δ$) shows net inflow or outflow.
9.2 Inputs
• mf_period_len_mf: Number of bars used for summing buy and sell dollars.
• Label appearance settings: ATR length, multiplier, size, colors for up/down labels, and connector style and width.
• Toggles: Use enableMoneyFlowLabel_mf and showMFLabels to control whether the module and its labels are displayed.
9.3 Calculations
• Per-bar money: Buy $ = TF_buy_breakout × close; Sell $ = TF_sell_breakout × close. Their difference is Δ$ = Buy $ − Sell $.
• Summations: Over mf_period_len_mf bars, compute Σ Buy $, Σ Sell $ and ΣΔ$ using math.sum().
• Info table entries: Rows 9–13 display these values as texts like “↑ USD 1234 (1M)” or “ΣΔ USD −5678 (14)”, with colors reflecting whether buyers or sellers dominate.
• Money flow status: If Δ$ is positive the bar is marked “Money flow in” ; if negative, “Money flow out” ; if zero, “Neutral”. The cumulative status is similarly derived from ΣΔ.Labels print at the bar that changes the sign of ΣΔ, offset using ATR × label multiplier and styled per user preferences.
Figure caption, The chart illustrates a steady rise toward the highest recent pivot (HH1) with price riding between a rising green trend‑line and a red trend‑line drawn through earlier pivot highs. A green Money flow in label appears above the bar near the top of the channel, signaling that net dollar flow turned positive on this bar: buy‑side dollar volume exceeded sell‑side dollar volume, pushing the cumulative sum ΣΔ$ above zero. In the info table, the “Money flow (bar)” and “Money flow Σ” rows both read In, confirming that the indicator’s money‑flow module has detected an inflow at both bar and aggregate levels, while other modules (pivots, trend lines and support/resistance) remain active to provide structural context.
In this example the Money Flow module signals a net outflow. Price has been trending downward: successive high pivots form a falling red trend‑line and the low pivots form a descending green support line. When the latest bar broke below the previous low pivot (LL1), both the bar‑level and cumulative net dollar flow turned negative—selling volume at the close exceeded buying volume and pushed the cumulative Δ$ below zero. The module reacts by printing a red “Money flow out” label beneath the candle; the info table confirms that the “Money flow (bar)” and “Money flow Σ” rows both show Out, indicating sustained dominance of sellers in this period.
10. Info Table
10.1 Purpose
When enabled, the Info Table appears in the lower right of your chart. It summarises key values computed by the indicator—such as buy and sell volume, delta, total volume, breakout status, market phase, and money flow—so you can see at a glance which side is dominant and which signals are active.
10.2 Symbols
• ↑ / ↓ — Up (↑) denotes buy volume or money; down (↓) denotes sell volume or money.
• MA — Moving average. In the table it shows the average value of a series over the lookback period.
• Σ (Sigma) — Cumulative sum over the chosen lookback period.
• Δ (Delta) — Difference between buy and sell values.
• B / S — Buyer and seller share of total volume, expressed as percentages.
• Ref. Price — Reference price for breakout calculations, based on the latest pivot.
• Status — Indicates whether a breakout condition is currently active (True) or has failed.
10.3 Row definitions
1. Up volume / MA up volume – Displays current buy volume on the lower timeframe and its moving average over the lookback period.
2. Down volume / MA down volume – Shows current sell volume and its moving average; sell values are formatted in red for clarity.
3. Δ / ΣΔ – Lists the difference between buy and sell volume for the current bar and the cumulative delta volume over the lookback period.
4. Σ / MA Σ (Vol/MA) – Total volume (buy + sell) for the bar, with the ratio of this volume to its moving average; the right cell shows the average total volume.
5. B/S ratio – Buy and sell share of the total volume: current bar percentages and the average percentages across the lookback period.
6. Buyer Rank / Seller Rank – Ranks the bar’s buy and sell volumes among the last (n) bars; lower rank numbers indicate higher relative volume.
7. Σ Buy / Σ Sell – Sum of buy and sell volumes over the lookback window, indicating which side has traded more.
8. Breakout UP / DOWN – Shows the breakout thresholds (Ref. Price) and whether the breakout condition is active (True) or has failed.
9. Market Phase (Vol) – Reports the current volume‑only phase: Accumulation, Distribution or Neutral.
10. Money Flow – The final rows display dollar amounts and status:
– ↑ USD / Σ↑ USD – Buy dollars for the current bar and the cumulative sum over the money‑flow period.
– ↓ USD / Σ↓ USD – Sell dollars and their cumulative sum.
– Δ USD / ΣΔ USD – Net dollar difference (buy minus sell) for the bar and cumulatively.
– Money flow (bar) – Indicates whether the bar’s net dollar flow is positive (In), negative (Out) or neutral.
– Money flow Σ – Shows whether the cumulative net dollar flow across the chosen period is positive, negative or neutral.
The chart above shows a sequence of different signals from the indicator. A Bull Trap Risk appears after price briefly pushes above resistance but fails to hold, then a green Accum label identifies an accumulation phase. An upward breakout follows, confirmed by a Money flow in print. Later, a Sharp ↓ Risk warns of a possible sharp downturn; after price dips below support but quickly recovers, a Bear Trap label marks a false breakdown. The highlighted info table in the center summarizes key metrics at that moment, including current and average buy/sell volumes, net delta, total volume versus its moving average, breakout status (up and down), market phase (volume), and bar‑level and cumulative money flow (In/Out).
11. Conclusion & Final Remarks
This indicator was developed as a holistic study of market structure and order flow. It brings together several well‑known concepts from technical analysis—breakouts, accumulation and distribution phases, overbought and oversold extremes, bull and bear traps, sharp directional moves, market‑maker spread bars and money flow—into a single Pine Script tool. Each module is based on widely recognized trading ideas and was implemented after consulting reference materials and example strategies, so you can see in real time how these concepts interact on your chart.
A distinctive feature of this indicator is its reliance on per‑side volume: instead of tallying only total volume, it separately measures buy and sell transactions on a lower time frame. This approach gives a clearer view of who is in control—buyers or sellers—and helps filter breakouts, detect phases of accumulation or distribution, recognize potential traps, anticipate sharp moves and gauge whether liquidity providers are active. The money‑flow module extends this analysis by converting volume into currency values and tracking net inflow or outflow across a chosen window.
Although comprehensive, this indicator is intended solely as a guide. It highlights conditions and statistics that many traders find useful, but it does not generate trading signals or guarantee results. Ultimately, you remain responsible for your positions. Use the information presented here to inform your analysis, combine it with other tools and risk‑management techniques, and always make your own decisions when trading.

RSI Divergence Strategywhat is "RSI Divergence Strategy"?
it is a RSI strategy based this indicator:
what it does?
it gives buy or sell signals according to RSI Divergences. it also has different variables such as "take profit", "stop loss" and trailing stop loss.
how it does it?
it uses the "RSI Divergence" indicator to give signal. For detailed information on how it works, you can visit the link above. The quantity of the inputs is proportional to the rsi values. Long trades are directly traded with "RSI" value, while short poses are traded with "100-RSI" value.
How to use it?
The default settings are for scalp strategy but can be used for any type of trading strategy. you can develop different strategies by changing the sections. It is quite simple to use.
RSI length is length of RSİ
source is source of RSİ
RSİ Divergence lenght is length of line on the RSI
The "take profit", "stop" and "trailing stop" parts used in the "buy" group only affect buys. The "sell" group is similarly independent of the variables in the "buy" group.
The "zoom" section is used to enlarge or reduce the indicator. it only changes the appearance, it does not affect the results of the strategy.

[blackcat] L3 Low TF ScalperLevel 3
Background
Low time scapling is a challenge, I am always working on developping better scalper for low timeframe (TF)
Function
Lower time frame trading is known as scalping. It is often considered as a risky strategy as you have a small margin to make a mistake. In fact, you have to get the best trading accounts for the scalp. Choosing a faulty account and trying to earn money with the low-end tools will result in big losses.
This is a simple but powerful scalper which may need you to set up reference look back period e.g. "3D" == 3 days, or "5D" == 5 days,high of high and low of low as basic resistance and support levels. Because if you set up proper look back parameter as a string of resolution , it is simple but valid levels for your to judge whether price is in oversold or overbought status.
I use green labels 'B' to indicate oversold buy based on look back period set and red labels "S" inidcating overbought sell based on look back period parameter as well.
Remarks
Free but closed source.
Feedbacks are appreciated.

NVME Hunter XNVME Hunter X is a scalping indicator designed from our NVME Oscillator X, it uses the trend confirmations to generate scalping signals and the signals can be customised in many different ways too. With our scalper, there are two scalping modes: default and legacy. Default is our new NVME Oscillator X algorithm and the legacy is our old algorithm combined with another indicator to generate the signals. With this new algorithm, we have reduced the amount of faulty signal prints by 20%, which is big. Furthermore, with the legacy mode you can customise the signal filtration system in 3 different ways: Colour-Based, Double Filter and Triple Filter. Colour-Based will only print the signal if the bar colour is the same as the signal printed so buys are green and sells are red (or whatever your colour scheme is). Double Filter will use multiple closes as a confirmation combined with a oscillator confluence to generate a signal and the triple filter will use multiple closes, the oscillator and the legacy mode to generate a signal print.
We also have an automatic support and resistance highlighter integrated into this scalping indicator to help traders find the key areas where price may reject and this works from finding confirmed pivot points and high points and low points where price has reversed and given the algorithm the confirmation it needs. The support and resistance zones can be changed by inputting different values into the lookback and forward offset period to generate different outputs.
To give you the extra confirmation, there is two plots that are accessible within the settings which is the chaser and tracer, both having a different colouring algorithm to give you an indication of the trend and whether or not it is a good time to scalp. The chaser works by using the oscillator to colour and the tracer works by using the price crossover to colour.
You can also customise the colour scheme to anything you want, there are 3 input boxes that allow you to change the colour for the bullish trend , bearish trend and unconfirmed trend and you can disable the colour overlay too, so that you can revert back to your old chart scheme.
The scalper also has predictive take profits and stop loss areas that can be printed next to every signal that shows you potential areas to look forward too, however this is done through ATR and high volatility periods can cause a massive fluctuation leaving the distance to far to get between each line.
You can also customise the dashboard's text colour, the x position and the y position and you can disable the dashboard too if you don't like it being displayed.
Our range filter removes up to 30% of faulty signals plotted on the charts giving you a noise free experience when scalping and some calls can even follow the trending market. This can be changed by toggling it on and changing the maximum and minimum range values.
Note: These results are not guaranteed in the future and each trade has risks, please consider the risks before you decide to try this indicator. Thank you for reading :)

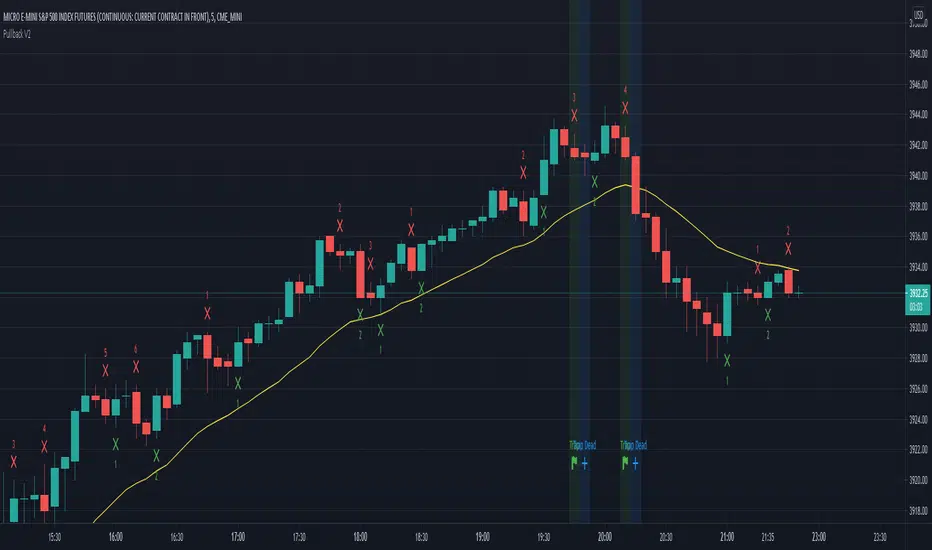
Pullback Traps v. 0.1Trading Strategy for scalping the CME_MINI:ES1! and CME_MINI:MES1! futures on the 5 min. time frame.
The strategy will count legs and look for failed pullbacks and failed second entries where shorters get trapped.
How to use:
When a trap occurs (Marked with green light) place an order one tick above the high of the trap and enter on next candle
If entry doesn't happen on next candle and it has a lower high, move entry to one tick above high of that candle.
Keep doing the above until you enter or until a candle is marked with a blue light and the text Trap Dead.
If you see Trap dead and you haven't entered, quickly cancel your order.
What is green light?
A second or later pullback down away from the uptrend. When the green light is present the shorters haven't made a 1 point profit and short scalpers are trapped.
What is blue light?
1. Shorters made their 1 point profit and trap is dead. Cancel your trade. Or...
2. Shorters hit their stop loss and you're probably in a trade now and about to profit.
Profit and stop loss:
Numbers are done with profit 5 ticks and stop loss 30 ticks.
Should I have a stop loss 6 times greater than profit?
Probably not. The numbers you see here are made with these profit and stop loss figures but I don't advice it in real trading.
The numbers look good on this backtest but in reality a few bad trades would ruin everything.
This was made purely for fun and sim trading - Feel free to do your own testing and show the resulsts.
Sharp Shooter - by FiatDropoutThis is an experimental script and is intended to be used only on LTF charts for scalping. It may or may not be useful on other charts and time frame, but that is subject to back testing.
Now, coming back to this script. It has multiple features yet i tried to keep it as clean in representation as possible.
As obvious, few things are easily recognizable on chart, such as:
BUY - Go LONG
STRONG BUY - Heavy Uptrend is expected, Go LONG
SELL - Go SHORT
STRONG SHORT - Heavy Downtrend is expected, Go SHORT.
on addition to above signals, there are few other plot-shapes, which are:
Red Circle - Acts as TP for LONG during uptrend and acts as Add-On SHORT during downtrend
Green Circle - Acts as TP for SHORT during downtrend and acts as Add-on LONG during uptrend.
Red Background - Bearish Peak, potential start of downtrend
Blue Background - Bullish Peak, potential start of uptrend
------------------------------------------------------------------------------------------------------------------------------------------------------------------------------------
Now that plots are over, lets go to how to use them. As name of this script suggests, it intends to find most optimal entry and exit for long and short while taking profit on the way and adding to the position until trend changes.
Be aware that trend here is very much based on current time-frame and does not represent other time-frame's bias. Also, trend here is intended to be used as a scalp trend and not a swing trend.
Now once, you get a signal for BUY(example), then wait for "Bullish Peak"(blue background) to appear with either "STRONG BUY" or just "BUY" and take an entry at respective price, next look for "red circle" which acts as TP for long(refer sec, above) and either move stop to entry, or take partial profits or close position entirely.
Now every subsequent "green circle" will act as add-on for long and every "red circle" will act as TP for long, until "Bearish Peak" appears, which will reverse the order of how circles are used and direction of the trade. Now during "Bearish Peak" and until "Bullish Peak" appears, "red circle" will act as add-on for short and "green circle" will act as TP for short.
It might take some time to adjust to the plots, but i have decided to keep it that way in order to keep chart clean of too many signals.
------------------------------------------------------------------------------------------------------------------------------------------------------------------------------------
NOTE : Please use stops and be sure to place orders quickly as prices move faster on minute charts and you should be able to place orders and stop right away, so if you are new to trading and are currently in early stage of the business, scalping is strongly not advised, let alone this indicator. Also, past performance are not guarantee of future results and most importantly, this indicator does not repaint. By using this indicator, you accept that i am not responsible for any losses or gains made by user by trading with help of this bot.
Also, in next update, i will fix some bug, add some SS and also add alerts. Alerts are not being added currently because of high volatile nature of the bot signals which if tried on automation can give varied results. Once everything is set, i shall add alerts.
for any other queries, feel free to get back here on chat or DM.
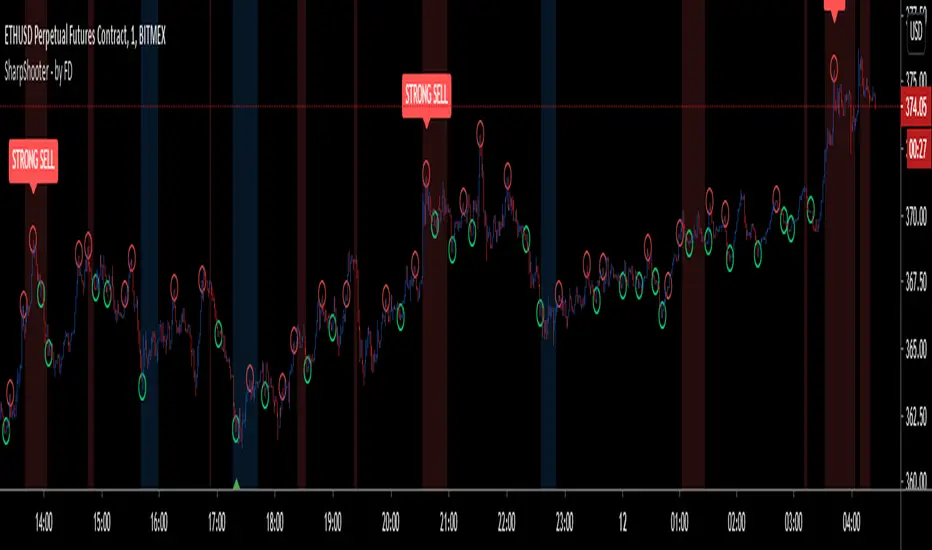
Advanced Confluence DashboardAdvanced Confluence Dashboard - Multi-Indicator Technical Analysis Tool
OVERVIEW
The Advanced Confluence Dashboard is a comprehensive technical analysis tool designed to help traders identify high-probability trade setups by tracking multiple technical indicators simultaneously. The indicator displays up to 13 different technical confluences in an easy-to-read dashboard format, providing both individual signals and an overall market bias percentage. Switch between full table view and condensed view for maximum chart flexibility.
FEATURES
- 13 Technical Confluences: RSI, VWAP, EMA Cross (9/21), MACD, Stochastic, Trend (50 EMA), Bollinger Bands, ADX Strength, Price Momentum, Volume Breakout, VWAP Bands, 200 EMA, and Price Action (Higher Highs/Lower Lows)
- Real-time Confluence Scoring: Automatically calculates bullish vs bearish signal strength
- Multi-Timeframe Support: Analyze indicators on any timeframe while viewing your chart on another
- Customizable Display: Toggle individual indicators on/off, adjust table position, size, and transparency
- ATR Information: Optional ATR display for volatility-based position sizing
- Condensed View Mode: Ultra-minimal display showing only confluence score and ATR (perfect for scalpers who want maximum chart visibility)
- Full Table View: Detailed breakdown of each indicator's value and signal
- Color-Coded Signals: Green (bullish), red (bearish), white (neutral) for instant visual clarity
HOW IT WORKS
The indicator evaluates each enabled technical indicator and assigns it either a bullish or bearish signal based on its current state. The confluence score shows how many indicators are aligned in each direction, giving you a clear percentage-based view of market bias. For example, if 8 out of 13 indicators are bullish, you'll see a 62% LONG BIAS signal.
DISPLAY MODES
Full View: Shows all enabled indicators with their current values and signals in a detailed table format. Perfect for understanding exactly which indicators are bullish or bearish and why.
Condensed View: Shows only the confluence score (e.g., "4/13 LONG | 9/13 SHORT - SHORT BIAS 69%") and optional ATR information. This minimal display keeps your chart clean while still providing the essential confluence data you need for quick trading decisions. Ideal for scalpers and traders who want maximum chart space.
CONFLUENCES EXPLAINED
- RSI: Momentum oscillator (>50 bullish, <50 bearish, shows overbought/oversold)
- VWAP: Volume-weighted average price (above = bullish, below = bearish)
- EMA Cross: Fast EMA (9) vs Slow EMA (21) with price position
- MACD: Trend-following momentum (line above signal = bullish)
- Stochastic: Momentum oscillator (>50 bullish, <50 bearish)
- Trend (50 EMA): Price position relative to 50-period EMA
- Bollinger Bands: Volatility and mean reversion (above middle = bullish)
- ADX Strength: Trend strength indicator (shows strong trends)
- Price Momentum: Rate of price change over specified period
- Volume Breakout: Detects unusual volume with directional bias
- VWAP Bands: Standard deviation bands around VWAP
- 200 EMA: Long-term trend indicator
- Price Action: Higher Highs and Lower Lows pattern detection
SETTINGS
Timeframe Settings:
- Indicator Timeframe: Analyze indicators on a different timeframe than your chart
Display Options:
- Condensed View: Toggle between full table and minimal display
- Show ATR Info: Display/hide ATR information
- Table Position: 9 positions (top/middle/bottom + left/center/right)
- Text Size: Auto, tiny, small, normal, large, huge
- Table Transparency: 0-100%
- Border Width: 1-5 pixels
Confluence Toggles:
- Enable/disable any of the 13 confluences individually
- Confluence score automatically adjusts based on enabled indicators
Indicator Settings:
- RSI Length (default: 14)
- ATR Length (default: 14)
- Fast/Slow EMA (default: 9/21)
- Trend EMA (default: 50)
- Volume SMA Length (default: 20)
- Volume Breakout Multiplier (default: 2.0x)
- Bollinger Bands Length/StdDev (default: 20/2.0)
- ADX Length (default: 14)
- ADX Strength Threshold (default: 25)
- Momentum Length (default: 10)
IDEAL USE CASES
- Scalping: Quick identification of confluence for fast entries/exits - use condensed view for clean charts
- Day Trading: Multi-timeframe analysis for intraday setups
- Swing Trading: Confirmation of longer-term bias
- Risk Management: Higher confluence = higher probability trades
- Trade Filtering: Only take trades when confluence reaches your threshold
- Multi-Monitor Setups: Use condensed view on execution charts, full view on analysis charts
HOW TO USE
1. Add the indicator to your chart
2. Toggle on/off the confluences you prefer to use
3. Choose between Full View (detailed) or Condensed View (minimal)
4. Adjust the table position and size to your preference
5. Look for high confluence percentages (70%+ is strong bias)
6. Use the individual indicator signals (full view) to understand market structure
7. Combine with your trading strategy for entry/exit confirmation
TIPS
- Use Condensed View when scalping to keep your chart clean and uncluttered
- Switch to Full View when you need to analyze which specific indicators are conflicting
- Higher confluence doesn't guarantee success - always use proper risk management
- Consider using 60%+ confluence as a minimum threshold for trades
- Pay attention to which specific indicators are aligned vs conflicting
- Use the ATR display for quick reference on position sizing
- Experiment with different timeframes to find what works for your style
- Disable indicators you don't use to simplify your confluence scoring
DISCLAIMER
This indicator is for educational and informational purposes only. It does not constitute financial advice, investment advice, trading advice, or any other type of advice. Trading and investing in financial markets involves substantial risk of loss and is not suitable for every investor. Past performance is not indicative of future results. Always do your own research and consult with a qualified financial advisor before making any investment decisions.

One Minute AI scalper keep extended trading hours on# One Minute AI Scalper - Trading Indicator
## Overview
The One Minute AI Scalper is a precision-engineered trading indicator designed specifically for short-term scalping strategies on 1-minute timeframes. This indicator combines multiple technical analysis methods to identify high-probability entry points for both long and short positions, making it ideal for active traders seeking quick, momentum-based opportunities.
## Key Features
### Visual Signals
- **Long Entry Arrows**: Clear green triangle markers appear below price bars when bullish conditions align
- **Short Entry Arrows**: Clear red triangle markers appear above price bars when bearish conditions align
- Clean, uncluttered chart interface focusing on actionable signals
### Advanced Signal Generation
The indicator utilizes a sophisticated multi-factor approach to generate trading signals:
1. **Trend Analysis**: Employs moving average crossover methodology to identify the prevailing market direction
2. **Momentum Confirmation**: Analyzes candlestick patterns and price behavior to confirm momentum strength
3. **Volume Validation**: Incorporates volume analysis to distinguish between high-conviction and standard signals
4. **Reversal Detection**: Identifies potential trend reversals by examining recent price action patterns
5. **Precision Entry Filtering**: Uses specific candlestick characteristics to minimize false signals
### Alert System
Comprehensive alert functionality for all signal types:
- Long Entry alerts
- Short Entry alerts
## How It Works
### Long Position Signals
The indicator generates long entry signals when multiple bullish conditions simultaneously align, including:
- Confirmation of upward momentum through price action
- Specific candlestick structure indicating strong buying pressure
- Price position relative to key moving averages
- Recent price behavior suggesting reversal potential
- Volume characteristics supporting the move
### Short Position Signals
Short entry signals are generated when multiple bearish conditions converge, including:
- Confirmation of downward momentum through price action
- Specific candlestick structure indicating strong selling pressure
- Price position relative to key moving averages
- Recent price behavior suggesting reversal potential
- Volume characteristics supporting the move
### Position Management
The indicator includes intelligent position state tracking to:
- Prevent duplicate signals while in an active position
- Generate exit signals based on opposing price action
- Maintain clear status of whether you're in a long or short position
## Best Practices
### Recommended Usage
- **Timeframe**: Optimized for 1-minute charts
- **Extended Hours**: Keep extended trading hours enabled for full market coverage
- **Markets**: Works on stocks, forex, crypto, and futures
- **Strategy**: Best suited for scalping and day trading strategies
### Risk Management
- Always use proper stop-loss orders
- Consider position sizing based on account risk tolerance
- Pay attention to volume-indicated signals for higher conviction trades
- Avoid trading during low-liquidity periods
- Combine with your own risk management rules
### Trading Tips
- Higher volume signals generally indicate stronger conviction
- Wait for clear arrow signals rather than trying to anticipate them
- Monitor overall market conditions and major support/resistance levels
- Be aware of news events that may cause unusual volatility
- Practice in a paper trading account before using real capital
## Important Notes
### What This Indicator Does
✅ Provides clear visual entry signals for long and short positions
✅ Incorporates multiple technical factors for signal generation
✅ Includes volume analysis for conviction assessment
✅ Offers comprehensive alert options for all signal types
✅ Maintains position state awareness
### What This Indicator Doesn't Do
❌ Does not guarantee profitable trades
❌ Does not provide specific price targets or stop-loss levels
❌ Does not replace the need for proper risk management
❌ Does not account for fundamental analysis or news events
❌ Does not adapt settings automatically to market conditions
## Disclaimer
This indicator is provided for educational and informational purposes only. It is not financial advice, and past performance does not guarantee future results. Trading involves substantial risk of loss, and you should only trade with capital you can afford to lose. Always conduct your own research and consider consulting with a qualified financial advisor before making trading decisions.
## Configuration
This indicator uses fixed, optimized parameters that have been carefully calibrated for 1-minute scalping. No user configuration is required - simply add it to your chart and monitor for signals.
## Support
For questions, suggestions, or feedback about this indicator, please use the comments section or contact the author directly through TradingView.
---
**Version**: 6.0
**Category**: Momentum/Scalping
**Overlay**: Yes
**Timeframe**: 1 minute (optimized)

Elite Momentum Scalper🎯 Perfect For
Scalpers Who Want:
Quick In-and-Out Trades: Designed for 1-15 minute timeframes but works very well on the higer timeframes. Especiall Designed for : Indices ie NAS100 SPX in the New York Session but does work in London session also.
High Win Rate: Multiple confirmations reduce false signals
Consistent Risk: Same risk per trade, every trade
Clean Charts: No indicator spaghetti, just clear signals
Best Markets: Indices ie NAS100 SPX New York Session
Forex Majors: EUR/USD, GBP/USD, USD/JPY
Precious Metals: XAU/USD (Gold), XAG/USD (Silver)
Crypto: BTC/USD, ETH/USD (works 24/7)
Indices: SPX, NAS, DAX during active sessions
Optimal Timeframes:
Primary: 5-minute, 15-minute charts
Works On: Any timeframe (auto-adjusts)
Session-Aware: Best during London/NY overlap
🚨 Built-in Alerts
Never miss a trade:
Entry Alerts: "LONG ENTRY at 1.2345 SL: 1.2300 TP: 1.2400"
Exact Levels: Includes entry, stop, and target prices
Mobile Friendly: Works with TradingView mobile alerts
💡 Pro Tips for Best Results
Setup Recommendations:
Start Conservative: Begin with 1% risk per trade
Respect Sessions: Best results during London/NY hours
Don't Override: Let the cooldown system work
Monitor Dashboard: Keep an eye on daily trade count
Backtest First: Test on historical data before live trading
Risk Management:
Never risk more than you can afford to lose
Use proper position sizing (built-in calculator)
Respect the stop losses (they're there for a reason)
Monitor during high-impact news events
🏆 Why The Elite One?
Based on Fabio Valentini's proven #1 scalper methodology, this isn't just another indicator—it's a complete trading system that:
✅ Eliminates Guesswork: Exact entry, stop, and target levels
✅ Manages Risk: Built-in position sizing and risk management
✅ Prevents Overtrading: Smart cooldown system
✅ Adapts to Markets: ATR-based levels adjust to volatility
✅ Saves Time: All information in one clean dashboard
✅ Works Anywhere: Any market, any timeframe
✅ Stays Clean: No chart clutter, just actionable signals
Join thousands of traders who've upgraded their scalping game with the world's #1 scalper's methodology, refined into institutional-grade precision with retail-friendly execution.
⚠️ Important Disclaimers
Past performance does not guarantee future results
Trading involves substantial risk of loss
Test thoroughly on demo accounts first
Consider broker spreads in your calculations
Not financial advice - trade at your own risk
📈 Ready to Transform Your Trading?
Add The Elite One to your chart and experience the difference that professional-grade trading tools based on proven scalping methodology can make.
Remember: The best traders don't just follow signals—they understand their tools. Take time to learn the system, backtest thoroughly, and always trade responsibly.
Happy Trading! 🚀
The Elite One - Based on Fabio Valentini's #1 Scalper Methodology ⚡️
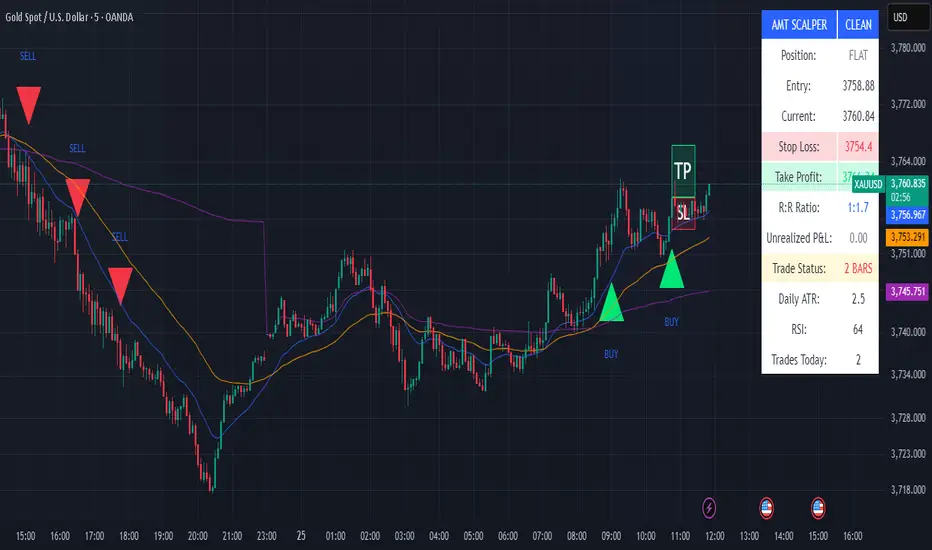
AI-Powered ScalpMaster Pro [By TraderMan]🧠 AI-Powered ScalpMaster Pro How It Works
📊 What Is the Indicator and What Does It Do?
🧠 AI-Powered ScalpMaster Pro is a powerful technical analysis tool designed for scalping (short-term, fast-paced trading) in financial markets such as forex, crypto, or stocks. It combines multiple technical indicators (RSI, MACD, Stochastic, Momentum, EMA, SuperTrend, CCI, and OBV) to identify market trends and generate AI-driven buy (🟢) or sell (🔴) signals. The goal is to help traders seize profitable scalping opportunities with quick and precise decisions. 🚀
Key Features:
🧠 AI-Driven Logic: Analyzes signals from multiple indicators to produce reliable trend signals.
📈 Signal Strength: Displays buy (bull) and sell (bear) signal strength as percentages.
✅ Success Rate: Tracks the performance of the last 5 trades and calculates the success rate.
🎯 Entry, TP, and SL Levels: Automatically sets entry points, take profit (TP), and stop loss (SL) levels.
📏 EMA Zone: Analyzes price movement around the EMA 200 to confirm trend direction.
⚙️ How Does It Work?
The indicator uses a scoring system by combining the following technical indicators:
RSI (14): Evaluates whether the price is in overbought or oversold zones.
MACD (12, 26, 9): Analyzes trend direction and momentum.
Stochastic (%K): Measures the speed of price movement.
Momentum: Checks the price change over the last 10 bars.
EMA 200: Determines the long-term trend direction.
SuperTrend: Tracks trends based on volatility.
CCI (20): Measures price deviation from its normal range.
OBV ROC: Analyzes volume changes.
Each indicator generates a buy (bull) or sell (bear) signal. If 6 or more indicators align in the same direction (e.g., bullScore >= 6 for buy), the indicator produces a strong trend signal:
📈 Strong Buy Signal: bullScore >= 6 and bullScore > bearScore.
📉 Strong Sell Signal: bearScore >= 6 and bearScore > bullScore.
🔸 Neutral: No dominant direction.
Additionally, the EMA Zone feature confirms the trend based on the price’s position relative to a zone around the EMA 200:
Price above the zone and sufficiently distant → Uptrend (UP). 🟢
Price below the zone and sufficiently distant → Downtrend (DOWN). 🔴
Price within the zone → Neutral. 🔸
🖥️ Display on the Chart
Table: A table in the top-right corner shows the status of all indicators (✅ Buy / ❌ Sell), signal strength (as %), success rate, and results of the last 5 trades.
Lines and Labels:
🎯 Entry Level: A gray line at the price level when a new signal is generated.
🟢 TP (Take Profit): A green line showing the take-profit level.
🔴 SL (Stop Loss): A red line showing the stop-loss level.
EMA Zone: The EMA 200 and its surrounding colored zone visualize the trend direction (green: uptrend, red: downtrend, gray: neutral).
📝 How to Use It?
Platform Setup:
Add the indicator to the TradingView platform.
Customize settings as needed (e.g., EMA length, risk/reward ratio).
Monitoring Signals:
Check the table: Look for 📈 STRONG BUY or 📉 STRONG SELL signals to prepare for a trade.
AI Text: Trust signals more when it says "🧠 FULL CONFIDENCE" (success rate ≥ 50%). Be cautious if it says "⚠️ LOW CONFIDENCE."
Entering a Position:
🟢 Buy Signal:
Table shows "📈 STRONG BUY" and bullScore >= 6.
Price is above the EMA Zone (green zone).
Entry: Current price (🎯 entry line).
TP: 2% above the entry price (🟢 TP line).
SL: 1% below the entry price (🔴 SL line).
🔴 Sell Signal:
Table shows "📉 STRONG SELL" and bearScore >= 6.
Price is below the EMA Zone (red zone).
Entry: Current price (🎯 entry line).
TP: 2% below the entry price (🟢 TP line).
SL: 1% above the entry price (🔴 SL line).
Position Management:
If the price hits TP, the trade closes profitably (✅ Successful).
If the price hits SL, the trade closes with a loss (❌ Failed).
Results are updated in the "Last 5 Trades" section of the table.
Risk Management:
Default risk/reward ratio is 1:2 (1% risk, 2% reward).
Always adjust position size based on your capital.
Consider smaller lot sizes for "⚠️ LOW CONFIDENCE" signals.
💡 Tips
Timeframe: Use 1-minute, 5-minute, or 15-minute charts for scalping.
Market Selection: Works best in volatile markets (e.g., BTC/USD, EUR/USD).
Confirmation: Ensure the EMA Zone trend aligns with the signal.
Discipline: Stick to TP and SL levels, avoid emotional decisions.
⚠️ Warnings
No indicator is 100% accurate. Always use additional analysis (e.g., support/resistance).
Be cautious during high-volatility periods (e.g., news events).
The success rate is based on past performance and does not guarantee future results.
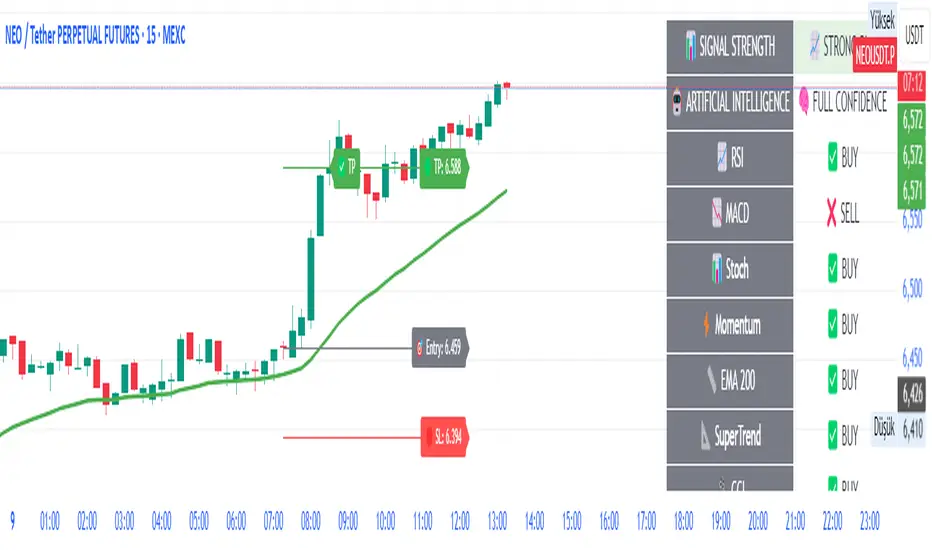
NQ Phantom Scalper Pro# 👻 NQ Phantom Scalper Pro
**Advanced VWAP Mean Reversion Strategy with Volume Confirmation**
## 🎯 Strategy Overview
The NQ Phantom Scalper Pro is a sophisticated mean reversion strategy designed specifically for Nasdaq 100 (NQ) futures scalping. This strategy combines Volume Weighted Average Price (VWAP) bands with intelligent volume spike detection to identify high-probability reversal opportunities during optimal market hours.
## 🔧 Key Features
### VWAP Band System
- **Dynamic VWAP Bands**: Automatically adjusting standard deviation bands based on intraday volatility
- **Multiple Band Levels**: Configurable Band #1 (entry trigger) and Band #2 (profit target reference)
- **Flexible Anchoring**: Choose from Session, Week, Month, Quarter, or Year-based VWAP calculations
### Volume Intelligence
- **Volume Spike Detection**: Only triggers entries when volume exceeds SMA by configurable multiplier
- **Relative Volume Display**: Real-time volume strength indicator in info panel
- **Optional Volume Filter**: Can be disabled for testing alternative setups
### Advanced Time Management
- **12-Hour Format**: User-friendly time inputs (9 AM - 4 PM default)
- **Lunch Filter**: Automatically avoids low-liquidity lunch period (12-2 PM)
- **Visual Time Zones**: Color-coded background for active/inactive periods
- **Market Hours Focus**: Optimized for peak NQ trading sessions
### Smart Risk Management
- **ATR-Based Stops**: Volatility-adjusted stop losses using Average True Range
- **Dual Exit Strategy**: VWAP mean reversion + fixed profit targets
- **Adjustable Risk-Reward**: Configurable target ratio to opposite VWAP band
- **Position Sizing**: Percentage-based equity allocation
### Optional Trend Filter
- **EMA Trend Alignment**: Optional trend filter to avoid counter-trend trades
- **Configurable Period**: Adjustable EMA length for trend determination
- **Toggle Functionality**: Enable/disable based on market conditions
## 📊 How It Works
### Entry Logic
**Long Entries**: Triggered when price touches lower VWAP band + volume spike during active hours
**Short Entries**: Triggered when price touches upper VWAP band + volume spike during active hours
### Exit Strategy
1. **VWAP Mean Reversion**: Early exit when price returns to VWAP center line
2. **Profit Target**: Fixed target based on percentage to opposite VWAP band
3. **Stop Loss**: ATR-based protective stop
### Visual Elements
- **VWAP Center Line**: Blue line showing volume-weighted fair value
- **Green Bands**: Entry trigger levels (Band #1)
- **Red Bands**: Extended levels for target reference (Band #2)
- **Orange EMA**: Trend filter line (when enabled)
- **Background Colors**: Yellow (lunch), Gray (after hours), Clear (active trading)
- **Info Panel**: Real-time metrics display
## ⚙️ Recommended Settings
### Timeframes
- **Primary**: 1-5 minute charts for scalping
- **Validation**: Test on 15-minute for swing applications
### Market Conditions
- **Best Performance**: Ranging/choppy markets with good volume
- **Trend Markets**: Enable trend filter to avoid counter-trend trades
- **High Volatility**: Increase ATR multiplier for stops
### Session Optimization
- **Pre-Market**: Generally avoided (low volume)
- **Morning Session**: 9:30 AM - 12:00 PM (high activity)
- **Lunch Period**: 12:00 PM - 2:00 PM (filtered by default)
- **Afternoon Session**: 2:00 PM - 4:00 PM (good volume)
- **After Hours**: Generally avoided (wide spreads)
## ⚠️ Risk Disclaimer
This strategy is for educational purposes only and does not constitute financial advice. Past performance does not guarantee future results. Trading futures involves substantial risk of loss and is not suitable for all investors. Users should:
- Thoroughly backtest on historical data
- Start with small position sizes
- Understand the risks of leveraged trading
- Consider transaction costs and slippage
- Never risk more than you can afford to lose
## 📈 Performance Tips
1. **Volume Threshold**: Adjust volume multiplier based on average NQ volume patterns
2. **Band Sensitivity**: Modify band multipliers for different volatility regimes
3. **Time Filters**: Customize trading hours based on your timezone and preferences
4. **Trend Alignment**: Use trend filter during strong directional markets
5. **Risk Management**: Always maintain consistent position sizing and risk parameters
**Version**: 6.0 Compatible
**Asset**: Optimized for NASDAQ 100 Futures (NQ)
**Style**: Mean Reversion Scalping
**Frequency**: High-Frequency Trading Ready

Dynamic Buy/Sell VisualizationDynamic Trend Visualization Indicator
Description:
This simple and easy to use indicator has helped me stay in trades longer.
This indicator is designed to visually represent potential buy and sell signals based on the crossover of two Simple Moving Averages (SMA). It's crafted to assist traders in identifying trend directions in a straightforward manner, making it an excellent tool for both beginners and experienced traders.
Features:
Customizable Moving Averages: Users can adjust the period length for both short-term (default: 10) and long-term (default: 50) SMAs to suit their trading strategy.
Visual Signals: Dynamic lines appear at the points of SMA crossover, with labels to indicate 'BUY' or 'SELL' opportunities.
Color and Style Customization: Customize the appearance of the buy and sell lines for better chart readability.
Alert Functionality: Alerts are set up to notify users when a crossover indicating a buy or sell condition occurs.
How It Works:
A 'BUY' signal is generated when the short-term SMA crosses above the long-term SMA, suggesting an upward trend.
A 'SELL' signal is indicated when the short-term SMA crosses below the long-term SMA, pointing to a potential downward trend.
Use Cases:
Trend Following: Ideal for markets with clear trends. For example, if trading EUR/USD on a daily chart, setting the short SMA to 10 days and the long SMA to 50 days might help in capturing longer-term trends.
Scalping: In a volatile market, setting shorter periods (e.g., 5 for short SMA and 20 for long SMA) might catch quicker trend changes, suitable for scalping.
Examples of how to use
* Short-term for Quick Trades:
SMA 5 and SMA 21:
Purpose: This combination is tailored for day traders or those looking to engage in scalping. The 5 SMA will react rapidly to price changes, providing early signals for buy or sell opportunities. The 21 SMA, being a Fibonacci number, offers a slightly longer-term view to confirm the short-term trend, helping to filter out minor fluctuations that might lead to false signals.
* Middle-term for Swing Trading:
SMA 10 and SMA 50:
Purpose: Suited for swing traders who aim to capitalize on medium-term trends. The 10 SMA picks up on immediate market movements, while the 50 SMA gives insight into the medium-term direction. This setup helps in identifying when a short-term trend aligns with a longer-term trend, providing a good balance for trades that might last several days to a couple of weeks.
* Long-term Trading:
SMA 50 and SMA 200:
Purpose: Investors focusing on long-term trends would benefit from this pair. The crossover of the 50 SMA over the 200 SMA can indicate the beginning or end of major market trends, ideal for making decisions about long-term holdings that might span months or years.
Example Strategy if not using the Buy / Sell Label Alerts:
Entry Signal: Enter a long position when the shorter SMA crosses above the longer SMA. For example:
SMA 10 crosses above SMA 50 for a medium-term bullish signal.
Exit Signal: Consider exiting or initiating a short position when:
SMA 10 crosses below SMA 50, suggesting a bearish turn in the medium-term trend.
Confirmation: Use these crossovers in conjunction with other indicators like volume or momentum indicators for better confirmation. For instance, if you're using the 5/21 combination, look for volume spikes on crossovers to confirm the move's strength.
When Not to Use:
Sideways or Range-Bound Markets: The indicator might generate many false signals in a non-trending market, leading to potential losses.
High Volatility Without Clear Trends: Rapid price movements without a consistent direction can result in misleading crossovers.
As a Standalone Tool: It should not be used in isolation. Combining with other indicators like RSI or MACD for confirmation can enhance trading decisions.
Practical Example:
Buy Signal: If you're watching Apple Inc. (AAPL) on a weekly chart, a crossover where the 10-week SMA moves above the 50-week SMA could suggest a buying opportunity, especially if confirmed by volume increase or other technical indicators.
Sell Signal: Conversely, if the 10-week SMA dips below the 50-week SMA, it might be time to consider selling, particularly if other bearish signals are present.
Conclusion:
The "Dynamic Trend Visualization" indicator provides a visual aid for trend-following strategies, offering customization and alert features to streamline the trading process. However, it's crucial to use this in conjunction with other analysis methods to mitigate the risks of false signals or market anomalies.
Legal Disclaimer:
This indicator is for educational purposes only. It does not guarantee profits or provide investment advice. Trading involves risk; please conduct thorough or consult with a financial advisor. The creator is not responsible for any losses incurred. By using this indicator, you agree to these terms.
