NQ Phantom Scalper Pro# 👻 NQ Phantom Scalper Pro
**Advanced VWAP Mean Reversion Strategy with Volume Confirmation**
## 🎯 Strategy Overview
The NQ Phantom Scalper Pro is a sophisticated mean reversion strategy designed specifically for Nasdaq 100 (NQ) futures scalping. This strategy combines Volume Weighted Average Price (VWAP) bands with intelligent volume spike detection to identify high-probability reversal opportunities during optimal market hours.
## 🔧 Key Features
### VWAP Band System
- **Dynamic VWAP Bands**: Automatically adjusting standard deviation bands based on intraday volatility
- **Multiple Band Levels**: Configurable Band #1 (entry trigger) and Band #2 (profit target reference)
- **Flexible Anchoring**: Choose from Session, Week, Month, Quarter, or Year-based VWAP calculations
### Volume Intelligence
- **Volume Spike Detection**: Only triggers entries when volume exceeds SMA by configurable multiplier
- **Relative Volume Display**: Real-time volume strength indicator in info panel
- **Optional Volume Filter**: Can be disabled for testing alternative setups
### Advanced Time Management
- **12-Hour Format**: User-friendly time inputs (9 AM - 4 PM default)
- **Lunch Filter**: Automatically avoids low-liquidity lunch period (12-2 PM)
- **Visual Time Zones**: Color-coded background for active/inactive periods
- **Market Hours Focus**: Optimized for peak NQ trading sessions
### Smart Risk Management
- **ATR-Based Stops**: Volatility-adjusted stop losses using Average True Range
- **Dual Exit Strategy**: VWAP mean reversion + fixed profit targets
- **Adjustable Risk-Reward**: Configurable target ratio to opposite VWAP band
- **Position Sizing**: Percentage-based equity allocation
### Optional Trend Filter
- **EMA Trend Alignment**: Optional trend filter to avoid counter-trend trades
- **Configurable Period**: Adjustable EMA length for trend determination
- **Toggle Functionality**: Enable/disable based on market conditions
## 📊 How It Works
### Entry Logic
**Long Entries**: Triggered when price touches lower VWAP band + volume spike during active hours
**Short Entries**: Triggered when price touches upper VWAP band + volume spike during active hours
### Exit Strategy
1. **VWAP Mean Reversion**: Early exit when price returns to VWAP center line
2. **Profit Target**: Fixed target based on percentage to opposite VWAP band
3. **Stop Loss**: ATR-based protective stop
### Visual Elements
- **VWAP Center Line**: Blue line showing volume-weighted fair value
- **Green Bands**: Entry trigger levels (Band #1)
- **Red Bands**: Extended levels for target reference (Band #2)
- **Orange EMA**: Trend filter line (when enabled)
- **Background Colors**: Yellow (lunch), Gray (after hours), Clear (active trading)
- **Info Panel**: Real-time metrics display
## ⚙️ Recommended Settings
### Timeframes
- **Primary**: 1-5 minute charts for scalping
- **Validation**: Test on 15-minute for swing applications
### Market Conditions
- **Best Performance**: Ranging/choppy markets with good volume
- **Trend Markets**: Enable trend filter to avoid counter-trend trades
- **High Volatility**: Increase ATR multiplier for stops
### Session Optimization
- **Pre-Market**: Generally avoided (low volume)
- **Morning Session**: 9:30 AM - 12:00 PM (high activity)
- **Lunch Period**: 12:00 PM - 2:00 PM (filtered by default)
- **Afternoon Session**: 2:00 PM - 4:00 PM (good volume)
- **After Hours**: Generally avoided (wide spreads)
## ⚠️ Risk Disclaimer
This strategy is for educational purposes only and does not constitute financial advice. Past performance does not guarantee future results. Trading futures involves substantial risk of loss and is not suitable for all investors. Users should:
- Thoroughly backtest on historical data
- Start with small position sizes
- Understand the risks of leveraged trading
- Consider transaction costs and slippage
- Never risk more than you can afford to lose
## 📈 Performance Tips
1. **Volume Threshold**: Adjust volume multiplier based on average NQ volume patterns
2. **Band Sensitivity**: Modify band multipliers for different volatility regimes
3. **Time Filters**: Customize trading hours based on your timezone and preferences
4. **Trend Alignment**: Use trend filter during strong directional markets
5. **Risk Management**: Always maintain consistent position sizing and risk parameters
**Version**: 6.0 Compatible
**Asset**: Optimized for NASDAQ 100 Futures (NQ)
**Style**: Mean Reversion Scalping
**Frequency**: High-Frequency Trading Ready
Cari dalam skrip untuk "scalp"

Dynamic Buy/Sell VisualizationDynamic Trend Visualization Indicator
Description:
This simple and easy to use indicator has helped me stay in trades longer.
This indicator is designed to visually represent potential buy and sell signals based on the crossover of two Simple Moving Averages (SMA). It's crafted to assist traders in identifying trend directions in a straightforward manner, making it an excellent tool for both beginners and experienced traders.
Features:
Customizable Moving Averages: Users can adjust the period length for both short-term (default: 10) and long-term (default: 50) SMAs to suit their trading strategy.
Visual Signals: Dynamic lines appear at the points of SMA crossover, with labels to indicate 'BUY' or 'SELL' opportunities.
Color and Style Customization: Customize the appearance of the buy and sell lines for better chart readability.
Alert Functionality: Alerts are set up to notify users when a crossover indicating a buy or sell condition occurs.
How It Works:
A 'BUY' signal is generated when the short-term SMA crosses above the long-term SMA, suggesting an upward trend.
A 'SELL' signal is indicated when the short-term SMA crosses below the long-term SMA, pointing to a potential downward trend.
Use Cases:
Trend Following: Ideal for markets with clear trends. For example, if trading EUR/USD on a daily chart, setting the short SMA to 10 days and the long SMA to 50 days might help in capturing longer-term trends.
Scalping: In a volatile market, setting shorter periods (e.g., 5 for short SMA and 20 for long SMA) might catch quicker trend changes, suitable for scalping.
Examples of how to use
* Short-term for Quick Trades:
SMA 5 and SMA 21:
Purpose: This combination is tailored for day traders or those looking to engage in scalping. The 5 SMA will react rapidly to price changes, providing early signals for buy or sell opportunities. The 21 SMA, being a Fibonacci number, offers a slightly longer-term view to confirm the short-term trend, helping to filter out minor fluctuations that might lead to false signals.
* Middle-term for Swing Trading:
SMA 10 and SMA 50:
Purpose: Suited for swing traders who aim to capitalize on medium-term trends. The 10 SMA picks up on immediate market movements, while the 50 SMA gives insight into the medium-term direction. This setup helps in identifying when a short-term trend aligns with a longer-term trend, providing a good balance for trades that might last several days to a couple of weeks.
* Long-term Trading:
SMA 50 and SMA 200:
Purpose: Investors focusing on long-term trends would benefit from this pair. The crossover of the 50 SMA over the 200 SMA can indicate the beginning or end of major market trends, ideal for making decisions about long-term holdings that might span months or years.
Example Strategy if not using the Buy / Sell Label Alerts:
Entry Signal: Enter a long position when the shorter SMA crosses above the longer SMA. For example:
SMA 10 crosses above SMA 50 for a medium-term bullish signal.
Exit Signal: Consider exiting or initiating a short position when:
SMA 10 crosses below SMA 50, suggesting a bearish turn in the medium-term trend.
Confirmation: Use these crossovers in conjunction with other indicators like volume or momentum indicators for better confirmation. For instance, if you're using the 5/21 combination, look for volume spikes on crossovers to confirm the move's strength.
When Not to Use:
Sideways or Range-Bound Markets: The indicator might generate many false signals in a non-trending market, leading to potential losses.
High Volatility Without Clear Trends: Rapid price movements without a consistent direction can result in misleading crossovers.
As a Standalone Tool: It should not be used in isolation. Combining with other indicators like RSI or MACD for confirmation can enhance trading decisions.
Practical Example:
Buy Signal: If you're watching Apple Inc. (AAPL) on a weekly chart, a crossover where the 10-week SMA moves above the 50-week SMA could suggest a buying opportunity, especially if confirmed by volume increase or other technical indicators.
Sell Signal: Conversely, if the 10-week SMA dips below the 50-week SMA, it might be time to consider selling, particularly if other bearish signals are present.
Conclusion:
The "Dynamic Trend Visualization" indicator provides a visual aid for trend-following strategies, offering customization and alert features to streamline the trading process. However, it's crucial to use this in conjunction with other analysis methods to mitigate the risks of false signals or market anomalies.
Legal Disclaimer:
This indicator is for educational purposes only. It does not guarantee profits or provide investment advice. Trading involves risk; please conduct thorough or consult with a financial advisor. The creator is not responsible for any losses incurred. By using this indicator, you agree to these terms.

Borsa Akademi Daytrade Hardcore by HassonyaThe Daytrade Hardcore Indicator is a strategy indicator for scalping in a 5-minute time period. Indicator was produced by me by following my way through the daytrade scanning options of my respected teacher ÖZKANFİLİZ(Best Scalper in Turkey). This scan consists of 14 conditions.
We use this scan in a 5-minute time frame. Daytrade Hardcore indicator can show us how many of these conditions in bars are listed and sequentially. You can open which one you want to use.
The Daytrade Hardcore indicator has a 3-day central pivot range. If you want, you can use it to strengthen your buying and selling decision. If the bars can hold on the 3x pivot line, you're safe.
Unless the 3-day central pivot line is shattered, you can move your stocks if you wish.
The strategy also includes DHardcore Trend, Stoploss, First Support, Indicator List, Support/Resistence and S/R Zones, 3dhx central pivot, pivot points, bollinger middle bands,
You should be careful if the 3dhx central pivot breaks down. If you want, you can stop here, you can follow it for new purchase. If you want, you can watch the support point for the new purchase or follow the list and wait for the 3-day pivot to go back when the list supports the 12-13-14 condition.
Sometimes the first support point and stoploss point may change, you can follow it yourself. In this case, you will use the bottom red first support point as a stoploss.
Thanks for your support
Türkçe Açıklama
-------------------
Daytrade Hardcore indikatörü 5 dakikalık periyotta scalping içindir. İndikatör saygıdeğer hocam Türkiye'deki en iyi scalper ÖZKANFİLİZ'in daytrade taraması baz alınarak tarafımdan yaratılmıştır. Bu taramada bildiğiniz üzere 14 tane şart bulunmaktadır. Tarama 17:30 dan kapanışa kadar 5 dakikalık zaman diliminde hisse takipçisinde izlenmektedir.
Taramayı 5 dakikalık zaman diliminde kullanıyoruz. Daytrade Hardcore indikaötür bize barlarda kaç tane şart olduğunu anlık tarayarak ister liste halinde istersek sequential şeklinde gösterebilir. İsterseniz tek tek isterseniz iki seçeneği de kullanabilirsiniz.
Daytrade Hardcore indikatöründe 3 günlük merkezi pivot aralığı bulunmaktadır. Eğer isterseniz, bunu alım satım olarak kullanabilirsiniz. Eğer barlar 3 günlük merkezi pivot çizgisi üzerinde tutunabiliyorsa bu size güvenli olduğunu gösterebilir. Alım için hacim, liste ve RMI'yi kollayabilirsiniz.
3 günlük merkezi pivot noktası kırılmadığı sürece isterseniz hissenizi taşıyabilirsiniz ve mavi çizgi aşağı kırıldığı zaman çıkış yapabilirsiniz.
Bu strateji indikatöründe DHardcore Trend, Stop Noktası, İlk Destek, İndikatör İsim Listesi, Destek/Direnç(Bölgeleri), 3dhx merkezi pivot, pivot noktaları, bollinder orta band içerir.
3 günlük merkezi pivot kırılımına dikkat etmelisiniz. Eğer isterseniz, bunu izleyerek stop olabilirsiniz ve takip ederek yeni alım noktası için izlersiniz. Bunun için isterseniz destek noktası izlersiniz isterseniz mavi çizgi üstünde tutunmasını beklersiniz.Bazı belirtiler nedir? Hacmin ortalama üzerine atması, Liste 12-13-14 olması, fiyatın bollinger orta band üstüne çıkması, fiyatın pivot üzerinde olması.
Bazı zamanlarda ilk destek noktasıyla stoploss noktası değişir. Bunu izleyip kararı kendiniz verebilirsiniz. Kırmızı noktalar mavi çizginin altına indiği zaman orası stoploss noktamız olacaktır.
Destek veren bütün dostlara teşekkür ederim.
Hayrını görün.

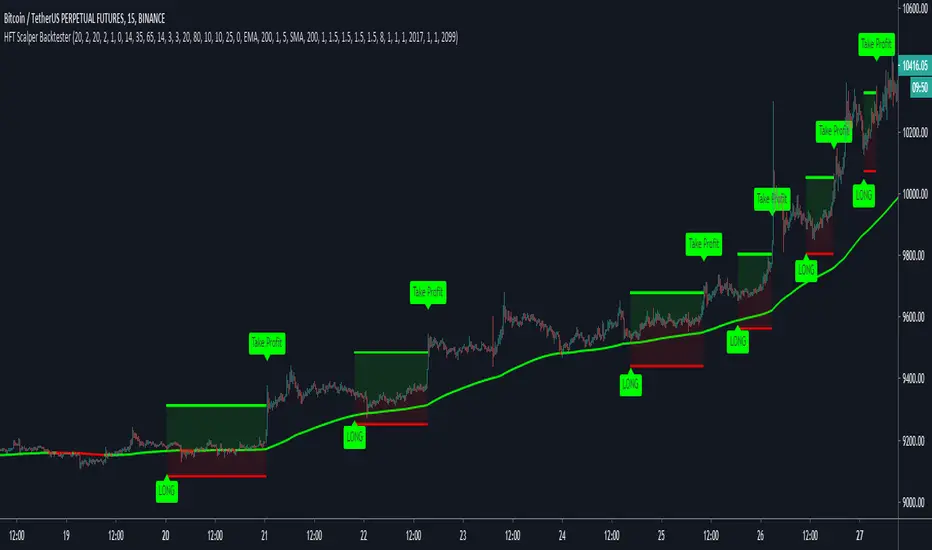
HFT Scalper BacktesterThis strategy is a scalper strategy developed by HFT Research. Scalper is highly customizable and provides endless opportunities to find profitable setups in the market.
Use Bollinger Bands
This piece of the settings will turn and off Bollinger band’s input in the decision making. BB Length will determine the Moving average you are using to take the standard deviation off of which is named as BB Multiplier. Default settings will use 20 moving average and take standard deviation of 2 to create lower and upper bands. Increasing the Multiplier will give you fewer but safer entries.
Use Bollinger Bands %
This setting will allow the user to determine at what Bollinger band width %, he wants to take start looking to take trades. It is known that when prices are stable and moving sideways, Bollinger bands contract and it becomes more reactive to small moves in the market. Using this setting, you can ignore the signals that would be generated while Bollinger bands are contracted. This setting will allow the user to weed out the noise in the market and really allow them to make the most out of Bollinger bands .
Use RSI
You can also turn on and off the RSI as well. Alternatively, there is an option to use RSI on a different time frame than you are currently on. For example, if you are looking at the 5min chart to use Bollinger bands but you would like to look at the RSI value on the 15min chart. You can do so by selecting the custom RSI timeframe as well as adjusting the Oversold and Overbought value.
Use STOCH
For those who want extra protection on their entry can throw STOCH into their decision making. STOCH acts like RSI but it is more prone to small moves. It will help the users to get a better entry if used correctly. Stoch may not be in the buy zone when RSI is at say 35, however, if price dips a little more and STOCH might be in the buy zone when RSI is at say 20. This way it will help you have better entries than just using RSI . In a way, you can use STOCH to scalp RSI .
Use VWAP
VWAP stands for volume weighted average price . It is an extremely useful indicator when trading intra-day. It does reset every trading session which is at 00:00 UTC . Instead of looking at x number of candles and providing an average price, it will take into consideration volume that’s traded at a certain price and weigh it accordingly.
Use ADX
ADX stands for average directional index . It is an indicator that measures volatility in the market. Unfortunately, the worst market condition for this strategy is sideways market. ADX becomes a useful tool since it can detect trend. If the volatility is low and there is no real price movement, ADX will pick that up and will not let you get in trades during a sideways market. It will allow you to enter trades only when the market is trending.
Use MA Filters
Lookback: It is an option to look back x number of candles to validate the price crossing. If the market is choppy and the price keeps crossing up and down the moving average you have chosen, it will generate a lot of “noisy” signals. This option allows you to confirm the cross by selecting how many candles the price needs to stay above or below the moving average. Setting it 0 will turn it off.
MA Filter Type: There is a selection of moving averages that is available on TradingView currently. You can choose from 14 different moving average types to detect the trend as accurate as possible.
Filter Length: You can select the length of your moving average. Most commonly used length being 50,100 and 200.
Filter Type: This is our propriety smoothing method in order to make the moving averages lag less and influence the way they are calculated slightly. Type 1 being the normal calculation and type 2 being the secret sauce .
Reverse MA Filter: This option allows you to use the moving average in reverse. For example, the strategy will go long when the price is above the moving average. However, if you use the reserve MA Filter, you will go short when the price is above the moving average. This method works best in sideways market where price usually retraces back to the moving average. So in an anticipation of price reverting back to the moving average, it is a useful piece of option to use during sideway markets which is the worst market condition for scalper.
Please visit our website for more information
HFT Scalper IndicatorThis strategy is a scalper strategy developed by HFT Research. Scalper is highly customizable and provides endless opportunities to find profitable setups in the market.
Use Bollinger Bands
This piece of the settings will turn and off Bollinger band’s input in the decision making. BB Length will determine the Moving average you are using to take the standard deviation off of which is named as BB Multiplier. Default settings will use 20 moving average and take standard deviation of 2 to create lower and upper bands. Increasing the Multiplier will give you fewer but safer entries.
Use Bollinger Bands %
This setting will allow the user to determine at what Bollinger band width %, he wants to take start looking to take trades. It is known that when prices are stable and moving sideways, Bollinger bands contract and it becomes more reactive to small moves in the market. Using this setting, you can ignore the signals that would be generated while Bollinger bands are contracted. This setting will allow the user to weed out the noise in the market and really allow them to make the most out of Bollinger bands.
Use RSI
You can also turn on and off the RSI as well. Alternatively, there is an option to use RSI on a different time frame than you are currently on. For example, if you are looking at the 5min chart to use Bollinger bands but you would like to look at the RSI value on the 15min chart. You can do so by selecting the custom RSI timeframe as well as adjusting the Oversold and Overbought value.
Use STOCH
For those who want extra protection on their entry can throw STOCH into their decision making. STOCH acts like RSI but it is more prone to small moves. It will help the users to get a better entry if used correctly. Stoch may not be in the buy zone when RSI is at say 35, however, if price dips a little more and STOCH might be in the buy zone when RSI is at say 20. This way it will help you have better entries than just using RSI. In a way, you can use STOCH to scalp RSI.
Use VWAP
VWAP stands for volume weighted average price. It is an extremely useful indicator when trading intra-day. It does reset every trading session which is at 00:00 UTC. Instead of looking at x number of candles and providing an average price, it will take into consideration volume that’s traded at a certain price and weigh it accordingly.
Use ADX
ADX stands for average directional index. It is an indicator that measures volatility in the market. Unfortunately, the worst market condition for this strategy is sideways market. ADX becomes a useful tool since it can detect trend. If the volatility is low and there is no real price movement, ADX will pick that up and will not let you get in trades during a sideways market. It will allow you to enter trades only when the market is trending.
Use MA Filters
Lookback: It is an option to look back x number of candles to validate the price crossing. If the market is choppy and the price keeps crossing up and down the moving average you have chosen, it will generate a lot of “noisy” signals. This option allows you to confirm the cross by selecting how many candles the price needs to stay above or below the moving average. Setting it 0 will turn it off.
MA Filter Type: There is a selection of moving averages that is available on TradingView currently. You can choose from 14 different moving average types to detect the trend as accurate as possible.
Filter Length: You can select the length of your moving average. Most commonly used length being 50,100 and 200.
Filter Type: This is our propriety smoothing method in order to make the moving averages lag less and influence the way they are calculated slightly. Type 1 being the normal calculation and type 2 being the secret sauce.
Reverse MA Filter: This option allows you to use the moving average in reverse. For example, the strategy will go long when the price is above the moving average. However, if you use the reserve MA Filter, you will go short when the price is above the moving average. This method works best in sideways market where price usually retraces back to the moving average. So in an anticipation of price reverting back to the moving average, it is a useful piece of option to use during sideway markets which is the worst market condition for scalper.
Please visit our website for more information

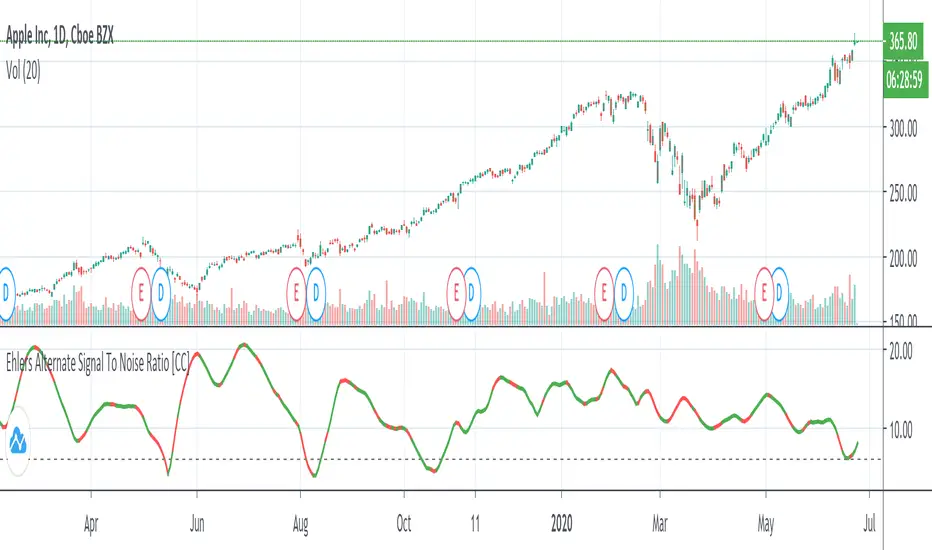
Ehlers Alternate Signal To Noise Ratio [CC]The Alternate Signal To Noise Ratio was created by John Ehlers (Rocket Science For Traders pgs 84-85) and this is a variation of his signal to noise ratio that some scalpers might find more useful than his default signal to noise ratio. You would want to buy and sell when the indicator is above the dotted line because that means the stock is volatile enough to maximize any movement of the trade in either direction. Buy when the indicator line is green and sell when it is red.
Let me know if there are other indicators you would like to see me publish or if you want something custom done!

DR.SS.SMART BUY/SMARTSELL SCALPER1️⃣ BEST TIMEFRAME
Use this as a scalper / intraday trend tool
✅ Best
5 min
15 min
⚠️ Avoid
1 min (too noisy)
Daily (signals become late)
2️⃣ FIRST CHECK – MARKET CONDITION (Dashboard)
Before taking any trade, look at the Smart Panel (Dashboard):
✔ Trade ONLY when:
Market State = Trending
Volatility = Active
Trend Pressure = Bullish or Bearish
At least 3–4 MTF boxes are same color
❌ Avoid trades when:
Market State = No trend / Ranging
Purple candles (ADX sideways)
Remember:
T-V-T rule → Trend + Volatility + Timeframe agree
3️⃣ BUY SETUP (LONG TRADE)
✅ Conditions in your code:
Price crosses ABOVE Supertrend
Close ≥ SMA 13
Bar color turns BLUE
Price above EMA 200 → Smart Buy
ADX not sideways (no purple bars)
📍 Chart shows label:
“Buy” → normal buy
“Smart Buy” → high-probability trade (BEST)
🔵 HOW TO ENTER BUY
Enter at candle CLOSE where Buy / Smart Buy appears
Do NOT enter mid-candle
🛑 STOP LOSS (Auto from code)
SL = ATR-based stop
Shown as red SL line
👉 Safe rule:
Never widen SL
🎯 TARGETS (Auto plotted)
TP1 = 1:1
TP2 = 2:1
TP3 = 3:1
📌 Recommended management:
Book 50% at TP1
Move SL to Entry
Hold rest till TP2 / Trail
4️⃣ SELL SETUP (SHORT TRADE)
✅ Conditions:
Price crosses BELOW Supertrend
Close ≤ SMA 13
Bar color turns RED
Price below EMA 200 → Smart Sell
No sideways (ADX > 15)
📍 Label shown:
“Sell”
“Smart Sell” (BEST)
🔴 HOW TO ENTER SELL
Enter at close of signal candle
Follow same SL & TP rules
5️⃣ SUPPLY & DEMAND CONFIRMATION (POWER FILTER)
🔹 Best Buy:
Price near Demand Zone
Then Smart Buy appears
🔹 Best Sell:
Price near Supply Zone
Then Smart Sell appears
👉 These are institutional entries
6️⃣ WHEN NOT TO TRADE ❌
Avoid trades when:
Purple candles (Sideways)
Supertrend flipping repeatedly
MTF dashboard mixed colors
During low-volume sessions
7️⃣ SESSION WISE BEST PERFORMANCE
From your session logic:
✅ Best Scalping:
London
London + New York overlap
⚠️ Avoid:
Mid-Tokyo (low volatility)
8️⃣ PERFECT TRADE CHECKLIST (SAVE THIS)
Before clicking BUY/SELL, ask:
✔ Smart Buy / Smart Sell?
✔ Price above/below EMA 200?
✔ Dashboard trend agrees?
✔ No sideways candles?
✔ Volatility Active?
👉 If 4 out of 5 = YES → TAKE TRADE
9️⃣ SIMPLE ONE-LINE STRATEGY
Trade only Smart Buy/Sell in trending market, book partial at 1:1, trail rest with Smart Trail
✅ BEST TRADING SESSIONS (Use ONLY these)
🥇 LONDON SESSION (BEST & SAFE)
🕒 12:30 PM – 4:30 PM IST
Why best for your script
Clean trends
Good volatility
Less fake signals
Supertrend + EMA200 works perfectly
👉 This should be your PRIMARY session
🥈 LONDON → NEW YORK OVERLAP (MOST POWERFUL)
🕒 6:00 PM – 8:30 PM IST
Why
Institutional money enters
Strong breakouts
Smart Buy / Smart Sell accuracy highest
👉 Use only Smart signals in this session
🥉 NEW YORK SESSION (Early Part Only)
🕒 6:00 PM – 9:00 PM IST
Use when
Market State = Trending
Volatility = Active
MTF mostly same color
⚠️ Stop after 9:00 PM IST
❌ SESSIONS TO AVOID
🚫 TOKYO SESSION
🕒 5:30 AM – 10:30 AM IST
Low volatility
Sideways (purple candles)
Many fake reversals
🚫 SYDNEY SESSION
🕒 2:30 AM – 5:30 AM IST
Very low volume
Not suitable for scalping
🚫 INDIAN MIDDAY
🕒 11:00 AM – 12:15 PM IST
Choppy
Stop-hunting candles
📌 BEST DAILY ROUTINE (Follow This)
Time (IST) Action
9:15 – 10:30 ❌ Avoid (fake moves)
12:30 – 4:30 ✅ TRADE (Best zone)
6:00 – 8:30 ✅ TRADE (High accuracy)
After 9:00 ❌ Avoid
🧠 EASY MEMORY RULE (Your Style)
“LON → NY = MONEY” 💰
“ASIA = NO TRADE” ❌
🎯 FINAL RECOMMENDATION
If you want only ONE session:
👉 Trade ONLY: 12:30 PM – 4:30 PM IST
This will give:
Less stress
Higher win-rate
Cleaner Smart Buy/Sell signals
🇮🇳 BEST TRADING SESSIONS (INDIA – IST)
🥇 LONDON SESSION – BEST FOR INDIAN TRADERS
🕒 12:30 PM – 4:30 PM IST
✅ THIS IS THE BEST SESSION
Strong trend moves
High accuracy Smart Buy / Smart Sell
Less sideways (purple candles reduce)
Works perfectly with Supertrend + EMA 200
👉 Use this as your MAIN session
🥈 LONDON → NEW YORK OVERLAP (POWER SESSION)
🕒 6:00 PM – 8:30 PM IST
✅ Very strong moves
Institutional activity
Best breakouts
High RR trades (2:1 / 3:1)
⚠️ Trade only Smart Buy / Smart Sell
⚠️ Avoid over-trading
🥉 INDIAN MARKET OPEN (LIMITED USE)
🕒 9:20 AM – 10:15 AM IST
✔ Use only if:
Dashboard = Trending
Volatility = Active
Direction same as higher TF
❌ Avoid after 10:30 AM
❌ SESSIONS TO AVOID (INDIA)
Session Time (IST) Reason
Tokyo 5:30 – 10:30 AM Sideways / fake moves
Mid-day Chop 11:00 – 12:15 PM Low volume
Late NY After 9:00 PM Whipsaws
📌 BEST DAILY ROUTINE (INDIA)
Time What to Do
9:15 – 9:20 ❌ No trade
9:20 – 10:15 ⚠️ Only clean Smart signals
12:30 – 4:30 ✅ MAIN TRADING WINDOW
6:00 – 8:30 ✅ HIGH PROBABILITY
After 9:00 ❌ Stop trading
🧠 EASY MEMORY RULE
“INDIA → LONDON → MONEY” 💰
“ASIA MIDDAY → NO TRADE” ❌
🎯 FINAL ANSWER (ONE-LINE)
👉 For India (IST), trade ONLY between
12:30 PM – 4:30 PM and 6:00 PM – 8:30 PM

Smart RSI Money Flow - Core Bands V1.01SMART RSI – Money Flow Bands (Technical Overview)
1. Background: RSI and Its Behavior on Lower Timeframes
The Relative Strength Index (RSI) originally is a momentum oscillator calculated from average gains and losses over a selected period. In its standard form, RSI is derived solely from price changes; it does not incorporate volume data or order-flow information in its formula.
Because RSI is price-based, its interpretation depends strongly on the timeframe:
• On higher timeframes, each bar aggregates more trading activity, and RSI tends to behave more smoothly.
• On lower timeframes (1-hour down to intraday scalping intervals), price fluctuations are quicker, and RSI becomes more sensitive to short-term noise.
This does not imply that RSI becomes invalid, but that its signals on fast charts can be more reactive and may benefit from additional context such as volume behavior or structural information.
2. Purpose of This Indicator
This indicator extends the classical RSI by adding information that RSI does not include:
• Mapping RSI values into price-based bands instead of the 0–100 oscillator space.
• Retrieving lower timeframe volume data and separating it into buy and sell components.
• Comparing the slope (angle) of price movement with the slope of buy and sell volume.
The goal is to provide a structural interpretation of where price sits relative to RSI conditions and how volume is behaving on a lower timeframe.
3. Technical Differences Compared to Classical RSI
A) Classical RSI
• Input: price only (usually close).
• Output: normalized oscillator between 0 and 100.
• Does not incorporate intra-bar volume distribution.
• Does not separate buy/sell volume.
B) SMART RSI – Money Flow Bands
1) RSI-to-Price Mapping
Converts RSI values into upper/lower price bands using recent price extremes.
2) Lower Timeframe Volume Decomposition
Retrieves LTF data and splits each bar’s volume into buy (close>open) and sell (close

Enhanced Scalping IndicatorEnhanced Scalping Indicator - Professional Multi-Confirmation Trading System
Overview
The Enhanced Scalping Indicator is a sophisticated trading tool designed for short-term traders seeking high-probability entry and exit signals. This indicator combines multiple technical analysis techniques with adaptive market conditions to filter noise and identify optimal trading opportunities.
Key Features
🎯 Multi-Confirmation Signal System
- Enhanced RSI with Adaptive Thresholds: Dynamic overbought/oversold levels that adjust based on market volatility (ATR)
- Higher Timeframe Confirmation: Uses 1-hour RSI to validate signals from lower timeframes
- Volume-Weighted Momentum: Incorporates volume analysis to confirm price movements
- Market Structure Analysis: Evaluates price position within recent 20-bar range
📊 Advanced Signal Generation
- Buy Signals: Triggered when RSI is oversold with upward momentum, confirmed by higher timeframe bearish conditions and strong volume
- Sell Signals: Activated when RSI is overbought with downward momentum, validated by higher timeframe bullish conditions and high volume
- Exit Signals: Smart exit conditions based on RSI mean reversion and momentum shifts
🔄 Divergence Detection (Optional)
- Bullish Divergence: Identifies when price makes lower lows while RSI makes higher lows
- Bearish Divergence: Spots when price makes higher highs while RSI makes lower highs
- Volume Confirmation: All divergence signals require above-average volume for validation
⚙️ Customizable Parameters
- RSI Settings: Adjustable length (default: 14) and source
- Moving Average Options: Choose from SMA, EMA, SMMA, WMA, VWMA, or Bollinger Bands
- Higher Timeframe: Configurable confirmation timeframe (default: 1 hour)
- ATR Period: [
/b] Volatility measurement period for adaptive thresholds
📈 Visual Elements
- Dynamic Threshold Lines: Adaptive overbought/oversold levels
- Signal Shapes: Clear buy/sell and exit signals on chart
- Background Highlighting: Color-coded background for active signals
- Real-time Information Table: Displays current RSI, higher timeframe RSI, volatility ratio, market position, and momentum
🚨 Alert System
Complete alert functionality for:
- Enhanced buy signals
- Enhanced sell signals
- Long position exits
- Short position exits
Best Use Cases
- Scalping: 1-5 minute timeframes for quick trades
- Day Trading: 15-30 minute timeframes for intraday positions
- Swing Trading: Higher timeframes with divergence detection enabled
Market Conditions
Works effectively in:
- T rending Markets: Momentum and higher timeframe filters reduce false signals
- Range-bound Markets: Adaptive thresholds adjust to market volatility
- High Volume Sessions: Built-in volume filters ensure signal quality
Strategy Integration
This indicator works well with:
- Support/resistance levels
- Price action analysis
- Risk management rules (stop losses, position sizing)
- Market session awareness (built-in US market hours filter)
Technical Implementation
- Built on Pine Script v6
- Utilizes proper RMA calculations for RSI
- Implements consistent historical data access
- Optimized for performance with minimal repainting
Risk Disclaimer
This indicator is a technical analysis tool and should not be used as the sole basis for trading decisions. Always combine with proper risk management, fundamental analysis, and your trading strategy. Past performance does not guarantee future results.
---
Perfect for: Scalpers, day traders, and swing traders looking for a comprehensive, multi-confirmation trading system with built-in risk management features.

MFX Ultimate Scalper [Mohs Mayfair]MFX Ultimate Scalper is an all-in-one indicator that incorporates 5+ unique components designed for interoperability & confluence with one another to provide a powerful trend following & reversal detection experience.
Users can create various ways to utilize the indicator's features together such as looking for periods of price exhaustion in the market alongside strong reversal signals appearing or getting real-time divergence signals alongside a shift in volume with the volume overlay setting in the market to predict upcoming trends.
The indicator's confirmation feature integrates customizable moving averages and the Volume Weighted Average Price (VWAP), providing additional layers of insight. Traders can fine-tune moving averages to track trend reversals and retracements with precision, while the VWAP offers valuable insights into price and volume dynamics, aiding in the assessment of market sentiment and trends.
This indicator is described as an ”Ultimate Scalper” as it's made up of many different components that can create a systematic approach to analyzing markets alone, however, the indicator also can serve as a great secondary piece to a user's primary analysis.
⨭ FEATURES
Below we describe each component of MFX Ultimate Scalper in order of each's significance for the most confluent analysis possible.
➟ Heat Zones - indicating the relative intensity of price movement, with widening zones suggesting increased volatility and potential trading opportunities.
➟ Exhaustion Signals - Small triangles on the upper or lower heat band zones represent high frequency points that indicate possible reversals or a warning signal to upcoming larger reversal signals. Discerning instances of heightened buying or selling pressure, delineating zones of market saturation and depletion using the historical strength or weakness of a stock or market based on the closing prices of a recent trading period.
➟ Reversal Signals - Kalman filter and Hull trend indicators can reveal trend reversals by dynamically adapting to market conditions and providing timely signals based on smoothed price movements.
➟ Volume Overlay - Upon calculating the relative close of candles, this option allows a coloured overlay upon candles to help confirm volume changes in the market. When price of a closed candle is greater than then open price, the bar will print with a green overlay,
Generally, we recommend using these features in order from first to last, however it is always most productive to ensure you find further confluence alongside any signal that is generated using general market structure and analysis (such as drawing independent supply and demand zones for eg).
⨭ USAGE GUIDE
In the images below, we can see 3 points of interest to a user analyzing MFX Ultimate Scalper based on various different behaviors.
In the circled areas of interest price moves into a one of the heat zones and begins to print a small green or red triangle either above or below the candlestick structure - green = looking for buys and a possible bullish reversal & red = looking for sells and a possible bearish reversal.
As price begins to print these pre reversal points of exhaustion within these heat zones we can begin looking at the market.
This can be used independently or when wanting to perhaps increase the amount of confirmations we can look to apply the reversal confirmation setting, as per below:
What makes this signal particularly more of interest opposed to other reversal signals without the confirmation toggle applied that may not play out right away is the Kalman filter and Hull trend indicator begins to show a clear trend reversal. We can see that it may print the BUY or SELL label a few candles after the initial Small triangles in the upper or lower heat band zones however can be used as a more conservative point of trade entry.
This is a great example above showing how the momentum indicator that measures the magnitude of recent price changes to analyze overbought or oversold conditions (red and green triangles in the heat zone bands) can sometimes print multiple entries. We suggest that if you are looking to increase the accuracy of the signals we found moving to a higher time frame after more than 3 of these indicators have printed, helps.
It is a great indication that price may be looking to reverse and the pressure occurring and that the market could easily reverse in these conditions.
The candles that follow with the confirmation toggle setting means that you could move into a position a little later into the new trend reversal or retracement but also ensures that there is an extra level of confirmation that one is beginning or has begun.
The volume overlay setting is a fantastic tool to use when wanting to confirm your entries for trade and print a clear example in volume shift in the market - the greater the green candle, the greater the buying momentum. The greater the red candle, the greater the selling momentum,
This analysis combined gave us a further indication of a larger reversal which played out with no lag at all as all reversal signals are predictive separate from the Volume Overlay itself, which can be used as a further trend following approach alongside signals & custom hull trend alongside specific moving average confirmations.
In the image above we can see 3 possible setups and 3 different ways each using individual options.
Working left to right, the first setup adheres to:
➟PRICE IN THE BUY ZONE
➟GREEN BUY TRIANGLE REVERSAL
➟GREEN CANDLE VOLUME CHANGE
➟NO BLUE TREND LABEL CONFIRMATION
When scalping a position using the above signals we would aim for 10-15 pips which we can see here, with no drawdown was able to close and hit our suggested take profit within approximately an hour even though the confirmation trend reversal did not print on the chart
Setup two is another BUY signal and adheres to:
➟PRICE IN THE BUY ZONE
➟GREEN BUY TRIANGLE PRINTED
➟BLUE CONFIRMATION PRINTED
➟WAIT FOR THE NEXT CANDLE TO CLOSE
➟TAKE A BUY
This time we have a clear price exhaustion with the candles closing within the heat zones, just the first buy zone. The confirmation reversal trend prints soon after and although we do not have any confirmation on the volume change overlay we can infer that given they were printed very shortly prior to this confirmation and the preliminary Scalpers green triangles had also shown, the trade confirmation is still valid.
You could perhaps place your stop loss at the base of the reversal blue buy label and then set a 1:2 ratio or perhaps simply stick to the 10-15 pips.
With our final example the confirmations are:
➟PRICE IN THE SELL ZONE
➟RED SELL TRIANGLE REVERSAL
➟THE RED TREND CONFIRMATION LABEL
WAS TOO MANY CANDLES AWAY
TO CONSIDER THE TRADE
The volume indicator printing over an engulfing bearish candle whilst also being within our heat zone exhaustion sell area shows a shift in volume and momentum - as calculated, the open price of the candle is greater than that of the closed previous one thus showing RED overlay of the candle.
In order to better experience the volume overlay option we suggest changing your settings on tradingview by clicking the chart screen settings > symbol and changing the body and wicks of the candlesticks to grey.
We can potentially determine at certain points when to 'filter out' reversal signals or to just consider them merely indications of local tops/bottoms opposed to significant tops/bottoms.
Analyzing the reversal confirmation option is useful to consider a trend potentially coming to an end. We recommend studying the outlined chart above & the list of indications at each shaded area to develop a deep understanding of how to navigate varying market conditions & spot various points of confluence during reversals.
⨭CONCLUSION & ACCESS
This indicator is an extremely comprehensive approach to a variety of volume and volatility based tools predominantly that allows users to further develop a systematic approach to trading and can be paired alongside other forms of technical analysis.
Although we believe this indicator to be useful, it's critical to understand that past performance is not necessarily indicative of future results and there are many more factors that go into being a profitable trader.
You can see the Author's instructions below to get instant access to MFX Ultimate Scalper by Mohs Mayfair

Ehlers BandPass Filter [CC]The BandPass Filter was created by John Ehlers (Cycle Analytics For Traders pgs 56-57) and this indicator only works well in choppy markets so I figured it would be useful for the scalpers out there. As you will notice it correctly identifies the peaks and valleys in the underlying stock data but it doesn't work as well when the stock is trending. The black line is a leading signal for the indicator and so I use that as the basis for the buy and sell signals. Make sure to experiment with this one and let me know if you find any better buy and sell signals to work with since I believe this is the first time I have seen this script published. Buy when the line turns green and sell when it turns red.
Let me know if there are other indicators you would like to see me publish or if you want something custom done!

RACEACEACE Ace Pro 5 Min RBC Sniper Long ScalperThis indicator is designed for scalps on the 5 minute Royal Bank of Canada chart. It detects changes of momentum to alert traders of a potential entry for a quick long scalp. It will either produce an alert of "long entry" or "long exit" depending on whether the market is oversold or overbought.
Please note that this indicator is not an upgrade to any previously published indicator. It has been specifically designed for long scalps on the 5 minute RY - Royal Bank of Canada chart. Traders should use it as confluence with other tools of technical analysis.
To gain access to this indicator, you may send me a request via direct message on Tradingview.

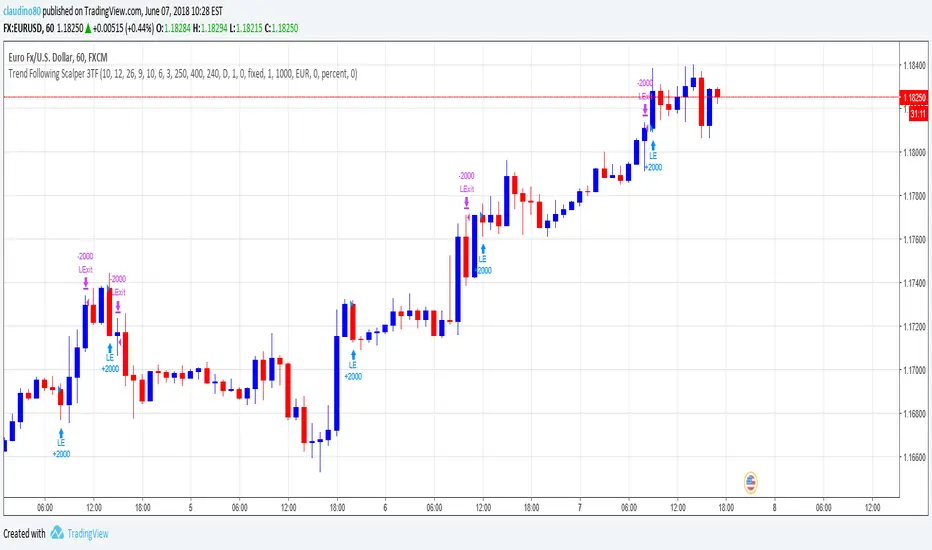
Trend Following Scalper 3 Time FramseDo you think it is a good idea to use the Stochastic / MACD / EMA and cross check THREE timeframes to detect a new trend?
If you think that it would be a good idea, this is the script that you are looking for.
The Trend Following Scalper (3 Time Frames) script has been developed to automate the trading activity by detecting a new trend and by scalping a fixed amount of pips each trade. That is why it is called Trend Following Scalper.
How does the script detect the new trend?
The beginning of the new trend is detected on the lower timeframe (1H is the suggested one) by joining the information of the Stochastic, MACD and Exponential Moving Average.
Once a potential trade has been detected on lower timeframe, the script confirms it by looking the upper timeframe (e.g. Daily + H4) by gathering the same indicator / parameter information.
If the threes timeframes are moving in the same direction, the script open a new trade.
Why do we need to merge lower and higher timeframe before open the trade?
The lower timeframe shows a shorter Price Action context. The short price action context has a short life! By looking at the higher time frames context the script tries to exclude the short life counter-trend moves. At the end, a new trade is open only if the higher timeframe context supports the lower timeframe indication.
What about the Risk-Reward (following RR) ratio?
The RR is set by default as 1.6 (stop loss 25 pips and take profit 40 pips).
This configuration has been heavily tested on multiple crosses and it has shown a good Equity Line with a low Drawdown.
(Note: the stop loss and take profit can be changed by the user via the parameter pages. Suggest RR > 1.5)
What about the accuracy of the Script?
The average script accuracy is > 55% on the H1 time frame (tested with various crosses).
With this accuracy, and by risking 0.6% of the capital each trade, your capital will grow > 25% every 100 trades.
What about the drawdown?
It depends on the capital and the size of the position used on each trade.
For example, with an initial capital of 1000 Euros and by risking 0.6% of the capital each trade, the drawdown is close to 3%.
(The strategy tester result has been calculated starting from January 2017. The strategy produced 527E (i.e. 52% gain) starting from a 1000E capital and risking 0.5% each trade)
Do you want to try the script? Please write me!
Do you have some question? Please write me!
Trend Following Scalper 2 Time FramesDo you think it is a good idea to use the Stochastic / MACD / EMA and cross check TWO timeframes to detect a new trend?
If you think that it would be a good idea, this is the script that you are looking for.
The Trend Following Scalper (2 Time Frames) script has been developed to automate the trading activity by detecting a new trend and by scalping a fixed amount of pips each trade. That is why it is called Trend Following Scalper.
How does the script detect the new trend?
The beginning of the new trend is detected on the lower timeframe (4H is the suggested one) by joining the information of the Stochastic, MACD and Exponential Moving Average.
Once a potential trade has been detected on lower timeframe, the script confirms it by looking the upper timeframe (e.g. Daily) by gathering the same indicator / parameter information.
If both timeframes are moving in the same direction, the script open a new trade.
Why do we need to merge lower and higher timeframe before open the trade?
The lower timeframe shows a shorter Price Action context. The short price action context has a short life! By looking at the higher time frame context the script tries to exclude the short life counter-trend moves. At the end, a new trade is open only if the higher timeframe context supports the lower timeframe indication.
What about the Risk-Reward (following RR) ratio?
The RR is set by default as 1.6 (stop loss 25 pips and take profit 40 pips).
This configuration has been heavily tested on multiple crosses and it has shown a good Equity Line with a low Drawdown.
(Note: the stop loss and take profit can be changed by the user via the parameter pages. Suggest RR > 1.5)
What about the accuracy of the Script?
The average script accuracy is > 45% (tested with various crosses).
With this accuracy, and by risking 0.6% of the capital each trade, your capital will grow > 10% every 100 trades.
What about the drawdown?
It depends on the capital and the size of the position used on each trade.
For example, with an initial capital of 1000 Euros and by risking 0.5% of the capital each trade, the drawdown is close to 6%.
Do you want to try the script? Please write me!
Do you have some question? Please write me!

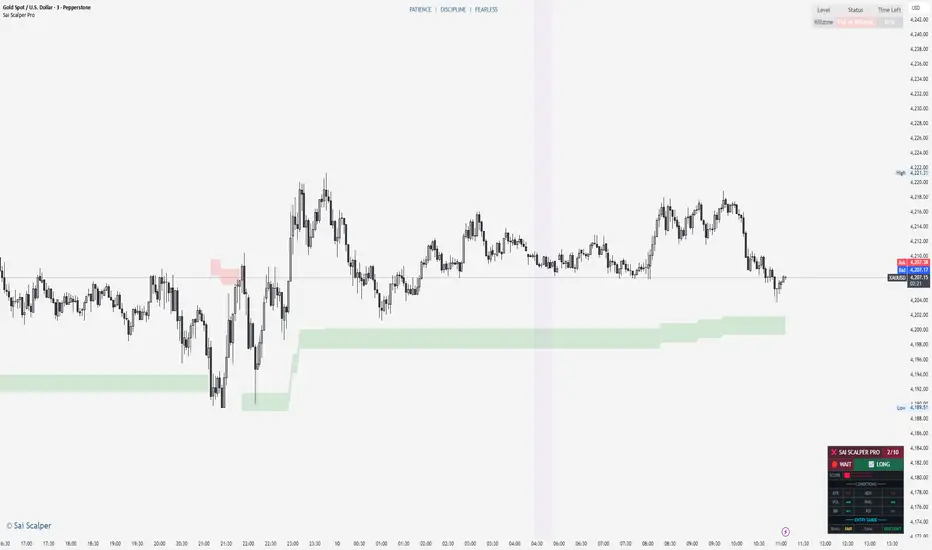
Sai Scalper ProSai Scalper Pro – Feature Summary
Trend Engine
- ATR-based trailing stop with Fibonacci levels (61.8%, 78.6%, 88.6%)
- Auto trend detection with swing point tracking
Scalping Detection (0-10 Score)
- Analyzes 7 factors: ATR compression, ADX, Volume, Range, Consolidation, RSI, BB Squeeze
- Smart state machine with hysteresis to prevent false signals
- Adjustable sensitivity & stability settings
Cloud Modes (7 Options)
- Full Zone, Entry Zone, Premium/Discount, Fib Bands, Upper/Middle/Lower Band
Pro Dashboard
- Real-time scalp score with visual meter
- Entry quality rating & zone display
- Suggested TP/SL based on ATR
- Session detection (Sydney/Tokyo/London/NY) with overlap alerts
- 3 styles (Minimal/Pro/Full) × 4 sizes × 9 positions
Alerts
- Scalp ready, Prime conditions (8+), Optimal entry zone
- Direction-specific (Long/Short bias)
Combines trend-following Fibonacci analysis with intelligent ranging detection for optimal scalping opportunities.
VWAP + EMA9 With SignalsThis script is for scalping on the 5 minute timeframe. It contains signals that indicate intersection of VWAP by the EMA9. It contains Buy signals when a candle closes above both lines indicating a quick continuation of a long position (quick scalp) as well as Sell signals when a candle closes below both lines indicating a quick continuation of a short position (quick scalp). Please note that i do not recommend entries at Buy and Sell signals during Accumulation/Consolidation. Positions should be taken with volume.

5MA+TrendMagic + Disparity Scalping (SIMPLE FILTER)5MA + Trend Filter + Disparity Scalping
This multi-purpose indicator combines a five-EMA trend structure, a volatility-based trend filter, and an ultra-fast scalping module to detect both trend continuation and sharp reversal opportunities.
It is suitable for scalping, day trading, and trend-following strategies.
🔹 Main Components
1️⃣ Five-EMA Trend Structure
Displays 9 / 20 / 50 / 100 / 200 EMA levels
Helps identify short-term and long-term market direction
Useful for support and resistance during trending markets
2️⃣ Volatility-Driven Trend Filter
Uses CCI and ATR to form a dynamic trailing line
The line switches color based on momentum direction
Can act as a trailing stop or trend confirmation filter
Helps avoid counter-trend entries
3️⃣ High-Volatility GOLD Signal
Detects sudden volatility expansions using ATR, Bollinger metrics, and volatility comparison (HV vs RV)
Marks rapid breakout situations with potential continuation setups
Available for all assets, optimized for highly volatile markets
4️⃣ Ultra-Fast Disparity Scalper
Measures price deviation from EMA5 and EMA10
Confirms exhaustion using RSI + momentum prediction from a custom RVI model
Generates early BUY/SELL reversal markers
Detects momentum shifts before price fully reacts
5️⃣ Simple Overheat Filter
Prevents trades in extremely overbought/oversold zones
Gray-colored signals indicate unsafe trades to avoid
🎯 Best Use Cases
Catching early reversals during fast movement
Identifying strong trend continuation after volatility expansion
Avoiding low-probability scalps in overheated conditions
Applying EMA structure for confluence with price action
⚠️ Note
This indicator is a decision-support tool, not a standalone signal generator.
For best precision, combine with:
Market structure
Volume analysis
Support / resistance levels
🏷️ Short Description (for compact field)
Multi-function tool combining 5EMA structure, volatility-based trend filtering, and ultra-fast reversal scalping using RSI + custom RVI momentum. Ideal for both trend continuation and rapid reversals.

Intraday Fibonacci Retracement Golden pocket for scalping# Intraday Fibonacci Retracement Golden pocket for scalping
## Overview
This advanced Pine Script indicator provides dynamic Fibonacci retracement levels specifically designed for intraday trading. Using proprietary AI-powered algorithms, the script automatically identifies optimal high and low reference points to generate precise Fibonacci levels that adapt in real-time throughout the trading day.
## Key Features
### 🎯 Dynamic Level Generation
- **Intelligent Auto-Detection**: Advanced algorithm automatically identifies key price levels using machine learning-based pattern recognition
- **Real-Time Updates**: Fibonacci levels dynamically adjust as new highs or lows are established during the session
- **Seven Core Levels**: 0% (LOD), 23.6%, 38.2%, 50%, 61.8%, 78.6%, and 100% (HOD)
### 📊 Visual Customization
- **Individual Level Control**: Show or hide any Fibonacci level independently
- **Custom Color Schemes**: Assign unique colors to each retracement level for easy identification
- **Adjustable Line Width**: Choose line thickness from 1-5 pixels for optimal chart clarity
- **Professional Labeling**: Each level displays both percentage and exact price value
### 🏆 Golden Zone Highlighting
- **Automated Zone Detection**: Automatically highlights the critical 50%-61.8% retracement zone
- **Visual Emphasis**: Shaded area between these key levels for quick visual reference
- **Customizable Transparency**: Adjust the golden zone color and opacity to match your chart theme
### 🔧 Flexible Configuration Options
#### Label Management
- **Master Toggle**: Instantly show or hide all labels with a single switch
- **Individual Label Control**: Selective visibility for each Fibonacci level label
- **Custom Label Colors**: Choose distinct colors for each label to match your trading style
- **Price Display Format**: Labels show percentage and corresponding price level
#### Level Visibility
Independent toggles for each retracement level:
- 0% (Low of Day)
- 23.6% Retracement
- 38.2% Retracement
- 50% Retracement (Midpoint)
- 61.8% Retracement (Golden Ratio)
- 78.6% Retracement
- 100% (High of Day)
### 📈 Trading Applications
**Support & Resistance**
- Identify potential reversal zones
- Spot key support and resistance levels
- Plan entry and exit points
**Price Targets**
- Set realistic profit targets based on Fibonacci extensions
- Identify potential pullback levels in trending markets
**Risk Management**
- Place stop losses at strategic Fibonacci levels
- Calculate risk-to-reward ratios using multiple levels
**Golden Zone Strategy**
- Focus on the 50%-61.8% zone for high-probability trade setups
- The golden ratio area often acts as a strong confluence zone
### 🔔 Built-in Alert System
Pre-configured alert conditions for critical price level crossings:
- 38.2% level cross
- 50% level cross (equilibrium)
- 61.8% level cross (golden ratio)
### 💡 Best Practices
**Optimal Usage**
- Works on all intraday timeframes (1min, 5min, 15min, 30min, 1hour)
- Most effective during active trading sessions
- Combine with volume analysis for confirmation
- Use alongside other technical indicators for confluence
**Chart Setup Tips**
- Adjust colors to ensure levels are visible against your chart background
- Use thicker lines on higher timeframes for better visibility
- Enable only the levels most relevant to your trading strategy
- Customize label colors to differentiate between key levels quickly
## Technical Specifications
**Performance Features**
- Maximum 500 lines supported for extensive historical analysis
- Maximum 500 labels for comprehensive price level identification
- Optimized calculations for minimal chart lag
- Real-time updates with every price tick
**Compatibility**
- Pine Script Version 6
- Compatible with all TradingView chart types
- Works across all markets (Stocks, Forex, Crypto, Futures, Options)
- Supports all timeframes from 1-minute to daily
## Installation & Setup
1. Copy the script code into TradingView Pine Editor
2. Click "Add to Chart" to apply the indicator
3. Access settings via the indicator's gear icon
4. Customize colors, labels, and visibility options to your preference
5. Save your configuration as a default template for future use
## Advanced Configuration
**For Clean Charts**
- Disable labels for a minimalist view
- Show only 50% and 61.8% levels for focused trading
- Use muted colors with higher transparency
**For Detailed Analysis**
- Enable all levels and labels
- Use high-contrast colors for each level
- Increase line width for emphasis
**For Specific Strategies**
- Mean reversion traders: Focus on 38.2%, 50%, 61.8%
- Breakout traders: Monitor 0% and 100% levels closely
- Scalpers: Use golden zone exclusively with tight stops
## Algorithm Intelligence
The indicator employs sophisticated algorithms to:
- Automatically calculate optimal reference points
- Adapt to changing market conditions
- Filter out noise and false signals
- Provide consistent, reliable level placement
This ensures that traders receive accurate, actionable Fibonacci levels without manual intervention or subjective placement decisions.
🎁 Free Trial Access
Interested in trying this indicator?
I'm offering a ONE MONTH FREE TRIAL to help you experience the power of dynamic Fibonacci levels in your trading.
To request your trial access:
Send me a Direct Message (DM) on TradingView
Include "Fib Trial Request" in your message
I'll respond with access instructions within 24 hours
This trial includes:
✅ Full access to all indicator features
✅ All customization options unlocked
✅ Priority support during trial period
✅ Setup assistance and configuration help
Don't miss this opportunity to enhance your intraday trading with professional-grade Fibonacci analysis!
📞 Author's Notes
For questions, feedback, or trial access requests, feel free to reach out via DM. I'm committed to helping traders succeed and continuously improving this tool based on user feedback.
Happy Trading!
---
**Disclaimer**: This indicator is a technical analysis tool. Past performance does not guarantee future results. Always use proper risk management and combine with other forms of analysis for trading decisions.

WeAxes MTF Scalper [LITE] WeAxes MTF Scalper
Professional Multi-Timeframe Alignment Tool - LITE Version
What This LITE Version Offers:
3-Timeframe Sync: Monitor 1min, 15min, and 1hr trends simultaneously
Visual Alignment System: Color-coded candles for perfect setups
Quick Setup Recognition: Instant HIGH/MEDIUM/LOW quality ratings
Clean Data Display: Essential alignment information at a glance
Perfect for Scalping:
Green Candles: Perfect bullish alignment across all timeframes
Red Candles: Perfect bearish alignment across all timeframes
Setup Quality: Know immediately if conditions are favorable
Multi-Timeframe Context: Never trade blind again
How to Use:
1. HIGH Quality Setups (Green/Red candles): Highest probability trades
2. MEDIUM Quality: All trends aligned, good for trend following
3. LOW Quality: Mixed signals, better to wait for alignment
PRO Version Includes:
- Advanced volume profiling across all timeframes
- Momentum strength calculations
- Detailed market structure analysis
- Smart Money Concepts integration
- Complete volume analysis
- And much more...
This LITE version gives you a taste of professional multi-timeframe analysis. Contact for PRO version access with full features.
Disclaimer: Use proper risk management. This tool assists analysis but doesn't guarantee profits.
SOL Dashboard v6 — Investor / Swing / Scalp (VWAP, ATR, RS (SCP)
**SOL Dashboard v6 — Investor / Swing / Scalp (VWAP, ATR, RSI, BTC\Ð influence, noise-filters)**
**In short:** a universal indicator for SOLUSDT (Spot/Futures), combining three analysis horizons — Investor (D1), Swing (H1/H4), and Scalp (5m/3m/1m) — in a single script. It provides clean signals (arrows), a summary table of layer states, alerts, as well as a set of noise filters (VWAP/RSI/volume/EMA “gap”/candle body requirement/cooldown). Optional BTC/ETH trend influence filters are available. Suitable for both spot and futures.
---
### What the indicator does
**Investor (HTF, default D1):** market background. EMA(50/200) → defines long-term phase (BULL/BEAR/NEUTRAL).
**Swing (MTF, default H1):** medium-term direction. EMA(20/50) + weekly VWAP (option).
**Scalp (LTF, default 5m):** quick entries. EMA(9/21) → SCALP BUY/SELL arrows strictly at the crossover candle, plus filters.
---
### Visual elements
* EMA lines for each layer (toggled on/off).
* VWAP lines: daily (scalp filter) and weekly (swing filter).
* SCALP BUY / SCALP SELL arrows (optional).
* Table in the top-right corner: Investor/Swing/Scalp modes and hints (including BTC/ETH states if influence is enabled).
* (Optional) Debug label — shows which filter is blocking the signal (RSI/VWAP/GAP/BODY/VOL/AGREE/CD).
---
### Signals (arrow logic)
**Base trigger:** crossover(EMA Fast, EMA Slow) on bar close (default EMA9/21 for LTF).
Arrows appear only if confirmations are met:
1. EMA slope matches signal (both rising for BUY / both falling for SELL).
2. Candle closed on the “correct” side of both EMAs (above/below).
3. Noise filters (toggleable/configurable):
* VWAP (daily): BUY only above VWAP; SELL only below.
* RSI(14): BUY if RSI>50; SELL if RSI<50.
* EMA-Gap (%): minimum difference between Fast/Slow EMAs (avoids micro-crossovers in chop).
* Body ratio: minimum body-to-range ratio (filters out dojis/wicks).
* Volume filter: volume ≥ median over N bars (default 20).
* Cooldown: minimum bars between same-direction signals.
4. Trend agreement (optional): requires alignment with Swing and BTC/ETH Swing modes.
**Result:** an arrow appears at the crossover only if all active filters are satisfied.
---
### Alerts
* **SCALP BUY (filtered):** “ETH/SOL scalp BUY (cross-confirmed)”
* **SCALP SELL (filtered):** “ETH/SOL scalp SELL (cross-confirmed)”
* (Optional) EXIT signals (if included in your build): exit on opposite side of EMA25 or VWAP.
---
### BTC/ETH influence (optional)
* Toggleable trend filters:
* Script checks BTCUSDT and/or ETHUSDT Swing states (EMA20/50 on H1/H4).
* BUY only if BTC/ETH are in BULL and SOL(H1) is BULL.
* SELL only if all corresponding Swing modes are BEAR.
This increases accuracy in trending markets (can be disabled in chop if you want more entries).
---
### Recommended presets
**1) Conservative (cleaner, less noise):**
* LTF = 5m (or 3m); EMA 9/21
* VWAP daily: ON, RSI: ON
* minEmaGapPct: 0.12–0.14%
* minBodyRatio: 0.60–0.70
* cooldownBars: 7–10
* BTC/ETH agreement: ON
* confirmBars: 1 (or 0 in trends)
**2) Base (balanced):**
* LTF = 5m; EMA 9/21
* VWAP: ON, RSI: ON
* minEmaGapPct: 0.08–0.12%
* minBodyRatio: 0.55–0.65
* cooldownBars: 5–7
* BTC/ETH agreement: ON in trend / OFF in chop
* confirmBars: 0 (or 1 in chop)
**3) Aggressive (more entries):**
* LTF = 3m or 1m; EMA 7/14 (or 7/25 if enabled)
* VWAP: ON, RSI: ON
* minEmaGapPct: 0.06–0.08%
* minBodyRatio: 0.50
* cooldownBars: 3–5
* BTC/ETH agreement: OFF in chop
* confirmBars: 0 (or 1 if too many false signals)
---
### How to read the summary table
* **Investor (D1):** EMA50 vs EMA200 → BULL/BEAR/NEUTRAL.
* **Swing (H1/H4):** EMA20 vs EMA50 (+ W-VWAP) → trade direction.
* **Scalp (LTF):** EMA Fast vs EMA Slow → short-term phase.
* **BTC / ETH (Swing):** their states (if influence enabled).
👉 Alignment of Investor + Swing + Scalp in one direction = maximum trend strength.
👉 Disagreement = reduce position size / wait for confirmation.
---
### Practical application
* **Entries:** SCALP arrows in Swing direction (and optionally BTC/ETH) + above/below VWAP.
* **Stops:** recommended ATR(14, LTF) × 1.6–2.0 (or beyond EMA21/EMA25).
* **Targets:** at least 1.8–2.2 R, take 30–50% at +1R, leave remainder as trailing (EMA9/EMA25/VWAP).
* **Trend filter:** trade longs mainly when price > daily VWAP and Swing = BULL (and vice versa).
---
### Settings (key parameters)
* Independent TFs for Investor / Swing / Scalp.
* EMA Fast/Slow set separately for each layer.
* VWAP (Daily/Weekly) as toggleable filters.
* RSI filter (BUY >50 / SELL <50).
* Noise filters: EMA-Gap, Body ratio, Volume ≥ median, Cooldown.
* Trend agreement: BTC/ETH Swing + SOL Swing.
* Debug mode: shows which filter is blocking a signal.
---
### FAQ
**Why no arrows when “crossover is visible”?**
Because arrows are plotted on bar close only if all active filters (VWAP/RSI/GAP/BODY/VOL/AGREE/CD) are satisfied. Enable Debug to see which filter blocks the signal.
**When to enable BTC/ETH influence?**
In trending markets → ON (accuracy ↑). In chop, if you want more entries → OFF.
**Works on Spot/Futures?**
Yes. But remember: futures fees are charged on position notional, not margin — factor this into risk management.
---
### Disclaimer
This is a research tool. Not financial advice. Trading crypto assets and derivatives carries high risk (especially with leverage). Always use stop-losses and manage risk per trade.
---
\#SOL #SOLUSDT #Scalping #Swing #Investor #VWAP #EMA #RSI #ATR #Crypto #Futures #NoiseFilters #BTCInfluence #ETHInfluence #TrendFilter #TradingView

OctaScalp Precision Pro [By TraderMan]What is OctaScalp Precision Pro ? 🚀
OctaScalp Precision is a powerful scalping indicator designed for fast, short-term trades. It combines eight technical indicators to generate 💪 high-accuracy buy 📗 and sell 📕 signals. Optimized for scalpers, this tool targets small price movements in low timeframes (1M, 5M). With visual lines 📈, labels 🎯, and Telegram alerts 📬, it simplifies quick decision-making, enhances risk management, and tracks trade performance.
What Does It Do? 🎯
Fast Signals: Produces reliable buy/sell signals using a consensus of eight indicators.
Risk Management: Offers automated Take Profit (TP) 🟢 and Stop Loss (SL) 🔴 levels with a 2:1 reward/risk ratio.
Trend Confirmation: Validates short-term trends with a 30-period EMA zone.
Performance Tracking: Records trade success rates (%) and the last 5 trades 📊.
User-Friendly: Displays market strength, signal type, and trade details in a top-right table.
Alerts: Sends Telegram-compatible notifications for new positions and trade results 📲.
How Does It Work? 🛠️
OctaScalp Precision integrates eight technical indicators (RSI, MACD, Stochastic, Momentum, 200-period EMA, Supertrend, CCI, OBV) for robust analysis. Each indicator contributes 0 or 1 point to a bullish 📈 or bearish 📉 score (max 8 points). Signals are generated as follows:
Buy Signal 📗: Bullish score ≥6 and higher than bearish score.
Sell Signal 📕: Bearish score ≥6 and higher than bullish score.
EMA Zone 📏: A zone (default 0.1%) around a 30-period EMA confirms trends. Price staying above or below the zone for 4 bars validates the direction:
Up Direction: Price above zone, color green 🟢.
Down Direction: Price below zone, color red 🔴.
Neutral: Price within zone, color gray ⚪.
Entry/Exit: Entries are triggered on new signals, with TP (2% profit) and SL (1% risk) auto-calculated.
Table & Alerts: Displays market strength (% bull/bear), signal type, entry/TP/SL, and success rate in a table. Telegram alerts provide instant notifications.
How to Use It? 📚
Setup 🖥️:
Add the indicator to TradingView and use default settings or customize (EMA length, zone width, etc.).
Best for low timeframes (1M, 5M).
Signal Monitoring 🔍:
Check the table: Bull Strength 📗 and Bear Strength 📕 percentages indicate signal reliability.
Confirm Buy (📗 BUY) or Sell (📕 SELL) signals when trendSignal is 1 or -1.
Entering a Position 🎯:
Buy: trendSignal = 1, bullish score ≥6, and higher than bearish score, enter at the entry price.
Sell: trendSignal = -1, bearish score ≥6, and higher than bullish score, enter at the entry price.
TP and SL: Follow the green (TP) 🟢 and red (SL) 🔴 lines on the chart.
Exiting 🏁:
If price hits TP, trade is marked ✅ successful; if SL, marked ❌ failed.
Results are shown in the “Last 5 Trades” 📜 section of the table.
Setting Alerts 📬:
Enable alerts in TradingView. Receive Telegram notifications for new positions and trade outcomes.
Position Entry Strategy 💡
Entry Conditions:
For Buy: Bullish score ≥6, trendSignal = 1, price above EMA zone 🟢.
For Sell: Bearish score ≥6, trendSignal = -1, price below EMA zone 🔴.
Check bull/bear strength in the table (70%+ is ideal for strong signals).
Additional Confirmation:
Use on high-volume assets (e.g., BTC/USD, EUR/USD).
Validate signals with support/resistance levels.
Be cautious in ranging markets; false signals may increase.
Risk Management:
Stick to the 2:1 reward/risk ratio (TP 2%, SL 1%).
Limit position size to 1-2% of your account.
Tips and Recommendations 🌟
Best Markets: Ideal for volatile markets (crypto, forex) and low timeframes (1M, 5M).
Settings: Adjust EMA length (default 30) or zone width (0.1%) based on the market.
Backtesting: Test on historical data to evaluate success rate 📊.
Discipline: Follow signals strictly and avoid emotional decisions.
OctaScalp Precision makes scalping fast, precise, and reliable! 🚀

Improved Scalping Consolidation and Squeeze IndicatorThe Improved Scalping Consolidation and Squeeze Indicator (Improved Scalp C&S) is a custom TradingView indicator designed for short-term trading, specifically scalping. It detects price consolidation and potential breakout scenarios using a combination of technical analysis tools, such as the Rate of Change (ROC), Relative Strength Index (RSI), Moving Average Convergence Divergence (MACD), Bollinger Bands, and Keltner Channels. To reduce the number of false signals, this improved version introduces a "consolidation strength" parameter, which represents the minimum number of consecutive bars required for a valid consolidation or squeeze signal.
How it works:
Consolidation Detection:
The indicator identifies price consolidation when the following conditions are met:
a. RSI is between 45 and 55, indicating a lack of strong momentum.
b. The absolute value of the MACD histogram is less than 0.1% of the closing price, suggesting a lack of directional movement.
c. The Rate of Change (ROC) is less than 1.5%, indicating relatively stable prices over the specified period.
Squeeze Detection:
The indicator detects a squeeze (a potential breakout scenario) when the Bollinger Bands are within the Keltner Channels, represented by the following conditions:
a. The lower Bollinger Band is above the lower Keltner Channel.
b. The upper Bollinger Band is below the upper Keltner Channel.
Consolidation Strength:
The consolidation strength parameter filters out weaker signals by requiring a minimum number of consecutive bars for a valid consolidation or squeeze signal. By adjusting this parameter, traders can control the sensitivity of the indicator to short-term price movements and potentially reduce the number of false signals.
When the consolidation strength criteria are met, the indicator colors the price bars within the pattern yellow for consolidation and orange for a squeeze, signaling potential trading opportunities.
Trading Strategy:
The Improved Scalping Consolidation and Squeeze Indicator can be used in various ways, depending on the trader's strategy and risk appetite. Here are some suggestions:
Range trading: During consolidation (yellow bars), traders can buy at support levels and sell at resistance levels within the range, using stop-loss orders to manage risk. However, this approach might not work well in the case of a sudden breakout.
Breakout trading: When a squeeze is detected (orange bars), traders can wait for a confirmed breakout from the consolidation pattern before entering a trade. A breakout can be confirmed by a strong price move accompanied by increased volume, a significant change in momentum, or a breach of important support or resistance levels.
Momentum-based strategies: Traders can use other momentum-based indicators (e.g., Stochastic Oscillator, On Balance Volume) in conjunction with the Improved Scalp C&S indicator to identify potential entry and exit points during consolidation or breakout scenarios.
Fine-tuning the consolidation strength: Adjust the "consolidation strength" input to find the optimal balance between the number of signals and their accuracy. A higher value will result in fewer signals, potentially reducing the number of false signals, but it may also make the indicator less sensitive to short-term price movements.
