Cari dalam skrip untuk "scalp"

TTM scalper indicator Backtest TTM scalper indicator of John Carter’s Scalper Buys and Sells. The methodology
is a close approximation of the one described in his book Mastering the Trade.
The book is highly recommended. Note the squares are not real-time but will
show up once the third bar has confirmed a reversal.
You can change long to short in the Input Settings
WARNING:
- For purpose educate only
- This script to change bars colors.

Crypto Scalping Strategy by SAIFOverview
An optimized scalping strategy designed for cryptocurrency markets, focusing on breakout opportunities with strict risk controls and optional safe compounding features. This strategy combines price action, volume analysis, and multi-timeframe trend confirmation.
Key Features
Breakout Detection System
Identifies significant price breakouts using dynamic channel analysis
Confirms breakouts with volume surge validation
Filters trades based on multi-timeframe trend alignment
Multi-Timeframe Trend Confirmation
Analyzes 1-hour and 4-hour timeframes for trend direction
Only takes trades aligned with higher timeframe trends
Uses long-term moving averages for trend validation
Advanced Risk Management
Conservative default risk: 1% per trade
ATR-based stop-loss placement (2x ATR)
Trailing stop mechanism to protect profits
Minimum profit target before trailing activates
Built-in position sizing based on account equity
Safe Capital Management Options
Fixed Capital Mode: Trade with consistent position sizes
Safe Compounding Mode: Gradually scales position size based on realized profits only
Drawdown Protection: 80% equity floor prevents excessive capital erosion
Leverage Control: 10x leverage factored into position calculations
Technical Filters
Momentum confirmation via oscillator conditions
Directional movement analysis
Volume threshold requirements
Trend strength validation
Position Sizing
The strategy automatically calculates position sizes based on:
Your specified risk percentage
Current ATR volatility
Available leverage
Account equity (with optional compounding)
Trade Management
Entry: Executes on confirmed breakouts with volume and trend alignment
Stop Loss: Placed at 2x ATR from entry
Take Profit: Uses trailing stops that activate after minimum profit threshold
Exit: Automatically managed through strategy exits
Customization Options
Adjustable channel length for breakout detection
Configurable volume multiplier for surge detection
Customizable oscillator thresholds
Flexible ATR period for volatility measurement
Optional compounding vs. fixed capital modes
Adjustable trailing stop parameters
Visual Features
Channel boundaries plotted on chart
Entry signals marked with arrows
Background coloring indicates trend direction
Real-time info table shows:
Current risk level
Compounding status
Capital values
Drawdown protection status
Alert Capabilities
Built-in alert conditions for:
Buy signals (breakout opportunities)
Sell signals (breakdown opportunities)
Important Disclaimers
⚠️ Educational Purpose Only: This strategy is provided for educational and research purposes. It is not investment advice.
⚠️ High-Risk Trading: Scalping and leverage trading carry substantial risk of loss. Cryptocurrency markets are highly volatile.
⚠️ Not Financial Advice: This tool does not constitute financial, investment, or trading advice. Always conduct your own research and consult qualified professionals.
⚠️ Leverage Warning: This strategy uses 10x leverage, which can amplify both gains and losses significantly.
⚠️ Backtesting Limitations: Past performance does not guarantee future results. Real trading involves slippage, execution delays, and emotional factors not present in backtesting.
⚠️ Capital at Risk: Only trade with capital you can afford to lose completely. Never trade with borrowed money or funds needed for living expenses.
Commission & Fees
Commission: 0.13% per trade
Initial capital: $100 (default)
Commission costs are factored into backtest results
Best Practices
Start Small: Begin with minimum capital and conservative risk settings
Test Thoroughly: Backtest across different market conditions and timeframes
Monitor Performance: Track win rate, profit factor, and maximum drawdown
Adjust Parameters: Optimize settings for your specific trading pairs
Use Alerts: Set up notifications to avoid missing opportunities
Manage Emotions: Follow the strategy rules consistently without override
Recommended Markets
High liquidity cryptocurrency pairs (BTC, ETH major pairs)
Assets with clear trending behavior
Markets with sufficient volume for scalping
Timeframes: 1H to 4H charts recommended
Risk Reminder
Scalping requires:
Quick decision-making
Tight risk management
Consistent discipline
Understanding of market microstructure
Proper capitalization
Always practice proper risk management. The strategy includes safety features, but no system can eliminate trading risk entirely. Trade responsibly.

MA Crossover Scalper [4H]//@version=5
indicator("MA Crossover Scalper ", overlay=false)
// Market Cap Filter (Volume as proxy)
volumeValid = volume >= 500000 and volume <= 4000000
// MA Crossover System
ma9 = ta.sma(close, 9)
ma21 = ta.sma(close, 21)
bullishCross = ta.crossover(ma9, ma21) and close > ma21
bearishCross = ta.crossunder(ma9, ma21) and close < ma21
// Volume Confirmation
volumeSpike = volume > ta.sma(volume, 20) * 1.3
// Final Signals
bullSignal = bullishCross and volumeSpike and volumeValid
bearSignal = bearishCross and volumeSpike and volumeValid
// Output for Screener
plot(bullSignal ? 1 : 0, "Bull MA Cross", color=color.green)
plot(bearSignal ? 1 : 0, "Bear MA Cross", color=color.red)

Auto Trend & Scalping Pro Atilla SPECIALAUTO TREND & SCALPING PRO — ATILLA SPECIAL EDITION
Auto Trend & Scalping Pro is an advanced, multi-confirmation algorithm designed for fast scalping (1m–5m) and reliable trend-following (15m–4h).
This special edition is custom-optimized for Atilla, combining EMA structure, momentum indicators, and volatility filters to generate clean, high-accuracy trading conditions.
---
🔥 Core Features
• Multi-EMA Trend Engine (13/50/200)
Analyzes the structure of the trend and generates a 0–200 Trend Power Score:
0–50 → Weak
50–100 → Medium
100–170 → Strong
170–200 → Very Strong
• 4-Indicator Confirmation Voting
The system uses:
MACD (momentum shift)
RSI (zone pressure)
STC (smooth trend phase)
ATR (volatility strength)
Each indicator votes Bull / Bear.
Total votes produce a 0–100% confirmation power.
• Sideways Market Filter
Auto-detects consolidation using:
EMA distance %
ATR volatility %
RSI 45–55 neutral zone
When sideways → All signals are blocked to avoid fake entries.
• Auto “LONG READY / SHORT READY” States
Signals activate ONLY when:
Trend is strong
Indicators confirm the direction
Market is not sideways
This eliminates noise and prevents false entries.
---
🟩 Real-Time Dashboard (Top-Right Panel)
Displays:
Market Mode (LONG READY / SHORT READY / WAIT / SIDEWAYS STOP)
EMA Power
Confirmation Strength (%)
MACD / RSI / STC / VOL status
Trend strength & filter state
All updates in real time on every candle.
---
⚡️ Scalping Optimized
Perfect for:
1 minute
3 minute
5 minute Ultra fast trend reading & correction detection.
Also stable on:
15m
30m
1H–4H (trend-following mode)
Works on all crypto pairs including BTC, ETH, BNB, SOL, AVAX, ADA, and more.
---
📌 Extra Notes
No repaint
Safe entry logic
Filters fake breakouts
Professional-grade clarity

Algosnipe trading day scalperThe Algosnipe Trading Day Scalper is an intraday trading strategy designed for active traders who aim to capture short-term price movements within the trading session. It blends price action, volatility, and volume-based logic to identify high-probability entry and exit zones while minimizing exposure time in the market.

Nifty Futures Momentum ScalperNifty Futures Momentum Scalper
Backtesting
VPA , RSI, momentum trades with EMA crossover

💎 Trend Master Pro Scalping MTFTrend Master Pro Scalping MTF is a professional-grade indicator designed for intraday trading and scalping, optimized for 1M, 5M, and 15M timeframes. It combines multiple technical filters to provide high-confidence breakout and trend signals with visual clarity.
Key Features:
Multi-indicator analysis: EMA, RSI, ATR, SuperTrend, and volume.
Multi-Timeframe (MTF) filter: signals are validated only if the higher timeframe trend is aligned.
Clear visual signals: colored triangles and dynamic labels showing signal strength: A++, A+, A, B.
Confirmation dashboard: instantly see EMA trend, RSI strength, volume, ATR activity, SuperTrend direction, and final signal on your chart.
Reliable alerts: fixed alert messages compatible with TradingView, avoiding Pine Script errors.
Customizable parameters: adjust EMA, RSI, ATR, volume, and SuperTrend settings to match your scalping or day trading style.
How to Use:
Select your desired timeframe: 1M, 5M, or 15M.
Look for signals rated A++ or A+ for maximum probability.
Confirm trends using labels and the dashboard before entering trades.
Receive real-time notifications via alerts when confirmed signals occur.
Benefits:
Ideal for quick scalping and intraday strategies.
Reduces false signals with MTF trend filtering.
Professional visualization for fast and confident decision-making.
Recommendations:
Test on a demo account before trading live.
Adjust parameters to fit your asset and timeframe.
Combine with proper risk management strategies.

15-Min RSI Scalper [SwissAlgo]15-Min RSI Scalper
Tracks RSI Momentum Loss and Gain to Generate Signals
-------------------------------------------------------
WHAT THIS INDICATOR CALCULATES
This indicator attempts to identify RSI directional changes (RSI momentum) using a step-by-step "ladder" method. It reads RSI(14) from the next higher timeframe relative to your chart. On a 15-minute chart, it uses 1-hour RSI. On a 5-minute chart, it uses 15-minute RSI, and so on.
How the ladder logic works:
The indicator doesn't track RSI all the time. It only starts tracking when RSI crosses into potentially extreme territory (these are called "events" in the code):
For sell signals : when RSI crosses above a dynamic upper threshold (typically between 60-80, calculated as the 90th percentile of recent RSI)
For buy signals : when RSI crosses below a dynamic lower threshold (typically between 20-40, calculated as the 10th percentile of recent RSI)
Once tracking begins, RSI movement is divided into 2-point steps (boxes). The indicator counts how many boxes RSI climbs or falls.
A signal generates only when:
RSI reverses direction by at least 2 boxes (4 RSI points) from its extreme
RSI holds that reversal for 3 consecutive confirmed bars
Example: Dynamic threshold is at 68. RSI crosses above 68 → tracking starts. RSI climbs to 76 (4 boxes up). Then it drops back to 72 and stays below that level for 3 bars → sell signal prints. The buy signal works the same way in reverse.
-------------------------------------------------------
SIGNAL GENERATION METHODOLOGY
Sell Signal (Red Triangle)
RSI crosses above a dynamic start level (calculated as the 90th percentile of the last 1000 bars, constrained between 60-80)
Indicator tracks upward progression in 2-point boxes
RSI reverses and drops below a boundary 2 boxes below the highest box reached
RSI remains below that boundary for 3 confirmed bars
Red triangle plots above price
Reset condition: RSI returns below 50
Buy Signal (Green Triangle)
RSI crosses below a dynamic start level (10th percentile of last 1000 bars, constrained between 20-40)
Indicator tracks downward progression in 2-point boxes
RSI reverses and rises above a boundary 2 boxes above the lowest box reached
RSI remains above that boundary for 3 confirmed bars
Green triangle plots below price
Reset condition: RSI returns above 50
-------------------------------------------------------
TECHNICAL PARAMETERS
All parameters are hardcoded:
RSI Period: 14
Box Size: 2 RSI points
Reversal Threshold: 2 boxes (4 RSI points)
Confirmation Period: 3 bars
Reset Level: RSI 50
Sell Start Range: 60-80 (dynamic)
Buy Start Range: 20-40 (dynamic)
Lookback for Percentile: 1000 bars
Note: Since the code is open source, users can modify these hardcoded values directly in the script to adjust sensitivity. For example, increasing the confirmation period from 3 to 5 bars will produce fewer but more conservative signals. Decreasing the box size from 2 to 1 will make the indicator more responsive to smaller RSI movements.
-------------------------------------------------------
KEY FEATURES
Automatic Higher Timeframe RSI
When applied to a 15-minute chart, the indicator automatically reads 1-hour RSI data. This is the next standard timeframe above 15 minutes in the indicator's logic.
Dynamic Adaptive Start Levels
Sell signals use the 90th percentile of RSI over the last 1000 bars, constrained between 60-80. Buy signals use the 10th percentile, constrained between 20-40. These thresholds recalculate on each bar based on recent data.
Ladder Box System
RSI movements are tracked in 2-point boxes. The indicator requires a 2-box reversal followed by 3 consecutive bars maintaining that reversal before generating a signal.
Dual Signal Output
Red down-triangles plot above price when the sell signal conditions are met. Green up-triangles plot below the price when buy signal conditions are met.
-------------------------------------------------------
REPAINTING
This indicator does not repaint. All calculations use "barstate.isconfirmed" to ensure signals appear only on closed bars. The request.security() call uses lookahead=barmerge.lookahead_off to prevent forward-looking bias.
-------------------------------------------------------
INTENDED CHART TIMEFRAME
This indicator is designed for use on 15-minute charts. The visual reminder table at the top of the chart indicates this requirement.
On a 15-minute chart:
RSI data comes from the 1-hour timeframe
Signals reflect 1-hour momentum shifts
3-bar confirmation equals 45 minutes of price action
Using it on other timeframes will change the higher timeframe RSI source and may produce different behavior.
-------------------------------------------------------
WHAT THIS INDICATOR DOES NOT DO
Does not predict future price movements
Does not provide entry or exit advice
Does not guarantee profitable trades
Does not replace comprehensive technical analysis
Does not account for fundamental factors, news events, or market structure
Does not adapt to all market conditions equally
-------------------------------------------------------
EDUCATIONAL USE
This indicator demonstrates one approach to momentum reversal detection using:
Multi-timeframe analysis
Adaptive thresholds via percentile calculation
Step-wise momentum tracking
Multi-bar confirmation logic
It is designed as a technical study, not a trading system. Signals represent calculated conditions based on RSI behavior, not trade recommendations. Always do your own analysis before taking market positions.
-------------------------------------------------------
RISK DISCLOSURE
Trading involves substantial risk of loss. This indicator:
Is for educational and informational purposes only
Does not constitute financial, investment, or trading advice
Should not be used as the sole basis for trading decisions
Has not been tested across all market conditions
May produce false signals, late signals, or no signals in certain conditions
Past performance of any indicator does not predict future results. Users must conduct their own analysis and risk assessment before making trading decisions. Always use proper risk management, including stop losses and position sizing appropriate to your account and risk tolerance.
MIT LICENSE
This code is open source and provided as-is without warranties of any kind. You may use, modify, and distribute it freely under the MIT License.

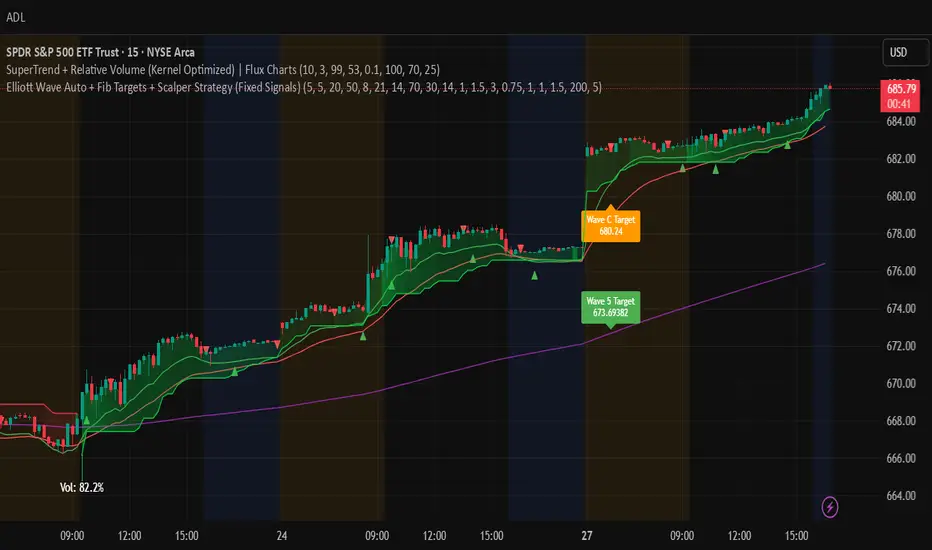
Elliott Wave Auto + Fib Targets + Scalper Strategy (Fixed)// Elliott Wave Auto + Fib Targets + Scalper Strategy
//
// Fixed by expert trader:
// - Replaced table with label-based visualization to avoid 'Column 2 is out of table bounds' error.
// - Uses label.new to display buy/sell signal counts in top-right corner, mimicking table layout.
// - Fixed array.sum() error: Replaced invalid range-based array.sum() with custom sum_array_range() function.
// - Removed barstate usage to fix 'Undeclared identifier barstate' error.
// - Replaced barstate.isconfirmed with true (process every bar).
// - Replaced barstate.isfirstconfirmed with bar_index == 0 (first bar).
// - Replaced strategy.alert with label.new for long/short entry signals (buy/sell markers).
// - Fixed array index out-of-bounds: Protected array.get() calls with size checks.
// - Fixed pyramiding: Set constant pyramiding=4 (max 5 entries); use allow_pyramiding to limit entries.
// - Fixed default_qty_value: Set constant default_qty_value=100.0; use entry_size_pct to scale qty.
// - Replaced alertcondition with labels for Elliott Wave patterns.
// - Fixed partial exits: 50% at TP1 with fixed SL, 50% at TP2 with fixed SL or trailing.
// - Fixed Elliott Wave pivot indexing for alternating H/L check.
// - Ensured proper position sizing and exit logic.
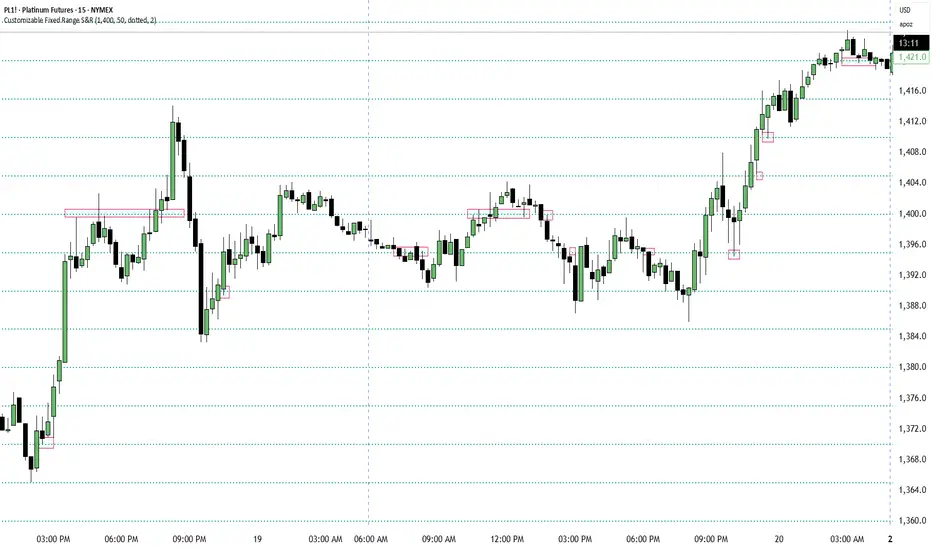
Customizable Fixed Range Support & ResistanceTraders often overlook the fixed range support and resistance, especially if they are round numbers. If you make some observations, you will see that buyers and sellers engage in numerous transactions at those levels. You can have a look at the screenshots presented here (find the red boxes!) or check it out for yourselves on the instrument's chart that you prefer. This indicator will be a big help for day traders and scalpers to set their entries, profit targets, and stop loss levels.
Hilly's Advanced Crypto Scalping Strategy - 5 Min ChartTo determine the "best" input parameters for the Advanced Crypto Scalping Strategy on a 5-minute chart, we need to consider the goals of optimizing for profitability, minimizing false signals, and adapting to the volatile nature of cryptocurrencies. The default parameters in the script are a starting point, but the optimal values depend on the specific cryptocurrency pair, market conditions, and your risk tolerance. Below, I'll provide recommended input values based on common practices in crypto scalping, along with reasoning for each parameter. I’ll also suggest how to fine-tune them using TradingView’s backtesting and optimization tools.
Recommended Input Parameters
These values are tailored for a 5-minute chart for liquid cryptocurrencies like BTC/USD or ETH/USD on exchanges like Binance or Coinbase. They aim to balance signal frequency and accuracy for day trading.
Fast EMA Length (emaFastLen): 9
Reasoning: A 9-period EMA is commonly used in scalping to capture short-term price movements while remaining sensitive to recent price action. It reacts faster than the default 10, aligning with the 5-minute timeframe.
Slow EMA Length (emaSlowLen): 21
Reasoning: A 21-period EMA provides a good balance for identifying the broader trend on a 5-minute chart. It’s slightly longer than the default 20 to reduce noise while confirming the trend direction.
RSI Length (rsiLen): 14
Reasoning: The default 14-period RSI is a standard choice for momentum analysis. It works well for detecting overbought/oversold conditions without being too sensitive on short timeframes.
RSI Overbought (rsiOverbought): 75
Reasoning: Raising the overbought threshold to 75 (from 70) reduces false sell signals in strong bullish trends, which are common in crypto markets.
RSI Oversold (rsiOversold): 25
Reasoning: Lowering the oversold threshold to 25 (from 30) filters out weaker buy signals, ensuring entries occur during stronger reversals.
MACD Fast Length (macdFast): 12
Reasoning: The default 12-period fast EMA for MACD is effective for capturing short-term momentum shifts in crypto, aligning with scalping goals.
MACD Slow Length (macdSlow): 26
Reasoning: The default 26-period slow EMA is a standard setting that works well for confirming momentum trends without lagging too much.
MACD Signal Smoothing (macdSignal): 9
Reasoning: The default 9-period signal line is widely used and provides a good balance for smoothing MACD crossovers on a 5-minute chart.
Bollinger Bands Length (bbLen): 20
Reasoning: The default 20-period Bollinger Bands are effective for identifying volatility breakouts, which are key for scalping in crypto markets.
Bollinger Bands Multiplier (bbMult): 2.0
Reasoning: A 2.0 multiplier is standard and captures most price action within the bands. Increasing it to 2.5 could reduce signals but improve accuracy in highly volatile markets.
Stop Loss % (slPerc): 0.8%
Reasoning: A tighter stop loss of 0.8% (from 1.0%) suits the high volatility of crypto, helping to limit losses on false breakouts while keeping risk manageable.
Take Profit % (tpPerc): 1.5%
Reasoning: A 1.5% take-profit target (from 2.0%) aligns with scalping’s goal of capturing small, frequent gains. Crypto markets often see quick reversals, so a smaller target increases the likelihood of hitting profits.
Use Candlestick Patterns (useCandlePatterns): True
Reasoning: Enabling candlestick patterns (e.g., engulfing, hammer) adds confirmation to signals, reducing false entries in choppy markets.
Use Volume Filter (useVolumeFilter): True
Reasoning: The volume filter ensures signals occur during high-volume breakouts, which are more likely to sustain in crypto markets.
Signal Arrow Size (signalSize): 2.0
Reasoning: Increasing the arrow size to 2.0 (from 1.5) makes buy/sell signals more visible on the chart, especially on smaller screens or volatile price action.
Background Highlight Transparency (bgTransparency): 85
Reasoning: A slightly higher transparency (85 from 80) keeps the background highlights subtle but visible, avoiding chart clutter.
How to Apply These Parameters
Copy the Script: Use the Pine Script provided in the previous response.
Paste in TradingView: Open TradingView, go to the Pine Editor, paste the code, and click "Add to Chart."
Set Parameters: In the strategy settings, manually input the recommended values above or adjust them via the input fields.
Test on a 5-Minute Chart: Apply the strategy to a liquid crypto pair (e.g., BTC/USDT, ETH/USDT) on a 5-minute chart.
Fine-Tuning for Optimal Performance
To find the absolute best parameters for your specific trading pair and market conditions, use TradingView’s Strategy Tester and optimization features:
Backtesting:
Run the strategy on historical data for your chosen pair (e.g., BTC/USDT on Binance).
Check metrics like Net Profit, Profit Factor, Win Rate, and Max Drawdown in the Strategy Tester.
Focus on a sample period of at least 1–3 months to capture various market conditions (bull, bear, sideways).
Parameter Optimization:
In the Strategy Tester, click the settings gear next to the strategy name.
Enable optimization for key inputs like emaFastLen (test range: 7–12), emaSlowLen (15–25), slPerc (0.5–1.5), and tpPerc (1.0–3.0).
Run the optimization to find the combination with the highest net profit or best Sharpe ratio, but avoid over-optimization (curve-fitting) by testing on out-of-sample data.
Market-Specific Adjustments:
Volatile Pairs (e.g., DOGE/USDT): Use tighter stop losses (e.g., 0.5–0.7%) and smaller take-profit targets (e.g., 1.0–1.2%) to account for rapid price swings.
Stable Pairs (e.g., BTC/USDT): Slightly wider stop losses (e.g., 1.0–1.2%) and take-profit targets (e.g., 1.8–2.5%) may work better.
Trending Markets: Increase emaSlowLen (e.g., to 25–30) to follow stronger trends.
Choppy Markets: Tighten bbMult (e.g., to 1.8) and lower rsiOverbought/rsiOversold (e.g., to 70/30) to filter noise.
Forward Testing:
After backtesting, run the strategy in real-time on a demo account for 1–2 weeks to validate performance under current market conditions.
Important Notes
No Universal "Best" Numbers: Optimal parameters vary by crypto pair, exchange, and market conditions (e.g., bull vs. bear market). The suggested values are a starting point based on common scalping practices.
Risk Management: Never risk more than 1–2% of your account per trade. Adjust position sizing in TradingView’s strategy settings to align with your risk tolerance.
Market Volatility: Crypto markets are highly volatile. Test the strategy on your specific pair and adjust parameters if signals are too frequent or too rare.
Not Financial Advice: This is an educational tool. Backtest thoroughly and use a demo account before trading with real funds.
If you want me to generate a chart showing backtest performance for specific parameters or to tweak the script further (e.g., adding more indicators or adjusting signal logic), let me know!can you add clear buy ans sell signs above the candles in this codeTo add clear buy and sell signals above the candles in the provided Pine Script, I'll modify the existing code to include prominent text labels directly above (for sell signals) and below (for buy signals) the candles. These labels will be larger, color-coded, and positioned to avoid clutter, ensuring they are easily visible on the chart. The core strategy logic (EMA, RSI, MACD, Bollinger Bands, candlestick patterns, and volume filter) will remain unchanged, and I'll reuse the same artifact_id since this is an update to the previous script.AdvancedCryptoScalpingStrategy.pinex-pine

13/48 EMA Trading Scalper (ATR TP/SL)13/48 EMA Trading Scalper (ATR TP/SL)
What it does:
This tool looks for price “touches” of the 13-EMA, only takes CALL entries when the 13 is above the 48 (uptrend) and PUT entries when the 13 is below the 48 (downtrend), and confirms with a simple candle pattern (green > red with expansion for calls, inverse for puts). Touch sensitivity is ATR-scaled, so signals adapt to volatility. Each trade gets auto-drawn entry, TP, and SL lines, colored labels with $ / % distance from entry, plus optional TP/SL hit alerts. A rotating color palette and per-bar label staggering help keep the chart readable. Old objects are auto-pruned via maxTracked.
How it works
Trend filter: 13-EMA vs 48-EMA.
Entry: ATR-scaled touch of the 13-EMA + candle confirmation.
Risk: TP/SL = ATR multiples you control.
Visuals: Entry/TP/SL lines (extend right), vertical entry marker (optional), multi-line labels.
Hygiene: maxTracked keeps only the last N trades’ objects; labels are staggered to reduce overlap.
Alerts: Buy Call, Buy Put, Take Profit Reached, Stop Loss Hit.
Key Inputs
Fast EMA (13), Trend EMA (48), ATR Length (14)
Touch Threshold (x ATR) – how close price must come to the EMA
Take Profit (x ATR), Stop Loss (x ATR)
maxTracked – number of recent trades to keep on chart
Tips
Start with Touch = 0.10–0.20 × ATR; TP=2×ATR, SL=1×ATR, then tune per symbol/timeframe.
Works on intraday and higher TFs; fewer, cleaner signals on higher TFs.
This is an indicator, not a broker—always backtest and manage risk.
Zero-Lag Scalper with Trend Line (BUY/SELL labels) BY RAHZero-Lag Scalper with Trend Line (BUY/SELL labels) BY RAH

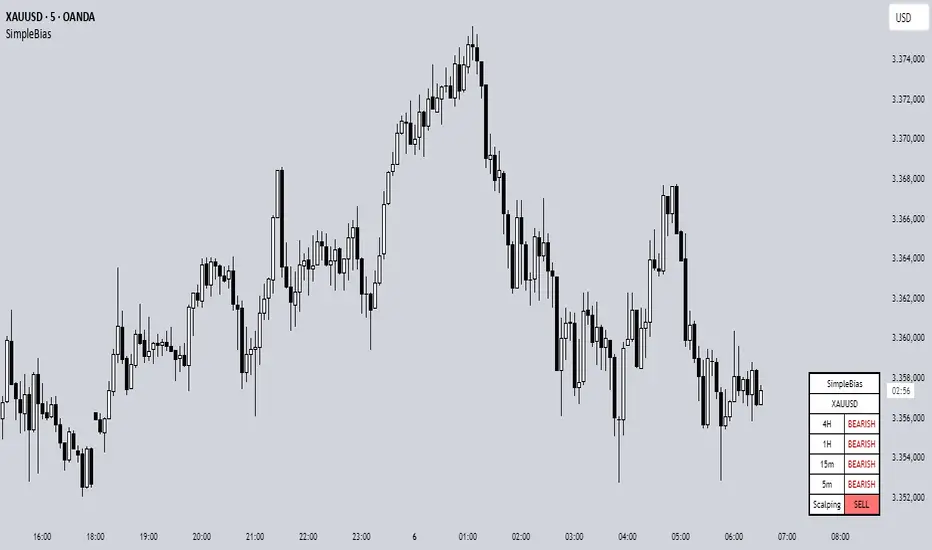
SimpleBiasSimpleBias - Multi-Timeframe Bias Analysis Indicator
Overview
SimpleBias is a comprehensive multi-timeframe bias analysis indicator designed to help traders make informed trading decisions by displaying market bias across multiple timeframes in a clean, organized table format.
Key Features
Multi-Timeframe Analysis
8 Timeframes Supported : 1M, 1W, 1D, 4H, 1H, 15m, 5m, 1m
Adaptive Display : Shows only relevant timeframes based on current chart timeframe
Real-time Bias Detection : Compares current open price with previous period's open price
Signal Generation
Day Trading Mode : Ideal for 15-minute timeframe analysis
Scalping Mode : Optimized for 5-minute timeframe trading
Signal OFF : Pure bias analysis without trade signals
Customization Options
Theme Support : Light mode and dark mode with automatic color adaptation
Position Control : Table can be positioned at top-right, middle-right, or bottom-right
Size Options : Tiny, small, or normal text size
Color Customization : Full control over bias colors, signal colors, and interface elements
Transparency : Optional transparent background for cleaner chart appearance
How It Works
Bias Calculation
The indicator determines market bias by comparing the current timeframe's open price with the previous period's open price:
BULLISH : Current open > Previous open
BEARISH : Current open < Previous open
NEUTRAL : Current open = Previous open
Adaptive Timeframe Display
The indicator intelligently shows only relevant timeframes based on your current chart:
On 1M chart: Shows 1M bias only
On 1W chart: Shows 1M, 1W bias
On 1D chart: Shows 1M, 1W, 1D bias
And so on...
Signal Logic
Day Trading : Compares current price with 4H open price
Scalping : Compares current price with 1H open price
Usage Instructions
Add to Chart : Apply the indicator to any timeframe chart
Configure Settings :
- Choose table position and text size
- Select signal mode (OFF/Day Trade/Scalping)
- Customize colors and theme
Interpret Results :
- Green/Blue text = Bullish bias
- Red text = Bearish bias
- Gray text = Neutral bias
Customization Guide
Theme Settings
Light Mode : Traditional white background with dark text
Dark Mode : Dark background with light text, optimized for dark charts
Transparent Background : Clean overlay without background color
Color Schemes
Bias Colors : Separate customization for bullish, bearish, and neutral bias
Signal Colors : Distinct colors for buy, sell, and neutral signals
Interface : Control table background and border colors
Best Practices
For Day Trading
Use 15-minute or 1-hour charts
Enable "Day Trade" signal mode
Focus on 4H and higher timeframe bias alignment
For Scalping
Use 5-minute charts
Enable "Scalping" signal mode
Watch for 1H and 4H bias alignment
For Swing Trading
Use 4H or daily charts
Keep signal mode OFF
Focus on weekly and monthly bias alignment
Important Notes
This indicator is for educational and analysis purposes only
Not financial advice - always do your own research
Past performance does not guarantee future results
Risk management is essential in all trading activities
Technical Specifications
Pine Script Version : v6
Overlay : True (displays on price chart)
Performance : Optimized with cached security requests
Compatibility : Works on all TradingView timeframes and instruments
---
SimpleBias - Indikator Analisis Bias Multi-Timeframe
Gambaran Umum
SimpleBias adalah indikator analisis bias multi-timeframe yang komprehensif, dirancang untuk membantu trader membuat keputusan trading yang tepat dengan menampilkan bias pasar di berbagai timeframe dalam format tabel yang bersih dan terorganisir.
Fitur Utama
Analisis Multi-Timeframe
8 Timeframe Didukung : 1M, 1W, 1D, 4H, 1H, 15m, 5m, 1m
Tampilan Adaptif : Hanya menampilkan timeframe yang relevan berdasarkan timeframe chart saat ini
Deteksi Bias Real-time : Membandingkan harga open saat ini dengan harga open periode sebelumnya
Mode Sinyal Trading
Mode Day Trading : Ideal untuk analisis timeframe 15 menit
Mode Scalping : Dioptimalkan untuk trading timeframe 5 menit
Mode OFF : Analisis bias murni tanpa sinyal trading
Opsi Kustomisasi
Dukungan Theme : Mode terang dan gelap dengan adaptasi warna otomatis
Kontrol Posisi : Tabel dapat diposisikan di kanan-atas, kanan-tengah, atau kanan-bawah
Opsi Ukuran : Ukuran teks kecil, sedang, atau normal
Kustomisasi Warna : Kontrol penuh atas warna bias, warna sinyal, dan elemen interface
Transparansi : Background transparan opsional untuk chart yang lebih bersih
Cara Kerja
Perhitungan Bias
Indikator menentukan bias pasar dengan membandingkan harga open timeframe saat ini dengan harga open periode sebelumnya:
BULLISH : Open saat ini > Open sebelumnya
BEARISH : Open saat ini < Open sebelumnya
NEUTRAL : Open saat ini = Open sebelumnya
Petunjuk Penggunaan
Tambahkan ke Chart : Terapkan indikator ke chart timeframe apapun
Konfigurasi Settings :
- Pilih posisi tabel dan ukuran teks
- Pilih mode sinyal (OFF/Day Trade/Scalping)
- Sesuaikan warna dan theme
Interpretasi Hasil :
- Teks hijau/biru = Bias bullish
- Teks merah = Bias bearish
- Teks abu-abu = Bias neutral
Best Practices
Untuk Day Trading
Gunakan chart 15 menit atau 1 jam
Aktifkan mode sinyal "Day Trade"
Fokus pada alignment bias timeframe 4H ke atas
Untuk Scalping
Gunakan chart 5 menit
Aktifkan mode sinyal "Scalping"
Perhatikan alignment bias 1H dan 4H
Catatan Penting
Indikator ini hanya untuk tujuan edukasi dan analisis
Bukan nasihat keuangan - selalu lakukan riset sendiri
Performa masa lalu tidak menjamin hasil masa depan
Manajemen risiko sangat penting dalam semua aktivitas trading
SimpleBias membantu trader mempertahankan kesadaran terhadap bias pasar di berbagai timeframe, mendukung timing dan pengambilan keputusan yang lebih baik dalam strategi trading mereka.
Smart Scalper Indicator🎯 How the Smart Scalper Indicator Works
1. EMA (Exponential Moving Average)
EMA 10 (Blue Line):
Shows the short-term trend.
If the price is above this line, the trend is bullish; if below, bearish.
EMA 20 (Orange Line):
Displays the longer-term trend.
If EMA 10 is above EMA 20, it indicates a bullish trend (Buy signal).
2. SuperTrend
Green Line:
Represents support levels.
If the price is above the green line, the market is considered bullish.
Red Line:
Represents resistance levels.
If the price is below the red line, the market is considered bearish.
3. VWAP (Volume Weighted Average Price)
Purple Line:
Indicates the average price considering volume.
If the price is above the VWAP, the market is strong (Buy signal).
If the price is below the VWAP, the market is weak (Sell signal).
4. ATR (Average True Range)
Used to measure market volatility.
An increasing ATR indicates higher market activity, enhancing the reliability of signals.
ATR is not visually displayed but is factored into the signal conditions.
⚡ Entry Signals
Green Up Arrow (Buy):
EMA 10 is above EMA 20.
The price is above the SuperTrend green line.
The price is above the VWAP.
Volatility (ATR) is increasing.
Red Down Arrow (Sell):
EMA 10 is below EMA 20.
The price is below the SuperTrend red line.
The price is below the VWAP.
Volatility (ATR) is increasing.
🔔 Alerts
"Buy Alert" — Notifies when a Buy condition is met.
"Sell Alert" — Notifies when a Sell condition is met.
✅ How to Use the Indicator:
Add the indicator to your TradingView chart.
Enable alerts to stay updated on signal triggers.
Check the signal:
A green arrow suggests a potential Buy.
A red arrow suggests a potential Sell.
Set Stop-Loss:
Below the SuperTrend line or based on ATR levels.
Take Profit:
Target 1-2% for short-term trades.

Momentum Squeeze Scalper [M2S} [ITZS]Overview
The Momentum Squeeze Scalper is a technical analysis tool designed to identify potential breakout opportunities in the market. It combines elements of momentum analysis with a "squeeze" concept based on Bollinger Bands and Keltner Channels.
Key Components
1. Squeeze Detection
The indicator uses two types of squeezes:
a) Loose TTM Fire (Loose Squeeze): Represented by orange dots. This occurs when one side of the Bollinger Bands is inside the Keltner Channel.
b) Strict TTM Fire (Strict/Tight Squeeze): Represented by green dots. This happens when both sides of the Bollinger Bands are inside the Keltner Channel.
These squeezes can indicate potential breakouts in either direction (long or short).
Long Squeeze: Occurs when prices are compressed at a low level, potentially leading to an upward breakout.
Short Squeeze: Happens when prices are compressed at a high level, possibly leading to a downward breakout.
2. Momentum Line
The Momentum Line is a key feature of this indicator. Its color changes based on specific conditions:
Color 0 (White): Default color, indicating neutral momentum.
Color 1 (Green): Indicates positive momentum. This color appears when:
1. The histogram is positive and increasing, or
2. The momentum is increasing during a squeeze (loose or strict), or
3. There's a strict squeeze in place.
Color 2 (Red): Indicates negative momentum. This color appears when:
1. The histogram is negative and decreasing, or
2. The momentum is decreasing during a squeeze (loose or strict), or
3. There's a strict squeeze in place.
The changing colors of the Momentum Line help traders quickly identify shifts in market momentum and potential trading opportunities.
3. Signal Line
The orange line is the signal line, which is a smoothed version of the momentum line. It can help confirm trend changes when it crosses the momentum line.
Inputs and Their Effects
1. Momentum Period (default: 17):
Purpose: Determines the lookback period for momentum calculation.
Effect: A longer period makes the indicator less sensitive to short-term price changes, resulting in smoother momentum lines but potentially slower signals. A shorter period will make the indicator more responsive to recent price action but may increase noise.
2. Signal Period (default: 8):
Purpose: Sets the smoothing period for the signal line.
Effect: A shorter period makes it more responsive to recent price action, potentially providing earlier signals but with a higher chance of false alerts. A longer period creates a smoother signal line, reducing false signals but potentially delaying entry/exit points.
3. Smooth Momentum (default: false):
Purpose: Determines whether to use EMA smoothing on the source price before momentum calculation.
Effect: When true, it can reduce noise in the momentum calculation, potentially providing clearer signals in choppy markets. When false, it responds more quickly to price changes.
Smoothing Period (default: 1):
Purpose: Sets the period for EMA smoothing when Smooth Momentum is true.
Effect: A higher value creates a smoother momentum line, potentially reducing false signals but also increasing lag.
BB Length (default: 7):
Purpose: Defines the period for Bollinger Bands calculation.
Effect: A shorter length makes the bands more sensitive to price changes, potentially identifying squeezes more quickly but also increasing the chance of false signals. A longer length creates more stable bands but may delay squeeze identification.
StDev (default: 1.0):
Purpose: Standard deviation multiplier for Bollinger Bands.
Effect: Higher values create wider bands, making squeezes less frequent but potentially more significant. Lower values create tighter bands, increasing the frequency of squeezes but potentially reducing their reliability.
Keltner Length (default: 1):
Purpose: Sets the period for Keltner Channel calculation.
Effect: A longer length creates a wider, more stable channel, reducing the frequency of squeezes but potentially making them more reliable. A shorter length creates a tighter channel, increasing squeeze frequency but potentially reducing significance.
Multiplier (default: 0.5):
Purpose: Multiplier for Keltner Channel width.
Effect: Higher values create a wider channel, making squeezes less frequent but potentially more significant. Lower values create a tighter channel, increasing squeeze frequency but potentially reducing their reliability.
KC Smoothing Period (default: 10):
Purpose: Determines the smoothing period for the momentum histogram.
Effect: A longer period creates a smoother histogram, potentially reducing false signals but increasing lag. A shorter period makes the histogram more responsive but potentially noisier.
Smoothing Type (default: None):
Purpose: Allows selection of different smoothing algorithms for the momentum histogram.
Effect: Different smoothing types (e.g., ALMA, DEMA, EMA) can affect how quickly the histogram responds to price changes and how smooth the resulting line is. This can impact the timing and frequency of momentum color changes.
How to Use the Indicator
Look for squeeze dots (orange or green) to identify periods of low volatility.
Pay attention to the color of the Momentum Line:
1. Green suggests potential bullish momentum
2. Red suggests potential bearish momentum
Use the histogram for additional confirmation of momentum strength and direction.
Consider entering trades when the squeeze dots disappear and the Momentum Line shows a strong color signal (green for long, red for short).
How to Adjust the Indicator
1. For More Frequent Signals: Decrease the Momentum Period, Signal Period, BB Length, and Keltner Length. Increase the StDev and decrease the Multiplier. This will make the indicator more sensitive but may increase false signals.
2. For Fewer, More Reliable Signals: Increase the Momentum Period, Signal Period, BB Length, and
Keltner Length. Decrease the StDev and increase the Multiplier. This will reduce sensitivity but may miss some opportunities.
3. To Detect Stronger Squeezes: Increase the StDev for Bollinger Bands and decrease the Multiplier for Keltner Channels. This will make it harder for squeezes to occur, potentially identifying stronger setups.
4. To Reduce Noise: Enable Smooth Momentum and increase the Smoothing Period. Choose a smoothing type like EMA or DEMA for the histogram. This can help in choppy or ranging markets.
5. For Faster Response: Decrease the Momentum Period and Signal Period, and choose a responsive smoothing type like EMA for the histogram. This can be useful in fast-moving markets but may increase false signals.
Interpretation and Trading
1. Squeeze Formation: When you see orange (loose) or green (strict) dots, it indicates a potential buildup of energy in the market. This compression often precedes a significant move.
2. Momentum Direction: Watch the Momentum Line color changes:
Transition to Green: Suggests increasing bullish momentum, especially during a squeeze.
Transition to Red: Suggests increasing bearish momentum, especially during a squeeze.
White: Indicates neutral momentum or no clear direction.
3. Confirmation: Look for the Momentum Line (colored) to cross above the Signal Line (orange) for bullish confirmation, or below for bearish confirmation.
4. Exit Signals: When the squeeze dots disappear and the Momentum Line color changes, it often indicates that the compressed energy has been released, and the strong move may be ending.
5. Trend Strength: The distance between the Momentum Line and the Signal Line can indicate trend strength. A wider gap suggests a stronger trend.
Remember, no indicator is perfect. Always use this tool in conjunction with other forms of analysis and proper risk management. It's recommended to backtest and practice with this indicator on historical data before using it in live trading. Adjust the inputs based on your trading style, timeframe, and the specific characteristics of the asset you're trading.
EMA+ATR Scalping Indicator by TradeTechIndicator Description: “EMA+ATR Scalping Indicator by Tradetech”
The “EMA+ATR Scalping Indicator” is a powerful tool designed to help traders identify optimal entry and exit points in the market, focusing on high-probability scalping opportunities. This indicator combines the strength of the Exponential Moving Average (EMA) with the Average True Range (ATR) to generate precise signals, aiming to maximize profits while minimizing risk.
Key Features:
• Sensitivity Key Value: Allows customization of the ATR multiplier, fine-tuning the trailing stop level for different market conditions.
• ATR Calculation: Measures market volatility over a specified period, dynamically adjusting the trailing stop to capture significant price moves while reducing noise.
• EMA for Confirmation: The 20-period EMA is used as a trend filter, ensuring that trades are aligned with the prevailing market direction.
• Trade Cooldown Period: Prevents over-trading by enforcing a minimum number of bars between consecutive trades, reducing the likelihood of whipsaws.
• Flat ATR Threshold: Identifies periods of low volatility (flat ATR), during which trading is avoided to protect against false signals.
Trading Logic:
• Entry Signals: The indicator generates long signals when the price crosses above the ATR trailing stop or breaks out consecutively in an uptrend, with the EMA confirming the bullish trend. Short signals are generated when the price crosses below the ATR trailing stop or consecutively breaks out in a downtrend, with the EMA confirming the bearish trend.
• Exit Signals: The exit points are defined by the ATR trailing stop, which adjusts dynamically with market conditions, ensuring that profits are locked in as the trend evolves.
• No Trading Zone: When the ATR is flat, indicating low volatility, the indicator displays a “No Trading Zone” to prevent taking positions in uncertain market conditions.
Why Combine EMA + ATR?
The combination of EMA and ATR in this indicator is crucial for several reasons:
1. Trend Identification (EMA): The EMA acts as a reliable trend filter, ensuring that trades are taken in the direction of the prevailing trend. By doing so, the indicator avoids taking trades against the momentum, which could result in lower probability setups.
2. Volatility-Based Trailing Stop (ATR): The ATR provides a volatility-adjusted stop-loss level, which is essential in scalping strategies where market conditions can change rapidly. This allows the trailing stop to widen during periods of high volatility and tighten during low volatility, optimizing the trade management process.
3. Enhanced Accuracy: By combining the EMA and ATR, the indicator filters out noise and avoids entering trades during flat market conditions, where the probability of false signals is higher. This synergy between trend and volatility creates a more robust and accurate scalping tool.
4. Dynamic Trade Management: The use of ATR for setting trailing stops ensures that the trade exits are dynamic and adaptable to current market conditions, maximizing the potential for capturing significant moves while minimizing drawdowns.
Overall, the EMA + ATR combination within the “EMA+ATR Scalping Indicator” provides a well-rounded approach to scalping, balancing trend-following with volatility management for more consistent trading results.
QTE Scalper ModifiedA modified version of the QTE scalper indicator. Produces a buy/sell signal based on a 2 candle pattern. For long signals it produces a signal when the high and low of the second candle are below the high and low of the first candle and both candles close above the 10 period EMA. The reverse is true for short signals.
Added functionality so that signals will trigger an alert: Add the indicator to the chart on the instrument and timeframe you wish to use it on. Add an alert and in the 'condition' section choose the indicator and set the trigger as 'once per bar close'. You will have to set individual alerts for both long and short signals and if you change the time period on the chart.

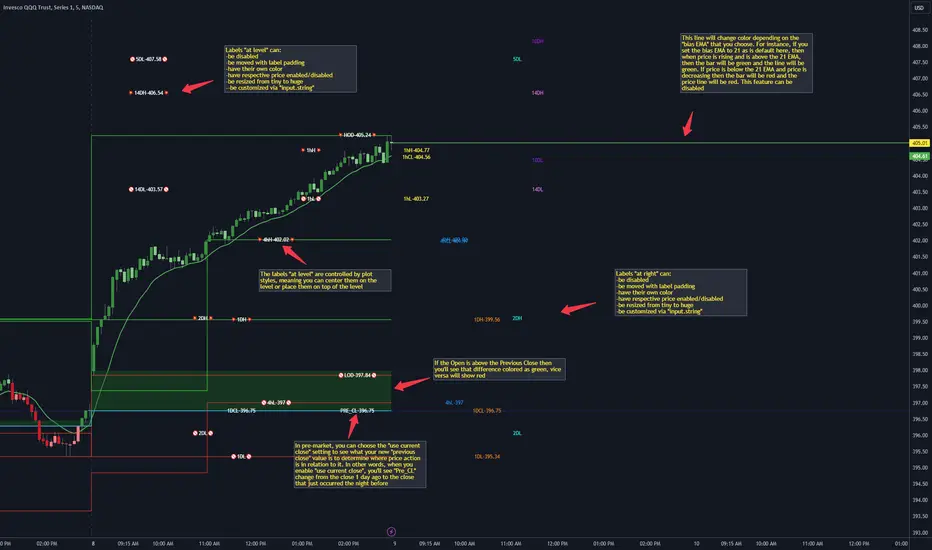
CANDLE LEVELS [PRO]This indicator provides you with 55 levels! with labels to help you identify quickly where current price is in relation to the OPEN, CLOSE, HIGH OF DAY and LOW OF DAY to a respective level. Choose from levels as low as the 5 minute time frame all the way up to 200 days. All of the levels except the day's OPEN, HIGH OF DAY AND LOW OF DAY use the PREVIOUS time frame's level. In other words, when you're looking at the "1 DAY HIGH", that's actually the previous day's HIGH OF DAY. Whether you're a scalper on the lower time frames or a swing trader that mainly uses the 1 hour and above, these candle levels can be an invaluable source of support and resistance; in other words you'll often see price bounce off of a level (whether price is increasing or decreasing) once or multiple times and that could be an indication of a price's direction. Another way that you could utilize this indicator is to use it in confluence with other popular signals, such as an EMA crossover. For instance, you could watch as price rises above the 21 EMA all the while price is also crossing up and over the previous day's HIGH OF DAY with a relative volume that's double that of the previous week's average. These are just a few of some potential bullish signals that you could look for to go long on a trade using the candle levels provided.
I've made this indicator extremely customizable:
⚡Each level has 2 labels: 1 "at level" and 1 "at right", each label and price can be disabled
⚡Each label has its own input for label padding. The "at right" label padding input allows you to zoom in and out of a chart without the labels moving along their respective axis
⚡Each label's text can be customized via an "input.string" code base
⚡Each level's label can be changed via a plot style setting to determine if the label is centered with it's respective level or rides along the top of it
⚡Significant figures input allows you to round price up or down
⚡A "bias EMA" tool that color codes the candles and price line to show you where price is in relation to the 21 EMA (or another value that you pick). As a result, this can be an effective visual to help reduce cognitive load
⚡A "fill level" where color is determined by price opening above or below the previous day's close
⚡A "use current close" setting that's great to use in pre-market as it shows you where price is in relation to the previous days' close
----------------------------------------------------------------------------------------------------------------------
🙏Thanks to (c)satymahajan for the inspiration behind the ATR "previous close" and "bias candle" code base
🙏Thanks to my mentor (c)SimpleCryptoLife for the libraries and extensive code to help create this indicator
Jerry J8 30-123 Spy Dashboard ProPlease watch the J8 Scalping Tutorial Video below for a walkthrough on how these indicators work.
This script is used in conjunction with Jerry J8 30-123 SPY Scalping PRO” Indicator(which creates the buy and sell orders as a strategy). The Dashboard shows the 4 main criteria statuses from the strategy. I find the dashboard makes scalping the SPY much easier.
This study project is designed for scalping options that expire daily with bull put and bear call credit spreads on a 3 minute chart. The name 30_123 is a reference to 4 main criteria being met to give a green light for a potential trade. The criteria:
* 30 = 30 minute trend
* 1 = 3 minute trend
* 2 = Moving average criteria
* 3 = RSI criteria
4 = Secondary trend. Bonus if in sync but not a requirement.
* The strategy also utilizes momentum as a criteria but this is not shown on the dashboard.
This indicator is designed to trade options that expire daily including the SPY, IWM, QQQ, and NDX. However, it can be used with multiple symbols on a 3 minute chart.
When the 30_123 conditions are all green with all criteria are met a bull signal is created.
When the 30_123 conditions are all red with all criteria are met a bear signal is created.
This study is the dashboard that is designed to show how the main J8 strategy indicator is working and it shows which criteria have been met. Additionally there are multiple user INPUTS that you can adjust for the 4 main criteria plus inputs to help you with your credit spread criteria.
For example, if the SPY is at 400 we could have an order to sell a BULL PUT CREDIT SPREAD and I would likely sell the 398p and buy the 397p; The 398p delta would be approximately -.2. The spread position profits with any close over 398 and/or can be closed early with a bullish price move. IMPORTANT: If the SPY closed the day at $399 on the chart it would look like a loss based on the buy and sell orders but the spread would be a full profit since the close was above 398.
---- IRON CONDOR
For the SPY ticker only an iron condor label is generated when the SPY is trading sideways and meets specified criteria. When the criteria is met the Iron Condor label appears and it provides a recommendation for what option to buy and sell. The iron condor recommendations can be adjusted with user inputs.
This Indicator dashboard shows the criteria labels and colors the criteria as green if bullish and red if bearish. When the criteria are not met the dashboard shows “NO CLEAR SIGNAL”. There is also a label that shows whether you are looking for bullish or bearish positions based on the 30 minute trend.
The chart shown on the indicator is the RSI and for this indicator an RSI over 50 is bullish and under 50 is bearish. The line color shows the RSI trend. RSI OB (overbought) and OS (oversold) areas are shaded. The RSI can remain in an OB or OS state for a prolonged period and while some people use OB and OS as a reversal signal I use it as a strong trend indication and recognize it will not last forever. You can SET the OB and OS levels with inputs.
---- USER INPUTS
Paint Bars: Turns on/off the candle coloring. Default is OFF.
Iron Condor Settings: Defaults are what I use and can be used as a guide.
Criteria: Trend, moving averages, and RSI settings can all be adjusted.
---- SETUP & HINTS
Add "Jerry J8 30-123 SPY Scalping PRO” indicator to show bull and bear signals
Add "Jerry J8 MACD Optimal Entry Zone” indicator to show best MACD range for entry
I also like to add "Jerry Momentum Dream" indicator to see the momentum
With this indicator we’re looking for the 30, 1, 2, and 3 criteria to be met which increases our likelihood of success. IMPORTANT. Never automatically enter a position without reviewing the other indicators and drawing your own conclusions. You want to choose the entries that are the most appealing to you that take into account volume, time of day, and risk/reward. Positions should be closed based on your risk/reward goals.
Indicators are not a magic pill and should be used to support trading decisions, not to make them for you. Past performance is not a guarantee of future returns. The results of individual stocks/indexes with any strategy do not constitute proof they will repeat in the future.
DISCLAIMER: The information contained in our scripts/indicators/ideas does not constitute financial advice or a solicitation to buy or sell any securities of any type. Trading and investing in the stock market and cryptocurrencies involves substantial risk of loss and is not suitable for every investor. I’m NOT a financial adviser. All trading strategies are used at your own risk.
Please Use the AUTHOR’s INSTRUCTIONS link below for more information.
NOTE: The PERFORMANCE SUMMARY below does not accurately reflect the trading strategy because the entry orders generated in the strategy are based on the stock price and our actual order is a credit spread that is profitable even if the price moves against us a little bit. What could show as a loss in the strategy could be a profit in the credit spread.

ATR PivotsThe "ATR Pivots" script is a technical analysis tool designed to help traders identify key levels of support and resistance on a chart. The indicator uses various metrics such as the Average True Range (ATR), Daily True Range ( DTR ), Daily True Range Percentage (DTR%), Average Daily Range (ADR), Previous Day High ( PDH ), and Previous Day Low ( PDL ) to provide a comprehensive picture of the volatility and movement of a security. The script also includes an EMA cloud and 200 EMA for trend identification and a 1-minute ATR scalping strategy for traders to make informed trading decisions.
ATR Detail:-
The ATR is a measure of the volatility of a security over a given period of time. It is calculated by taking the average of the true range (the difference between the high and low of a security) over a set number of periods. The user can input the number of periods (ATR length) to be used for the ATR calculation. The script also allows the user to choose whether to use the current close or not for the calculation. The script calculates various levels of support and resistance based on the relationship between the security's range ( high-low ) and the ATR. The levels are calculated by multiplying the ATR by different Fibonacci ratios (0.236, 0.382, 0.5, 0.618, 0.786, 1.000) and then adding or subtracting the result from the previous close. The script plots these levels on the chart, with the -100 level being the most significant level. The user also has an option to choose whether to plot all Fibonacci levels or not.
DTR and DTR% Detail:-
The Daily True Range Percentage (DTR%) is a metric that measures the daily volatility of a security as a percentage of its previous close. It is calculated by dividing the Daily True Range ( DTR ) by the previous close. DTR is the range between the current period's high and low and gives a measure of the volatility of the security on a daily basis. DTR% can be used as an indicator of the percentage of movement of the security on a daily basis. In this script, DTR% is used in combination with other metrics such as the Average True Range (ATR) and Fibonacci ratios to calculate key levels of support and resistance for the security. The idea behind using DTR% is that it can help traders to better understand the daily volatility of the security and make more informed trading decisions.
For example, if a security has a DTR% of 2%, it suggests that the security has a relatively low level of volatility and is less likely to experience significant price movements on a daily basis. On the other hand, if a security has a DTR% of 10%, it suggests that the security has a relatively high level of volatility and is more likely to experience significant price movements on a daily basis.
ADR:-
The script then calculates the ADR (Average Daily Range) which is the average of the daily range of the security, using the formula (Period High - Period Low) / ATR Length. This gives a measure of the average volatility of the security on a daily basis, which can be useful for determining potential levels of support and resistance .
PDH /PDL:-
The script also calculates PDH (Previous Day High) and PDL (Previous Day Low) which are the High and low of the previous day of the security. This gives a measure of the previous day's volatility and movement, which can be useful for determining potential levels of support and resistance .
EMA Cloud and 200 EMA Detail:-
The EMA cloud is a technical analysis tool that helps traders identify the trend of the market by comparing two different exponential moving averages (EMAs) of different lengths. The cloud is created by plotting the fast EMA and the slow EMA on the chart and filling the space between them. The user can input the length of the fast and slow EMA , and the script will calculate and plot these EMAs on the chart. The space between the two EMAs is then filled with a color that represents the trend, with green indicating a bullish trend and red indicating a bearish trend . Additionally, the script also plots a 200 EMA , which is a commonly used long-term trend indicator. When the fast EMA is above the slow EMA and the 200 EMA , it is considered a bullish signal, indicating an uptrend. When the fast EMA is below the slow EMA and the 200 EMA , it is considered a bearish signal, indicating a downtrend. The EMA cloud and 200 EMA can be used together to help traders identify the overall trend of the market and make more informed trading decisions.
1 Minute ATR Scalping Strategy:-
The script also includes a 1-minute ATR scalping strategy that can be used by traders looking for quick profits in the market. The strategy involves using the ATR levels calculated by the script as well as the EMA cloud and 200 EMA to identify potential buy and sell opportunities. For example, if the 1-minute ATR is above 11 in NIFTY and the EMA cloud is bullish , the strategy suggests buying the security. Similarly, if the 1-minute ATR is above 30 in BANKNIFTY and the EMA cloud is bullish , the strategy suggests buying the security.
Inside Candle:-
The Inside Candle is a price action pattern that occurs when the current candle's high and low are entirely within the range of the previous candle's high and low. This pattern indicates indecision or consolidation in the market and can be a potential sign of a trend reversal. When used in the 15-minute chart, traders can look for Inside Candle patterns that occur at key levels of support or resistance. If the Inside Candle pattern occurs at a key level and the price subsequently breaks out of the range of the Inside Candle, it can be a signal to enter a trade in the direction of the breakout. Traders can also use the Inside Candle pattern to trade in a tight range, or to reduce their exposure to a current trend.
Risk Management:-
As with any trading strategy, it is important to practice proper risk management when using the ATR Pivots script and the 1-minute ATR scalping strategy. This may include setting stop-loss orders, using appropriate position sizing, and diversifying your portfolio. It is also important to note that past performance is not indicative of future results and that the script and strategy provided are for educational purposes only.
In conclusion, the "ATR Pivots" script is a powerful tool that can help traders identify key levels of support and resistance , as well as trend direction. The additional metrics such as DTR , DTR%, ADR, PDH , and PDL provide a more comprehensive picture of the volatility and movement of the security, making it easier for traders to make better trading decisions. The inclusion of the EMA cloud and 200 EMA for trend identification, and the 1-minute ATR scalping strategy for quick profits can further enhance a trader's decision-making process. However, it is important to practice proper risk management and understand that past performance is not indicative of future results.
Special thanks to satymahajan for the idea of clubbing Average True Range with Fibonacci levels.

thuyliemforever EMA Scalper - Buy/Sellthuyliemforever EMA Scalper - Buy/Sell
Indicator that help you make decision buy or sell.
