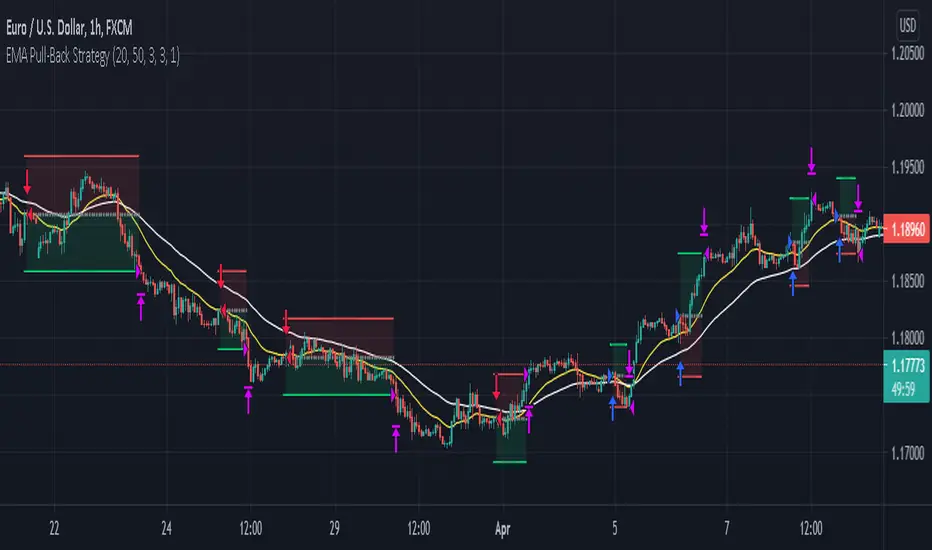
Scalp - 50/200 EMAWorks on any timeframe but was built originally for scalping. Uses 50EMA and 200EMA to define the trend and touch backs on to the 50 EMA for entry.
200 EMA - White Line
50 EMA - Yellow Line
ATR: Length 14 Smoothing RMA
1. Wait for 50ema to crossover 200 ema – Then wait for candle to touch 50 ema after the cross.
2. Entry: Green candle that closes above 50 ema without getting more than 3 candles closing below(BUY) or above (SELL) 50ema.
3. Stop loss: 2x ATR value below entry candle.
4. Take profit: 1.5x the risk.
Settings allow for # of Entries allowed per trend as well as EMA periods.
Opposite for Sell Entries (Stop Loss: 2x ATR value above entry candle)
Cari dalam skrip untuk "scalp"
yuthavithi's BB ScalperA trend based BB scalper. It uses day time frame data to determine trend. When price moves above sma, it is up trend , otherwise it is down trend. the trading signal is determined in lower time frame using bband. In up trend, it will only buy and close when price reaches bb upper band. In downtrend it will do the opposite

Scalper Pro Pattern Recognition & Price Action📘 Scalper Pro Pattern Recognition & Price Action
Overview
Scalper Pro is a dynamic multi-layer trend recognition and price action strategy that integrates Supertrend, Smart Money Concepts (SMC), and volatility-based risk control.
It adapts to market volatility in real time to enhance entry precision and optimize risk.
⚠️ This script is for educational and research purposes only.
Past performance does not guarantee future results.
🎯 Strategy Objectives
Detect structural market shifts (BOS / CHoCH) automatically.
Identify Order Blocks (OB), Fair Value Gaps (FVG), and key liquidity zones.
Plot dynamic Take-Profit (TP) and Stop-Loss (SL) levels based on ATR.
Avoid low-volatility (sideways) conditions using ADX filtering.
Combine trend-following signals with structural confirmation.
✨ Key Features
Supertrend Entry Signals — Generates precise buy/sell markers based on price crossovers with the Supertrend line.
Order Block Detection — Automatically plots both Internal and Swing Order Blocks for smart money insights.
Fair Value Gap Visualization — Highlights inefficiency zones in bullish or bearish structures.
Market Structure Labels — Marks Break of Structure (BOS) and Change of Character (CHoCH) points for clear trend shifts.
Dynamic Risk Levels — Automatically generates TP/SL lines and price labels using ATR-based distance.
📊 Trading Rules
Long Entry:
• Price crosses above the Supertrend (ta.crossover(close, supertrend))
• ADX above sideways threshold (trend condition confirmed)
• Optional confirmation from a bullish BOS or CHoCH
Short Entry:
• Price crosses below the Supertrend (ta.crossunder(close, supertrend))
• ADX above threshold
• Optional confirmation from a bearish BOS or CHoCH
Exit (or Reverse):
• Opposite Supertrend crossover
• Price hits TP/SL lines
• Trend shift confirmed by internal BOS/CHoCH
💰 Risk Management Parameters
Stop Loss & Take Profit based on ATR × risk multiplier
ATR Length: 14 (default)
Risk %: 3% per trade
Sideways Filter: ADX < 15 → no trade zone
TP1–TP3 = Entry ± (ATR × 1~3)
⚙️ Indicator Settings
Supertrend Module:
ATR Length: 10
Factor: nsensitivity × 7
ADX Module:
ADX Length: 15
Sideways Threshold: 15
EMA Set:
EMA (5, 9, 13, 34, 50) × Volatility Factor (3)
SMA Filter:
SMA(8) & SMA(9) for short-term trend confirmation
Smart Money Concepts Module:
Displays BOS/CHoCH, Order Blocks, FVGs, Equal Highs/Lows, and Premium/Discount zones
🔧 Improvements & Uniqueness
Integrates Supertrend momentum with Smart Money Concepts (SMC) structural analysis.
Dual detection layers: Internal (micro) and Swing (macro) structures.
ATR-driven auto labeling for entry, stop, and profit targets.
Premium/Discount and Equilibrium zones visualized on the chart.
Built-in ADX filter to skip low-trend market conditions.
✅ Summary
Scalper Pro Pattern Recognition & Price Action merges classical trend-following with modern market structure analytics.
It combines momentum detection, volatility control, and smart money mapping into one cohesive framework.
Unified trend, structure, and risk visualization.
Auto-marked BOS/CHoCH, OB, FVG, and liquidity zones.
Usable for scalping, intraday, or swing trading setups.
⚠️ This strategy is based on historical data and designed for educational use only.
Always apply sound risk management and forward testing before live trading.

Scalping long-shortThe Scalping long-short indicator is a comprehensive system for analyzing candle patterns and trading volume, designed for use in a scalping strategy. The main purpose of the indicator is to identify the key points of changing market sentiment and provide the trader with accurate signals for entering a trade.
The main components of the indicator:
1. Candle Pattern Analysis:
The indicator analyzes four main candle patterns:
-A Bullish Hammer is a candle with a small body and a long lower tail, which indicates the possible completion of a downward movement and the beginning of an uptrend.
-Bearish Hanging Man is a candle similar to a bullish hammer, but it appears after an upward movement, signaling the possible beginning of a downtrend.
-Bullish Engulfing is a candle with a large body that completely covers the body of the previous candle, showing strong buyer interest.
-Bearish Engulfing is the reverse situation, when a large bearish candle absorbs the previous bullish candle, indicating the predominance of sellers.
-Doji is a candle with almost identical opening and closing prices, indicating market indecision.
For each of these patterns, the indicator sets certain threshold values that the user can adjust to their preferences and features of the trading instrument.
2. Volume analysis:
The volume is an important confirmation of the strength of the signal. The indicator compares the current volume with the average value for the user-selected period (length parameter) multiplied by the volumeMultiplier coefficient. If the current volume exceeds this indicator, the signal is considered confirmed.
3. Visual indication:
Graphical elements corresponding to each type of signal are displayed on the price chart.:
-The green triangle down is a buy signal (bullish hammer or bullish takeover).
-The red triangle up is a sell signal (bearish hanging or bearish engulfing).
-The yellow diamond is a neutral state (doji).
These visual cues help you quickly assess the current market situation without having to analyze each candle manually in depth.
4. Alerts:
The indicator supports setting alerts that can be sent via the TradingView platform or other supporting systems. This allows the trader to receive notifications about the occurrence of new signals even outside the workplace.
Settings:
The user can change the following settings:
-Length is the period for calculating the average volume.
-Multiplier is a multiplier for the thresholds of candle patterns.
-HammerThreshold, HangingManThreshold, EngulfingThreshold, DojiThreshold are Thresholds for recognizing specific candlestick patterns.
-VolumeMultiplier is a coefficient for comparing the current volume with the average value.
These parameters allow you to adapt the indicator to various trading instruments and time intervals, making it a universal tool for a wide range of traders.
Conclusion:
The Scalping long-short indicator combines powerful analytical tools to identify key points in the market, providing the trader with clear and timely signals for making trading decisions. Its flexibility and fine-tuning capability make it useful for both beginners and experienced market participants.

Scalping Strategy with SL and TP activation settingsThis strategy can be used on pretty much every timeframe that gives you a satisfying performance and will give you entries with a high probability of a winning trade.
Recommended are lower timeframes, because after all this is a scalping strategy and with that your chart wont be cluttered.
How to use this script?
Currently you can setup your positions SL and TP, because the markets vary in volatility it could improve the performance of the strategy.
You will simply get your signals and can decide to act upon them.
Stop loss: Simply your stop loss order which will trigger when price moves a given % away from your entry.
TP-Activation: When price reaches your % target it will trigger a stop limit order. So if price turns against your position after reaching your target it will close your position in profit and if it runs in your favoured direction it will trigger at a later stage.
Trailing-Offset-%: After reaching your % target it will trigger the TP order with an offset. So if you set your trailing offset to 0.1%, your TP order will be set behind 0.1 %. This can be used to test if the strategy would perform as well
if you leave more room for trades to play out.
Will this script make me profitable?
No strategy is a silver bullet and it depends mostly on you.
Trading is not easy and most people fail, because their risk management skills arent solid or they cant control their emotions.
This script will give you statistically often good entries, so even if you hit a losing streak your SL will protect you from losing more than necessary until you get a winning streak.
Patience and consistency is key to be profitable in the long run.
Does the script repaint?
Although you will get a notification when setting an alarm that the indicator may repaint, no security function is used and the signals will stay on the chart, because the signal is calculated based on the last candle close and will trigger with the next candle.
I am still looking into why that notification pops up.
You are free to try the indicator for a limited time to be sure.
My experience with the strategy
The overall statistical advantage is great. The strategy can be used simply as it is, but becomes better if you already have some experience with trading. Sometimes it will give you a good entry, reaches your target and the price still goes in your preferred direction. So your trading returns and experience could be improved with confluence, but it is totally fine as it is and if used right will help you get going.
Disclaimer: This is no financial advice. This is a tool and I am not responsible for your actions.
If you are interested in the indicator feel free to dm me on TradingView.

Scalping PullBack Tool R1 by JustUncleLDescription
This study project is a Scalping Pullback trading Tool that incorporates the majority of the indicators needed to analyse and scalp Trends for Pull Backs and reversals on 1min, 5min or 15min charts. The set up utilies Heikin Ashi candle charts. Incorporated within this tool are the following indicators:
1. Major industry (Banks) recognised important EMAs in an EMA Ribbon:
Green = EMA89
Blue = EMA200
Black = EMA633
2. The 36EMA (default) High/Low+Close Price Action Channel (PAC).
3. Fractals
4. HH, LH, LL, HL finder to help with drawing Trend lines and mini Trend Lines.
5. Coloured coded Bar high lighting based on the PAC:
blue = bar closed above PAC
red = bar closed below PAC
gray = bar closed inside PAC
red line = EMA36 of bar close
Setup and hints:
Set the chart to Heikin Ashi Candles.
Add "Sweetspot Gold10" indicator to the chart as well to help with support and resistance finding and shows where the important "00" and "0" lines are.
When price is above the PAC(blue bars) we are only looking to buy as price comes back to the PAC
When price is below the PAC(red bars), we are only looking to sell when price comes back to the PAC
What we’re looking for when price comes back into the PAC we draw mini Trendlines utilising the Fractals and HH/LL points to guide your TL drawing.
Now look for the trend to pull back and break the drawn TL. That's is when we place the scalp trade.
So we are looking for continuation signals in terms of a strong, momentum driven pullbacks (normally short term 10-20 pips) of the EMA36.
The other EMAs are there to check for other Pullbacks when EMA36 is broken.
Other than the SweetSpot Gold10 indicator, you should not need any other indicator to scalp the pullbacks.
References:
Fractals V8 by RicardoSantos
Price Action Trading System v0.3 by JustUncleL
SweetSpot Gold10 R1 by JustUncleL
www.swing-trade-stocks.com
www.forexstrategiesresources.com

ScalpSwing Pro SetupScript Overview
This script is a multi-tool setup designed for both scalping (1m–5m) and swing trading (1H–4H–Daily). It combines the power of trend-following , momentum , and mean-reversion tools:
What’s Included in the Script
1. EMA Indicators (20, 50, 200)
- EMA 20 (blue) : Short-term trend
- EMA 50 (orange) : Medium-term trend
- EMA 200 (red) : Long-term trend
- Use:
- EMA 20 crossing above 50 → bullish trend
- EMA 20 crossing below 50 → bearish trend
- Price above 200 EMA = uptrend bias
2. VWAP (Volume Weighted Average Price)
- Shows the average price weighted by volume
- Best used in intraday (1m to 15m timeframes)
- Use:
- Price bouncing from VWAP = reversion trade
- Price far from VWAP = likely pullback incoming
3. RSI (14) + Key Levels
- Shows momentum and overbought/oversold zones
- Levels:
- 70 = Overbought (potential sell)
- 30 = Oversold (potential buy)
- 50 = Trend confirmation
- Use:
- RSI 30–50 in uptrend = dip buying zone
- RSI 70–50 in downtrend = pullback selling zone
4. MACD Crossovers
- Standard MACD with histogram & cross alerts
- Shows trend momentum shifts
- Green triangle = Bullish MACD crossover
- Red triangle = Bearish MACD crossover
- Use:
- Confirm swing trades with MACD crossover
- Combine with RSI divergence
5. Buy & Sell Signal Logic
BUY SIGNAL triggers when:
- EMA 20 crosses above EMA 50
- RSI is between 50 and 70 (momentum bullish, not overbought)
SELL SIGNAL triggers when:
- EMA 20 crosses below EMA 50
- RSI is between 30 and 50 (bearish momentum, not oversold)
These signals appear as:
- BUY : Green label below the candle
- SELL : Red label above the candle
How to Trade with It
For Scalping (1m–5m) :
- Focus on EMA crosses near VWAP
- Confirm with RSI between 50–70 (buy) or 50–30 (sell)
- Use MACD triangle as added confluence
For Swing (1H–4H–Daily) :
- Look for EMA 20–50 cross + price above EMA 200
- Confirm trend with MACD and RSI
- Trade breakout or pullback depending on structure

Scalping with Williams %R, MACD, and SMA (1m)Overview:
This trading strategy is designed for scalping in the 1-minute timeframe. It uses a combination of the Williams %R, MACD, and SMA indicators to generate buy and sell signals. It also includes alert functionalities to notify users when trades are executed or closed.
Indicators Used:
Williams %R : A momentum indicator that measures overbought and oversold conditions. The Williams %R values range from -100 to 0.
Length: 140 bars (i.e., 140-period).
MACD (Moving Average Convergence Divergence) : A trend-following momentum indicator that shows the relationship between two moving averages of a security's price.
Fast Length: 24 bars
Slow Length: 52 bars
MACD Length: 9 bars (signal line)
SMA (Simple Moving Average) : A trend-following indicator that smooths out price data to create a trend-following indicator.
Length: 7 bars
Conditions and Logic:
Timeframe Check :
The strategy is designed specifically for the 1-minute timeframe. If the current chart is not on the 1-minute timeframe, a warning label is displayed on the chart instructing the user to switch to the 1-minute timeframe.
Williams %R Conditions :
Buy Condition: The strategy looks for a crossover of Williams %R from below -94 to above -94. This indicates a potential buying opportunity when the market is moving out of an oversold condition.
Sell Condition: The strategy looks for a crossunder of Williams %R from above -6 to below -6. This indicates a potential selling opportunity when the market is moving out of an overbought condition.
Deactivate Buy: If Williams %R crosses above -40, the buy signal is deactivated, suggesting that the buying condition is no longer valid.
Deactivate Sell: If Williams %R crosses below -60, the sell signal is deactivated, suggesting that the selling condition is no longer valid.
MACD Conditions :
MACD Histogram: Used to identify the momentum and the direction of the trend.
Long Entry: The strategy initiates a buy order if the MACD histogram shows a positive bar after a negative bar while a buy condition is active and Williams %R is above -94.
Long Exit: The strategy exits the buy position if the MACD histogram turns negative and is below the previous histogram bar.
Short Entry: The strategy initiates a sell order if the MACD histogram shows a negative bar after a positive bar while a sell condition is active and Williams %R is below -6.
Short Exit: The strategy exits the sell position if the MACD histogram turns positive and is above the previous histogram bar.
Trend Confirmation (Using SMA) :
Bullish Trend: The strategy considers a bullish trend if the current price is above the 7-bar SMA. A buy signal is only considered if this condition is met.
Bearish Trend: The strategy considers a bearish trend if the current price is below the 7-bar SMA. A sell signal is only considered if this condition is met.
Alerts:
Long Entry Alert: An alert is triggered when a buy order is executed.
Long Exit Alert: An alert is triggered when the buy order is closed.
Short Entry Alert: An alert is triggered when a sell order is executed.
Short Exit Alert: An alert is triggered when the sell order is closed.
Summary:
Buy Signal: Activated when Williams %R crosses above -94 and the price is above the 7-bar SMA. A buy order is placed if the MACD histogram shows a positive bar after a negative bar. The buy order is closed when the MACD histogram turns negative and is below the previous histogram bar.
Sell Signal: Activated when Williams %R crosses below -6 and the price is below the 7-bar SMA. A sell order is placed if the MACD histogram shows a negative bar after a positive bar. The sell order is closed when the MACD histogram turns positive and is above the previous histogram bar.
This strategy combines momentum (Williams %R), trend-following (MACD), and trend confirmation (SMA) to identify trading opportunities in the 1-minute timeframe. It is designed for short-term trading or scalping.


Scalp 1min CryptoThis scalping strategy is designed for 1min timeframe.
It uses indicators: SuperTrend 15m ( is used to filter the trade as to open only long position or short position), Wavetrend 1min, Bollinger Band 3min, Stoch 3min to find entry.
TP: optimized value : 0.5 - 1
Stoploss: You have two choice: % or when SuperTrend reverse
If you would like use scripts, please ib to me.
You are welcom!

Scalper [SystemAlpha]This is a scalping tool designed for a two pane chart layout.
Includes:
- EMAs
- Price Action Channel
- Bar Color based on PAC, Impulse and TTM
- Pivot HL - Price, Shape, Text
- Pivot Extensions
- Dynamic Support Resistance
Reference:
- Scalping Swing Trading Tool R1-4 by JustUncle
- Support Resistance - Dynamic by LonesomeTheBlue
Scalping BerkinAlex 1
--------Inglés---------
Updated to Pine Script v4. 👌
Added labels (indicators) of Purchase and Sale according to moving averages for scalping and intraday. 🤑
Fusion of the "Scalping BerkinAlex 3" indicator with the "Scalping BerkinAlex 1", so as not to occupy a slot of indicators unnecessarily if you have a free account. 😜
Alert system designed, now you can create an alert in free mode according to the possibility of buying or selling an asset.🔔
Errors found fixed.💪
---------Español---------
Actualizado a Pine Script v4. 👌
Añadidas etiquetas (indicadores) de Compra y Venta según medias móviles para scalping e intradía. 🤑
Fusión del indicador "Scalping BerkinAlex 3" con el "Scalping BerkinAlex 1", para así no ocupar un slot de indicadores innecesariamente en caso de disponer cuenta gratuita. 😜
Sistema de alertas diseñado, ahora podrás crear una alerta en modo gratuito según exista la posibilidad de comprar o vender un activo.🔔
Errores encontrados solucionados.💪

Scalping with Heikin Ashi candle pattern for BTCUSDThis strategy is based on a trading idea that works for me on crypto markets. I use this trading strategy manually from a couple of weeks.
It is based on 1 minute timeframe and heikin ashi candles.
Basically, the strategy places two pending orders in a certain moment of the market and scalp as many pips as possible. Then suddenly it exits before price correction.
The scope of this script is to back test the strategy on a larger period but due to trading view limitation it has to be done modifing the backtesting period manually.
If some of you want to test, please write in comment section.
Please use comment section for any feedback.
Next improvment (only to whom is interested to this script and follows me): study with alerts. Leave a comment if you want to have access to study.

PeBAS FX ScalperMy Forex Scalping Script
Use in 5 Min Chart, TP = 20 PIP'S. (Maximum 15 Min Chart with 30PIPS - not higher, not lower!)
Close @20 PIP'S!
USE STOP LOSS 150 PIP Maximum!!!!!!!
Turn Position when it's @ -50 PIP or close it.
USE STOP LOSS 150 PIP Maximum!!!!!!!
Trade only at the Main-Times (EurUSD 9 -18.00 European Time and so on!)
Take a look, and have fun!
This Script is not repainting, but it's really only for Scalping! Dont use for long-time-Trades, dont use for DAX, DJI, SPX and so on!
Play with the magic Parameters, may be you'll find better ones!
Hope you like it, would be glad to hear from you.

scalping signalshere is a scalping indicator that give you signals with different ways..
share with me your idea for improving it...

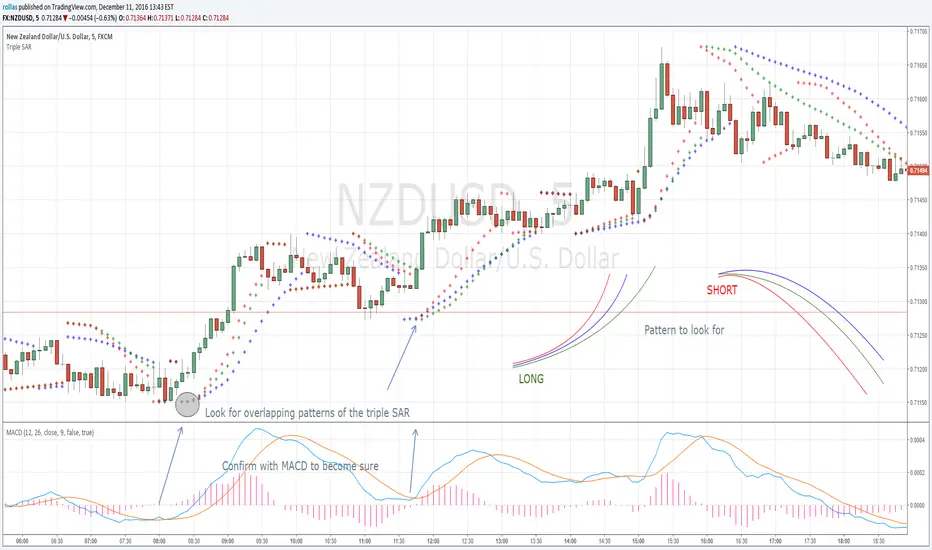
Triple SAR Scalping 5MTriple SAR scalping method must be used with a 5 minute chart. Look for the patterns that 3 bands overlap. Close deal within 4-5 pip profit or build your own style after getting comfortable with this technique and share your approach with us for maybe higher profits.
Scalping Trading System bot Crypto and StocksThis is a trend trading strategy scalping bot that can work with any type of market. However I concluded my tests so far with Crypto, Stocks and Forex, and with optimizations always could be found some profitable settings.
Indicators
SImple Moving Average
Exponential Moving Average
Keltner Channels
MACD Histogram
Stochastics
Rules for entry
long= Close of the candle bigger than both moving averages and close of the candle is between the top and bot levels from Keltner. At the same time the macd histogram is negative and stochastic is below 50.
short= Close of the candle smaller than both moving averages and close of the candle is between the top and bot levels from Keltner. At the same time the macd histogram is positive and stochastic is above 50.
Rules for exit
We exit when we meet an opposite reverse order.
This strategy has no risk management inside, so use it with caution !

Scalping Sheriff Strategy TraderReceive alerts for Long and Short Scalp trades.
Inspired by the RSI Sheriff Strategy

Triple Sar Scalping 5MTriple Parabolic SAR scalping method must be used with a 5 minute chart. Look for the patterns that 3 bands overlap. Close deal within 4-5 pip profit or build your own style after getting comfortable with this technique and share your approach with us for maybe higher profits.

SCALPER supertrend with entry exit points by MPRnew scalper more mulish , entry and exit points long term plus cloud for early entry points and minimize the bad entries.
also almost everything is easy to change value long MA short MAs etc
to adjust it to your strategy or short term change input values depending on what u want
bar colors for easy indication, change depending on th einput of the first 2 moving averages on the chart
let me know how it works, so far i personally like it hehe
right now is for long entries
like if you like it
Happy Trading
Scalping The Bull - BullBot for Stock and ForexName : Scalping The Bull - BullBot for Stock and Forex.
Category : Scalping tool for the Stock and Forex market, optimized for trend following and mean reversal operations.
Timeframe : Recommended to be used on timeframe 1m, 5m, 30m, 1h, 1D, depending on the specific technique.
Technical Analysis : The indicator implements the trading techniques of Scalping The Bull. Even if the techniques are exquisitely discretionary, we have written the indicator with our interpretation of the them to identify the patterns automatically. We also codified a the process described below, giving the possibility to trade mechanically. The indicator is designed for a short-term (intraday or scalping) trend-following approach, where the entry is made on the breakout of significant price levels. Entry setups are calculated by price action analysis using 5-10-50-200 EMAs as reference. According to the interaction of price action with the EMAs, patterns are generated, and the indicator finds them independently.
Suggested use :
The process follows:
1. Selection of the instrument to trade on
Given the short duration of the trades, there must be sufficient volatility and liquidity. You can add the different instruments to a TradingView watch list and then make a first skim, considering the daily percentage change. Once an instrument has been selected, the indicator allows you to check at a glance things like the Rate of Change (ROC) and the detection of opening gaps.
2. Identification of the main trend
Once in the instrument, the main trend of the underlying is identified through the 50-200 EMAs: if the fast EMA is greater than the slow one, we have a bullish trend, otherwise a bearish trend on a higher timeframe than the one in which the trade is executed. The rule is to trade in favor of the main trend. For this reason, the indicator prints to chart reference averages. It is also recommended to check the daily timeframe, always using the averages, preferring those instruments where the price follows an average without touching it too often.
3. Identification of breakout levels
Breakout levels favoring the trend are identified near the daily high/minimum, the previous day's high/minimum, or the weekly high/minimum. The indicator prints such levels on the chart with lines.
4. Identification of secondary trends and entry levels
Patterns can be divided into three categories. Trend-based ones have the function of identifying the secondary trend and then confirming the trade. Breakout patterns are used to find entry levels.
a. Trend Continuation Patterns (Price/EMA) : are used to get confirmation that the minor trend is in agreement with the major trend (i.e., Shimano, Dive, Dip, Anti-crossing).
b. Trend Change Patterns (Price/EMA) : are used to get confirmation that a minor trend in the opposite direction of the main trend is ending and therefore are used to get further confirmation of the trade (i.e., Bounce, Viagra, Return to Highs/Minimums).
c. Breakout Patterns : identify the optimal price levels for trade entry (i.e., Third Touch, Bud, Maxi Bud, Color Change).
Details on how the specific patterns are computed can be found below in the description of this indicator.
5. Definition of Stop Loss and Take Profit
Once the entry price is calculated, different types of Stop Loss (e.g., relative minimum of Tot candles, first or second average below price, price levels) and Take Profit (relative maximum of Tot candles, first or second average above price, price levels) can be considered. A risk/reward ratio of at least 1.2 should always be considered, depending on one's risk appetite.
6. Define the position management strategy
Normally, when a mock breakout is executed, the advice is to exit the trade as soon as possible or at least to bring the stop-loss to break even. A trailing stop on relative lows or the nearest average is also possible.
7. Enter the position
Usually, with a stop order, follow the rules defined in the previous steps.
Configuration :
Graphical configuration :
Show ROC filter : turns the background green when the asset has enough volatility to activate patterns.
Show Legend : enables the description on the lines of the trigger points.
Show Table : displays the volatility table where the GAP and ROC (Rate of Change) information is present.
Show Take Profit % - Automatic : shows the percentage scale that automatically adjusts to the volatility of the chart to identify the Take Profit and Stop Loss at a glance.
Label color : adjusts the color of the labels.
Trigger Point Colors : Adjust the colors of the trigger points.
Trigger Points
Today's highs and lows : draw on the chart the closing price of Yesterday, the opening price of the daily candlestick, and the highs and lows of the day (high in purple, low in red, Yesterday's close in green, and open in orange).
Yesterday's highs and lows : draw on the chart the highs and lows of the previous day (high in yellow, low in red). An alert can be activated with a % offset.
Weekly highs and lows : draw the highs and lows of the previous week on the chart (high in white, low in red). An alert can be activated with a % offset.
Price Patterns :
Gap : a label and an alert can be activated.
Pay..!! : a label and an alert can be activated.
Third Touch and Third Touch on EMA : a label and an alert can be activated.
Return to Highs : a label and an alarm can be activated.
Return to Lows : a label and an alarm can be activated.
Long and Short Color Change : a label and an alert can be activated.
EMA Patterns :
Viagra long and short : a label and an alert can be activated for the specific market and EMA situations.
Shimano : a label and an alert can be activated with a configurable candlestick threshold.
Emergence - Dive : a label and an alert can be activated.
Anti-crossing - Anti-crossing short : a label and an alarm can be activated.
Bounce on EMA long and short : a label and an alert can be activated with a configurable tick tolerance.
Bud - Maxi Bud - Bud Short : a label and an alert can be activated on all timeframes.
Alerts :
Activate all alerts : you can activate alerts by clicking on Alerts, then on the condition "BullBot" and then on "Any alert() function.". So that you know, creating alerts on the price-EMA crossing is also possible.
Patterns :
The list of patterns that are automatically recognized by the indicator follows.
Gap : indicates when a Gap Up or Gap Down occurs at the opening of a session, particularly useful in the equity markets.
Pay : signals when the stock has risen by a sufficient percentage to be tradable, adjusts the triggering of many bounce and breakout patterns.
Viagra : signaled for both a long and short setup, indicates an overbought or oversold situation by the appearance of gaps and a series of consecutive candles contained by the fast EMAs (5 -10) depending on the market of reference.
Third touch and third touch EMA : signals a breakout conformation, indicated when three touches occur at the same price level or below one of the slow EMAs (50 - 200).
Shimano : detects lateralization between Ema 50 and Ema 200, indicating that we are in a retracement phase and that a new impulsive move may soon develop.
Emergence - Dive : these are the main patterns for identifying the trend. The indicator signals when the EMA 50 and 200 are approaching to anticipate their crossing to the top or bottom.
Anti-crossing long - Anti-crossing short : occurs when the price, after an important impulse, makes a retracement to the EMA 200, bringing the EMA 50 to approach it without ever touching it, but before the cross, an opposite impulse determines the end of the retracement and the resumption of the trend in place.
Rebound : signals in the first rebound on the EMA 50 and EMA 200 after an impulse that recorded new highs or lows.
Return to the Highs - Return to the Lows : this pattern is closely related to rebounds. It indicates that the price is approaching the highs or lows again after a rebound on a slow EMA.
Change Color : is based on the previous session's closing price. It indicates when the price is approaching either from above or below this level, which determines the Color of the daily candlestick.
Bud - Maxi Bud - Bud Short : Bud occurs when the price breaks above EMA 10, and there are at least two consecutive candles between the high and low of the breakout impulse. Maxi Bud signals near the day's highs when this situation occurs, and Bud Short signals the breakout levels for a short trade.

Scalping The Bull - BTC Chart for Trend AnalysisName: BTC Chart for Trend Analysis
Category: Scalping, Trend Analysis .
Timeframe: 1M, 5M, 30M, 1D depending on the specific technique.
Technical Analysis: The indicator supports the operations of the trader named "Scalping The Bull" who uses BTC as an Index for Crypto trading.
Suggested usage: When trading on altcoins, to check whether or not they are trending with Bitcoin and whether those anticipate its movements.
It is therefore possible to see Bitcoin specifically if it makes red or green candles and how it is positioned with respect to the EMA 5, 10, 60, 223, however configurable from the panel.
Used in conjunction with Scalping The Bull Indicator or PRO Indicator, on the main panel.
Configuration:
EMA Length:
- EMA 1: by default 5, configurable
- EMA 2: by default 10, configurable
- EMA 3: by default 60, configurable
- EMA 4: by default 223, configurable
Colors can be modified from "Settings" > "Style"
Designed to be used with the following the indicator:

Scalping The Bull PRO IndicatorName : Scalping The Bull PRO Indicator
Category : Scalping, Trend Following, Mean Reversion .
Timeframe : 1M, 5M, 30M, 1D depending on the specific technique.
Technical Analysis : The indicator supports the operations of the trader named "Scalping The Bull" who uses price action and exponential moving averages.
Suggested usage : Crypto Market only , on Altcoins showing strong trends for scalping and intra-day trades. Trigger points are used as entry and exit points and to be used to understand when a signal has more power.
Scalping The Bull PRO Indicator can identify automatically the following conformations with labels on the charts and/or custom alerts.
Shimano : look at the price records of a consecutive series of closings between the EMA 60 and the EMA 223 when a certain threshold is reached. Use the trigger points as price structures to identify entry and exit zones (e.g. breakout of the yesterday high as for entry point).
Bomb : look at the price registers a percentage variation in a single candle, greater than a threshold such as 2%, in particular on shorter timeframes and around the trigger points.
Viagra : look when there is a consecutive series of closes below the EMA 10, a breakout of the EMA should be an important sign of the change of the trend. Viagra can be used with either a Trend-following or Counter-trend approach, so it can be observed when EMA 60 is lower than EMA 223, or when EMA 60 is higher than EMA 223.
Downward fake : look when, after a cross under (Death Cross), the price returns above the EMA 223 using the yesterday high as a trigger point.
Emergence : look at the EMA 60 is about to cross over the EMA 223.
Anti-crossing : look at, after an important price rise and a subsequent retracement, the EMA 60 is about to cross under the EMA 223 but a bullish impulse brings the price back above the EMAs.
For Sales : look at two types of situations: 1) when the price falls by more than 10% from the opening price and around yesterday's low or 2) when the price falls and then reaches, in the last 5 days, a bigger percentage and then breaks a trigger point.
Colour change : look at the opening price of the session - indicated as a trigger point.
Third touch of EMA 60 : look for 3 touches below the EMA 60, and enter when there is a close above the EMA 60.
Third touch of EMA 223 : look for 3 touches below the EMA 223, and enter when there is a close above the EMA 223.
Bud : look at price when it crosses upwards the average 10 and subsequently at least 2 "rest" candles are between the maximum and minimum of the breaking candle.
Fake on EMA 10 : look for the open of a candle higher than the EMA 10, the minimum of the candle lower and the closing price returns above the EMA 10.
For Stop Loss and Profit Targets consider a proper R/R depending on Risk Management, using price structures such as the low of the entering candle and a quick Position Management moving quickly the Stop-Loss at Break-Even.
Configuration :
Graphical Configuration :
Additional EMA : You can display an additional average, e.g. 20-period average.
Session Separators : indicates the beginning of the current session (in blue) .
Background : signals with the background in green an uptrend situation ( 60 > 223) and in red background a downtrend situation (60 < 223).
Labels of Trigger Points .
Take Profit Levels with a display offset .
Label size .
Trigger points :
Today's highs and lows : draw on the chart the opening price of the daily candle and the highs and lows of the day (high in purple, low in red and open in green). An alert can be activated with % offset.
Yesterday's highs and lows : draw on the chart the opening price of the daily candle, the highs and lows of the previous day (high in yellow, low in red). An alert can be activated with % offset.
Colour Change : an alert can be activated with % offset.
EMA Conformations :
Shimano : a label and/or an alert can be activated with a configurable threshold of candles.
Emersion : a label and/or an alert can be activated.
Anti-crossing : a label and/or an alert can be activated.
Fake on EMA : a label and/or an alert can be activated with a configurable threshold of candles.
Price-EMA Conformations :
Viagra : a label and/or an alert can be activated for specific EMA situations, with a configurable threshold of candles.
Third Touch on EMA : a label and/or an alert can be activated for a specific EMA bounce.
Bud : a label and/or an alert can be activated on all timeframes except 1m.
Fake on EMA 10 : a label and/or an alert can be activated on all timeframes except 1m.
Bud + Fake : a label and/or an alert can be activated on all timeframes except 1m.
Price Conformations :
Bomb : a label and/or an alert can be activated with a configurable threshold %.
For Sales : a label and/or an alert can be activated with a configurable threshold %.
Activate all alerts : you can activate all alerts clicking on Alerts, then on Condition “PRO Scalping the Bull” and then selecting “Any alert() function”.
N.B. It is also possible to creates alerts on price-EMA crossing.
