GOLD SCALPERGOLD SCALPER is an advanced trading indicator specifically designed for scalping on GOLD markets. It combines an ultra-fast prediction line with optimized Support & Resistance levels, providing a unique approach to GOLD trading.
Key Features
Ultra-Fast Prediction Line
The indicator contains the only directional indicator in the chart - an ultra-fast prediction line that reacts instantly to price changes. The line is drawn on every bar for maximum speed and provides clear BUY, SELL, and WAIT signals.
GOLD-Optimized Support & Resistance
The S/R system is specifically optimized for GOLD characteristics. It uses pivot period 10 for faster detection, sensitivity 1 for maximum sensitivity, and strength filter to display only strong levels with 3+ touches.
Anomaly Warning System
A unique early warning system for anomalies. When unusual market behavior is detected, S/R levels turn orange, alerting to potential risky situations.
Session Filter
An intelligent session filter optimized for GOLD trading. Automatically detects London and New York sessions (8-21 UTC) and adjusts signals based on market activity.
Technical Specifications
Prediction Line
- BUY signal: Vertical green line up
- SELL signal: Vertical red line down
- WAIT signal: Horizontal orange line
- Dotted style for scalping
- Instant reaction to price changes
Support & Resistance
- Pivot Period: optimized for 5M timeframe
- Sensitivity: maximum sensitivity
- Max Lines: 5 (better coverage)
- Strength Threshold: only strong levels
- Retest Tolerance: 0.1% (precision for GOLD)
Anomaly Detection
- Lookback: 20 bars
- Threshold: 2.0 ATR
- Detects: Range expansion, volume spikes, rapid price changes, RSI extremes
- Visual warning: Orange S/R lines
GOLD Optimizations
GOLD-Specific Settings
The indicator is optimized for GOLD trading with the following specific settings:
- Shorter pivot periods for faster reaction
- Maximum sensitivity for GOLD characteristics
- Volume confirmation for more reliable signals
- Session awareness for best trading times
Performance Optimizations
- Cache optimization for all calculations
- Memory management for proper line deletion
- Pine Script v6 for modern functionality
- No linter errors for stable performance
Usage
Recommended Settings
- Timeframe: 5-15M GOLD
- Sessions: London/NY (8-21 UTC)
- Prediction Style: Dotted
- S/R Style: Dotted
- Anomaly Warning: Enabled
Trading Approach
The indicator is designed for a scalping approach with emphasis on speed and accuracy. It combines a fast prediction line for directional signals with slower S/R levels for context and confirmation.
GOLD SCALPER represents a professional tool for GOLD scalping with a unique approach combining speed with precision. It is ideal for traders who need instant signals and reliable S/R levels for their trading decisions.
Cari dalam skrip untuk "scalp"

Adaptive Fractal Grid Scalping StrategyThis Pine Script v6 component implements an "Adaptive Fractal Grid Scalping Strategy" with an added volatility threshold feature.
Here's how it works:
Fractal Break Detection: Uses ta.pivothigh and ta.pivotlow to identify local highs and lows.
Volatility Clustering: Measures volatility using the Average True Range (ATR).
Adaptive Grid Levels: Dynamically adjusts grid levels based on ATR and user-defined multipliers.
Directional Bias Filter: Uses a Simple Moving Average (SMA) to determine trend direction.
Volatility Threshold: Introduces a new input to specify a minimum ATR value required to activate the strategy.
Trade Execution Logic: Places limit orders at grid levels based on trend direction and fractal levels, but only when ATR exceeds the volatility threshold.
Profit-Taking and Stop-Loss: Implements profit-taking at grid levels and a trailing stop-loss based on ATR.
How to Use
Inputs: Customize the ATR length, SMA length, grid multipliers, trailing stop multiplier, and volatility threshold through the input settings.
Visuals: The script plots fractal points and grid levels on the chart for easy visualization.
Trade Signals: The strategy automatically places buy/sell orders based on the detected fractals, trend direction, and volatility threshold.
Profit and Risk Management: The script includes logic for taking profits and setting stop-loss levels to manage trades effectively.
This strategy is designed to capitalize on micro-movements during high volatility and avoid overtrading during low-volatility trends. Adjust the input parameters to suit your trading style and market conditions.

TENKAN SCALPER STRATEGYTENKAN SCALP is a fully automatic trading system.
It is a continuation of our previous ichimoku release. This time however we throw out the rule book and use ICHIMOKU in a very different way.
It applies non traditional money management tactics.
While most trading strategies rely on a stop loss and a take profit target to manage risk. This strategy uses either no stop loss at all or a time based stop loss.
You might ask yourself the question why would you keep a trade open if it goes against you? Here are a phew reasons why the script does what it does.
Forex Markets consolidate most of the time. If you wait long enough your Take Profit will get hit anyways most of the time
You don't have to risk everything per trade. I keep my orders small so to keep some powder to get into some more trades
All the extra trades you take while one trade is in drawdown limit the drawdown as they provide cashflow
On lower timeframes the markets are so chaotic that a stop loss is very likely to get hit by a wick
About backtest below
This backtest uses a spread of 2 pips for entries and a default position size of 100% of equity. This is only possible on exchanges where spread is low and you have 10:1 leverage or more. It does not represent results obtainable without leverage. Do take into account that there are a lot of forex exchanges that provide this leverage, however a 2 pip spread is not always guaranteed and only applies to major pairs.
This backtest does not use the TIME BASED STOPS functionality.
Always start with small position sizing and see how the strategy performs before adding risk.
Explanation of variables:
Chikou(lagging span): pink line, this is price plotted 26 bars ago. People ignore the power of this it is crucial to see how chikou behaves towards past price action as seen in the chart below where we got an entry at red arrow because chikou bounced from past fractal bottom.
Kijun-Sen(base line): Black line or color coded line. This is the equilibrium of last 26 candles. To me this is the most important line in the system as it attracts price.
Kijun = (Highest high of 26 periods + Lowest low of 26 periods) ÷ 2
Tenkan-Sen(conversion line): Blue line. This is the equilibrium of last 9 candles. In a strong uptrend price stays above this line.
Tenkan = (Highest high of 9 periods + Lowest low of 9 periods) ÷ 2
Senkou A (Leading span A)= Pink cloud line, this is the average of the 2 components projected 26 bars in the future.
Senkou A = (Tenkan + Kijun) ÷ 2
Senkou B (Leading span B) = Green cloud line, this is the 52 day equilibrium projected 26 bars in the future.
Senkou B = (Highest high of prior 52 periods + Lowest low of prior 52 periods) ÷ 2
projection: Script uses same function for variable calculation and substracts a number on each next bar as to make a projection of where the variable will be in future bars if price stayed the same. This works as ICHIMOKU calculations use the middle point of a past set of data. The shorter that amount of bars will be in line with the data that it will be restricted to in future if price stayed the same.
Detection of Market Environment
To enter trades the script uses a lot of ICHIMOKU concepts. Contrary to how most people trade ICHIMOKU this script takes an environment that ICHIMOKU identifies as trending upwards and shorts in that environment. The same will be applied to a downtrend where it will open LONGS.
List of CRITERIA for a trend:
Grapling Hook: this is a component based on the chikou span (closing price displaced 26 bars into the past). The script will use an ATR based range to define a possible future projection to the CHIKOU line. For a market to be bullish there should be no price action happening within this area. Market is free to move upwards. Vice versa for bearish .
Kumo Cloud: script will check if price is above the cloud for bullish trend and below cloud for bearish trend .
Chikou above Kijun: script will check if the chikou line is above the KIJUN line of 26 bars ago. This is further confirmation that price is trending high enough compared to it's past data. Vice versa for downtrend.
Kijun projection: script will check if past Kijun is lower than future projected Kijun. This to ensure we get an equilibrium in our favour in the future. Vice versa for downtrend
Tenkan projection: script will check if future Tenkan-sen will be higher than Kijun-sen for an uptrend. Vice versa for downtrend.
Cloud projection: script will check if in 9 bars the Senkou Span A will be higher than Senkou Span B for an uptrend. Vice versa for downtrend.
Example:
This script does not visualise the prediction lines like I show in the example. I show them here to clarify how the script works.
Usage
Backtests are not indicative of future results, although a trader may want to use a strategy script to have a deeper understanding of how their strategy responds to varying market conditions, or as a tool for identifying possible flaws for a strategy that may be indicative of good or bad performance in the future.
Strategy Settings:
Minimum Body Size (atr): this is the minimum ATR a signal bar needs to be for entry. This is useful because our TP is based on previous bar.
Lot size per trade: this setting does not impact backtest. It is used to for the signals to let tradingconnect.com know your position size.
Direction: do you want to trade longs or shorts. I personally use both a long bot and a short bot at the same time.
Positions Allowed: the amount of positions the script will keep open as a maximum. You do not want to open too many positions, this is for risk management.
Close all positions at drawdown: if total open positions loss gets to this % target it will close all positions.
MetaTrader Prefix: when the script sends a signal it will put this text right before the symbol name from syminfo.ticker
MetaTrader Suffix: when the script sends a signal it will put this text right after the symbol name from syminfo.ticker
Charts below are some examples on how the script handles orders on default settings:
without time based SL
with time based SL
how it handles pyramiding
www.tradingview.com
Tradingconnector.com:
For full automation of the forex market the script uses this connector to execute trade on MT4. The alerts the script sends using the alerts() function call are structured in a way tradingconnector will recognise and send directly to MT4. You can find documentation about this tool on their own website.
Personal recommendation is to start with a minimum lot size and track performance, if you are comfortable scale the size up. You can do that by increasing the lot size setting in the script and making a new alert. Make sure to delete the old one.
How to access
You can see the Author's Instructions below to visit our telegram to get more information on how to get access.

3C MACD & RSI Scalper no repaintThis is not a set and forget strategy. It needs constant tweaking to maintain a high winrate. Also what works on one pair can be horrible on another.
This strategy works best on the 1 min or 5 min TF but also works well on the 15 min. Haven't done any testing in higher TF's as im only interested in scalping.
If enabled you can retrive data on the MACD and RSI from any timeframe.
The strategy do not repaint.
You can filter on sessions as well as days. Often trading during say only the EU times and not trading during weekends yields better results. This is because weekeds and eg. the Asia Sessions are alot less volatile.
You do not need a 3c subscription to run this strategy as the bot turns on and off the bot itself.
Instructions for the 3commas connector:
1. First, you need to prepare 3commas Long/Short bots that will only listen to custom TV signals.
2. Inputs for the 3commas bot can be found at the end of the user inputs.
3. Once you have entered the required details into the inputs, turn on 3commas comments. They should appear on the chart (looks messy).
4. Now you can add the alert where you should paste the 3commas Webhook URL: 3commas.io
5. For the alert message text insert the placeholder {{strategy.order.comment}} and delete the rest. 6. Once the alert is saved, you can turn off those 3commas comments to have a clearer chart.
7. With a new alert, the bot and trade should launch.
Long or Short trades are determined with a crossing of the fast MA over the slow MA for Long and the opposite for Short. Trades should only happen close to the crossovers.
You can select from various different MA's and of course lenghts. I often find that using HEMA as the fast MA and DEMA as the slow give more trades while also maintaining a high winrate.
Then for Long we use the MACD indicator where we look for high peaks in negative values for Long and vice versa for Shorts. These should be significantly higher than other peaks (or if you will lower peaks for a Long).
The key is to detect high peaks on the histogram, which we will try to achieve by checking if the last 2 values were higher than X bars back. If you want to make it even more specific, then you can turn on the additional checkbox which compares the current value to the average value of X bars back, and if it is greater than, say, 72% the value of the average then it's ok to enter the trade.
The RSI filter, sets the maximum RSI threshold for a long position and the minimum for a short. By default and what i recomend is that you enter Longs when RSI is above 50 and shorts when RSI are below 50.
-You can set confirmation of the trade direction with RSI, i.e. for Long the RSI must rise a specified number of bars back, vice versa for Short.
Enabling the pullback filter is great to avoid Longing tops and Shorting bottoms.
Whats ahead. I really want to incorporate RSI divergencies, but haven't figured out how yet. Any other ideas would be greatly appreciated.
Have a look at my other strategies. They are similar to this but works abit differently.
The 3 strike line and the engulfing candles are not something that has an impact on the script yet, and might never be. But i do like to turn them on for a visual to see if the trade the strategy opened is a good one.

Agressive ScalperThis indicator I thought after a while of research and decided to code for people that wants to scalp on low time frames. It's recommended to use it in 1 to 5 min timeframes. It uses ATR, Past high and lows and stochastic overbought and oversold zones along with some consolidation code to avoid fast swings. I also added Take Profit and Stop Loss signals based on slow ATR values. I may add more features later on if people find it useful.

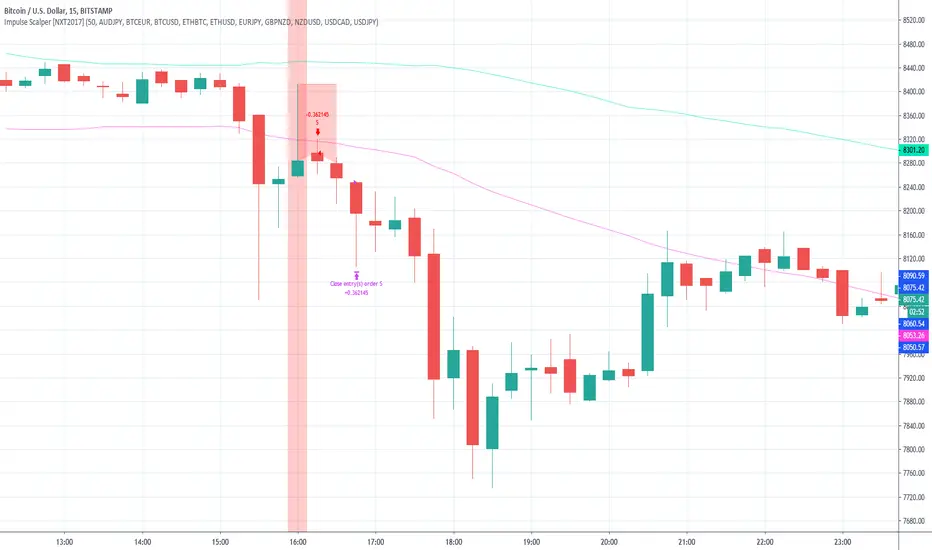
Impulse Scalper [NXT2017] - with included market scannerPrivate Indicator.
HI BIG PLAYERS,
with this indicator it is possible to analyze small rebound effects in the trading market and to scalp the movement into the trend again.
HOW IT WORKS
Hereby the indicator use a candleformation with a huge wick inside of a band, based on a Simple Moving Average on the 50 highs and 50 lows.
A signal is shown with vertical red/green background around the bar for selling/buying. Furthermore, the high/low of the signal serves as StopLoss line and makes a horizontal red line inside the active trading time. The trade is to closing if the second candle after the signal is finished.
For example:
1. candle => signal
2. candle => entry on open price with the SL
3. candle => nothing to do
4. candle => close your trade after candle 3 is finished
For the analysis I have set the following settings:
Initial Capital: 100 000 (the default setting)
Base Currency: USD
OrderSize: 3% of equity
Pyramiding: 1 orders
Commission 0%
Verify Price For Limit Orders: 0 ticks
Slippage 0 ticks
Recalculate:
After Order is Filled (deactived)
On Every Tick (deactived)
A market scanner is also integrated in this indicator. Since good signals rarely occur in a market, the market scanner allows up to 10 markets to browse for the signals simultaneously. My favorite markets are currently selected as default.
The 10 default markets are:
AUDJPY
BTCEUR
BTCUSD
ETHBTC
ETHUSD
EURJPY
GBPNZD
NZDUSD
USDCAD
USDJPY
Market Scanner in action (in the settings you can also hide the labels):
Of course, alerts are also possible with the TradingView Alerts system. For example it's possible to get a message per signal to your e-mail, that you use on TradingView.
Access to the indicator: use the link below, thanks for your attention!
Kind regards
NXT2017
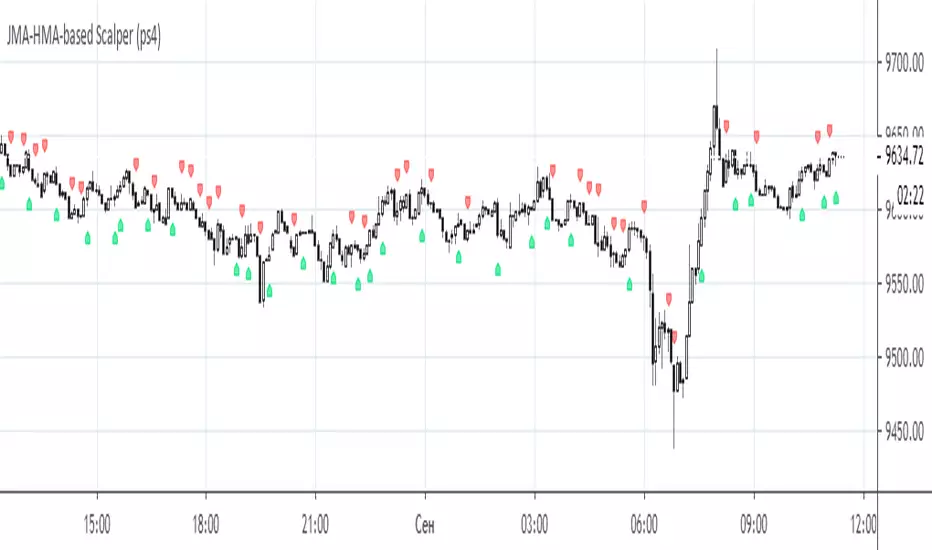
JMA-HMA-based Scalper (ps4)This is an old compilation of mine suitable for scalping. To filter out the generated signals use Difference value between on the Settings menu.
SKARB Long/Short Scalping EURUSDThe indicator is specially created for scalping the euro-dollar
Best timeframes 5 m and 15 m

PeBAS €$ Scalper 5m ALERT VersionHere is the EurDollar ScalpingScript for Alerts.
Have fun and the sun in your heart!

Mayfair Fx Scalper✅ Mayfair FX Scalper — By EastWave Capital
The Mayfair FX Scalper is a precision-focused, closed-source indicator designed for short-term intraday trading, particularly scalping on lower timeframes such as 1-minute, 3-minute, and 5-minute charts. This tool is developed by EastWave Capital and is based on a combination of Relative Strength Index (RSI) extremes and specific candlestick structure patterns to detect potential exhaustion and reversal points in the market.
🔍 How It Works:
The algorithm operates by evaluating three core elements:
RSI Extremes:
RSI is calculated using default settings.
Buy signals are considered only when the RSI on the previous candle is below 22 (oversold), and the current candle is bullish, while the previous one was bearish.
Sell signals are considered when the RSI on the previous candle is above 78 (overbought), and the current candle is bearish, while the previous one was bullish.
Candle Confirmation Logic:
The system waits for candle confirmation (e.g., shift in bullish/bearish structure) rather than triggering signals based on RSI alone.
This avoids false triggers in strong trends and filters weak entries.
SL/TP Estimation (Visual):
While not automatically placing orders, the indicator can optionally display lines or small labels showing a Stop Loss at the previous swing high/low (±0.5) and TP levels at 1R, 2R, and 3R based on that stop.
These visual aids help traders plan risk/reward and exits manually.
📈 How to Use:
Timeframes: Best suited for 1M, 3M, and 5M charts
Markets: Works well on Gold (XAU/USD), Forex majors, Indices, and Crypto
Session: Performs best during high volatility sessions (London & NY)
Use Case:
Wait for a signal label to appear after a clear momentum move.
Confirm price action and trend context.
Use provided visual SL/TP labels or apply your manual RR planning.
Combine with structure breaks, FVG zones, or liquidity sweeps for confluence.
⚠️ Important Notes:
This indicator does not repaint.
No automatic trades are executed. Signals are visual.
Not intended for use in isolation; best when combined with proper trade management and confirmation tools.
Past performance does not guarantee future results. Always manage risk appropriately

XRP Scalping with EMA Crossover Anticipation This script is designed to detect scalping opportunities on XRP by anticipating EMA crossovers, reinforced with technical confirmation filters.
Methodology
- The core signal is based on the crossover between a fast EMA (9) and a slow EMA (21).
- RSI (14) conditions are applied to avoid weak setups: RSI must be above 40 for buy signals and below 70 for sell signals.
- Before any crossover is validated, the script requires at least two consecutive “pre-crossover” signals. These indicate favorable momentum and convergence conditions before the crossover occurs.
- Final signals are only displayed if this minimum number of preconditions is met.
Application
This system is optimized for scalping on the 1-minute to 5-minute timeframes but can be adapted for longer-term setups by adjusting parameters. The anticipation logic helps reduce lagging entries and improves signal selectivity during volatile conditions.
Both pre-crossover and confirmed crossover conditions include alert options. The code is fully editable and customizable.
Session Breakout Scalper Trading BotHi Traders !
Introduction:
I have recently been exploring the world of automated algorithmic trading (as I prefer more objective trading strategies over subjective technical analysis (TA)) and would like to share one of my automation compatible (PineConnecter compatible) scripts “Session Breakout Scalper”.
The strategy is really simple and is based on time conditional breakouts although has more ”relatively” advanced optional features such as the regime indicators (Regime Filters) that attempt to filter out noise by adding more confluence states and the ATR multiple SL that takes into account volatility to mitigate the down side risk of the trade.
What is Algorthmic Trading:
Firstly what is algorithmic trading? Algorithmic trading also known as algo-trading, is a method of using computer programs (in this case pine script) to execute trades based on predetermined rules and instructions (this trading strategy). It's like having a robot trader who follows a strict set of commands to buy and sell assets automatically, without any human intervention.
Important Note:
For Algorithmic trading the strategy will require you having an essential TV subscription at the minimum (so that you can set alerts) plus a PineConnecter subscription (scroll down to the .”How does the strategy send signals” headings to read more)
The Strategy Explained:
Is the Time input true ? (this can be changed by toggling times under the “TRADE MEDIAN TIMES” group for user inputs).
Given the above is true the strategy waits x bars after the session and then calculates the highest high (HH) to lowest low (LL) range. For this box to form, the user defined amount of bars must print after the session. The box is symmetrical meaning the HH and LL are calculated over a lookback that is equal to the sum of user defined bars before and after the session (+ 1).
The Strategy then simultaneously defines the HH as the buy level (green line) and the LL as the sell level (red line). note the strategy will set stop orders at these levels respectively.
Enter a buy if price action crosses above the HH, and then cancel the sell order type (The opposite is true for a stop order).
If the momentum based regime filters are true the strategy will check for the regime / regimes to be true, if the regime if false the strategy will exit the current trade, as the regime filter has predicted a slowing / reversal of momentum.
The image below shows the strategy executing these trading rules ( Regime filters, "Trades on chart", "Signal & Label" and "Quantity" have been omitted. "Strategy label plots" has been switched to true)
Other Strategy Rules:
If a new session (time session which is user defined) is true (blue vertical line) and the strategy is currently still in a trade it will exit that trade immediately.
It is possible to also set a range of percentage gain per day that the strategy will try to acquire, if at any point the strategy’s profit is within the percentage range then the position / trade will be exited immediately (This can be changed in the “PERCENT DAY GAIN” group for user inputs)
Stops and Targets:
The strategy has either static (fixed) or variable SL options. TP however is only static. The “STRAT TP & TP” group of user inputs is responsible for the SL and TP values (quoted in pips). Note once the ATR stop is set to true the SL values in the above group no longer have any affect on the SL as expected.
What are the Regime Filters:
The Larry Williams Large Trade Index (LWLTI): The Larry Williams Large Trade Index (LWTI) is a momentum-based technical indicator developed by iconic trader Larry Williams. It identifies potential entries and exits for trades by gauging market sentiment, particularly the buying and selling pressure from large market players. Here's a breakdown of the LWTI:
LWLTI components and their interpretation:
Oscillator: It oscillates between 0 and 100, with 50 acting as the neutral line.
Sentiment Meter: Values above 75 suggest a bearish market dominated by large selling, while readings below 25 indicate a bullish market with strong buying from large players.
Trend Confirmation: Crossing above 75 during an uptrend and below 25 during a downtrend confirms the trend's continuation.
The Andean Oscillator (AO) : The Andean Oscillator is a trend and momentum based indicator designed to measure the degree of variations within individual uptrends and downtrends in the prices.
Regime Filter States:
In trading, a regime filter is a tool used to identify the current state or "regime" of the market.
These Regime filters are integrated within the trading strategy to attempt to lower risk (equity volatility and/or draw down). The regime filters have different states for each market order type (buy and sell). When the regime filters are set to true, if these regime states fail to be true the trade is exited immediately.
For Buy Trades:
LWLTI positive momentum state: Quotient of the lagged trailing difference and the ATR > 50
AO positive momentum state: Bull line > Bear line (signal line is omitted)
For Sell Trades:
LWLTI negative momentum stat: Quotient of the lagged trailing difference and the ATR < 50
AO negative momentum state: Bull line < Bear line (signal line is omitted)
How does the Strategy Send Signals:
The strategy triggers a TV alert (you will neet to set a alert first), TV then sends a HTTP request to the automation software (PineConnecter) which receives the request and then communicates to an MT4/5 EA to automate the trading strategy.
For the strategy to send signals you must have the following
At least a TV essential subscription
This Script added to your chart
A PineConnecter account, which is paid and not free. This will provide you with the expert advisor that executes trades based on these strategies signals.
For more detailed information on the automation process I would recommend you read the PineConnecter documentation and FAQ page.
Dashboard:
This Dashboard (top right by defualt) lists some simple trading statistics and also shows when a trade is live.
Important Notice:
- USE THIS STRATEGY AT YOUR OWN RISK AND ALWAYS DO YOUR OWN RESEARCH & MANUAL BACKTESTING !
- THE STRATEGY WILL NOT EXHIBIT THE BACKTEST PERFORMANCE SEEN BELOW IN ALL MARKETS !

Brutal ScalpsThe "Brutal Scalps" indicator is designed for both novice and expert traders looking to take advantage of short-term price movements. This powerful tool provides a multi-timeframe trend analysis along with dynamic Take Profit (TP) and Stop Loss (SL) levels, enhancing your trading decisions and risk management.
Features:
Multi-Timeframe Trend Analysis - You get a bird's eye view of the main oscillators on the selected timeframe
Last trade panel - Overview of the last trade values: TPs, SL and entry along with a quick stat on the performance over the last 10 trades
Baseline - MA based on either volatility or volume . Changes color depending on the angle and the consolidation area threshold that can be modified.
ATR(Average True Range) dynamic take profits and stop losses
Trend color - Can be enabled to highlight local trend start and end
Leverage setting
This setting is used to send a leverage amount with your alerts, this can be useful if you send your alerts though webhooks.
Signalling type - Classic
The original Brutal scalps signal detection mechanism based on order block/ engulfing candle detection only. Conditions in the MTF trend analysis panel must be met.
Signalling type - Breakout
Prioritizes candle formation that break a given number of candle formation(Eg. Highest high in the last x candles) , combined with the baseline entry condition
Signalling type - Trend following
Angled more towards longer direction moves. Uses adx combined with the price relationship to the 200MA
Key levels zone- Plots the liquidity pockets on the chart
Swing detections- uses moving averages that are plotted in regards to the selected number of candles.
Candle colors - The yellow candles are bullish engulfing candles, while the purple candles are bearish engulfing candles. These candles are also highlighted because their volume exceeds that of the previous 10 candles.
Peak profit - shows a label that displays the highest profit level reached after the signal was triggered , multiplied by the leverage in the input.
How to use:
Brutal Scalps is like your battle plan, you prepare for facing the markets with tools and insights.
1. Use the Multi TF Trend settings to set up the Trend Table in the top right (default position) panel. This will give you an overview of the oscillators in the selected timeframe. You should always watch a higher timeframe than the one you are using on the chart.
Ex.: If you are charting 15m , use the 1hr setting on the trend panel.
2. The baseline is one of the key factors in signal identification, use this wisely. The baseline consolidation threshold is the sensitivity of the line to stagnating candles. If the market is static and no trades come out , it might be because the threshold is set too high. The default of 3 should be a good fit for most setups. Just bare in mind that the higher the threshold the more candles will be considered as a consolidation area. Higher threshold also means better confirmation but also less trades coming in.
3. Signalling types can and should be used in regards to the current market formation.
Examples:
- If a market is moving in a stairs pattern, a good way to tackle it would be through the breakout signalling type.
- When the market is clearly trending, the use of the trend following type is most suited.
- If you want an all-rounder setup that is a jack of all trades but master of nothing, then the Classic type would be the most suited.
Additionally, if the market is extremely undecided and the above types don't perform that well on their own, the use of Allow Opposite Signal Only can reduce losses by only posting trades that are in the opposite direction, no more consecutive buys or sells.
Set the key levels zones to have extra manual confirmation. These zones are based on order blocks and highlight important liquidity areas. While these don't have any direct impact on the signal recognition, they can help to visually validate them.

Pro ScalperOverview
The Pro Scalper indicator is a powerful day trading tool designed specifically for the 30-minute timeframe, catering to stock and cryptocurrency markets. It provides traders with buy and sell signals, dynamic overbought/oversold zones, and reversal signal indicators. By combining a Kalman-adapted Supertrend calculation for buy and sell signals, and VWMA bands to determine overbought/oversold zones, this indicator aims to assist traders in identifying potential trading opportunities for scalping and day trading strategies using trend-following and mean-reverting methods. This combination of Kalman Filtering with an adapted Supertrend seeks to mitigate false signals, filter out market noise, and aims to provide traders with more reliable buy and sell indications.
Features
Buy and Sell Signals: Pro Scalper generates buy and sell signals based on a Kalman-adapted Supertrend calculation. These signals help traders identify potential entry and exit points in the market.
Dynamic Overbought/Oversold Zones: The indicator dynamically calculates overbought and oversold zones using VWMA bands. These zones provide valuable insights into potential price exhaustion levels, aiding traders in managing risk and identifying potential reversals.
Reversal Signals (R Labels): The indicator includes "R" labels that indicate potential reversal signals. These signals are based on the overbought/oversold zones calculated with VWMA bands. The appearance of an "R" label suggests a possible price reversal, offering traders an additional tool for decision-making.
Calculations
This indicator stands out as a unique tool due to unique Kalman filtering and altered Supertrend calculation, as well as its combination of specific features. This indicator combines the following calculations to provide its features:
Kalman Filter: The indicator employs a Kalman Filter to adapt the Supertrend calculation. This calculation was based on mathematical equations derived from Rudolf E. Kalman. This Kalman Filter helps smooth out price data, reducing noise and removing outliers from data.
Supertrend Calculation: This particular supertrend possesses alterations to price series data and ATR calculations in an aim to improve signal accuracy. Additionally, the calculation uses Kalman-filtering within the calculation to provide a powerful framework to handle uncertainties, noise, and changing conditions.
VWMA Bands: VWMA (Volume-Weighted Moving Average) bands are calculated using the highest high and lowest low values with specified multipliers. These bands are used to determine the dynamic overbought and oversold zones, giving traders insights into potential price exhaustion levels. These are included with the aim to adapt to changing market conditions and price data. This adaptability allows the zones to accurately reflect the current price volatility and trend.
Utility
This tool provides traders with valuable information for scalping and day trading strategies in the 30-minute timeframe. It helps traders by:
Generating buy and sell signals, indicating potential entry and exit points.
Calculating dynamic overbought/oversold zones, enabling traders to identify potential price exhaustion levels.
Displaying "R" labels to highlight potential reversal signals.
Offering optional alerts for reversal signals, buy/sell signals, allowing traders to stay updated even when they're not actively monitoring the charts.
Remember, past performance does not guarantee future performance. Traders should utilize this indicator as part of a comprehensive trading strategy and exercise their own judgment when making trading decisions.

Gators Oscillator - Bitcoin Scalp Trader(T&M/e V3!!)Gator's Oscillator:
**For reference, all numbers, and settings displayed on the input screen are only what I HAVE FOUND to be profitable for my own strategy, Yours will differ. This is not financial advice and I am not a financial advisor. Please do your due diligence and own research before considering taking entries based on this strategy and indicator. I am not advertising investing, trading, or skills untaught, this is simply to help incorporate into your own strategy and improve your trading journey!**
INPUTS:
EV: This is an integer value set to default at 55. This value is equated to the lead value, volatility measurement, and standard deviation between averages
EV 2: This integer is used as the base value and is meant to always be GREATER THEN EV, the default is set at 163. There should be at least a 90+ integer difference between EVs for data accuracy.
EV TYPE & EV TYPE 2: This option only affects the output for the moving average histograms. (and data inserted for strategy)
Volatility Smoothing: This is the smoothness of the custom-made volatility oscillator. I have this default at 1 to show time-worthy-term (3.9%+) moves or significant trends to correspond with the standard deviation declination between EVMA and EVMA2.
Directional Length: This is the amount of data observed per candle in the bull versus bear indicator.
Take Profit: Pre-set takes profit level that is set to 4 but can be adjusted for user experience.
Style:
Base Length: Columns equated using a custom-made statistical equation derived from EV TYPE 2+EV2 to determine a range of differential in historic averages to a micro-scale.
Lead Length: Columns equated using a custom-made statistical equation derived from EV TYPE+EV to determine a range of differential in historic averages to a micro-scale.
Weighted EMA Differential: Equation expressing the differences between exponential and simple averages derived from EV+EV Type 2. Default is displaying none, but optional for use if found helpful.
Volatility: Represents volatility from multiple data sets spanning from Bollinger bands to HPV and translated through smoothing.
Bull Strength: The strength of Bulls in the current trend is derived from a DMI+RSI+MACD equation to represent where the trend lies.
Bear Strength: The strength of Bears in the current trend is derived from a DMI+RSI+MACD equation to represent where the trend lies.
(NEW) Standard Deviation between Moving Averages: Use this logarithmic indicator depicted as circles to help determine whether a move is a fake out or not. Compare the circles with the volatility line, if you see them deviating away, it is either a bull/bear trap or trend continuation is imminent until they correlate back together.
CHEAT CODE'S NOTES:
Do not use this indicator on high leverage. I have personally used this indicator for a week and faced a max of 8% drawdown, albeit painful I was on low leverage and still closed on my take profit level.
85% is not 100% do not overtrade using this indicator's entry conditions if you have made 4 consecutive profitable trades.
Mess around with the input values and let me know if you find an even BETTER hit rate, 30+ entries, and a good drawdown!!
V2 UPGRADES:
*Increased Opacity on Bull Bear Columns
*Removed the Stop Loss Input option
*Decreased EV2 to a default of 143 for accuracy
*Added additional disclaimers in the description
* Removed Bull/Bear offset values for accuracy
V3 UPGRADES:
*ADDED THE EMA DIFFERENTIAL FROM SMA STANDARD DEVIATION INDICATOR. REPRESENTED BY PURPLE BARS THAT PLOT BRIGHT AT EXTREME LEVELS (Translate this to the EMA's and SMA's are very far apart) This is a fantastic way to resolve volatility and momentum in one indicator!!
*Line Width increased for volatility
*plot's for Oversold Alma reduced to 3, also adjusted the plot shape to arrows corresponding to 'overbought/oversold values. Look for a cross-over from green/red plot to transparent for best signals.
*Histograms for bull/bear strength correspond to an increase or decrease in value
*Input screen converted into groups, with bull/bear color inline
*Converted base/lead length value's into areas with breaks. IF YOU SEE WHITE (Short/Lead Length), IT IS A SHORT TERM MOVE AND SCALPING OPPORTUNITY. IF YOU SEE BLUE(Long/Base Length) IT MEANS IT IS A MACRO MOVE, WHICH MAY LAST LONGER
-Cheat Code
BINANCE:BTCUSDT BYBIT:BTCUSDT COINBASE:BTCUSD

Forex Scalping 1min Bollinger Bands, RSI and ADX Trading SystemThis is a Forex Scalping Trading Sytem based on the Bollinger Bands.
Its suited for major pairs, with lowest possible comission (below 1 pip) and with timeframes ranging between 1-15 min.
Indicators:
Bollinger bands
ADX
RSI
Rules for entry:
Long Entry: price to move below the upper Bollinger Bands RSI raise above the 30 line and ADX<32 at the same time.
Short Entry: price to move above the upper Bollinger Bands, RSI raise below the 70 line and ADX<32 at the same time.
Rules for exit
Profit Exit: 3 options: 1, exit position when the price touches the middle band, 2) when the price touches the opposite band, X pips target profit.
Loss Exit: X pips loss

Ribbon for Scalping 5 to 15 min timeframesRibbon Scalp Strategy
TF: 5-15 mins
When to enter long:
Wait for whole ribbon to turn green then enter long
Once in the trade watch the outer 3 lines. If they start to spread away from the others, that’s a sign that a pullback is coming so ether exit or move your stop into profit to protect it
When a pullback happens, watch the yellow band for a bounce. If it bounces off, stay in trade. Cross below, could be reversal sign so get out. When moving stops throughout the trade, use the yellow band as a guide to know where to move stop too, placing it just below the line.
There are two yellow MAs. When you start your session, look left to see which one has been acting as support for the past few hours and go with that one.
As long as it stays above the yellow, you can stay in the trade. Again exit, when outer bands start to widen.
Short - everything above in reverse.
What not to do:
Do not try to pick a reversal early when you start to see one or two bands turn red - this does not mean a reversal is coming! It could just be a pullback before continuing long.

NiLUX Trend Scalper TSSL (Alerts)Trend Following Scalping Bot
Great results on pretty much any pair and timeframe
Features:
Dynamic Trend Detection
Long / Short Scalp Alerts
Take Profit (Trailing Stop) & Stop Loss Alerts
TP/SL Plots for Profitview included
This is Donationware 🍺
Leave me a tip, you decide the amount, then send me a DM to get access.
The link to my tip jar is below in the signature

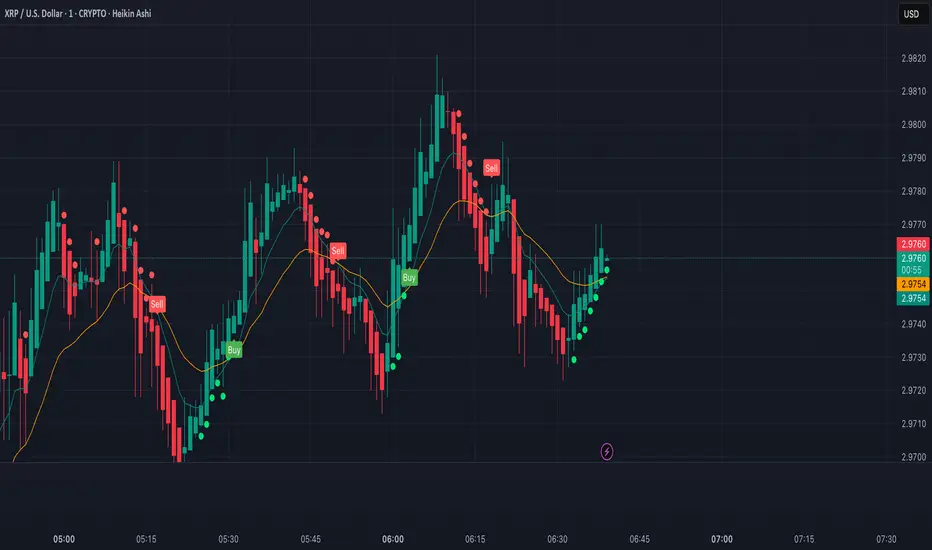
JackBot Scalper v6Jackbot Scalper v6 Update
In Version 6, Jackbot has improved performance on higher time frames with close to 85% success rate on 1-hour times frames and 70% success rate on 15-minute time frames.
Who
I am Jack Donaghy, a crypto trader and wealth strategist at an international asset management firm. I have traded billions in assets for clients and have grown a portfolio of personal assets by nearly 2200% within the last 1.5 years from trading. I originally invested in cryptocurrencies in November of 2016 and have been catching waves ever since. This bot is for those interested in scalping methods.
What
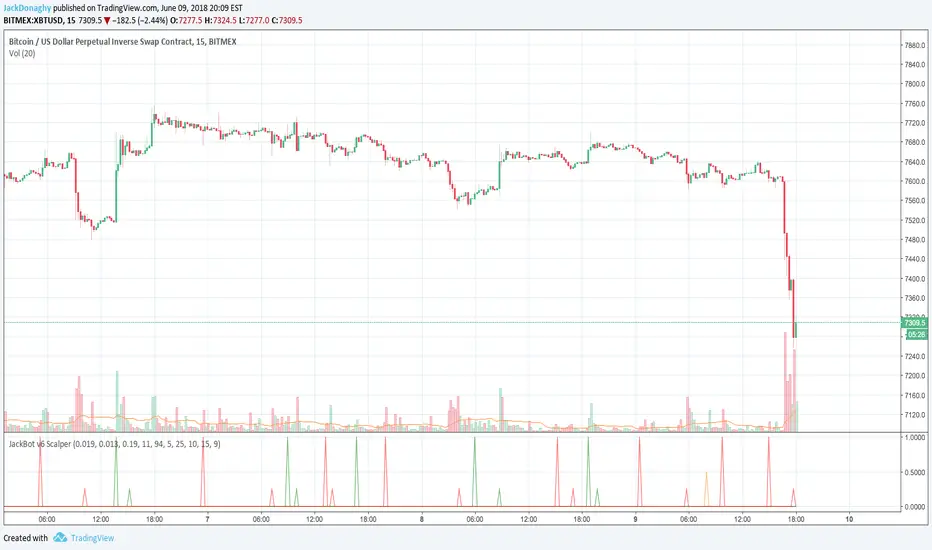
Jackbot Pro Scalper is a scalping study for Bitcoin that operates on small timeframes. It has a 60-70% success rate and operates with the goal of maximizing gains while minimizing losses. This bot works well with leveraged strategies as it pursues both long and short positions. While I primarily use the bot on BitMex, I have seen good success on Bitfinex with various USDT pairs including VEN and ETH.
When
With v6, the best results have come from 13, 15, and 17-minute charts with incredible success found on the 1-hour charts.
How
The bot works by 1. Defining its entry point. 2. Defining a take profit 3. Defining a stop loss. The magic of the bot is that it will not close a trade at the take profit, if volume and price are increasing, it will hold the exit until another indicator determines a reversal of the trend. More than that would ruin the logic so you will just have to see for yourself.
To Trade
Large Spikes = Entries (Green = Long, Red = Short)
Small Spikes = Take Profit (Green = Long Exit, Red = Short Exit)
Medium Spikes = Stop Loss (Purple = Long SL, Yellow = Short SL)
Previous Results
Backtested, Jackbot v6 shows that with 1 Bitcoin (unleveraged) you can make about 12K in a 1.5 month period. My personal experience was trading a test amount of Bitcoin on a particularly good run at 25x leverage using 25% of a test portfolio It went from 0.015 Bitcoin to 0.091 within 10 days. See ibb.co (This test was from V5.4 which V6 has improved upon.)
Disclaimer: This strategy is by no means perfect and not every trade will be a winner. It is a tool in your belt, not a perfect 100% trader. Previously, results show with a 25x leveraged position, the losses are ~20% before it will cut off the trade, however, the gains can be 40%+ (As the bot continues to run in certain conditions, it will often pick up major moves and hold them for longer.) It can have bad runs and a slew of poor entries, especially in tight volatile ranges.
PLEASE NOTE: This strategy can struggle with chop following major moves, if you are manually entering, consider other market conditions before entry if the price is in a tight range.
Cost
Jackbot will be offered for 0.1 Bitcoin and will be limited to the first 100 people who apply.
Renko ScalperWhat it is-
A lightweight Renko Scalper that combines Renko brick direction with an internal EMA trend filter and MACD confirmation to signal high-probability short-term entries. EMAs are used internally (hidden from the chart) so the visual remains uncluttered.
Signals-
Buy arrow: Renko direction turns bullish AND EMA trend up AND MACD histogram positive.
Sell arrow: Renko direction turns bearish AND EMA trend down AND MACD histogram negative.
Consecutive same-direction signals are suppressed (only one arrow per direction until opposite signal).
Visuals-
Buy / Sell arrows (large) above/below bars.
Chart background tints green/red after the respective signal for easy glance recognition.
Inputs:-
Renko Box Size (points)
EMA Fast / EMA Slow
MACD fast/slow/signal lengths
How to use-
Add to chart
Use smaller Renko box sizes for scalping, larger for swing-like entries.
Confirm signal with price action and volume—this indicator is a signal generator, not a full automated system.
Use alerts (built in) to receive Buy / Sell arrow notifications.
Alerts-
Buy Arrow — buySignal
Sell Arrow — sellSignal
Buy Background / Sell Background — background-color state alerts
Recommended settings-
Timeframes: 1m–15m for scalping, 5m for balanced intraday.
Symbols: liquid futures/currency pairs/major crypto.
Disclaimer
This script is educational and not financial advice. Backtest and forward test on a demo account before live use. Past performance is not indicative of future results. Use proper risk management.

Dwaggy Scalping Trio (VWAP + EMA + RSI)First attempt at pine script this is a scalping indicator that combines VWAP, EMA, and RSI to signal entry/exit for scalping lower time frames

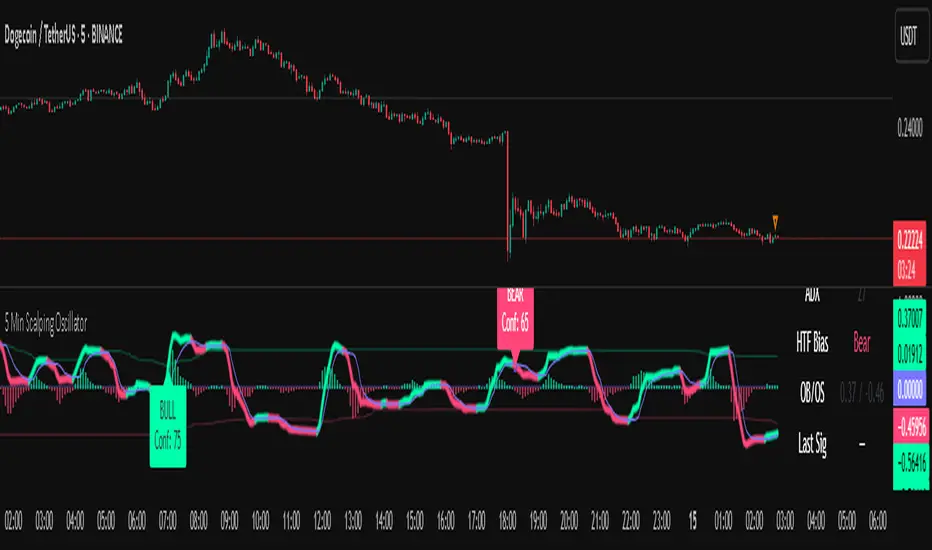
5 Min Scalping Oscillator### Overview
The 5 Min Scalping Oscillator is a custom oscillator designed to provide traders with a unified momentum signal by fusing normalized versions of the Relative Strength Index (RSI), Stochastic RSI, and Commodity Channel Index (CCI). This combination creates a more balanced view of market momentum, overbought/oversold conditions, and potential reversals, while incorporating adaptive smoothing, dynamic thresholds, and market condition filters to reduce noise and false signals. Unlike standalone oscillators, the 5 Min Scalping Oscillator adapts to trending or sideways regimes, volatility levels, and higher timeframe biases, making it particularly suited for short-term charts like 5-minute timeframes where quick, filtered signals are valuable.
### Purpose and Originality of the Fusion
Traditional oscillators like RSI measure momentum but can lag in volatile markets; Stochastic RSI adds sensitivity to RSI extremes but often generates excessive noise; and CCI identifies cyclical deviations but may overreact to minor price swings. The 5 Min Scalping Oscillator addresses these limitations by weighting and blending their normalized outputs (RSI at 45%, Stochastic RSI at 35%, and CCI at 20%) into a single raw oscillator value. This weighted fusion creates a hybrid signal that balances lag reduction with noise filtering, resulting in a more robust indicator for identifying reversal opportunities.
The originality lies in extending this fusion with:
- **Adaptive Smoothing via KAMA (Kaufman's Adaptive Moving Average):** Adjusts responsiveness based on market efficiency, speeding up in trends and slowing in ranges—unlike fixed EMAs, this helps preserve signal integrity without over-smoothing.
- **Dynamic Overbought/Oversold Thresholds:** Calculated using rolling percentiles over a user-defined lookback (default 200+ periods), these levels adapt to recent oscillator behavior rather than relying on static values like 70/30, making the indicator more responsive to asset-specific volatility.
- **Multi-Factor Filters:** Integrates ADX for trend detection, ATR percentiles for volatility confirmation, and optional higher timeframe RSI bias to ensure signals align with broader market context. This layered approach reduces false positives (e.g., ignoring low-volatility crossovers) and adds a confidence score based on filter alignment, which is not typically found in simple mashups.
This design justifies the combination: it's not a mere overlay of indicators but a purposeful integration that enhances usefulness by providing context-aware signals, helping traders avoid common pitfalls like trading against the trend or in low-volatility chop. The result is an original tool that performs better in diverse conditions, especially on 5-minute charts for intraday trading, where rapid adaptations are key.
### How It Works
The 5 Min Scalping Oscillator processes price data through these steps:
1. **Normalization and Fusion:**
- RSI (default length 10) is normalized to a -1 to +1 scale using a tanh transformation for bounded output.
- Stochastic RSI (default length 14) is derived from RSI highs/lows and scaled similarly.
- CCI (default length 14) is tanh-normalized to align with the others.
- These are weighted and summed into a raw value, emphasizing RSI for core momentum while using Stochastic RSI for edge sensitivity and CCI for cycle detection.
2. **Smoothing and Signal Line:**
- The raw value is smoothed (default KAMA with fast/slow periods 2/30 and efficiency length 10) to reduce whipsaws.
- A shorter signal line (half the smoothing length) is added for crossover detections.
3. **Filters and Enhancements:**
- **Trend Regime:** ADX (default length 14, threshold 20) classifies markets as trending (ADX > threshold) or sideways, allowing signals in both but prioritizing alignment.
- **Volatility Check:** ATR (default length 14) percentile (default 85%) ensures signals only trigger in above-average volatility, filtering out flat markets.
- **Higher Timeframe Bias:** Optional RSI (default length 14 on 60-minute timeframe) provides bull/neutral/bear bias (above 55, 45-55, below 45), requiring signal alignment (e.g., bullish signals only if bias is neutral or bull).
- **Dynamic Levels:** Percentiles (default OB 85%, OS 15%) over recent oscillator values set adaptive overbought/oversold lines.
4. **Signal Generation:**
- Bullish (B) signals on upward crossovers of the smoothed line over the signal line, filtered by conditions.
- Bearish (S) signals on downward crossunders.
- Each signal includes a confidence score (0-100) based on factors like trend alignment (25 points), volatility (15 points), and bias (20 points if strong, 10 if neutral).
The output includes a glowing oscillator line, histogram for divergence spotting, dynamic levels, shapes/labels for signals, and a dashboard table summarizing regime, ADX, bias, levels, and last signal.
### How to Use It
This indicator is easy to apply and interpret, even for beginners:
- **Adding to Chart:** Apply the 5 Min Scalping Oscillator to a clean chart (no other indicators unless explained). It's non-overlay, so it appears in a separate pane. For 5-minute timeframes, keep defaults or tweak lengths shorter for faster response (e.g., RSI 8-12).
- **Interpreting Signals:**
- Look for green upward triangles labeled "B" (bullish) at the bottom for potential entry opportunities in uptrends or reversals.
- Red downward triangles labeled "S" (bearish) at the top signal potential exits or shorts.
- Higher confidence scores (e.g., 70+) indicate stronger alignment—use these for priority trades.
- Watch the histogram for divergences (e.g., price higher highs but histogram lower highs suggest weakening momentum).
- Dynamic OB (green line) and OS (red line) help gauge extremes; signals near these are more reliable.
- **Dashboard:** At the bottom-right, it shows real-time info like "Trending" or "Sideways" regime, ADX value, HTF bias (Bull/Neutral/Bear), OB/OS levels, and last signal—use this for quick context.
- **Customization:** Adjust inputs via the settings panel:
- Toggle KAMA for adaptive vs. EMA smoothing.
- Set HTF to "60" for 1-hour bias on 5-min charts.
- Increase ADX threshold to 25 for stricter trend filtering.
- **Best Practices:** Combine with price action (e.g., support/resistance) or volume for confirmation. On 5-min charts, pair with a 1-hour HTF for intraday scalping. Always use stop-losses and risk no more than 1-2% per trade.
### Default Settings Explanation
Defaults are optimized for 5-minute charts on volatile assets like stocks or forex:
- RSI/Stoch/CCI lengths (10/14/14): Shorter for quick momentum capture.
- Signal smoothing (5): Responsive without excessive lag.
- ADX threshold (20): Balances trend detection.
- ATR percentile (0.85): Filters ~15% of low-vol signals.
- HTF RSI (14 on 60-min): Aligns with hourly trends.
- Percentiles (OB 85%, OS 15%): Adaptive to recent data.
If changing, test on historical data to ensure fit—e.g., longer lengths for less noisy assets.
### Disclaimer
The 5 Min Scalping Oscillator is an educational tool to visualize momentum and does not guarantee profits or predict future performance. All signals are based on historical calculations and should not be used as standalone trading advice. Past results are not indicative of future outcomes. Traders must conduct their own analysis, use proper risk management, and consider market conditions. No claims are made about accuracy, reliability, or performance.