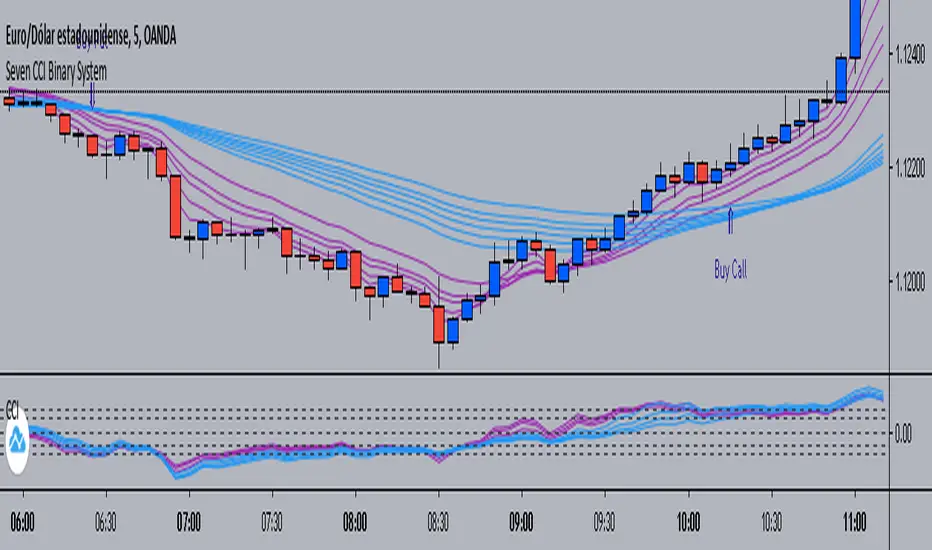
Seven CCI Binary System by Hashtag_binarySeven CCI binary system is trend-momentum strategy based on CCI and exponential moving averages. This trading system is also good for scalping and intraday trading.
Rules for Binary Options:
- Time Frame 5 min or 15 min.
- Expiry time 4-5 candles.
- Trades only in trend.
Buy Call:
- EMA's lines color magenta above EMA's lines color blue;
- CCI lines color magenta are above CCI lines color blue and zero level.
- When thes conditions are agree buy call at opening of the next bar.
Buy Put:
- EMA's lines color magenta below EMA's lines color blue;
- CCI lines color magenta are below CCI lines color blue and zero level.
- When thes conditions are agree buy put at opening of the next bar.
Scalping:
-Time Frame 5 min, 15min.
- Currency Pairs: EUR/USD, GBP/USD, AUD/USD, USD/CHF, USD/JPY.
- The rules for buy and sell are the same.
- When the price is within the bundle of the moving averages do not trade.
Exit position
- Make Profit on the pivot points levels or with fast profit target.
- Initial stop loss on the previous swing price.
Cari dalam skrip untuk "scalp"
TB!G-Scalp Strategy [Alert]Scalping Crypto Assets Made Easy
TB!G-Scalp is a TradingView based alert and accompanying strategy PineV3 Script.
Backtest vs Realtime
When designing the algorithms for this strategy our focus was primarily on ease of use.This results in a beautiful yet easy to use scalping strategy. As input it takes a chart period and only one extra parameter for fine tuning. The backtest results are an accurate representation of it’s real-time behaviour.
What makes it tick?
Over the last 2 years we collected a lot of market data regarding Bull and Bear behaviours. This previous market behaviour echo’s into the current market trend.
By recognising these echo’s we are able to anticipate an upcoming micro reversal which eventually end up being a scalping strategy.
Interested
Access is provided to a limited amount of people and for the duration that is determined by it’s Alpha Decay Rate.
This ADR is expected to become problematic after 2.3 year of usage on a lot of 150 users.

5MA+スーパートレンド + Disparity Scalping (SIMPLE FILTER)5MA + ATR Trend Filter + Disparity Scalping
This indicator combines a five-EMA trend framework, an ATR-based trailing trend line, a volatility breakout detector, and an ultra-fast scalping module using RSI and custom momentum prediction.
It is designed for both trend continuation and rapid reversal trading.
🔹 Main Components
1️⃣ Five-EMA Trend Framework
Uses 9 / 20 / 50 / 100 / 200 EMAs
Identifies short-term and long-term market direction
Provides dynamic support and resistance
Helpful for determining breakout vs. pullback conditions
2️⃣ ATR-Based Trailing Trend Line
Uses ATR multiplier to build a trailing stop line
Color change indicates directional shift
Works as a trend filter or trailing stop reference
Helps avoid counter-trend trades during strong trends
3️⃣ High-Volatility Breakout Detector (Optimized for Fast Markets)
Uses ATR expansion, Bollinger band breakout, and volatility comparison (HV vs RV)
Detects sudden market acceleration
Generates breakout BUY/SELL signals when volatility pressure aligns with direction
Useful for explosive markets such as gold or crypto, but compatible with all assets
4️⃣ Ultra-Fast Disparity Scalper
Measures price distance from EMA5 and EMA10
Uses RSI for exhaustion filtering
Predicts momentum turns with a custom RVI-based algorithm
Generates early reversal BUY/SELL signals before full market reaction
Designed for scalping in high-speed environments
5️⃣ Simple Overheat Filter
Blocks trades in extremely overbought/oversold zones
Gray signals indicate low-quality trade setups to avoid
Helps remove “chasing” entries during excessive deviation
🎯 Best Use Cases
Scalping fast reversals
Entering trends after confirmed volatility breakouts
Filtering entries during extreme overbought/oversold phases
Combining EMA structure with breakout momentum
⚠️ Important Notice
This tool is designed to support decision making, not guarantee trade results.
For best performance, combine with:
Price action (market structure)
Volume/volatility context
Support and resistance analysis
🏷️ Short Description (for compact summary)
Five-EMA trend structure with ATR trailing filter, volatility breakout detection, and ultra-fast scalping using RSI + momentum prediction. Suitable for both rapid reversals and trend continuation setups.

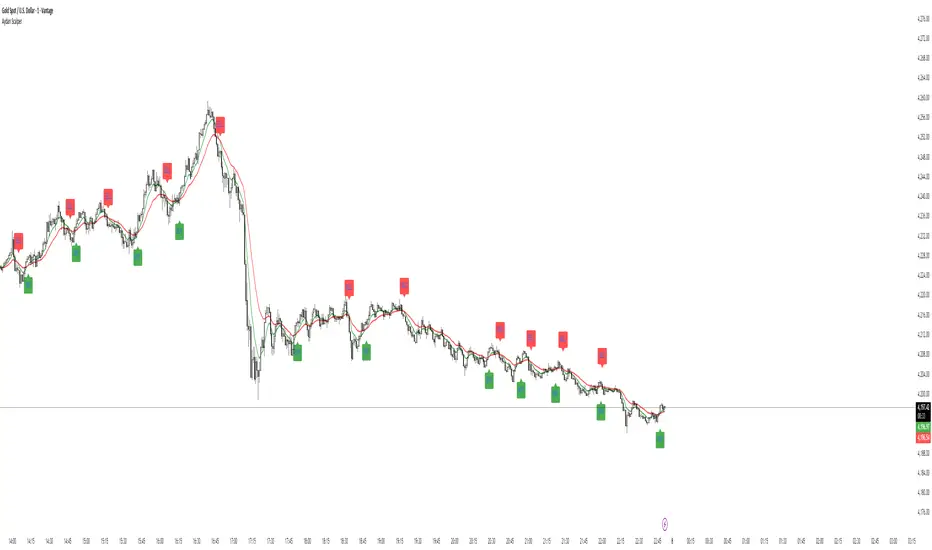
Aydan Scalper v2This indicator, called the Aydan Scalper, combines an 8-period EMA (plotted in green) and a 20-period EMA (plotted in red) to identify buy and sell signals based on their crossovers. When the green 8 EMA crosses above the red 20 EMA from below, it signals a buy opportunity. Conversely, when the green 8 EMA crosses below the red 20 EMA from above, it signals a sell opportunity. Additionally, an ATR (Average True Range) indicator is included to gauge market volatility. This combination helps scalpers make informed trading decisions on a one-minute chart.”

Aydan Scalper 2This indicator, called the Aydan Scalper, combines an 8-period EMA (plotted in green) and a 20-period EMA (plotted in red) to identify buy and sell signals based on their crossovers. When the green 8 EMA crosses above the red 20 EMA from below, it signals a buy opportunity. Conversely, when the green 8 EMA crosses below the red 20 EMA from above, it signals a sell opportunity. Additionally, an ATR (Average True Range) indicator is included to gauge market volatility. This combination helps scalpers make informed trading decisions on a one-minute chart.”
A13: Micro MAP Scalping StrategyA13: Micro MAP Scalping Strategy — Institutional Breakout Scalper (Pine Script v6 – Protected Source)
A completely original, professional scalping strategy developed from scratch over several months of research and live-market testing. The system is built around institutional breakout zones with a unique multi-stage validation process, strict confirmation requirements, and sophisticated risk management — all designed specifically for 1–15 minute timeframes.
Why this implementation is original and the source code is protected
The entire logic — from breakout detection to entry confirmation, multi-filter stop-loss engines, and dynamic position sizing — was built independently without relying on any existing public libraries, built-ins, or open-source code beyond standard Pine functions. The proprietary validation rules, ATR-scaled gap filtering, and layered confirmation system required extensive original development to achieve consistent performance in real-market conditions. Protecting the source code is necessary to preserve the unique edge that distinguishes this system from standard or publicly available implementations.
Core concepts and methodology (fully transparent — no code revealed)
1. Institutional Breakout Zone Detection
• Real-time identification of high-probability zones using a custom ATR-based minimum gap filter
• Zones are only considered valid when accompanied by clear price displacement and volume confirmation
• No reliance on standard Fair Value Gap or order block libraries — completely custom validation
2. Strict Dual Confirmation Entry Logic
• Entry requires one of two precise conditions:
— Confirmed pullback retest of the validated breakout zone, or
— Clean inside-bar formation fully contained within the zone
• Both conditions must align with the directional bias of the breakout
3. Five Independent Stop-Loss Engines
• ATR-based (default and recommended)
• Swing Low/High levels
• Pivot Point structure
• Trailing Stop with ATR offset
• Fixed percentage
• Every engine includes minimum and maximum stop-loss filters to prevent unrealistic risk during extreme volatility
4. Professional Risk & Position Sizing Engine
• Fixed percentage risk per trade (default 1%)
• Optional compounding mode for growing accounts
• Real-time calculation based on exact stop distance and current equity
• Full integration with leverage settings
5. Multi-Layer Filtering System
• Multi-timeframe EMA filter (default 60-period, fully customizable timeframe)
• Complete trading session control with UTC offset support
• Date range filtering for strategy deployment control
• Consecutive loss protection (optional multi-stop filter)
• Minimum/maximum stop-loss filters to eliminate low-probability setups
6. Real-Time Performance Dashboard
• Live display of win rate, net profit, maximum drawdown, total trades
• Consecutive win/loss streak tracking
• Current position size and average entry price
• All statistics visible directly on chart
Backtesting settings used in the published chart
• Symbol: BTC/USD
• Timeframe: 15-minute
• Initial capital: $10,000
• Risk per trade: 1%
• Commission: 0.04% (realistic for major brokers)
• Slippage: enabled
• Sample size: 200+ trades
These are the exact default Properties settings of the strategy.
The strategy is completely free to add and use on your charts.
#Scalping #Breakout #Intraday #Institutional #RiskManagement #ProfessionalStrategy

Nifty Scalping System by Rakesh Sharma🎯 What This Indicator Does:
Core Features:
✅ Fast Entry/Exit Signals - Quick BUY/SELL labels on chart
✅ 3 Signal Modes:
Aggressive - More signals, faster entries
Moderate - Balanced (Recommended)
Conservative - Fewer but high-quality signals
✅ Automatic Target & Stop Loss - Plotted on chart as soon as you enter
✅ Time Filter - Only trades during your specified hours (9:20 AM - 3:15 PM default)
✅ Trade Statistics - Win rate, W/L ratio tracked automatically
✅ Live Dashboard - Shows trend, RSI, VWAP position, current trade status
Indicators Used:
📊 3 EMAs (9, 21, 50) - Trend direction
📈 Supertrend - Primary trend filter
💪 RSI - Momentum & overbought/oversold
💜 VWAP - Intraday support/resistance
📉 ATR - Dynamic stop loss & targets
📊 Volume - Confirmation of moves
⚙️ Best Settings for Nifty/Bank Nifty:
For 5-Minute Charts (Most Popular):
Signal Mode: Moderate
Target R:R: 1.5 (1:1.5 risk-reward)
Time Filter: 9:20 AM to 3:15 PM
For 3-Minute Charts (More Scalps):
Signal Mode: Aggressive
Target R:R: 1.0 (quick exits)
Time Filter: 9:20 AM to 3:15 PM
For 15-Minute Charts (Swing Scalping):
Signal Mode: Conservative
Target R:R: 2.0 (bigger targets)
Time Filter: 9:30 AM to 3:00 PM
💡 How to Use:
Step 1: Setup
Add indicator to 5-min Nifty or Bank Nifty chart
Choose your Signal Mode (start with Moderate)
Set Risk:Reward (1.5 is balanced)
Enable Time Filter (avoid first 10 mins)
Step 2: Trading
BUY Signal appears = Go LONG
Green label shows entry price
Green line = Target
Red line = Stop Loss
SELL Signal appears = Go SHORT
Red label shows entry price
Green line = Target
Red line = Stop Loss
Exit automatically when Target or SL is hit
Step 3: Risk Management
Automatic SL based on ATR (volatility)
Adjustable R:R ratio
Never trade outside session hours
🎯 Trading Rules (Important!):
✅ Take the Trade When:
Signal appears during trading session
Dashboard shows strong trend
Volume spike present
Price above/below VWAP (for buy/sell)
❌ Avoid Trading When:
First 10 minutes (9:15-9:25 AM)
Last 15 minutes (3:15-3:30 PM)
Dashboard shows "SIDEWAYS"
Major news events
📊 Dashboard Explained:
FieldWhat It MeansModeYour current signal sensitivityTrendOverall market directionRSIOverbought/Oversold/NeutralPrice vs VWAPAbove = Bullish, Below = BearishCurrent TradeShows if you're in a positionSessionTrading time active or notWin RateYour success %
🚀 Pro Tips for Nifty/Bank Nifty:
Best Timeframe: 5-minute chart
Best Time: 9:30 AM - 2:30 PM (avoid opening/closing rushes)
Risk per Trade: 1-2% of capital max
Follow the Trend: Take only BUY in uptrend, SELL in downtrend
Use Alerts: Set alerts so you don't miss signals
Start Small: Paper trade first with 1 lot
⚡ Quick Start Guide:
For Bank Nifty (5-min chart):
1. Signal Mode: Moderate
2. Target R:R: 1.5
3. Trading Hours: 9:20 AM - 3:15 PM
4. Watch for 3-5 signals per day
5. Average 30-50 points per trade
For Nifty 50 (5-min chart):
1. Signal Mode: Moderate
2. Target R:R: 1.5
3. Trading Hours: 9:20 AM - 3:15 PM
4. Watch for 3-5 signals per day
5. Average 15-30 points per trade
📈 Expected Performance:
Conservative Mode: 2-4 trades/day, 65-70% win rate
Moderate Mode: 4-8 trades/day, 55-65% win rate
Aggressive Mode: 8-15 trades/day, 45-55% win rate
This is a complete scalping system, Rakesh! All you need to do is:
Add to chart
Wait for signals
Follow the targets/stop losses
Track your stats
Ready to test it? Let me know if you want any adjustments! 🎯💰Claude can make mistakes. Please double-check responses.

SLAW TRADING SCALP-XSLAW TRADING SCALP-X – Multi-Filter Scalping Suite
SLAW TRADING SCALP-X is an intraday scalping tool designed for fast markets (crypto, FX, indices) on lower timeframes such as 1m–5m charts. It combines multiple classic concepts into a single, rule-based framework and only prints signals when several conditions agree.
The script uses:
Heikin Ashi structure to smooth noise and detect bullish/bearish candle bias.
Dual EMAs (fast & slow) to define the main trend and to filter trades in the direction of that trend.
Stochastic and MACD as momentum filters. Both can vote for long/short, contributing to a combined momentum score.
Swing / pivot detection (local highs/lows and fractals) to locate potential exhaustion zones and entries near short-term reversals.
ATR-based volatility filter that ignores “dead” low-volatility periods and overly explosive candles, adapting automatically across different markets.
Candle-quality filter that checks body/wick ratios to avoid extreme wick manipulation and very small bodies.
A momentum score is built from Stochastic, MACD and swing conditions. Long or short signals are only allowed when the score reaches a configurable minimum, the trend filter agrees, price is close to the fast EMA, volatility is inside a healthy range, and the candle passes the body/wick quality checks.
The script also contains signal-management logic:
Maximum number of consecutive signals in the same direction (to avoid endless buying or selling in trends).
Minimum bar distance between two signals (to reduce over-trading and clustering).
When all filters line up, the indicator plots “L” and “S” labels on the chart and exposes corresponding alertconditions (“LONG” and “SHORT”) so traders can connect it to webhooks or bots.
This script is intended as a tool for discretionary traders, not an automatic profit guarantee. It works best when combined with your own risk management, session filters and higher-timeframe analysis. Nothing in this indicator is financial advice; always test on a demo account and adapt the parameters to your market and timeframe.

Custom Reversal Scalper – Adib NooraniCustom Reversal Scalper – Adib Noorani (Modified Edition)
An improved, non-repainting visual reversal indicator inspired by Adib Noorani's "Reversal Scalper" and updated to address key shortcomings with compliance to Adib's rules and recommendations.
Reversal Logic & Entry Filtering: Combines Adib's reversal oscillator and trend ribbon logic with added 30-minute exclusion, optimizing signals for volatile Indian indices like $NSE:NIFTY.
Shortcomings Addressed:
Eliminates repainting—entries and exits only display after the required market action.
Implements strict intraday time filtering per Adib's guidance.
Uses automatic, dynamic trailing stop (red line) post-take-profit for advanced risk management.
Maintains risk:reward visualization and minimizes chart clutter.
Directly Based on: Adib Noorani's YouTube training: www.youtube.com
How to Use:
Trade only outside first 30 minutes, per Adib's rules.
Go Long on black candle after confirmation and price crosses blue line.
Go Short on white candle after confirmation and price crosses blue line.
Stop into trailing is handled automatically after take profit.
Follow all further execution and visual risk management recommendations as per Adib's video.
This script incorporates the key corrections and execution principles demonstrated by Adib Noorani for safe scalping on Indian indices and F&O instruments.
Credits: Original logic and teaching by Adib Noorani . Modifications, anti-repainting logic, and full RR/visual improvements by script author.
For educational purposes. Please backtest and follow personal risk management.

1m EMA Scalper + Lot Size HUD [DIMS]1m EMA Scalper w/ Pre-Alert + Lot Size HUD
Purpose:
A short-term (1-minute) scalping strategy for assets like XAUUSD, GBPJPY, and GER30/GER40, showing precise buy/sell signals, stop-loss, take-profit, breakeven levels, and a dynamic lot size HUD for risk management.
Key Features:
Signals:
Buy/Sell signals generated using EMA crossover (fast vs slow) + RSI filter + optional candle/volume filter.
Signals only appear during selected trading sessions (London & NY).
Pre-alert signals appear 30 seconds before the candle closes, so you can prepare to enter.
Stop Loss / Take Profit / Breakeven:
SL calculated using ATR × multiplier and adjustable for spread.
TP follows a configurable risk:reward ratio.
Breakeven can be toggled on/off and uses a custom multiplier.
Lines have customizable length, width, and style.
Lot Size HUD:
Automatically calculates lot size based on account balance, risk % or fixed amount, and leverage.
Shows stop distance in pips/points.
HUD retains the value for 5 minutes after the signal candle.
Flashes 30 seconds before the candle closes to prepare for the trade.
Auto-adjusts for XAUUSD, GBPJPY, GER30/GER40.
Alerts:
Alerts for pre-alert signals and confirmed signals.
Can toggle alerts on/off for both types.
Customization & Display:
Toggle buy/sell signals, SL/TP/BE lines, and pre-alert arrows.
Works entirely on-chart, displaying only the essential arrows, lines, and HUD.
Summary:
It’s a ready-to-trade scalping tool that combines fast technical signal detection with risk management, pre-alert timing, and visual trade guidance — letting you focus on execution without manually calculating lot size or monitoring every candle.

XAUUSD Family Scalping (5min)🟡 XAUUSD Family Scalping 5-Min — Momentum Precision Indicator
Overview
This indicator is built for XAUUSD (Gold) on the 5-minute timeframe and is designed for short-term momentum scalping.
It helps traders identify early reversal zones, confirm momentum direction, and detect exhaustion points during high-volatility market moves.
Core Concept
The indicator measures momentum strength and price acceleration using a smoothed oscillator.
It features two adjustable thresholds:
Overbought level: 58
Oversold level: -58
When the momentum line crosses above or below these zones, it signals potential trend continuation or reversal opportunities.
Features
Detects short-term momentum shifts on XAUUSD 5M.
Works with EMA-based trend confirmation (optional).
Adaptive smoothing reduces noise and false reversals.
Highlights overbought/oversold areas visually.
Can be combined with price action or other oscillators for confluence.
Usage
Instrument: XAUUSD (Gold)
Best timeframe: 5-minute (scalping setup)
Use case: Detecting momentum exhaustion and reversal entries.
Sessions: London & New York recommended.
Disclaimer
This indicator is for market analysis and educational purposes.
No indicator guarantees profit — use proper risk management and test before live trading.

GOLDSNIPERThe Gold Sniper Indicator is a precision trading tool designed specifically for scalping and intraday trading Gold (XAUUSD) on TradingView.
It automatically plots institutional key levels, detects breakout & retest opportunities, and provides trade management levels (Stop Loss & Take Profit) for structured, disciplined trading.
Aug 6
Release Notes
The Gold Sniper Indicator is a precision trading tool designed specifically for scalping and intraday trading Gold (XAUUSD) on TradingView.
It automatically plots institutional key levels, detects breakout & retest opportunities, and provides trade management levels (Stop Loss & Take Profit) for structured, disciplined trading
Aug 13
Release Notes
The Gold Sniper Indicator is a precision trading tool designed specifically for scalping and intraday trading Gold (XAUUSD) on TradingView.
It automatically plots institutional key levels, detects breakout & retest opportunities, and provides trade management levels (Stop Loss & Take Profit) for structured, disciplined trading.
3 days ago
Release Notes
The Gold Sniper Indicator is a precision TradingView tool for scalping and intraday trading Gold (XAUUSD).
It is built around a break-and-retest strategy with clear trade management: 10 pip Stop Loss, 20 pip TP1, and 35 pip TP2.
The indicator automatically:
• Plots institutional key levels and supply & demand zones
• Detects breakout and retest opportunities in real time
• Provides stop loss and take profit levels for structured, disciplined trading
Whether you’re a scalper or day trader, Gold Sniper helps you catch high-probability setups on XAUUSD with precise risk-to-reward ratios (1:1 and 1:3).

RSI Momentum ScalperOverview
The "RSI Momentum Scalper" is a Pine Script v5 strategy crafted for trading highly volatile markets, with a special focus on newly listed cryptocurrencies. This strategy harnesses the Relative Strength Index (RSI) alongside volume analysis and momentum thresholds to pinpoint short-term trading opportunities. It supports both long and short trades, managed with customizable take profit, stop loss, and trailing stop levels, which are visually plotted on the chart for easy tracking.
Why I Created This Strategy
I developed the "RSI Momentum Scalper" because I was seeking a reliable trading strategy tailored to newly listed, highly volatile cryptocurrencies. These assets often experience rapid price fluctuations, rendering traditional strategies less effective. I aimed to create a tool that could exploit momentum and volume spikes while managing risk through adaptable exit parameters. This strategy is designed to address that need, offering a flexible approach for traders in dynamic crypto markets.
How It Works
The strategy utilizes RSI to identify momentum shifts, combined with volume confirmation, to trigger long or short entries. Trades are controlled with take profit, stop loss, and trailing stop levels, which adjust dynamically as the price moves in your favor. The trailing stop helps lock in profits, while the plotted exit levels provide clear visual cues for trade management.
Customizable Settings
The script is highly customizable, allowing you to adjust it to various market conditions and trading styles. Here’s a brief overview of the key settings:
Trade Mode: Select "Both," "Long Only," or "Short Only" to determine the trade direction.
(Default: Both)
RSI Length: Sets the lookback period for the RSI calculation (2 to 30).
(Default: 8)
A shorter length increases RSI sensitivity, suitable for volatile assets.
RSI Overbought: Defines the upper RSI threshold (60 to 99) for short entries.
(Default: 90)
Higher values signal stronger overbought conditions.
RSI Oversold: Defines the lower RSI threshold (1 to 40) for long entries.
(Default: 10)
Lower values indicate stronger oversold conditions.
RSI Momentum Threshold: Sets the minimum RSI momentum change (1 to 15) to trigger entries.
(Default: 14)
Adjusts the sensitivity to price momentum.
Volume Multiplier: Multiplies the volume moving average to filter high-volume bars (1.0 to 3.0).
(Default: 1)
Higher values require stronger volume confirmation.
Volume MA Length: Sets the lookback period for the volume moving average (5 to 50).
(Default: 13)
Influences the volume trend sensitivity.
Take Profit %: Sets the profit target as a percentage of the entry price (0.1 to 10.0).
(Default: 4.15)
Determines when to close a winning trade.
Stop Loss %: Sets the loss limit as a percentage of the entry price (0.1 to 6.0).
(Default: 1.85)
Protects against significant losses.
Trailing Stop %: Sets the trailing stop distance as a percentage (0.1 to 4.0).
(Default: 2.55)
Locks in profits as the price moves favorably.
Visual Features
Exit Levels: Take profit (green), fixed stop loss (red), and trailing stop (orange) levels are plotted when in a position.
Performance Table: Displays win rate, total trades, and net profit in the top-right corner.
How to Use
Add the strategy to your chart in TradingView.
Adjust the input settings based on the cryptocurrency and timeframe you’re trading.
Monitor the plotted exit levels for trade management.
Use the performance table to assess the strategy’s performance over time.
Notes
Test the strategy on a demo account or with historical data before live trading.
The strategy is optimized for short-term scalping; adjust settings for longer timeframes if needed.

Trend ScalperThe Trend Scalper is a simple EMA-based trend-following and scalping indicator designed to help traders identify potential long and short trading opportunities on any timeframe. It uses a three-EMA strategy to filter trades in the direction of the prevailing trend while refining entry signals based on price reactions to the EMAs.
Here’s how it works:
It calculates three Exponential Moving Averages (EMA) with customizable lengths (default: 9, 21, and 89).
A long signal is generated when the EMAs align in bullish order (EMA1 > EMA2 > EMA3) and the price low dips into the zone between EMA1 and EMA2. This indicates a pullback into short-term support while the broader trend remains bullish.
A short signal is generated when the EMAs align in bearish order (EMA1 < EMA2 < EMA3) and the price high rises into the zone between EMA1 and EMA2. This indicates a pullback into resistance within a bearish trend.
The EMAs are plotted on the chart for visual guidance, while buy and sell signals are displayed as up and down triangles directly on price bars.
Best use practices:
The indicator works best as a trend continuation scalping tool, aiming to join established market direction after minor pullbacks.
It is most effective on liquid assets and in trending market conditions. Avoid relying on signals during sideways or choppy markets.
For confirmation, combine with volume, momentum oscillators, or higher timeframe trend analysis.
Risk management is critical: consider setting stop losses beyond EMA zones or recent swing highs/lows, and use take profits that match your risk-reward plan.
This indicator provides clean, rule-based signals that help traders time entries within the broader context of the trend. It is not a standalone strategy but a tool to assist in disciplined trade execution.

BOCS AdaptiveBOCS Adaptive Strategy - Automated Volatility Breakout System
WHAT THIS STRATEGY DOES:
This is an automated trading strategy that detects consolidation patterns through volatility analysis and executes trades when price breaks out of these channels. Take-profit and stop-loss levels are calculated dynamically using Average True Range (ATR) to adapt to current market volatility. The strategy closes positions partially at the first profit target and exits the remainder at the second target or stop loss.
TECHNICAL METHODOLOGY:
Price Normalization Process:
The strategy begins by normalizing price to create a consistent measurement scale. It calculates the highest high and lowest low over a user-defined lookback period (default 100 bars). The current close price is then normalized using the formula: (close - lowest_low) / (highest_high - lowest_low). This produces values between 0 and 1, allowing volatility analysis to work consistently across different instruments and price levels.
Volatility Detection:
A 14-period standard deviation is applied to the normalized price series. Standard deviation measures how much prices deviate from their average - higher values indicate volatility expansion, lower values indicate consolidation. The strategy uses ta.highestbars() and ta.lowestbars() functions to track when volatility reaches peaks and troughs over the detection length period (default 14 bars).
Channel Formation Logic:
When volatility crosses from a high level to a low level, this signals the beginning of a consolidation phase. The strategy records this moment using ta.crossover(upper, lower) and begins tracking the highest and lowest prices during the consolidation. These become the channel boundaries. The duration between the crossover and current bar must exceed 10 bars minimum to avoid false channels from brief volatility spikes. Channels are drawn using box objects with the recorded high/low boundaries.
Breakout Signal Generation:
Two detection modes are available:
Strong Closes Mode (default): Breakout occurs when the candle body midpoint math.avg(close, open) exceeds the channel boundary. This filters out wick-only breaks.
Any Touch Mode: Breakout occurs when the close price exceeds the boundary.
When price closes above the upper channel boundary, a bullish breakout signal generates. When price closes below the lower boundary, a bearish breakout signal generates. The channel is then removed from the chart.
ATR-Based Risk Management:
The strategy uses request.security() to fetch ATR values from a specified timeframe, which can differ from the chart timeframe. For example, on a 5-minute chart, you can use 1-minute ATR for more responsive calculations. The ATR is calculated using ta.atr(length) with a user-defined period (default 14).
Exit levels are calculated at the moment of breakout:
Long Entry Price = Upper channel boundary
Long TP1 = Entry + (ATR × TP1 Multiplier)
Long TP2 = Entry + (ATR × TP2 Multiplier)
Long SL = Entry - (ATR × SL Multiplier)
For short trades, the calculation inverts:
Short Entry Price = Lower channel boundary
Short TP1 = Entry - (ATR × TP1 Multiplier)
Short TP2 = Entry - (ATR × TP2 Multiplier)
Short SL = Entry + (ATR × SL Multiplier)
Trade Execution Logic:
When a breakout occurs, the strategy checks if trading hours filter is satisfied (if enabled) and if position size equals zero (no existing position). If volume confirmation is enabled, it also verifies that current volume exceeds 1.2 times the 20-period simple moving average.
If all conditions are met:
strategy.entry() opens a position using the user-defined number of contracts
strategy.exit() immediately places a stop loss order
The code monitors price against TP1 and TP2 levels on each bar
When price reaches TP1, strategy.close() closes the specified number of contracts (e.g., if you enter with 3 contracts and set TP1 close to 1, it closes 1 contract). When price reaches TP2, it closes all remaining contracts. If stop loss is hit first, the entire position exits via the strategy.exit() order.
Volume Analysis System:
The strategy uses ta.requestUpAndDownVolume(timeframe) to fetch up volume, down volume, and volume delta from a specified timeframe. Three display modes are available:
Volume Mode: Shows total volume as bars scaled relative to the 20-period average
Comparison Mode: Shows up volume and down volume as separate bars above/below the channel midline
Delta Mode: Shows net volume delta (up volume - down volume) as bars, positive values above midline, negative below
The volume confirmation logic compares breakout bar volume to the 20-period SMA. If volume ÷ average > 1.2, the breakout is classified as "confirmed." When volume confirmation is enabled in settings, only confirmed breakouts generate trades.
INPUT PARAMETERS:
Strategy Settings:
Number of Contracts: Fixed quantity to trade per signal (1-1000)
Require Volume Confirmation: Toggle to only trade signals with volume >120% of average
TP1 Close Contracts: Exact number of contracts to close at first target (1-1000)
Use Trading Hours Filter: Toggle to restrict trading to specified session
Trading Hours: Session input in HHMM-HHMM format (e.g., "0930-1600")
Main Settings:
Normalization Length: Lookback bars for high/low calculation (1-500, default 100)
Box Detection Length: Period for volatility peak/trough detection (1-100, default 14)
Strong Closes Only: Toggle between body midpoint vs close price for breakout detection
Nested Channels: Allow multiple overlapping channels vs single channel at a time
ATR TP/SL Settings:
ATR Timeframe: Source timeframe for ATR calculation (1, 5, 15, 60, etc.)
ATR Length: Smoothing period for ATR (1-100, default 14)
Take Profit 1 Multiplier: Distance from entry as multiple of ATR (0.1-10.0, default 2.0)
Take Profit 2 Multiplier: Distance from entry as multiple of ATR (0.1-10.0, default 3.0)
Stop Loss Multiplier: Distance from entry as multiple of ATR (0.1-10.0, default 1.0)
Enable Take Profit 2: Toggle second profit target on/off
VISUAL INDICATORS:
Channel boxes with semi-transparent fill showing consolidation zones
Green/red colored zones at channel boundaries indicating breakout areas
Volume bars displayed within channels using selected mode
TP/SL lines with labels showing both price level and distance in points
Entry signals marked with up/down triangles at breakout price
Strategy status table showing position, contracts, P&L, ATR values, and volume confirmation status
HOW TO USE:
For 2-Minute Scalping:
Set ATR Timeframe to "1" (1-minute), ATR Length to 12, TP1 Multiplier to 2.0, TP2 Multiplier to 3.0, SL Multiplier to 1.5. Enable volume confirmation and strong closes only. Use trading hours filter to avoid low-volume periods.
For 5-15 Minute Day Trading:
Set ATR Timeframe to match chart or use 5-minute, ATR Length to 14, TP1 Multiplier to 2.0, TP2 Multiplier to 3.5, SL Multiplier to 1.2. Volume confirmation recommended but optional.
For Hourly+ Swing Trading:
Set ATR Timeframe to 15-30 minute, ATR Length to 14-21, TP1 Multiplier to 2.5, TP2 Multiplier to 4.0, SL Multiplier to 1.5. Volume confirmation optional, nested channels can be enabled for multiple setups.
BACKTEST CONSIDERATIONS:
Strategy performs best during trending or volatility expansion phases
Consolidation-heavy or choppy markets produce more false signals
Shorter timeframes require wider stop loss multipliers due to noise
Commission and slippage significantly impact performance on sub-5-minute charts
Volume confirmation generally improves win rate but reduces trade frequency
ATR multipliers should be optimized for specific instrument characteristics
COMPATIBLE MARKETS:
Works on any instrument with price and volume data including forex pairs, stock indices, individual stocks, cryptocurrency, commodities, and futures contracts. Requires TradingView data feed that includes volume for volume confirmation features to function.
KNOWN LIMITATIONS:
Stop losses execute via strategy.exit() and may not fill at exact levels during gaps or extreme volatility
request.security() on lower timeframes requires higher-tier TradingView subscription
False breakouts inherent to breakout strategies cannot be completely eliminated
Performance varies significantly based on market regime (trending vs ranging)
Partial closing logic requires sufficient position size relative to TP1 close contracts setting
RISK DISCLOSURE:
Trading involves substantial risk of loss. Past performance of this or any strategy does not guarantee future results. This strategy is provided for educational purposes and automated backtesting. Thoroughly test on historical data and paper trade before risking real capital. Market conditions change and strategies that worked historically may fail in the future. Use appropriate position sizing and never risk more than you can afford to lose. Consider consulting a licensed financial advisor before making trading decisions.
ACKNOWLEDGMENT & CREDITS:
This strategy is built upon the channel detection methodology created by AlgoAlpha in the "Smart Money Breakout Channels" indicator. Full credit and appreciation to AlgoAlpha for pioneering the normalized volatility approach to identifying consolidation patterns and sharing this innovative technique with the TradingView community. The enhancements added to the original concept include automated trade execution, multi-timeframe ATR-based risk management, partial position closing by contract count, volume confirmation filtering, and real-time position monitoring.

Reversal Scalper – Adib NooraniThe Reversal Scalper is an indicator designed to identify potential reversal zones based on supply and demand dynamics. It uses smoothed stochastic logic along with ATR bands, to reduce noise and highlight areas where momentum may be weakening, signaling possible market turning points.
🔹 Smooth, noise-reduced stochastic oscillator
🔹 Custom zones to highlight potential supply and demand imbalances
🔹 Non-repainting, compatible across all timeframes and assets
🔹 Visual-only tool — intended to support discretionary trading decisions
This oscillator assists scalpers and intraday traders in tracking subtle shifts in momentum, helping them identify when a market may be preparing to reverse — always keeping in mind that trading is based on probabilities, not certainties.
📘 How to Use the Indicator Efficiently
For Reversal Trading:
Buy Setup
– When the blue line dips below the 20 level, wait for it to re-enter above 20.
– Look for reversal candlestick patterns (e.g., bullish engulfing, hammer, or morning star).
– Enter above the pattern’s high, with a stop loss below its low.
Sell Setup
– When the blue line rises above the 80 level, wait for it to re-enter below 80.
– Look for bearish candlestick patterns (e.g., bearish engulfing, inverted hammer, or evening star).
– Enter below the pattern’s low, with a stop loss above its high.
🛡 Risk Management Guidelines
Risk only 0.5% of your capital per trade
Book 50% profits at a 1:1 risk-reward ratio
Trail the remaining 50% using price action or other supporting indicators
All-In-One MA Stack ScalperWhat is this Indicator?
This tool is an advanced, multi-layered breakout and trend-following indicator designed for lower timeframes. It identifies high-conviction buy and sell signals by combining moving average stacking with a suite of professional-grade filters.
How Does It Work?
A signal is generated only when ALL of the following conditions are met:
Moving Average Stack (5M Chart):
Buy: The close price is above all five moving averages (MAs: 100, 48, 36, 24, 12).
Sell: The close price is below all five MAs.
Volatility Filter (ATR):
Signals only print when the current ATR (14) is at least 80% of its 100-period average, ensuring you only trade in actively moving markets.
Candle Structure Filter:
The current candle must have a real body that is at least 35% of the candle’s total range, filtering out dojis and indecision bars.
Big Candle Filter:
The candle’s total range must be at least 40% of the current ATR, avoiding signals on minor, insignificant moves.
Volume Filter:
The current volume must be at least 80% of its 50-period average, filtering out signals during illiquid or quiet market conditions.
Minimum Distance from All MAs:
Price must be a minimum distance (20% ATR) away from each MA, confirming a clean breakout and avoiding signals in tight MA clusters or ranging markets.
RSI Momentum Filter:
Buy: RSI(14) must be greater than 55.
Sell: RSI(14) must be less than 45.
This ensures trades are only taken in the direction of momentum.
ADX Trend Filter:
ADX(14,14) must be above 20, ensuring signals only print in trending conditions (not in chop/range).
Minimum Bars Between Signals:
Only one signal per direction is allowed every 10 bars to avoid overtrading and signal clustering.
What Does This Achieve?
Reduces noise and false signals common in basic MA cross or stack systems.
Captures only strong, high-momentum, and high-conviction moves.
Helps you avoid chop, range, and news whipsaws by combining multiple market filters.
Perfect for advanced scalpers, intraday trend followers, or as a trade filter for algos/EAs.
How to Use It:
Apply to your 5-minute chart.
Green BUY signals: Only when all bullish conditions align.
Red SELL signals: Only when all bearish conditions align.
Use as a stand-alone system or as a filter for your own entries.
Recommended For:
Scalpers & intraday traders who want only the best opportunities.
EA and bot builders seeking reliable signal logic.
Manual traders seeking confirmation of high-probability breakouts.
Tip:
Adjust any of the filters (e.g., RSI/ADX thresholds, minBars, minDist) to make it more/less selective for your style or market.

Liquidity Swing Points [BackQuant]Liquidity Swing Points
This tool marks recent swing highs and swing lows and turns them into persistent horizontal “liquidity” levels. These are places where resting orders often accumulate, such as stop losses above prior highs and below prior lows. The script detects confirmed pivots, records their prices, draws lines and labels, and manages their lifecycle on the chart so you can monitor potential sweep or breakout zones without manual redrawing.
What it plots
LQ-H at confirmed swing highs
LQ-L at confirmed swing lows
Horizontal levels that can optionally extend into the future
Timed removal of old levels to keep the chart clean
Each level stores its price, the bar where it was created, its type (high or low), plus a label and a line reference for efficient updates.
How it works
Pivot detection
A swing high is confirmed when the highest high has swing_length bars on both sides that are lower.
A swing low is confirmed when the lowest low has swing_length bars on both sides that are higher.
Pivots are only marked after they are confirmed, so they do not repaint.
Level creation
When a pivot confirms, the script records the price and the creation bar (offset by the right lookback).
A new line is plotted at that price, labeled LQ-H or LQ-L.
Rendering and extension
Levels can be drawn to the most recent bar only or extended to the right for forward reference.
Label size and line color/transparency are configurable.
Lifecycle management
On each confirmed bar, the script checks level age.
Levels older than a chosen bar count are removed automatically to reduce clutter.
How it can be used
Liquidity sweeps: Watch for price to probe beyond a level then close back inside. That behavior often signals a potential fade back into the prior range.
Breakout validation: If price pushes through a level and holds on closes, traders may treat that as continuation. Retests of the level from the other side can serve as structure checks.
Context for entries and exits: Use nearby LQ-H or LQ-L as reference for stop placement or partial-take zones, especially when other tools agree.
Multi-timeframe mapping: Plot swing points on higher timeframes, then drill down to time entries on lower timeframes as price interacts with those levels.
Why liquidity levels matter
Prior swing points are focal areas where many strategies set stops or pending orders. Price often revisits these zones, either to “sweep” resting liquidity before reversing, or to absorb it and trend. Marking these areas objectively helps frame scenarios like failed breaks, successful breakouts, and retests, and it reduces the subjectivity of eyeballing structure.
Settings to know
Swing Detection Length (swing_length), Controls sensitivity. Lower values find more local swings. Higher values find more significant ones.
Bars until removal (removeafter), Deletes levels after a fixed number of bars to prevent buildup.
Extend Levels Right (extend_levels), Keeps levels projected into the future for easier planning.
Label Size (label_size), Choose tiny to large for chart readability.
One color input controls both high and low levels with transparency for context.
Strengths
Objective marking of recent structure without hand drawing
No repaint after confirmation since pivots are locked once the right lookback completes
Lightweight and fast with simple lifecycle management
Clear visuals that integrate well with any price-action workflow
Practical tips
For scalping: use smaller swing_length to capture more granular liquidity. Keep removeafter short to avoid clutter.
For swing trading: increase swing_length so only more meaningful levels remain. Consider extending levels to the right for planning.
Combine with time-of-day filters, ATR for stop sizing, or a separate trend filter to bias trades taken at the levels.
Keep screenshots focused: one image showing a sweep and reversal, another showing a clean breakout and retest.
Limitations and notes
Levels appear after confirmation, so they are delayed by swing_length bars. This is by design to avoid repainting.
On very noisy or illiquid symbols, you may see many nearby levels. Increasing swing_length and shortening removeafter helps.
The script does not assess volume or session context. Consider pairing with volume or session tools if that is part of your process.

XAUMO MEGABAR Detector]XAUMO MegaBar Detector – Breakout Candle Identification Tool
Purpose:
The XAUMO MegaBar Detector is built to highlight rare, high-impact candles where strong price movement and high trading volume occur together. These moments often reflect aggressive market activity and can be used to confirm potential breakouts or reversals.
How It Works (High-Level Overview)
The tool continuously monitors two primary conditions:
Price Expansion – Identifies large-bodied candles compared to recent averages.
Volume Expansion – Confirms that the move is supported by above-average trading activity.
When both conditions are present, the candle is marked:
🟢 Mega Bull – Strong bullish pressure.
🔴 Mega Bear – Strong bearish pressure.
Key Features
Automatic Timeframe Adjustment – Detection sensitivity changes based on chart timeframe, so results stay relevant from 1-minute scalps to multi-day swing setups.
Clear Visual Output – Significant candles are highlighted directly on the chart for easy recognition.
Optional Labels – Toggle on/off text labels (“Mega Bull” / “Mega Bear”) for a cleaner chart view.
Alert Integration – Set TradingView alerts to be notified immediately when a qualifying candle appears.
Universal Compatibility – Works on Forex, Commodities, Indices, Crypto, Stocks, ETFs, and Futures.
Practical Uses for Traders
As a confirmation tool when price approaches support/resistance or Fibonacci levels.
To filter low-quality setups by focusing only on moments where both price and volume confirm the move.
As part of a trend-following or breakout strategy when combined with other analysis methods.
Using the Indicator
Add the indicator to any chart and select your preferred timeframe.
Watch for highlighted candles – they indicate significant combined momentum and liquidity.
Use as a signal filter or confirmation alongside your existing trading system.
Optional: Set alerts to receive push/email/webhook notifications.
===================================
📌 MEGA BAR TRADING CHEAT SHEET
Spot Big Money. Ride the Move.
===================================
🧠 WHAT’S A MEGA BAR?
A Mega Bar is a candle so big it makes the rest look tiny — and it often means institutions are making a move.
Check the 4 Rules:
✅ Body size ≥ 2x average
✅ High relative volume (vs. last 20 bars)
✅ Closes near high (bull) or low (bear)
✅ Comes after sideways chop or price squeeze
📈 WHY IT MATTERS
Mega Bars = intent, not random spikes.
🟢 Mega Bull near support/Fib pullback → Likely accumulation
🔴 Mega Bear near resistance/Fib extension → Likely distribution or trap
🔧 HOW TO TRADE IT
1. WAIT FOR IT
No Mega Bar → No trade.
Mega Bull (big green) → BUY bias.
Mega Bear (big red) → SELL bias.
2. FIND THE SPOT
Fib levels: 61.8% / 78.6% / 138.2%
Major Support/Resistance
3. CONFIRM ON BIGGER TIMEFRAME
Example: 15M Mega Bar → Check 1H trend direction.
4. SET YOUR LEVELS
Stop-Loss:
Long → Below Mega Bull low (+0.2×ATR)
Short → Above Mega Bear high (+0.2×ATR)
Take-Profit:
Fib extensions: 127.2% / 161.8% / 261.8%
Prior highs/lows
5. RISK SMART
Risk 1–2% max per trade
Aim for 2:1+ R:R
🌍 WORKS ON:
Forex • Commodities • Stocks • Crypto • Indices
THE RETAILER’S FORMULA:
🟢 Big Green → Buy
🔴 Big Red → Sell
🎯 Fibs = Payday
One setup. One signal. Discipline = profit.

Logarithmic Moving Average (LMA) [QuantAlgo]🟢 Overview
The Logarithmic Moving Average (LMA) uses advanced logarithmic weighting to create a dynamic trend-following indicator that prioritizes recent price action while maintaining statistical significance. Unlike traditional moving averages that use linear or exponential weights, this indicator employs logarithmic decay functions to create a more sophisticated price averaging system that adapts to market volatility and momentum conditions.
The indicator displays a smoothed signal line that oscillates around zero, with positive values indicating bullish momentum and negative values indicating bearish momentum. The signal incorporates trend quality assessment, momentum confirmation, and multiple filtering mechanisms to help traders and investors identify trend continuation and reversal opportunities across different timeframes and asset classes.
🟢 How It Works
The indicator's core innovation lies in its logarithmic weighting system, where weights are calculated using the formula: w = 1.0 / math.pow(math.log(i + steepness), 2) The steepness parameter controls how aggressively recent data is prioritized over historical data, creating a dynamic weight decay that can be fine-tuned for different trading styles. This logarithmic approach provides more nuanced weight distribution compared to exponential moving averages, offering better responsiveness while maintaining stability.
The LMA calculation combines multiple sophisticated components. First, it calculates the logarithmic weighted average of closing prices. Then it measures the slope of this average over a 10-period lookback: lmaSlope = (lma - lma ) / lma * 100 The system also incorporates trend quality assessment using R-squared correlation analysis of log-transformed prices, measuring how well the price data fits a linear trend model over the specified period.
The final signal generation uses the formula: signal = lmaSlope * (0.5 + rSquared * 0.5) which combines the LMA slope with trend quality weighting. When momentum confirmation is enabled, the indicator calculates annualized log-return momentum and applies a multiplier when the momentum direction aligns with the signal direction, strengthening confirmed signals while filtering out weak or counter-trend movements.
🟢 How to Use
1. Signal Interpretation and Threshold Zones
Positive Values (Above Zero): LMA slope indicating bullish momentum with upward price trajectory relative to logarithmic baseline
Negative Values (Below Zero): LMA slope indicating bearish momentum with downward price trajectory relative to logarithmic baseline
Zero Line Crosses: Signal transitions between bullish and bearish regimes, indicating potential trend changes
Long Entry Threshold Zone: Area above positive threshold (default 0.5) indicating confirmed bullish signals suitable for long positions
Short Entry Threshold Zone: Area below negative threshold (default -0.5) indicating confirmed bearish signals suitable for short positions
Extreme Values: Signals exceeding ±1.0 represent strong momentum conditions with higher probability of continuation
2. Momentum Confirmation and Visual Analysis
Signal Color Intensity: Gradient coloring shows signal strength, with brighter colors indicating stronger momentum
Bar Coloring: Optional price bar coloring matches signal direction for quick visual trend identification
Position Labels: Real-time position classification (Bullish/Bearish/Neutral) displayed on the latest bar
Momentum Weight Factor: When short-term log-return momentum aligns with LMA signal direction, the signal receives additional weight confirmation
Trend Quality Component: R-squared values weight the signal strength, with higher correlation indicating more reliable trend conditions
3. Examples: Preconfigured Settings
Default: Universally applicable configuration balanced for medium-term investing and general trading across multiple timeframes and asset classes.
Scalping: Highly responsive setup with shorter period and higher steepness for ultra-short-term trades on 1-15 minute charts, optimized for quick momentum shifts.
Swing Trading: Extended period with moderate steepness and increased smoothing for multi-day positions, designed to filter noise while capturing larger price swings on 1-4 hour and daily charts.
Trend Following: Maximum smoothing with lower steepness for established trend identification, generating fewer but more reliable signals optimal for daily and weekly timeframes.
Mean Reversion: Shorter period with high steepness for counter-trend strategies, more sensitive to extreme moves and reversal opportunities in ranging market conditions.

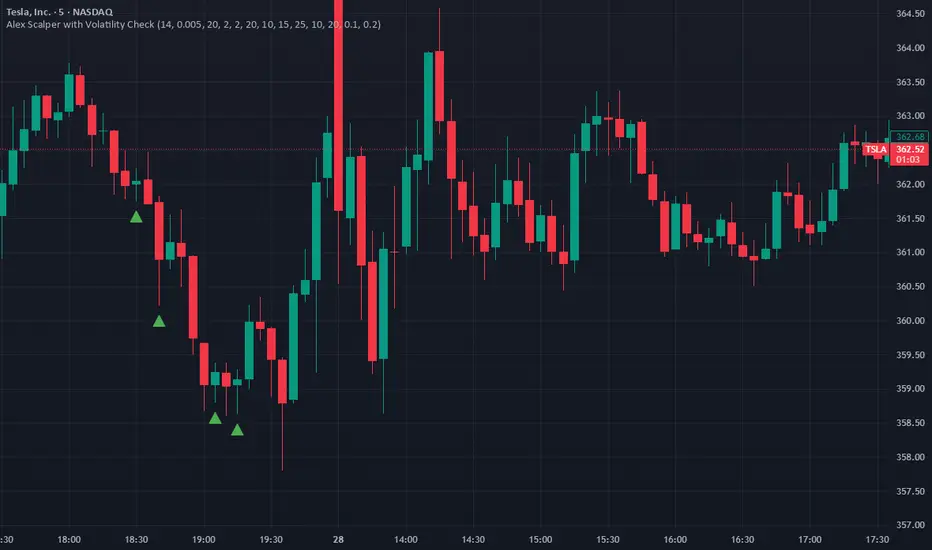
Alex Scalper with Volatility CheckAlex Scalper with Volatility Check - Script Description
This Pine Script indicator is a comprehensive scalping strategy designed for short-term trading with built-in risk management and volatility filtering.
Key Features:
📊 Core Strategy:
Uses VWAP (Volume Weighted Average Price) as the primary trend filter
Employs Stochastic oscillator for entry timing (oversold/overbought conditions)
Generates buy signals when price is above VWAP with stochastic momentum
Generates sell signals when price is below VWAP with stochastic reversal
🛡️ Risk Management:
Volatility Protection: Automatically pauses trading during high volatility periods using ATR and Bollinger Band width analysis
Multi-Target System: Three take-profit levels (10, 15, 25 points) for progressive profit-taking
Fixed Stop Loss: 20-point stop loss protection
Position Sizing: Dynamic lot size adjustment based on win/loss performance
⏰ Trading Hours:
Restricted to US market hours (9:30-11:30 AM and 2:00-4:00 PM EST)
Prevents trading during low-liquidity periods
🔔 Alert System:
Real-time buy/sell alerts with complete trade information
Includes entry price, stop loss, take profit levels, and position size
Ready for automated trading integration
📈 Visual Elements:
Green triangles for buy signals below price bars
Red triangles for sell signals above price bars
Orange volatility warning labels during high-risk periods
This script is ideal for traders seeking a systematic approach to scalping with built-in protection against volatile market conditions.
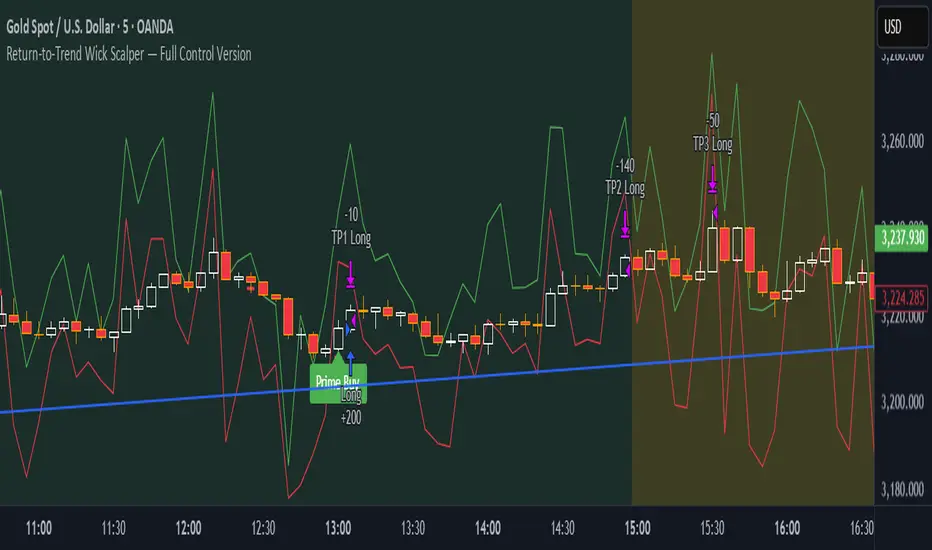
Return-to-Trend Wick Scalper — Full Control VersionReturn-to-Trend Wick Scalper — Modular Scalping Strategy for Gold (XAUUSD) & Indices
This is a precision-engineered scalping strategy designed primarily for high-volatility instruments such as Gold (XAUUSD), NASDAQ, and indices.
The system focuses on counter-trend pullbacks within the dominant daily trend, utilizing wick-based liquidity grabs (commonly referred to as “John Wick” candles) to identify high-probability return-to-trend opportunities.
Key Features:
✅ Dynamic Wick Reversal Detection: Detects reversal setups based on wick dominance and body ratio.
✅ Multiple Take Profit Levels: TP1, TP2, TP3 with individual enable/disable toggles and adjustable exit percentages.
✅ Time-Based Stop-Loss: Optional failsafe to close trades after exceeding a defined number of bars.
✅ VWAP Proximity Filter: Ensures entries happen near volume-weighted average price for precision.
✅ Pullback Depth Control: Filter for significant pullbacks using percentage of daily ATR.
✅ Dynamic Support & Resistance Validation: Confirms setups at key reactive levels.
✅ Volatility Filter: Avoids entries in overly volatile or dead market conditions.
✅ Aggressive Entry Mode: Optional early entry at pullback zones for faster fills.
✅ Paper Trading & Backtest Ready: Fully compatible with TradingView’s Paper Trading simulator.
Usage Notes:
Optimized for 5-minute chart entries.
Use in conjunction with Paper Trading for forward testing before live execution.
Can be connected to live brokers via alert webhooks and external bridges like PineConnector.
Instrument Focus:
Gold (XAUUSD) ✅
NASDAQ ✅
Dow Jones (US30) ✅
Other liquid indices ✅
Risk Note:
Always test thoroughly in Paper Trading before going live.
Optimize TP levels and filters according to market volatility conditions.
Designed for traders who want precision entries, flexibility in scaling out positions, and professional-grade risk control.
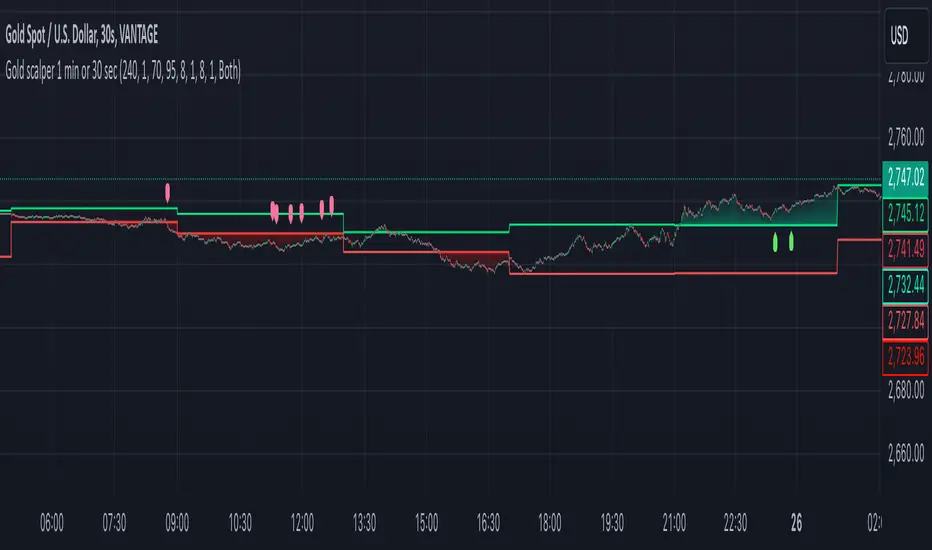
Gold scalper 1 min or 30 secThis Pine Script code for TradingView is designed to create a trading indicator titled "Gold scalper 1 min or 30 sec." The indicator is primarily used for scalping gold and is focused on short-term timeframes (1 minute or 30 seconds).
### Key Components of the Code:
1. **Inputs:**
- **Resolution:** Users can set the timeframe for analysis (default is 240 minutes).
- **SMA (Simple Moving Average):** Users can specify the period for the SMA used in the calculations.
2. **Daily Highs and Lows:**
- The script calculates the previous day’s high (`yesterdayHigh`) and low (`yesterdayLow`) prices using the `request.security` function.
3. **SMA Calculation:**
- An SMA is computed based on the closing prices of the selected timeframe.
4. **Breakout Conditions:**
- The script detects breakouts using the SMA in relation to yesterday's high and low:
- A breakout upwards occurs when the SMA crosses above the previous day's high.
- A breakout downwards occurs when the SMA crosses below the previous day's low.
5. **RSI (Relative Strength Index) Calculations:**
- Two RSI values are calculated to assess market momentum:
- **Banker RSI:** Used for buy conditions.
- **Hot Money RSI:** Used for sell conditions.
- These include adjustable sensitivity factors and periods to customize the indicator’s sensitivity.
6. **Trade Direction Selection:**
- Users can select whether to trade long, short, or both directions.
7. **Buy and Sell Signals:**
- Buy conditions are set when the Retail Moving Average crosses the Banker Moving Average under certain conditions.
- Sell conditions are marked when the Banker Moving Average crosses under the specified sell threshold.
- These signals are visually represented on the chart with specific shapes (up arrows for buys and down arrows for sells).
8. **Alerts:**
- Alerts are generated for buy and sell signals to notify users when certain conditions are met.
9. **Trend Visualization:**
- The script visually indicates uptrends and downtrends on the chart by plotting colors based on the relationship between the current price, yesterday's high, and low.
### General Purpose:
This indicator is designed to assist traders in identifying potential buying and selling opportunities in the gold market based on short-term price movements and momentum indicators, helping them capitalize on quick price fluctuations that are characteristic of scalping strategies.