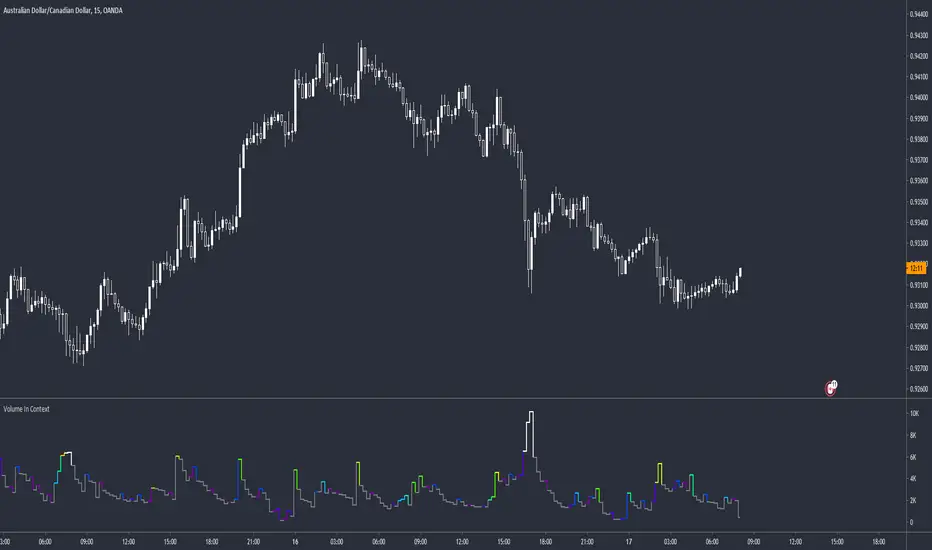
Volume Surge indicatorThis indicator highlight candles when Volume surge "X" times in compare of last "n" candle.
It helps you to find moments of market which Volatility and Position volumes raise significantly.
In other words, It shows footstep of "Big Banks" or "Whales" or other Giants ;)
- default value highlight candles when Volume is 2 time more than average of last 30 candle. But you can modify both values in your favor.
* You can set Alarm for notifying in advance when Volume surge happened on any chart.
I hope you guys find it helpful and handy
Cari dalam skrip untuk "volume"

Volume on bar VSA - signal V2Google translate.
This indicator marks bars on the chart with high and medium volumes. The direction of the effort depends on whether the tail is on the bar, bullish or bearish.
In the settings you can set (sensitivity) for tinting volumes of high and medium
This indicator highlights volumes just like here
Этот индикатор помечает бары на графике с повышенными и средними объемами. Направление усилия зависимости от того какой хвост на баре, бычий или медвежий.
В настройках можно задать (чувствительность) для подкрашивания объемов повышенных и средних.
Этот индикатор выделяет объемы точно также как

Volume peak visualizerVery simple indicator to show how relatively large a volume is, in comparison to previous volumes. IMHO it's clearer than the default version.
Volume SpikeThis script identifies volume spikes as a percentage change of the current bar's volume compared to the previous 3 bars' average volume.

Volume Profile DeltaThis indicator calculates the Volume Profile Delta (VPD). It constructs a high-resolution volume profile for each bar using intra-bar data, offering a detailed understanding of buying and selling pressure at discrete price levels.
Key Features:
Statistical Volume Profile Engine: For each bar, the indicator builds a high-resolution volume profile on a lower 'Intra-Bar Timeframe'. Instead of simple tick counting, it uses statistical models ('PDF' allocation) to distribute volume across price levels and advanced classifiers ('Dynamic' split) to determine the buy/sell pressure within that profile, providing a more nuanced delta calculation.
"Delta Candle" Visualization: The per-bar VPD is displayed as a candle, where:
Open: Always anchored at the zero line.
High/Low: Represent the peak buying (CVD High) and selling (CVD Low) pressure accumulated within that bar's profile.
Close: The final net delta value (CVD) for the bar.
Customizable Moving Average: An optional moving average of the net delta (Close) can be added. The MA type, length, and an optional Volume weighted setting are customizable.
Intra-Bar Peak Pivot Detection: Automatically identifies and plots significant turning points (pivots) in the peak buying (High) and selling (Low) pressure.
Note on Confirmation (Lag): Pivot signals are confirmed using a lookback method. A pivot is only plotted after the Pivot Right Bars input has passed, which introduces an inherent lag.
Multi-Timeframe (MTF) Capability:
MTF Output: The entire analysis (Delta Candles, MA, Pivots) can be calculated on a higher timeframe (using the Timeframe input), with standard options to handle gaps (Fill Gaps) and prevent repainting (Wait for...).
Limitation: The Pivot detection (Calculate Pivots) is disabled if a Higher Timeframe (HTF) is selected.
Integrated Alerts: Includes 8 alerts for:
The net delta crossing its moving average.
The detection of new peak buying or selling pivots.
Conditions of agreement or disagreement between the net delta and the main bar's direction.
Caution: Real-Time Data Behavior (Intra-Bar Repainting) This indicator uses high-resolution intra-bar data. As a result, the values on the current, unclosed bar (the real-time bar) will update dynamically as new intra-bar data arrives. This behavior is normal and necessary for this type of analysis. Signals should only be considered final after the main chart bar has closed.
DISCLAIMER
For Informational/Educational Use Only: This indicator is provided for informational and educational purposes only. It does not constitute financial, investment, or trading advice, nor is it a recommendation to buy or sell any asset.
Use at Your Own Risk: All trading decisions you make based on the information or signals generated by this indicator are made solely at your own risk.
No Guarantee of Performance: Past performance is not an indicator of future results. The author makes no guarantee regarding the accuracy of the signals or future profitability.
No Liability: The author shall not be held liable for any financial losses or damages incurred directly or indirectly from the use of this indicator.
Signals Are Not Recommendations: The alerts and visual signals (e.g., crossovers) generated by this tool are not direct recommendations to buy or sell. They are technical observations for your own analysis and consideration.

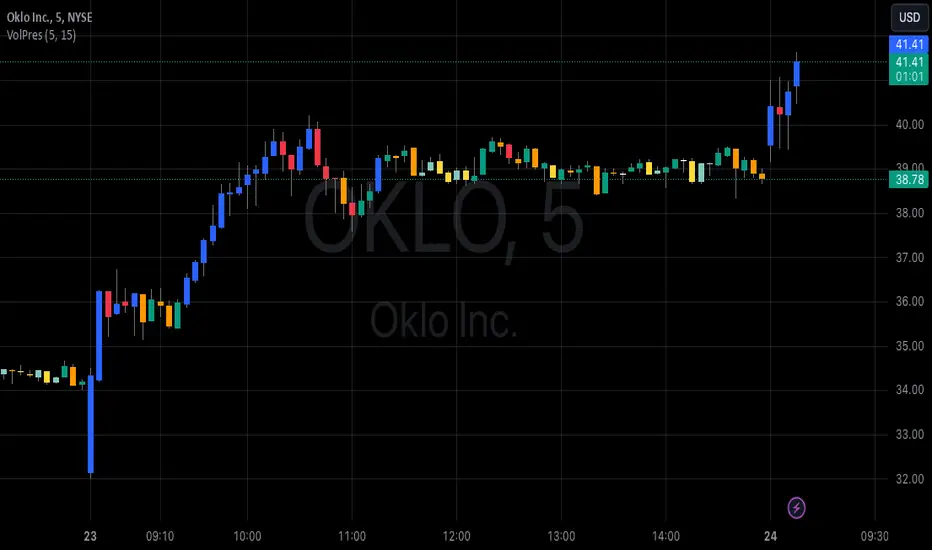
Volume PressureDraws the candle chart with colors to represent low, medium and high volumes. You get 3 colors for downward and 3 colors for upward movement. This will aid with immediately seeing the relative volume pushing the stock candle in the direction of movement.
You can control the percentage threshold for low and high volume. You also can change the colors to represent each volume level for upward and downward movement.
Volume Equilibrium Overlay(2 of 2)This is an overlay for a prior script I've created: Volume Equilibrium.
To sum it up in a brief manner, this script plots when there is "volume-equilibrium" aka prices that the market may see as "fair-value" relative to the specified timeframe. This script provides what my last code lacked and that is a visual representation of critical prices.
The arrows beside the indications indicate the direction that the buying/selling volume was heading towards.
UP ARROW - indicates that equilibrium was had via increasing buy volume
DOWN ARROW - indicates that equilibrium was had via decreasing buy volume
Remember, this doesn't inherently mean that a stock is supposed to go up or down. Its just a representation of 'fair-value' points using volume. Also remember... both indicators provide what the other lacks. It isn't necessary to use both but for a broad overview of volume it definitely helps to at least be aware of how this information can be represented. Perhaps... consider switching between the two to see what you may be missing.
I believe finding 'fair-value' points via volume and price action provides a more objective way to measure what prices one should look at rather then arbitrary lines plotted on a chart. For more information feel welcome to look at the script that this code is based off of.

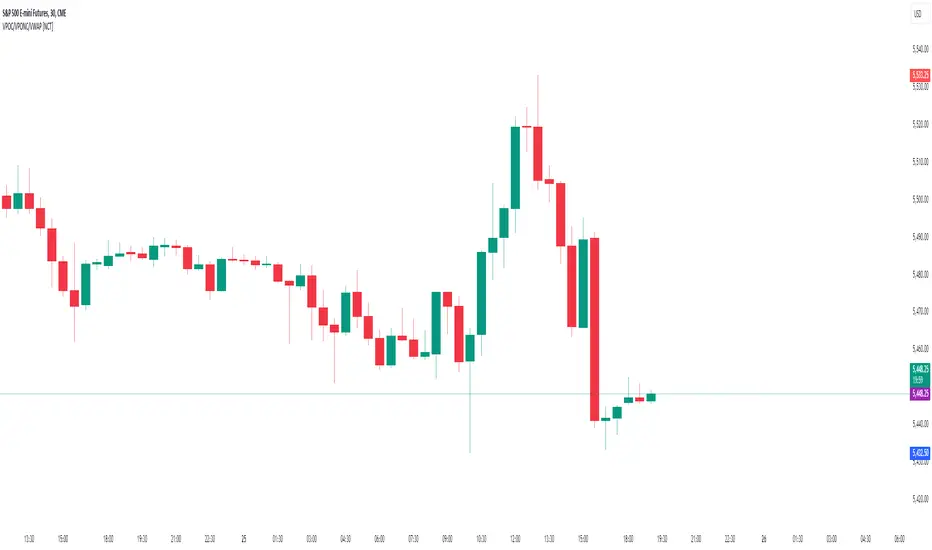
Volume Points of Control and No Control [NariCapitalTrading]Overview:
The "Volume Points of Control and No Control" (VPOC/VPONC) is a trading indicator/concept I designed to identify key price levels based on volume activity. It shows (on the price label on the y-axis) where there was the most (red) and the least (blue) volume over a specified lookback period. Read below for interpretation.
Key Features:
Identifies key price levels based on volume
Customizable lookback period and trade timeframe
Plots Volume Point of Control (VPOC) and Volume Point of No Control (VPONC)
Inputs and Calculations:
Custom Trade Timeframe: Allows users to set the desired timeframe for analysis (e.g., Daily, Weekly).
Lookback Period: Users can specify the period over which to analyze volume data.
VPOC Calculation: Determines the price level with the highest volume within the lookback period.
VPONC Calculation: Finds the price level with the lowest volume within the lookback period.
Indicator Usage:
The VPOC is considered a significant level where traders have shown the most interest, often acting as a strong support or resistance level. The VPONC, conversely, is a concept I made up. It represents a price level where 1) in an trending market, this price was accepted quickly, thus suggesting continuation of an trend. 2) price retracements will typically revisit thinly-traded price areas, the VPONC can sometimes signal an area of support in a downtrend.
Chart Representation:
VPOC Label: Plotted on the y-axis in red, indicating the price level with the highest volume.
VPONC Label: Displayed on the y-axis in blue, showing the price level with the least volume.
These labels are dynamically updated based on the user-specified lookback period and trade timeframe.
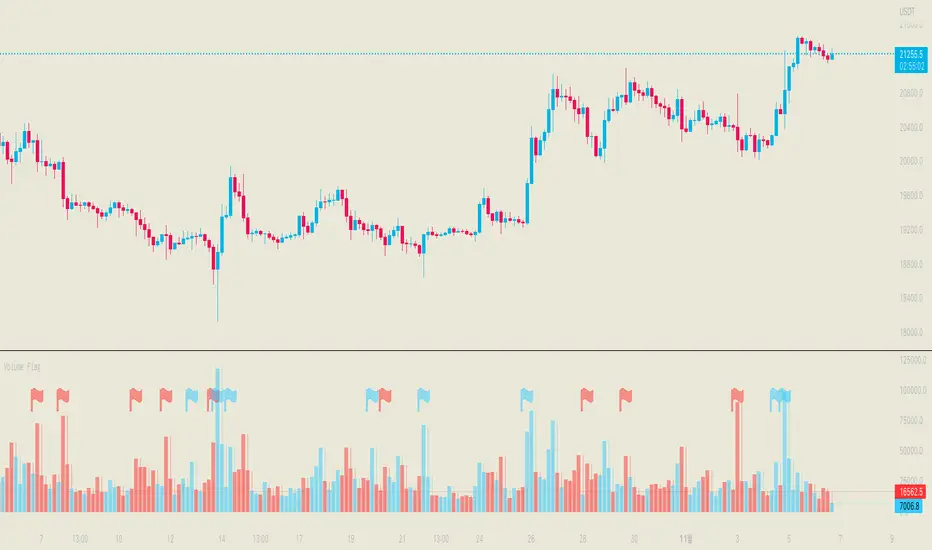
Volume FlagThis indicator shows the increased volume compared to the previous volume.
A flag is displayed when the trading volume increased by *n of the previous candle.
Receive a signal as an alert.
Thank you.
(Please comment and click on the rocket.)
-------------------
이 지표는 이전 캔들의 거래량 대비 증가된 거래량을 확인할 수 있습니다.
깃발을 사용하여 증가 감소를 확인할 수 있으며 n배 만큼의 증가 되었을때 표시됩니다.
그리고 깃발이 표시될 경우 알람을 받으실 수 있습니다.
감사합니다.
댓글과 로케트 클릭 부탁드립니다.
Volume Profile, Pivot Anchored by DGTVolume Profile (also known as Price by Volume ) is an charting study that displays trading activity over a specified time period at specific price levels. It is plotted as a horizontal histogram on the finacial isntrumnet's chart that highlights the trader's interest at specific price levels. Specified time period with Pivots Anchored Volume Profile is determined by the Pivot Levels, where the Pivot Points High Low indicator is used and presented with this Custom indicator
Finally, Volume Weighted Colored Bars indicator is presneted with the study
Different perspective of Volume Profile applications;
Anchored to Session, Week, Month etc : Anchored-Volume-Profile
Custom Range, Interactive : Volume-Profile-Custom-Range
Fixed Range with Volume Indicator : Volume-Profile-Fixed-Range
Combined with Support and Resistance Indicator : Price-Action-Support-Resistance and Volume-Profile
Combined with Supply and Demand Zones, Interactive : Supply-Demand-and-Equilibrium-Zones
Disclaimer : Trading success is all about following your trading strategy and the indicators should fit within your trading strategy, and not to be traded upon solely
The script is for informational and educational purposes only. Use of the script does not constitutes professional and/or financial advice. You alone the sole responsibility of evaluating the script output and risks associated with the use of the script. In exchange for using the script, you agree not to hold dgtrd TradingView user liable for any possible claim for damages arising from any decision you make based on use of the script

Volume Trend MeterSweet little indicator which measures volume pressure over a specific period of time.
i call it Volume Trend Meter, or just VTM,
The indicator sums up all green candles volume and red candles volumes over a specific period of bars (you set in settings) and plots their values.
Use this indicator to identify increasing volume with the green candles (close higher than open) and increasing volume of the red candles (close is lower than open).
======= Calculation ==========
For Green Column: Total volume of green candles is higher than total red candles volume.
For Red Column: Total volume of red candles is higher than total green candles volume.
======= Volume Trend Meter Colors =======
Green: Increasing buying pressure.
Red: Increasing selling pressure.
Like if you like and Follow me for upcoming indicators/strategies.

Volumes on CandleThis script uses standard deviation of volume from the mean to color the candles.
IMPORTANT: Hide original candle, clicking in the "eye" near title.
I prefer use large Length input for more stability at mean and standard deviation values.
Uses 5 colors, by default:
Red = Volume >= 4 stdev;
Orange = 4 stdev > Volume >= 2.5 stdev;
Yellow = 2.5 stdev > Volume >= 1 stdev;
White = 1 stdev > Volume >= -0.5 stdev;
Aqua = -0.5 stdev > Volume.
I coded another script, called "Colored Volumes Histogram". It uses the same idea, but color directly the volume histogram.

Volume Pressure and PercentVPP Volume Pressure and Percentage Indicator with a Volume Trendline that indicates which side is driving the flow.
Features:
1. Buy/Sell Pressure Bars (Core Volume Split)
The indicator separates each candle’s volume into buy volume (green) above the zero line and sell volume (red) below it. This gives you a real-time visualization of which side is more aggressive within the current bar. Instead of waiting for prices to move or candles to close, you can instantly see whether buyers or sellers are stepping in.
2. Dynamic Total Volume (Invisible Histogram + Status Line Color)
The total volume of each bar is tracked behind the scenes and displayed in the pinned status line using a dynamic color—green when buyers dominate, red when sellers dominate. The histogram for total volume is invisible to keep the chart clean, but the total volume figure stays visible and changes color based on who is in control. This gives you instant confirmation of whether institutional-sized volume supports the direction shown by the buy/sell pressure, which is especially valuable when evaluating the risk or conviction behind a potential entry.
3. Percentage Mode (% of Bar Volume)
When toggled on, the indicator converts each bar into percent buy vs percent sell, normalizing all flow to a 0–100% scale. This mode is incredibly useful when comparing pressure across different times of day, gaps, or varying volume conditions—such as early morning spikes versus lunchtime chop. By removing absolute volume from the equation, you gain a clean look at the actual imbalance between buyers and sellers.
4. 70% Pressure Band (Imbalance Threshold Zone)
In percentage mode, the indicator displays a subtle 70% band (a light gray zone) above and below the zero line, showing where buy or sell pressure reaches extreme dominance (≥70%). When a bar’s buy or sell percentage enters this zone, it highlights moments of exhaustion, acceleration, or potential reversal. The band acts like a real-time overbought/oversold gauge specifically for volume imbalance, not price.
5. Trend Line (Net Pressure Trend / Reversal Detector)
The trend line smooths out the net volume pressure (buy volume minus sell volume or its percentage equivalent) and shows the overall direction of order flow. When the line slopes upward, buyers are gaining control; when it slopes downward, sellers are taking over. This trend line acts as a real-time momentum indicator based directly on flow rather than price. Because it reacts quickly to intrabar shifts in buy/sell pressure, it often turns before price does—giving you a measurable timing edge.
6. Auto-Selecting Trend Source (Volume Net, Percent Net, or CVD)
The indicator lets you choose how the trend line is calculated: Volume Net (buy minus sell volume), Percent Net (normalized imbalance), or CVD (Cumulative Volume Delta) for long-term flow bias. The default “Auto” mode automatically switches between Volume Net and Percent Net depending on which view you’re using. This flexibility allows the trend line to remain meaningful whether you’re analyzing raw volume or normalized percentage data.
7. Pinned (Status Line) Totals in K/M/B Format
Regardless of whether you’re in volume or percentage mode, the indicator always displays Total Volume, Buy Volume, and Sell Volume in the status line using abbreviated K, M, B formatting. These values update in real time and are color-coded: green for bullish dominance, red for bearish. This gives you a concise snapshot of order flow strength on every bar.
---------------------
How To Use:
Support Level Zones
• Watch for Buy bars increasing + Trend line flipping up right at or slightly below support.
• This often signals absorption — market makers filling large buy orders before reversal.
• Confirmation: Price reclaims VWAP ... enter calls / longs.
Resistance Level Zones
• Watch for Sell bars increasing + Trend line flattening/turning down near resistance.
• This signals distribution or stop runs.
• Confirmation: Price rejects VWAP ... enter puts / shorts.
Breakout Traps
• Sometimes you’ll see price break a level, but the flow doesn’t confirm (buy volume doesn’t expand).
• That’s a false breakout — fade it with options opposite the move.

Volume Cluster Heatmap [BackQuant]Volume Cluster Heatmap
A visualization tool that maps traded volume across price levels over a chosen lookback period. It highlights where the market builds balance through heavy participation and where it moves efficiently through low-volume zones. By combining a heatmap, volume profile, and high/low volume node detection, this indicator reveals structural areas of support, resistance, and liquidity that drive price behavior.
What Are Volume Clusters?
A volume cluster is a horizontal aggregation of traded volume at specific price levels, showing where market participants concentrated their buying and selling.
High Volume Nodes (HVN) : Price levels with significant trading activity; often act as support or resistance.
Low Volume Nodes (LVN) : Price levels with little trading activity; price moves quickly through these areas, reflecting low liquidity.
Volume clusters help identify key structural zones, reveal potential reversals, and gauge market efficiency by highlighting where the market is balanced versus areas of thin liquidity.
By creating heatmaps, profiles, and highlighting high and low volume nodes (HVNs and LVNs), it allows traders to see where the market builds balance and where it moves efficiently through thin liquidity zones.
Example: Bitcoin breaking away from the high-volume zone near 118k and moving cleanly through the low-volume pocket around 113k–115k, illustrating how markets seek efficiency:
Core Features
Visual Analysis Components:
Heatmap Display : Displays volume intensity as colored boxes, lines, or a combination for a dynamic view of market participation.
Volume Profile Overlay : Shows cumulative volume per price level along the right-hand side of the chart.
HVN & LVN Labels : Marks high and low volume nodes with color-coded lines and labels.
Customizable Colors & Transparency : Adjust high and low volume colors and minimum transparency for clear differentiation.
Session Reset & Timeframe Control : Dynamically resets clusters at the start of new sessions or chosen timeframes (intraday, daily, weekly).
Alerts
HVN / LVN Alerts : Notify when price reaches a significant high or low volume node.
High Volume Zone Alerts : Trigger when price enters the top X% of cumulative volume, signaling key areas of market interest.
How It Works
Each bar’s volume is distributed proportionally across the horizontal price levels it touches. Over the lookback period, this builds a cumulative volume profile, identifying price levels with the most and least trading activity. The highest cumulative volume levels become HVNs, while the lowest are LVNs. A side volume profile shows aggregated volume per level, and a heatmap overlay visually reinforces market structure.
Applications for Traders
Identify strong support and resistance at HVNs.
Detect areas of low liquidity where price may move quickly (LVNs).
Determine market balance zones where price may consolidate.
Filter noise: because volume clusters aggregate activity into levels, minor fluctuations and irrelevant micro-moves are removed, simplifying analysis and improving strategy development.
Combine with other indicators such as VWAP, Supertrend, or CVD for higher-probability entries and exits.
Use volume clusters to anticipate price reactions to breaking points in thin liquidity zones.
Advanced Display Options
Heatmap Styles : Boxes, lines, or both. Boxes provide a traditional heatmap, lines are better for high granularity data.
Line Mode Example : Simplified line visualization for easier reading at high level counts:
Profile Width & Offset : Adjust spacing and placement of the volume profile for clarity alongside price.
Transparency Control : Lower transparency for more opaque visualization of high-volume zones.
Best Practices for Usage
Reduce the number of levels when using line mode to avoid clutter.
Use HVN and LVN markers in conjunction with volume profiles to plan entries and exits.
Apply session resets to monitor intraday vs. multi-day volume accumulation.
Combine with other technical indicators to confirm high-probability trading signals.
Watch price interactions with LVNs for potential rapid movements and with HVNs for possible support/resistance or reversals.
Technical Notes
Each bar contributes volume proportionally to the price levels it spans, creating a dynamic and accurate representation of traded interest.
Volume profiles are scaled and offset for visual clarity alongside live price.
Alerts are fully integrated for HVN/LVN interaction and high-volume zone entries.
Optimized to handle large lookback windows and numerous price levels efficiently without performance degradation.
This indicator is ideal for understanding market structure, detecting key liquidity areas, and filtering out noise to model price more accurately in high-frequency or algorithmic strategies.

Volume Spikes + Daily VWAP SD BandsVolume Spikes + Daily VWAP SD Bands
This indicator combines volume spike detection to help traders identify potential absorption zones with daily VWAP and standard deviation bands , key price levels, continuation opportunities, and possible institutional bias.
Features:
Volume Spike Detection
Highlights candles with unusually high volume relative to a configurable SMA.
Optional filters:
Local highs/lows only (Only Use Valid Highs & Lows)
Candle shapes: Hammer / Shooter only
Candle color match: bullish spikes on green, bearish on red
Plots small circles above/below bars for bullish and bearish volume spikes.
Alerts available for both bullish and bearish spikes.
Interpretation: Volume spikes at local highs/lows can indicate absorption, where one side absorbs aggressive buying/selling pressure.
Daily VWAP
Calculates volume-weighted average price (VWAP) for the current day.
Optionally shows previous day’s VWAP for reference.
Plot lines are customizable with optional circles on lines for visual clarity.
Labels on the last bar show exact VWAP values.
Institutional Bias Insight: Price above both current and previous VWAPs may indicate bullish positioning; price below both VWAPs may indicate bearish positioning. Many professional traders consider this a clue to institutional bias, but it’s not guaranteed. Always confirm with volume, delta, or orderflow analysis.
Standard Deviation Bands
Optional x1 and x2 SD bands around the daily VWAP.
Visual fill between bands shows price volatility zones.
Can be used to identify potential support/resistance or absorption zones.
Use Case: Price bounces off first SD band may indicate continuation signals, especially when volume spikes occur at those levels.
Customizable Visuals
Colors for bullish and bearish volume spikes
VWAP and SD band colors and thickness
Optional circles and filled bands for better readability
Alerts
Bullish / Bearish Volume Spikes
Supports TradingView alert system for automated notifications
Advanced Use Cases:
Combine with Cumulative Delta or Orderflow tools to confirm true absorption zones.
Identify high-volume rejection candles signaling possible trend continuation.
Use VWAP positioning relative to price to assess potential institutional bias, keeping in mind it is probabilistic, not guaranteed.
Visualize intraday VWAP levels and volatility with SD bands for better trade timing.
Settings: Fully customizable, including volume multiplier, SMA length, session filter, candle shape, color options, and VWAP/SD display preferences.

Volume Delta DashboardHow It Works:
This script creates a Volume Delta Dashboard on TradingView, which helps traders visualize the balance between buying and selling volume (Volume Delta) directly on the chart. Here's a breakdown of the key components:
Volume Delta Calculation:
The script calculates the Volume Delta by comparing the volume of bars where the price closed higher (buying pressure) to those where the price closed lower (selling pressure).
Positive Volume Delta (green background) indicates more buying activity than selling, suggesting upward price movement. Negative Volume Delta (red background) indicates more selling than buying, signaling a potential downward move.
Smoothing with EMA:
To make the volume delta trend smoother and more consistent, an Exponential Moving Average (EMA) of the Volume Delta is used. This helps to reduce noise and highlight the prevailing buying or selling pressure over a 14-period.
Dynamic Position Selection:
The user can choose where the Volume Delta dashboard table will appear on the chart by selecting a position: top-left, top-right, bottom-left, or bottom-right. This makes the indicator adaptable to different chart setups.
Coloring:
The background of the table changes color based on the value of the Volume Delta. Green indicates a positive delta (more buyers), and Red indicates a negative delta (more sellers).
Use of This Strategy:
This Volume Delta Dashboard strategy is particularly useful for traders who want to:
Monitor Market Sentiment:
By observing the volume delta, traders can get a sense of whether there is more buying or selling pressure in the market. Positive volume delta can indicate a bullish sentiment, while negative delta can point to bearish sentiment.
Confirm Price Action:
The Volume Delta can be used alongside price action to confirm the strength of a price move. For example, if the price is moving up and the volume delta is positive, it suggests that the price increase is supported by buying pressure.
Identify Divergences:
Volume delta can help traders spot divergences between price and volume. For example, if the price is moving higher but the volume delta is negative, it may suggest a weakening trend and a potential reversal.
Optimize Entry/Exit Points:
By understanding the relationship between price movement and volume, traders can make more informed decisions about entering or exiting positions. For instance, a sudden increase in buying volume (positive delta) may indicate a good entry point for a long position.
Overall, the Volume Delta Dashboard can serve as a powerful tool for improving decision-making, by providing real-time insights into market dynamics and trading sentiment.

Volume Zones Internal Visualizer [LuxAlgo]The Volume Zones Internal Visualizer is an alternate candle type intended to reveal lower timeframe volume activity while on a higher timeframe chart.
It displays the candle's range, the highest and lowest zones of accumulated volume throughout the candle, and the Lower Timeframe (LTF) candle close, which contained the most volume in the session (Candle Session).
🔶 USAGE
The indicator is intended to be used as its own independent candle type. It is not a replacement for traditional candlesticks; however, it is recommended that you hide the chart's display when using this indicator. Another option is to display this indicator in an additional pane alongside the normal chart, as displayed above.
The display consists of candle ranges represented by outlined boxes, within the ranges you will notice a transparent-colored zone, a solid-colored zone, and a line.
Each of these displays different points of volume-related information from an analysis of LTF data.
In addition to this analysis, the indicator also locates the LTF candle with the highest volume, and displays its close represented by the line. This line is considered as the "Peak Activity Level" (PAL), since throughout the (HTF) candle session, this candle's close is the outcome of the most volume transacted at the time.
We are further tracking these PALs by continuing to extend them into the future, looking towards them for potential further interaction. Once a PAL is crossed, we are removing it from display as it has been mitigated.
🔶 DETAILS
The indicator aggregates the volume data from each LTF candle and creates a volume profile from it; the number of rows in the profile is determined by the "Row Size" setting.
With this profile, it locates and displays the highest (solid area) and lowest (transparent area) volume zones from the profile created.
🔶 SETTINGS
Row Size: Sets the number of rows used for the calculation of the volume profile based on LTF data.
Intrabar Timeframe: Sets the Lower Timeframe to use for calculations.
Show Last Unmitigated PALs: Choose how many Unmitigated PALs to extend.
Style: Toggle on and off features, as well as adjust colors for each.

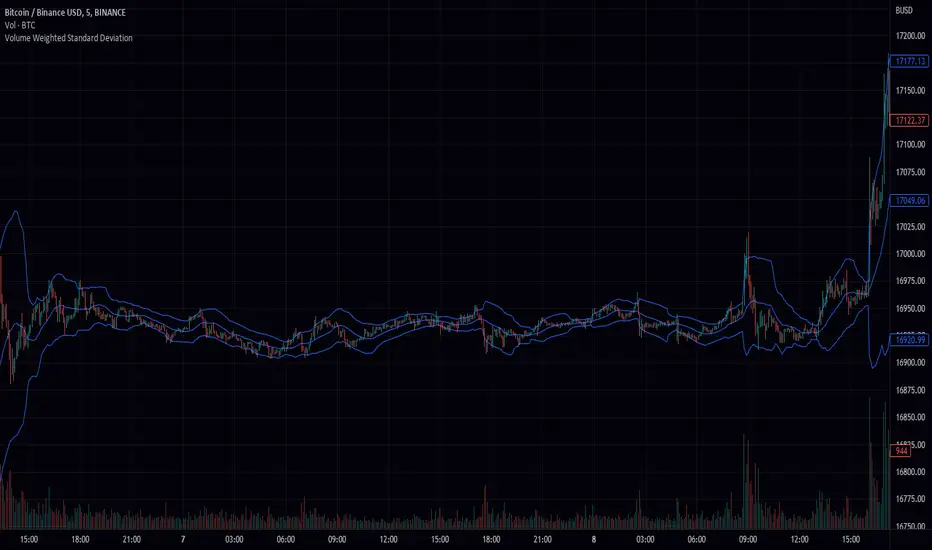
Volume Weighted Standard Deviation (VWSD)The Volume Weighted Standard Deviation indicator is a custom technical analysis tool that uses the volume of trading to calculate the standard deviation of a stock's price. This indicator takes the source of data, the length of data, and the deviation as inputs, and calculates the volume weighted standard deviation using the values.
The indicator first calculates the mean price and mean volume by using simple moving average over the given length of data. Then it calculates the squared difference between the mean price and the actual price, multiplied by the volume. This gives a volume-weighted squared difference. The indicator then calculates the square root of the sum of the volume-weighted squared differences divided by the sum of the volumes over the given length of data. This gives the volume weighted standard deviation.
The indicator then plots the standard deviation and deviation as a band around the simple moving average of the source data, providing a clear view of the volatility of the stock.
In summary, the Volume Weighted Standard Deviation indicator is a powerful tool for measuring the volatility of a stock by taking into account the volume of trading. It uses the volume of trading to calculate the standard deviation of a stock's price, giving a more accurate representation of the volatility of the stock. It can be useful for traders to identify entry and exit points and make more informed trading decisions.
Volume Pace & Pressure TableHave you ever wanted to know if a particular tickers volume is above or below average while still in the trading day? This indicator displays an easy-to-read table that informs the user exactly what is occurring in intraday volume. And a whole lot more!
Description
This indicator displays a variable table with either two or three columns and always three rows. It packs everything a user needs to know about volume in one small table. The table shows:
Current trading days volume
Average daily volume
Volume Pace
Volume Pressure (Buying & Selling)
Volume Pace
Volume Pace is a mathematical calculation invented by the author, Infinity_Trading . The problem was to figure out a way to know if the current days volume was below average or above average while still in the trading day. Calculations like Percent Daily Volume don’t work during the intraday trading hours. For example, say SPY has a 20-day volume average of 100 million shares. If in the first hour SPY has only traded 10 million shares then dividing the current volume into the average daily volume doesn’t tell the user anything when there is still 5.5 hours of trading left in the trading day. There had to be a better way! The solution was to chop up the trading day into evenly divisible time periods (i.e. <= 30 minutes). The Volume Pace algorithm takes the average daily volume and chops it up into small time periods based upon the charts current timeframe. This is the average volume per smaller time period. Then use the current days volume and the number of time periods that have occurred in the trading day so far (at the current moment in time i.e. the current candlestick) to form a calculation that returns the volume above or below the average volume up to that point in time.
Volume Pace Equations
Intraday Vol. Pace = Today’s Current Vol. - ( ( Average Daily Vol. / Time periods in trading day ) * Time periods that have occurred so far in trading day )
Postday Vol. Pace = Today’s Trading Vol. - Average Daily Vol.
^ Vol. = Volume (because TradingViews pine tags are dumb)
Volume Pace Definitions
Volume Pace is the difference in cumulative volume between todays current volume and the average daily volume up to same time of the day
Volume Pace Usage
If the Volume Pace is a positive number then it means that up to the current trading time the volume is that amount greater than the average daily volume over that same intraday time span.
If the Volume Pace is a negative number then it means that up to the current trading time the volume is that amount smaller than the average daily volume over that same intraday time span.
If the Volume Pace is positive during the intraday then the volume is on track to be an above average volume trading day.
If the Volume Pace is negative during the intraday then the volume is on track to be a below average volume trading day.
The Percent Volume Pace is the percent increase or decrease of the current volume compared to the average volume up to the same time of day. Or the Percent Volume Pace is the Volume Pace expressed as a percentage.
After the trading day is complete the Volume Pace will be the difference between the Daily Volume and the Average Daily Volume. And the same thing applies to the Percent Volume Pace.
Volume Pressure
The author, Infinity_Trading, did not invent the calculations for Volume Pressure but the definitions and explanations of Volume Pressure are their own creations. In specific terms, Volume Pressure is a mathematical calculation that uses the direction and distances of individual candlesticks bodies and wicks to assign a numerical value to volume.
buyingPressure = vol * (close - low) / (high - low)
sellingPressure = vol * (high - close) / (high - low)
^ vol = Volume (because TradingViews pine tags are dumb)
The author wants to make clear that volume “pressure” isn’t a real thing. Trades in any market require a buyer and a seller. So there is always an equal number of buyers and sellers. Thus, the idea that there are more buyers or more sellers isn’t rooted in reality. BUT the author believes that the calculation and understanding of “volume pressure” takes a very complex subject (price moment in a market) and condenses into something that intuitively makes sense to humans (pressure) and places it onto something that is already on everyone’s charts (volume bars).
The calculation for Buying Pressure is really calculating the upward distance between the low and the close of the candle. While Selling Pressure is measuring the downward distance from the high to the close. And both are using volume bars to express these measurements. So if an individual candle goes down then the red Selling Pressure will be more on the stacked bar chart than the green Buying Pressure. And vice versa for candles that went up. If a Volume Pressure bar is completely one color then it means, for a downward candle, the low and close were equivalent, and for an upward candle, the high and the close were the same. Lastly, the Buying & Selling Pressure will always add up to 100%.
Inputs and Style
In the Input section the user can set the number of days to use for all of the average calculations. All aspects of the table can be controlled. The background color, text color, border widths, and border colors. Also, the table can be moved to 9 unique locations around the chart for complete user control. Also, the user can use their cursor to hover over each cell in the table to reveal a tooltip definition of the calculation in the cell.
Special Notes
The volume table won’t display when the chart timeframe is weekly or monthly because the logic uses “daily” volume.
The Volume Pace column in the table disappears when the timeframe is greater than 30 minutes. Because for Volume Pace to work the time periods must be equally divisible into 6.5 hours (the duration of trading day).

Volume Average % Cross - ChartVolume Average Percentage Cross Indicator - Chart
This version is specialized for notifications on your chart. If you wish to see notifications on your volume bars please choose "Volume Average Percentage Cross Indicator - Default".
What is the Volume Average % Cross - Chart Indicator you might ask yourself - what is it for?
I will tell you!
Use Case:
In my Indicator you have an Input to set the period for the volume average period.
Once the volume average period is calculated it is now necessary to choose the percentage value.
What is the percentage value?
The percentage value multiplies the past volume bar with a positive percentage value and a negative percentage value. I give this calculation the name "VolPercentage".
If the volume average is below the negative VolPercentage Value it means that the last volume bar is stronger than the volume average period by the percentage you set the percentage value input at.
If the volume average is above the positive VolPercentage Value it means that the last volume bar is weaker than the volume average period by the percentage you set the percentage value input at.
That means that if for example the percentage value would be 20 it would require the volume average to be 20% above the past volume bar.
That means that if for example the percentage value would be 20 it would require the volume average to be 20% lower than the past volume bar.
Once I uploaded my 100 Indicators I will accurately describe each indicator with videos, this will be huge!
Interpretation:
Volume is the amount of market participants who bought in a candlestick bar a set amount of shares at varying prices from within the bar itself.
If volume decreases it means that there has been fewer market participants and if it increases it means that there is an increase of market participants.
If this is used with candlestick patterns it helps tremendously to identify strong or weak doji candlesticks.

Poor man's volume clustersVolume clusters created from candlestick volumes.
See also "Poor man's volume profile" .
The code is generated using a template. To change the settings, you may need to regenerate the code. The code has a link to the repository with the template.

Volume on bar VSA - signalЭтот индикатор сравнивает объем со средним его значением и обозначает бар в зависимости от того какой хвост на баре, бычий или медвежий.
В настройках можно задать сигнальную линию (чувствительность) для подкрашивания объемов, если он превышает эту линию. (на графике красная линия)
Сигнальная линия задаётся в процентах от среднего объема за указанный период.
Серым цветом показан средний объем.
Google translate.
This indicator compares the volume with its average value and designates a bar depending on which tail on the bar is bullish or bearish.
In the settings, you can set a signal line (sensitivity) for tinting volumes, if it exceeds this line. (red line on the chart)
The signal line is set as a percentage of the average volume for the specified period.
Gray indicates the average volume.

Volume on bar VSA - indicatorЭтот индикатор сравнивает объем со средним его значением и подкрашивает его в зависимости от того какой хвост на баре, бычий или медвежий.
В настройках можно задать сигнальную линию (чувствительность) для подкрашивания объемов, если он превышает эту линию. (на графике красная линия)
Сигнальная линия задаётся в процентах от среднего объема за указанный период.
Серым цветом показан средний объем.
Google translate
This indicator compares the volume with its average value and tints it depending on which tail on the bar is bullish or bearish.
In the settings, you can set a signal line (sensitivity) for tinting volumes, if it exceeds this line. (red line on the chart)
The signal line is set as a percentage of the average volume for the specified period.
Gray indicates the average volume.
