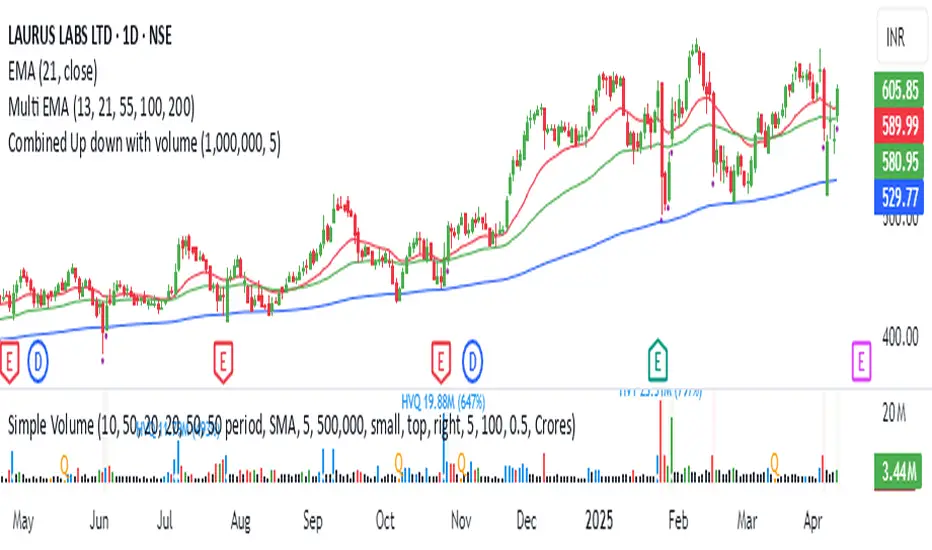
Combined Up down with volumeIndicator Description: "Combined Up/Down with Volume"
This Pine Script indicator combines price momentum and volume spikes to identify potential trend reversals or breakouts. It checks two key conditions:
Price Movement – A minimum percentage change (% check) in closing price.
Volume Spike – Trading volume exceeding a user-defined threshold (Volume above).
How It Works
1. Price Momentum Check
Calculates the 1-period Rate of Change (ROC) of the closing price.
Triggers when the absolute ROC ≥ % check (e.g., 5%).
2. Volume Spike Check
Compares current volume against a threshold (e.g., 1,000,000).
Triggers when volume exceeds this level.
3. Signal Plotting
If use = true:
Plots a purple circle below the bar when both conditions are met.
If use = false:
Plots a circle below the bar for price momentum alone.
Plots a circle (default position) for high volume alone.
Cari dalam skrip untuk "volume"
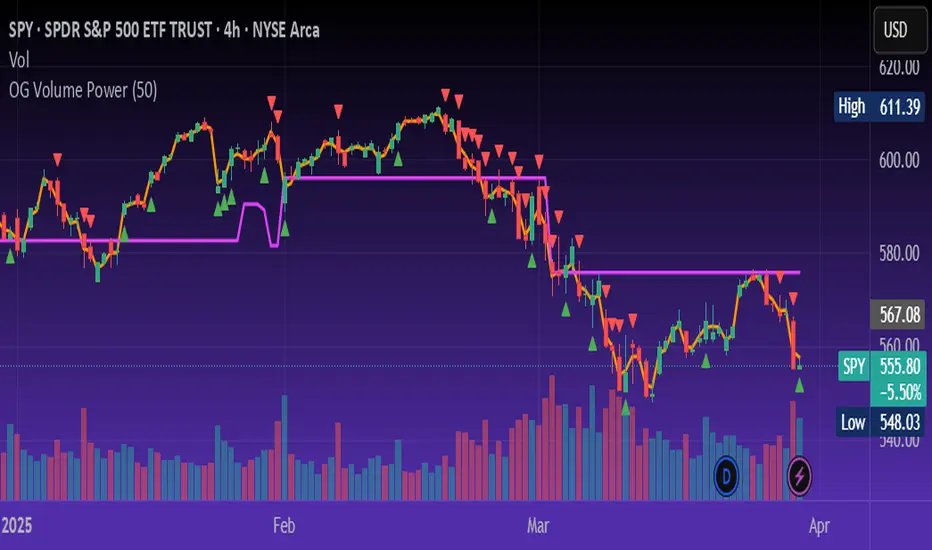
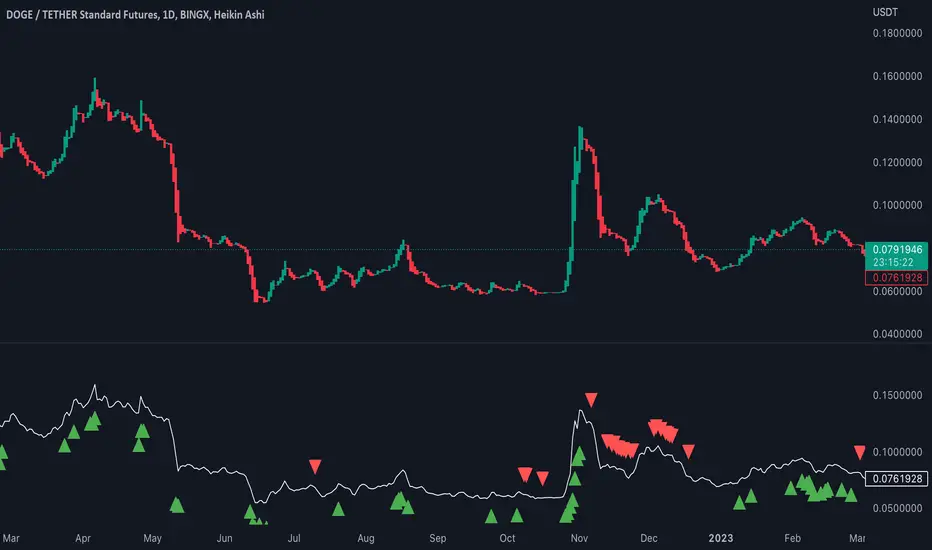
OG Volume PowerDescription:
The OG Volume Power is an elite-level volume analysis suite built for identifying momentum surges, trend continuation, and buyer/seller imbalances at critical price levels. It combines real-time VWAP tracking, a dynamic Point of Control (POC), and volume delta clusters to give traders a complete picture of price and volume interaction.
🔍 Key Features:
Real-Time VWAP:
Tracks volume-weighted average price to identify mean reversion and intraday fair value zones. Ideal for institutional-level entries and exits.
Dynamic POC (Point of Control):
Automatically finds the price level with the highest volume over the last N candles (default 50), helping traders pinpoint where market participants are most committed.
Buyer/Seller Volume Delta Clusters:
Highlights imbalances between buying and selling pressure using bullish and bearish volume deltas that exceed the 20-bar volume average — excellent for momentum detection and early trend recognition.
⚙️ How It Works:
Green triangle: Buyer surge (bullish delta + above average volume)
Red triangle: Seller surge (bearish delta + above average volume)
Magenta line: Dynamic POC (highest volume price over recent candles)
Orange line: VWAP (acts as a magnetic force for price)
📈 Best For:
Intraday scalping or swing trading on SPY, QQQ, BTC, or Forex
Volume flow confirmation before breakout entries
Filtering false breakouts with delta strength signals
🧠 Pro Tip:
Use OG Volume Power alongside your trend indicators (like OG EMA Stack or OG Supertrend) to confirm that volume is backing the move. Look for surges near VWAP or POC zones for sniper-level entries.
Moving Volume DensityMoving Volume Density (MVD) is a custom TradingView indicator written in Pine Script™ (version 6) that blends volume analysis with price range data to offer a unique perspective on market dynamics. By measuring the total volume over a specified period and relating it to the price range during the same interval, this indicator provides valuable insights into the concentration of trading activity relative to price movement.
Key Features:
User-Defined Period: The indicator uses an input period (default 20 bars) to calculate both the total volume and the price range. This flexibility allows you to tailor the analysis to your preferred timeframe.
Volume Calculation: It computes the sum of the volume over the defined period, capturing the cumulative trading activity.
Price Range Determination: The indicator identifies the highest high and the lowest low within the period, calculating the price range (difference between the two). This range serves as the denominator in the density calculation.
Volume Density Computation: Volume Density is derived by dividing the total volume by the price range. This metric reveals how concentrated the volume is within the observed price movement. To prevent division errors, the calculation returns 'NA' when the price range is zero.
Visual Representation: The resulting Volume Density is plotted as a line on a separate sub-window, making it easy to compare with other indicators or overlay your analysis.
「Moving Volume Density (MVD) インジケーター」は、Pine Script™(バージョン6)で作成されたカスタムインジケーターです。出来高の分析と、指定期間内の高値・安値による価格レンジの情報を組み合わせることで、市場のダイナミクスに対する独自の視点を提供します。指定された期間内の合計出来高とその期間内の価格レンジの比率から、価格変動に対する出来高の集中度を示す指標となります。
主な特徴:
ユーザー定義の期間: インジケーターは、入力された期間(デフォルトは20本のバー)を基に、合計出来高と価格レンジ(最高値と最安値の差)の両方を計算します。これにより、ご自身の分析に合わせた柔軟な設定が可能です。
出来高の計算: 指定期間内の全出来高を合計することで、累積的な取引活動を把握します。
価格レンジの算出: 期間内の最高値と最安値を取得し、その差を価格レンジとして算出。このレンジは、出来高密度の計算における分母として使用されます。
出来高密度の計算: 合計出来高を価格レンジで割ることで、出来高がどれだけ価格変動内に集中しているかを示す「出来高密度」を求めます。なお、価格レンジがゼロの場合はゼロ除算を避けるため「NA」を返す設計となっています。
視覚的な表現: 計算結果はサブウィンドウにラインとしてプロットされ、他のインジケーターとの併用や比較が容易に行えます。

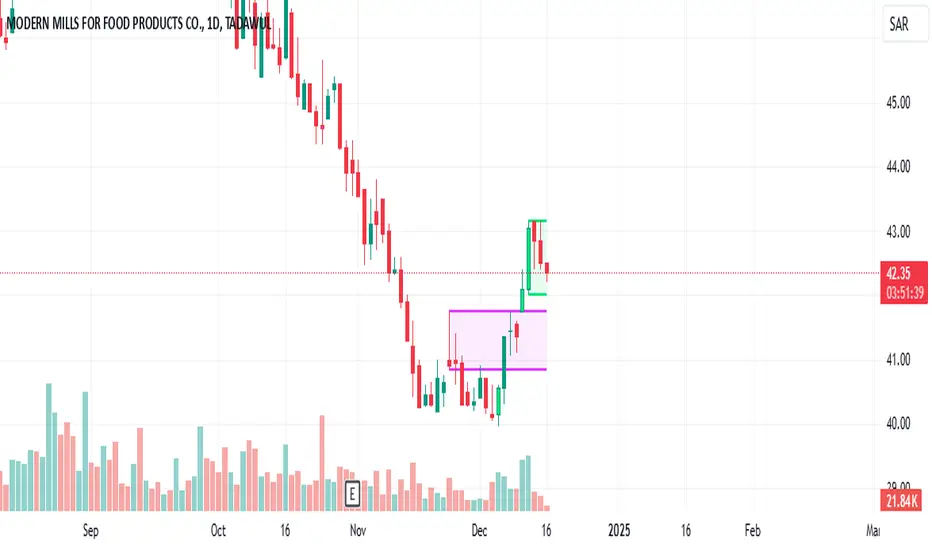
High Volume BarsThis indicator highlights the highest volume bullish and bearish bars within a specified lookback period. It provides a visual representation of significant volume activity, which can be useful for identifying potential trend reversals or continuations.
Key Features:
Customizable lookback period to find highest volume bars
Lime-colored bars for bullish (up) volume
Fuchsia-colored bars for bearish (down) volume
Filled areas between high and low of highest volume bars
Easy-to-read visual cues for volume analysis
The indicator scans the specified number of previous bars to identify the highest volume bullish and bearish bars. It then colors these bars and draws filled areas to make them stand out on the chart. This can help traders quickly spot areas of significant buying or selling pressure.
Use this indicator to:
Identify potential support and resistance levels
Spot volume-based trend reversals
Confirm breakouts or breakdowns
Enhance your volume analysis in conjunction with price action
Adjust the lookback period to fine-tune the indicator's sensitivity to recent volume activity. A longer lookback period will identify more significant volume events, while a shorter period will be more responsive to recent changes.
Note: This indicator is best used in combination with other technical analysis tools and should not be relied upon solely for making trading decisions.
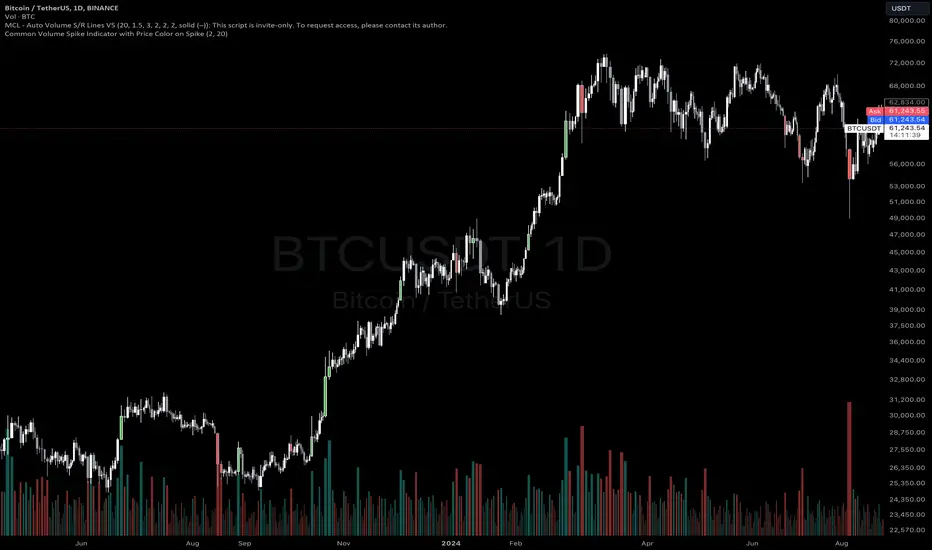
Common Volume Spike Indicator with Price Color on SpikeIndicator Name: Common Volume Spike Indicator with Price Color on Spike
Description:
The “Common Volume Spike Indicator with Price Color on Spike” is designed to detect significant volume spikes and highlight them on the chart. It not only identifies moments when the trading volume exceeds a certain threshold but also colors the price bars based on price movement during these spikes.
Key Features:
• Volume Spike Detection: Detects volume spikes when the current volume exceeds a specified multiple of the average volume over a user-defined lookback period.
• Dynamic Volume Break: Highlights bars where the volume exceeds a threshold, dynamically calculated as a multiple of the average volume (default is 10x the average volume).
• Price Color on Volume Spike: When a volume spike occurs, bars are colored green if the price closes higher than the previous bar, and red if the price closes lower. This feature helps traders easily identify significant price movements during high-volume periods.
• Customizable Parameters:
• Threshold Multiplier: Adjust the sensitivity of volume spike detection.
• Lookback Period: Define the period over which the average volume is calculated.
• Volume Break Multiplier: Set a multiplier for the average volume to identify extreme volume breaks.
This indicator is suitable for traders who want to quickly spot critical market events driven by significant increases in volume. It helps to visualize both the volume activity and the corresponding price movement, providing an additional layer of market insight.
How to Use:
1. Green Bars: When the volume spike condition is met and the price closes higher than the previous bar, the bar is colored green.
2. Red Bars: When the volume spike condition is met and the price closes lower than the previous bar, the bar is colored red.
3. Blue Bars: Indicates a significant volume break, where the current volume exceeds a specified multiple of the average volume (default: 10x).
Ideal for intraday and swing traders who rely on volume and price action for market entries and exits. This indicator works well across different asset classes, including stocks, forex, and cryptocurrencies.
You can adjust the input parameters to fit your specific trading strategy and timeframe.
Disclaimer: This indicator is a tool to help with market analysis and should not be considered financial advice. Always perform your own due diligence before making any trading decisions.
This description outlines the key functionality and how the indicator can benefit traders on TradingView.
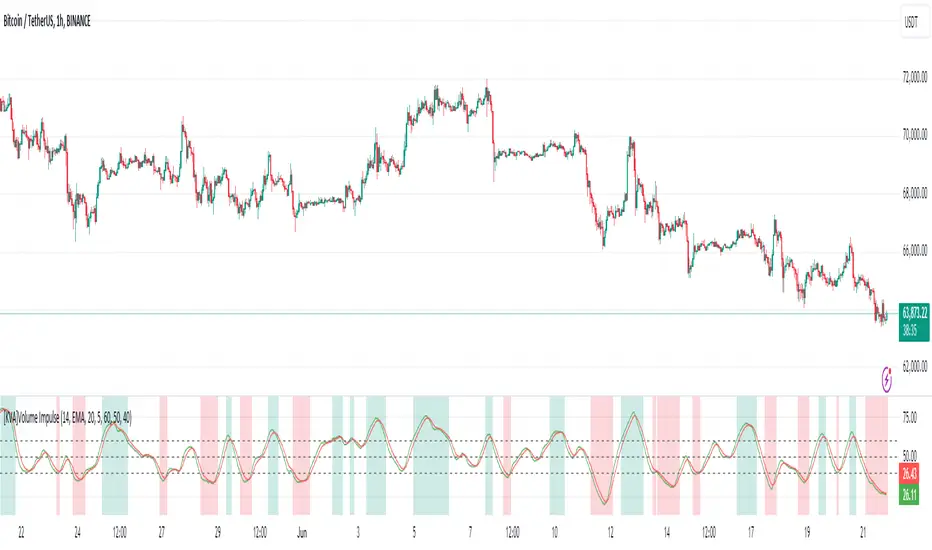
[KVA]Volume ImpulseThe Volume Impulse indicator is designed to provide insights into market momentum by analyzing volume dynamics. It helps traders identify periods of strong buying and selling pressure, which can be crucial for making informed trading decisions.
What does the indicator do?
The Volume Impulse indicator calculates positive and negative volume percentages based on the price range within each bar. It allows traders to visualize the distribution of volume and detect potential shifts in market sentiment.
How does it work?
The indicator uses a customizable lookback period to analyze volume data, smoothing the results with user-defined moving averages. By comparing the positive and negative volume percentages, the indicator highlights overbought and oversold conditions, aiding in trend detection and potential reversal points.
How to use it?
Identify Momentum: Use the positive and negative volume percentages to gauge market momentum within the specified lookback period.
Detect Overbought/Oversold Conditions: Look for the indicator crossing above the overbought level or below the oversold level to identify potential reversal points.
Smooth Trends: Adjust the moving average type and lengths to smooth out the volume data and identify trends more clearly.
Key Features
Volume Analysis: Calculates the positive and negative volume based on the price range within each bar.
Lookback Period: Allows you to define a lookback period over which the indicator calculations are performed, providing flexibility in analyzing different timeframes.
Customizable Moving Averages: Choose from various types of moving averages (EMA, SMA, WMA, Hull) to smooth the volume data.
Overbought/Oversold Levels: Visual markers for overbought, middle, and oversold conditions to help identify potential reversal points.
Color-Coded Areas: Highlights overbought and oversold regions with customizable colors for easy visual interpretation.
Plotting Options: Displays the positive volume and its smoothed version using the selected moving average type and length.
Inputs:
Lookback Period: Define the period over which the volume analysis is performed.
Moving Average Type: Select the type of moving average (EMA, SMA, WMA, Hull) to be applied.
Moving Average Length: Set the length for the primary moving average.
Smooth Length: Define the length for the smoothed moving average.
Overbought Level: Set the threshold for overbought conditions.
Middle Level: Set the threshold for middle conditions.
Oversold Level: Set the threshold for oversold conditions.
Color Settings: Customize the colors for overbought and oversold areas and their respective fill colors.
Significant VolumeSignificant Volume Indicator for Scalpers
This indicator, designed for scalpers, identifies candles with significant volume pressure, aiding in pinpointing optimal entry points for short or long positions. Unlike traditional trend analysis tools, this indicator focuses specifically on volume dynamics to assist traders in identifying ideal trade setups for quick, short-term trades.
**Key Features:**
1. **Volume Analysis:** Utilizes volume data to highlight candles with significant buying or selling pressure.
2. **Moving Average:** Calculates a simple moving average of volume to provide a reference for determining the significance of current volume levels.
3. **Volume Pressure:** Evaluates volume pressure based on the difference between buy and sell pressures over a specified lookback period.
4. **Customizable Parameters:** Allows users to adjust parameters such as SMA period and lookback period to fine-tune the indicator to their trading preferences and strategies.
**Ideal Usage:**
- **Scalping Strategy:** Tailored for traders employing scalping strategies who seek to capitalize on short-term price movements.
- **Entry Point Identification:** Helps traders identify candles with notable volume activity, indicating potential entry points for short or long positions.
- **Volume Confirmation:** Provides additional confirmation for trade setups by highlighting candles with significant volume pressure.
**Disclaimer:** This indicator is designed specifically for scalping purposes and may not be suitable for other trading styles or purposes.

Pressure Volume by MolnarThe Pressure Volume script is a technical indicator that is used to identify buying and selling pressure in a market based on changes in volume. The indicator calculates the average volume over a specified lookback period and then calculates the percentage change in volume for each bar. If the percentage change in volume exceeds a user-defined threshold, then the indicator signals the presence of buying or selling pressure.
To use the script, you simply need to add it to a chart in TradingView. The script allows you to adjust two input parameters: the lookback period and the threshold percentage. The lookback period is the number of bars to use when calculating the average volume, and the threshold percentage is the amount by which the current bar's volume must exceed the average volume in order to trigger a buying or selling pressure signal.
When the script detects buying pressure, it displays a green triangle above the bar, and when it detects selling pressure, it displays a red triangle below the bar. You can adjust the size of the triangles using the "size" input parameter.
It's important to note that the Pressure Volume script is just one tool among many that traders use to analyze the market. It should be used in conjunction with other indicators and analysis techniques to make informed trading decisions.
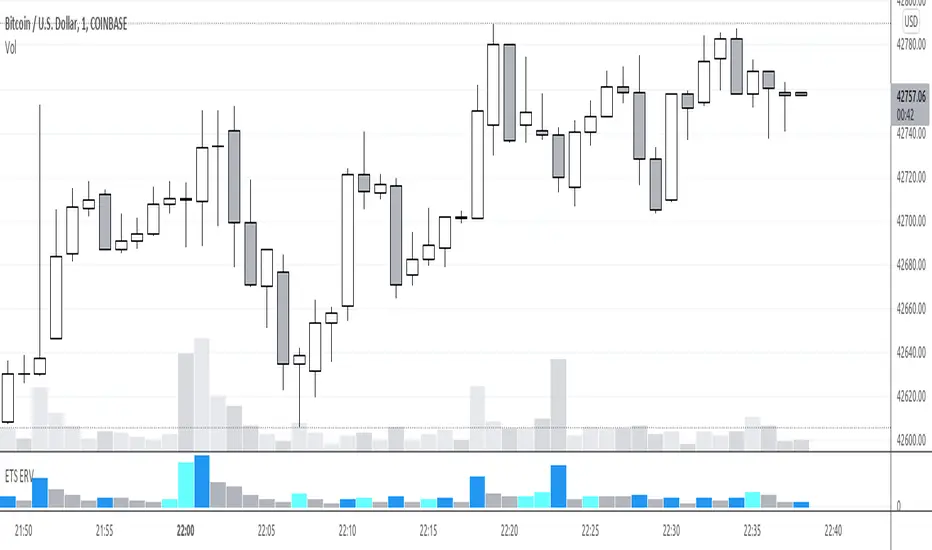
Modified TradingView's Up/Down Volume [vnhilton]
When plotting columns, histograms, etc. You'll notice that the indicator does not stick to the bottom of the pane. To fix this, you need another indicator (we'll call this 'placeholder') in the same pane as this indicator. Pin the placeholder indicator to the left scale, & pin the main indicator to the left scale. Then, pin the placeholder indicator to scale A, & finally the main indictor to the right scale.
Note: On the daily timeframes & higher, the up/down volume isn't accurate. Therefore, I've added a feature where you can toggle on the main indicator to disappear & only show ordinary total volume similar to the TradingView volume indicator.
The original code belongs to TradingView. This is a modified indicator that displays the down volume above the up volume similar to the volume profile. Also includes a moving average using the total volume, & a feature to display ordinary volume to solve the up/down inaccuracies on the daily timeframe & higher.

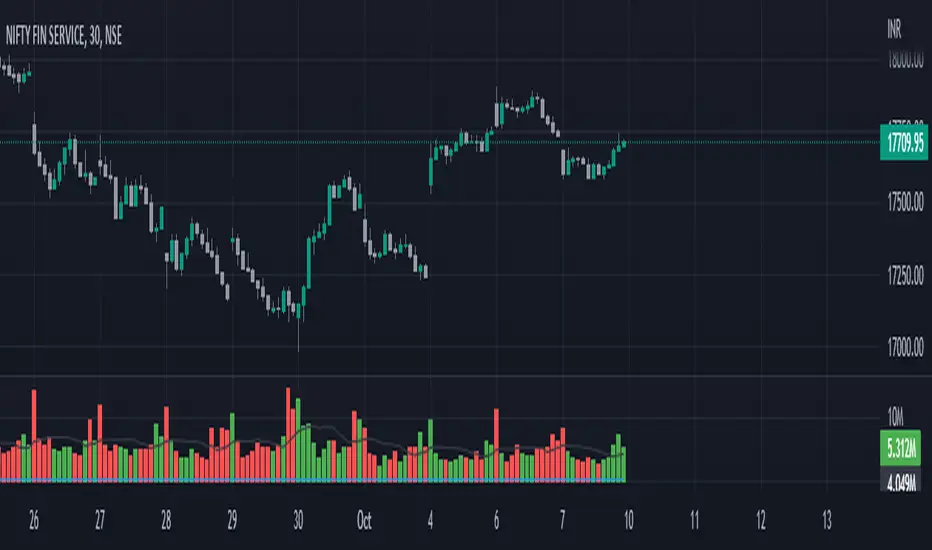
FinNifty VolumesKEY TAKEAWAYS
-Uses FinNifty Index Stocks Volume .
-FinNifty Volume Indicator is created by adding all 20 FinNifty Stocks Volume together.
-FinNifty Volume will be an important indicator in FinNifty Index technical analysis because it is used to measure the relative significance of a market move.
-The higher the volume during a FinNiftyy index price move, the more significant the move and the lower the volume during a FinNifty index price move, the less significant the move.
-Moving Average is also added.
FINRA Daily Short Sale Volume█ OVERVIEW
This indicator displays the Daily Short Sale Volume data reported by FINRA for US Stocks markets, namely NASDAQ, NYSE and NYSE ARCA.
█ CONCEPTS
Daily Short Sale Volume data is different from the bi-monthly Short Interest data also reported by FINRA. Whereas Short Interest represents open positions, Short Sale Volume represents transactions, some of which are executed to offset other trades that will not necessarily result in an open short position reported in Short Interest data. This explains why Short Sale Volume values are always greater than Short Interest ones.
Daily Short Sale Volume provides aggregated volume by security for all short trades executed and reported to FINRA during normal market hours, i.e., media-reported trades. It's important to note that Short Sale Volume is not consolidated with exchange data and excludes trading activity that is not publicly disseminated.
█ HOW TO USE IT
Load the indicator on an active chart (see here if you don't know how).
If the chart's symbol is traded on one of the exchanges for which FINRA provides Daily Short Sale Volume, it will be displayed in columns. The columns are a brighter red when their value is above average.
You can display Short Sale Volume for another symbol by checking the "Other symbol" checkbox of the script settings' "Inputs" tab and selecting the symbol.
The moving average's length is in days, as Short Volume is daily data. You can hide the average in the script's settings "Style" tab.
█ NOTES
You will find more information on the Short Sale Volume Data and Understanding Short Sale Volume Data pages of the FINRA website.
Short Interest data reported by FINRA is not yet available on our platform.
On TradingView, Short Sale Volume data is accessible through tickers using special names. For example, NASDAQ:AAPL's Short Sale Volume data can be loaded on your chart via the FINRA:AAPL_SHORT_VOLUME ticker. The indicator displays the name of the ticker used to fetch data in the bottom left. It can be hidden by unchecking the "Tables" item in the "Style" tab of the script's settings.
Look first. Then leap.

Detailed Volume (DV)Detailed Volume chart
Inspired by UV
Added an option (enabled by default) to show the actual volume in the filler bar. As opposed to showing just the difference of Buy/Sell volume (that is used in UV)
Also there is a Simple Moving Average for volumes

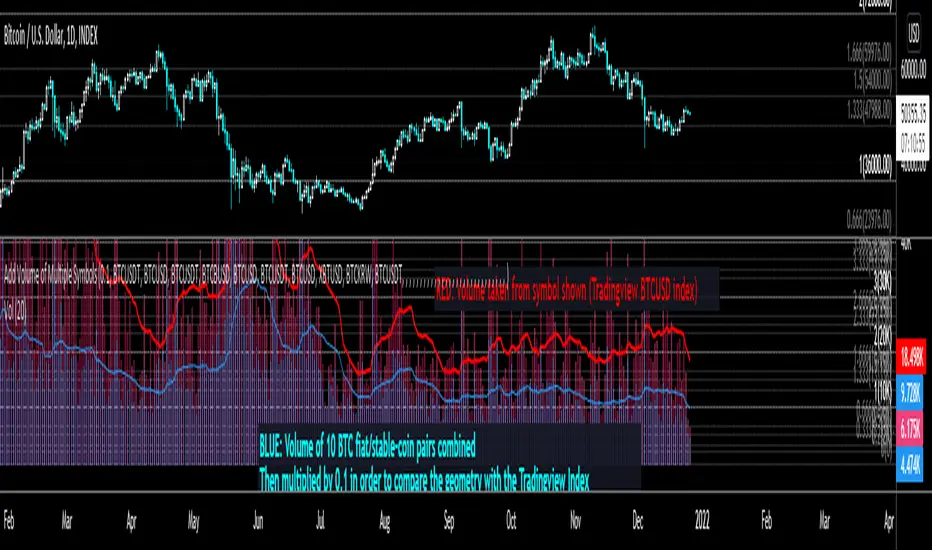
Add Volume of Multiple SecuritiesThis tool can be used in so many ways but the most common use is adding the volume of multiple securities (Up to 39)
This is especially helpful when analyzing cryptocurrency/fiat pairs. The user can create their own custom index; a combination of any symbols they'd like.
It's also nice to see different combinations of volume when dealing with other markets;
Like gold as an example - it would be nice to see different combinations of futures volume or ETF volume layered OR added together in different ways.
There is an option to enable the use of the symbol - you can create a long list of useable symbols, then click through, enabling & disabling different combinations of securities; helps the user find what works best for their methodology.
There is an option to "divbyclose" or "Divide the volume by the closing price"...
You'll notice some exchanges price their volume in USD rather than in number of shares.
This option will divide the amount of volume by the closing price - effectively converts volume priced in USD into volume priced in "shares".
There is also a ratio option - once you have your index setup, you can multiply the total volume by any number, for any reason you would like.
In the shared chart example, I am multiplying the total by 0.1, bringing the volume down one power of 10 so that I can compare my custom index, geometrically, to the index created by Tradingview.
Layered on top of each other, I see some important differences in their shape and relative magnitude when large fluctuations occur.
I am also comparing those levels of volume with levels of price above (within the horizontal price structures shown).
The script can be VERY slow when you have added many securities together so be patient with it once you get about 5-10 securities added together.
Early Relative Volume"Buy or Sell when you see a spike in volume" is advice that you often hear, the problem for me was that you only find out that volume is spiking after the fact. So that's why I created the Early Relative Volume indicator.
The Early Relative Volume indicator takes the amount of time that has passed for the current bar, let's say 10 seconds, and compares the volume of that first 10 seconds to the average volume in 10 seconds of the previous candle.
That means that it will tell you if the volume thus far in the current candle is more or less than the relative volume of the previous candle, so that you can potentially get an indication that the volume of the current candle is going to be greater or less than the previous candle.
This approach is of course not perfect, and obviously the values update as the current candle progresses, but I've found it useful to identify early breakout candles.
There is also an option to do the same calculation with the size of the body of the candle, by enabling the "Blue bars if candle body and volume bigger" option. It will only turn blue of both the volume and the size of the candle's body is calculated to be bigger.
I hope this helps you in your trading!
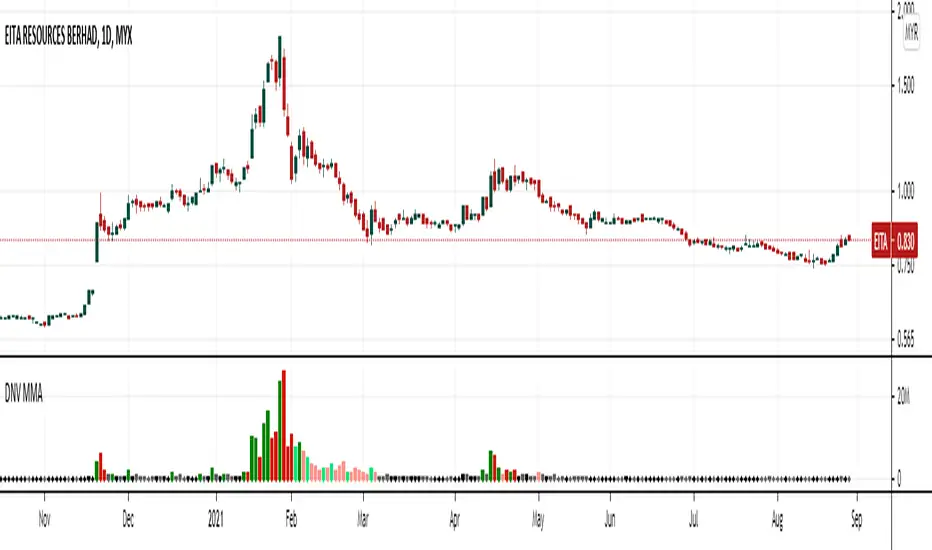
Average Dollar Normalize Volume//-------------------------------------------------------------------------------
//Brief Explanation
//--Instead of using Volume Indicator that show the volume in quantity
//--this indicator will show the volume in dollar transaction
//Indicator Value:
//-- A B C D E
//--
//Formula
//--Average Dollar Normalize Volume = Average Price x Volume
//--ADNV Ratio = ADNV / ADNV Moving Average
//--Volume Ratio = Volume / Volume Moving Average
//Setting Moving Average (used by ADNV MA & Volume MA)
//--Type: SMA : EMA
//--Length: 20 : 1 : 200
//Setting Minimum Dollar Value
//--Value: 1 : 1 : 900
//--Unit: Million : Thousand
// Bar Color Setting
//--Grow above ADNVMA : Dark Green
//--Grow but below ADNVMA: Light Green
//--Fall and above ADNVMA: Dark Red
//--Fall but below ADNVMA: Light Red
//--Grow but less than Minimum Dollar Value: Dark Black
//--Fall but less than Minimum Dollar Value: Grey
//-------------------------------------------------------------------------------
Realtime Delta Volume Action [LucF]█ OVERVIEW
This indicator displays on-chart, realtime, delta volume and delta ticks information for each bar. It aims to provide traders who trade price action on small timeframes with volume and tick information gathered as updates come in the chart's feed. It builds its own candles, which are optimized to display volume delta information. It only works in realtime.
█ WARNING
This script is intended for traders who can already profitably trade discretionary on small timeframes. The high cost in fees and the excitement of trading at small timeframes have ruined many newcomers to trading. While trading at small timeframes can work magic for adrenaline junkies in search of thrills rather than profits, I DO NOT recommend it to most traders. Only seasoned discretionary traders able to factor in the relatively high cost of such a trading practice can ever hope to take money out of markets in that type of environment, and I would venture they account for an infinitesimal percentage of traders. If you are a newcomer to trading, AVOID THIS TOOL AT ALL COSTS — unless you are interested in experimenting with the interpretation of volume delta combined with price action. No tool currently available on TradingView provides this type of close monitoring of volume delta information, but if you are not already trading small timeframes profitably, please do not let yourself become convinced that it is the missing piece you needed. Avoid becoming a sucker who only contributes by providing liquidity to markets.
The information calculated by the indicator cannot be saved on charts, nor can it be recalculated from historical bars.
If you refresh the chart or restart the script, the accumulated information will be lost.
█ FEATURES
Key values
The script displays the following key values:
• Above the bar: ticks delta (DT), the total ticks for the bar, the percentage of total ticks that DT represents (DT%)
• Below the bar: volume delta (DV), the total volume for the bar, the percentage of total volume that DV represents (DV%).
Candles
Candles are composed of four components:
1. A top shaped like this: ┴, and a bottom shaped like this: ┬ (picture a normal Japanese candle without a body outline; the values used are the same).
2. The candle bodies are filled with the bull/bear color representing the polarity of DV. The intensity of the body's color is determined by the DV% value.
When DV% is 100, the intensity of the fill is brightest. This plays well in interpreting the body colors, as the smaller, less significant DV% values will produce less vivid colors.
3. The bright-colored borders of the candle bodies occur on "strong bars", i.e., bars meeting the criteria selected in the script's inputs, which you can configure.
4. The POC line is a small horizontal line that appears to the left of the candle. It is the volume-weighted average of all price updates during the bar.
Calculations
This script monitors each realtime update of the chart's feed. It first determines if price has moved up or down since the last update. The polarity of the price change, in turn, determines the polarity of the volume and tick for that specific update. If price does not move between consecutive updates, then the last known polarity is used. Using this method, we can calculate a running volume delta and ticks delta for the bar, which becomes the bar's final delta values when the bar closes (you can inspect values of elapsed realtime bars in the Data Window or the indicator's values). Note that these values will all reset if the script re-executes because of a change in inputs or a chart refresh.
While this method of calculating is not perfect, it is by far the most precise way of calculating volume delta available on TradingView at the moment. Calculating more precise results would require scripts to have access to tick data from any chart timeframe. Charts at seconds timeframes do use exchange/broker ticks when the feeds you are using allow for it, and this indicator will run on them, but tick data is not yet available from higher timeframes. Also, note that the method used in this script is far superior to the intrabar inspection technique used on historical bars in my other "Delta Volume" indicators. This is because volume and ticks delta here are calculated from many more realtime updates than the available intrabars in history. Unfortunately, the calculation method used here cannot be used on historical bars, where intrabar inspection remains, in my opinion, the optimal method.
Inputs
The script's inputs provide many ways to personalize all the components: what is displayed, the colors used to display the information, and the marker conditions. Tooltips provide details for many of the inputs; I leave their exploration to you.
Markers
Markers provide a way for you to identify the points of interest of your choice on the chart. You control the set of conditions that trigger each of the five available markers.
You select conditions by entering, in the field for each marker, the number of each condition you want to include, separated by a comma. The conditions are:
1 — The bar's polarity is up/dn.
2 — `close` rises/falls ("rises" means it is higher than its value on the previous bar).
3 — DV's polarity is +/–.
4 — DV% rises (↕).
5 — POC rises/falls.
6 — The quantity of realtime updates rises (↕).
7 — DV > limit (You specify the limit in the inputs. Since DV can be +/–, DV– must be less than `–limit` for a short marker).
8 — DV% > limit (↕).
9 — DV+ rises for a long marker, DV– falls for a short.
10 — Consecutive DV+/DV– on two bars.
11 — Total volume rises (↕).
12 — DT's polarity is +/–.
13 — DT% rises (↕).
14 — DT+ rises for a long marker, DT– falls for a short.
Conditions showing the (↕) symbol do not have symmetrical states; they act more like filters. If you only include condition 4 in a marker's setup, for example, both long and short markers will trigger on bars where DV% rises. To trigger only long or short markers, you must add a condition providing directional differentiation, such as conditions 1 or 2. Accordingly, you would enter "1,4" or "2,4".
For a marker to trigger, ALL the conditions you specified for it must be met. Long markers appear on the chart as "Mx▲" signs under the values displayed below candles. Short markers display "Mx▼" over the number of updates displayed above candles. The marker's number will replace the "x" in "Mx▲". The script loads with five markers that will not trigger because no conditions are associated with them. To activate markers, you will need to select and enter the set of conditions you require for each one.
Alerts
You can configure alerts on this script. They will trigger whenever one of the configured markers triggers. Alerts do not repaint, so they trigger at the bar's close—which is also when the markers will appear.
█ HOW TO USE IT
As a rule, I do not prescribe expected use of my indicators, as traders have proved to be much more creative than me in using them. Additionally, I tend to think that if you expect detailed recommendations from me to be able to use my indicators, it's a sign you are in a precarious situation and should go back to the drawing board and master the necessary basics that will allow you to explore and decide for yourself if my indicators can be useful to you, and how you will use them. I will make an exception for this thing, as it presents fairly novel information. I will use simple logic to surmise potential uses, as contrary to most of my other indicators, I have NOT used this one to actually trade. Markets have a way of throwing wrenches in our seemingly bullet-proof rationalizing, so drive cautiously and please forgive me if the pointers I share here don't pan out.
The first thing to do is to disable your normal bars. You can do this by clicking on the eye icon that appears when you hover over the symbol's name in the upper-left corner of your chart.
The absolute value and polarity of DV mean little without perspective; that's why I include both total volume for the bar and the percentage that DV represents of that total volume. I interpret a low DV% value as indecision. If you share that opinion, you could, let's say, configure one of the markers on "DV% > 80%", for example (to do so you would enter "8" in the condition field of any marker, and "80" in the limit field for condition 8, below the marker conditions).
I also like to analyze price action on the bar with DV%. Small DV% values should often produce small candle bodies. If a small DV% value occurs on a bar with much movement and high volume, I'm thinking "tough battle with potential explosive power when one side wins". Conversely, large bodies with high DV% mean that large volume is breaching through multiple levels, or that nobody is suddenly willing to take the other side of a normal volume of trades.
I find the POC lines really interesting. First, they tell us the price point where the most significant action (taking into account both price occurrences AND volume) during the bar occurred. Second, they can be useful when compared against past values. Third, their color helps us in figuring out which ones are the most significant. Unsurprisingly, bunches of orange POCs tend to appear in consolidation zones, in pauses, and before reversals. It may be useful to often focus more on POC progression than on `close` values. This is not to say that OHLC values are not useful; looking, as is customary, for higher highs or lower lows, or for repeated tests of precise levels can of course still be useful. I do like how POCs add another dimension to chart readings.
What should you do with the ticks delta above bars? Old-time ticker tape readers paid attention to the sounds coming from it (the "ticker" moniker actually comes from the sound they made). They knew activity was picking up when the frequency of the "ticks" increased. My thinking is that the total number of ticks will help you in the same way, since increasing updates usually mean growing interest—and thus perhaps price movement, as increasing volatility or volume would lead us to surmise. Ticks delta can help you figure out when proportionally large, random orders come in from traders with other perspectives than the short-term price action you are typically working with when you use this tool. Just as volume delta, ticks delta are one more informational component that can help you confirm convergence when building your opinions on price action.
What are strong bars? They are an attempt to identify significance. They are like a default marker, except that instead of displaying "Mx▲/▼" below/above the bar, the candle's body is outlined in bright bull/bear color when one is detected. Strong bars require a respectable amount of conditions to be met (you can see and re-configure them in the inputs). Think of them as pushes rather than indications of an upcoming, strong and multi-bar move. Pushes do, for sure, often occur at the beginning of strong trends. You will often see a few strong bars occur at 2-3 bar intervals at the beginning or middle of trends. But they also tend to occur at tops/bottoms, which makes their interpretation problematic. Another pattern that you will see quite frequently is a final strong bar in the direction of the trend, followed a few bars later by another strong bar in the reverse direction. My summary analyses seemed to indicate these were perhaps good points where one could make a bet on an early, risky reversal entry.
The last piece of information displayed by the indicator is the color of the candle bodies. Three possible colors are used. Bull/bear is determined by the polarity of DV, but only when the bar's polarity matches that of DV. When it doesn't, the color is the divergence color (orange, by default). Whichever color is used for the body, its intensity is determined by the DV% value. Maximum intensity occurs when DV%=100, so the more significant DV% values generate more noticeable colors. Body colors can be useful when looking to confirm the convergence of other components. The visual effect this creates hopefully makes it easier to detect patterns on the chart.
One obvious methodology that comes to mind to trade with this tool would be to use another indicator like Technical Ratings at a higher timeframe to identify the larger context's trend, and then use this tool to identify entries for short-term trades in that direction.
█ NOTES AND RAMBLINGS
Instant Calculations
This indicator uses instant values calculated on the bar only. No moving averages or calculations involving historical periods are used. The only exception to this rule is in some of the marker conditions like "Two consecutive DV+ values", where information from the previous bar is used.
Trading Small vs Long Timeframes
I never trade discretionary at the 5sec–5min timeframes this indicator was designed to be used with; I trade discretionary at 1D, 1W and 1M timeframes, and let systems trade at smaller timeframes. The higher the timeframe you trade at, the fewer fees you will pay because you trade less and are not churning trading volume, as is inevitable at smaller timeframes. Trading at higher timeframes is also a good way to gain an instant edge on most of the trading crowd that has its nose to the ground and often tends to forget the big picture. It also makes for a much less demanding trading practice, where you have lots of time to research and build your long-term opinions on potential future outcomes. While the future is always uncertain, I believe trades riding on long-term trends have stronger underlying support from the reality outside markets.
To traders who will ask why I publish an indicator designed for small timeframes, let me say that my main purpose here is to showcase what can be done with Pine. I often see comments by coders who are obviously not aware of what Pine is capable of in 2021. Since its humble beginnings seven years ago, Pine has grown and become a serious programming language. TradingView's growing popularity and its ongoing commitment to keep Pine accessible to newcomers to programming is gradually making Pine more and more of a standard in indicator and strategy programming. The technical barriers to entry for traders interested in owning their trading practice by developing their personal tools to trade have never been so low. I am also publishing this script because I value volume delta information, and I present here what I think is an original way of analyzing it.
Performance
The script puts a heavy load on the Pine runtime and the charting engine. After running the script for a while, you will often notice your chart becoming less responsive, and your chart tab can take longer to activate when you go back to it after using other tabs. That is the reason I encourage you to set the number of historical values displayed on bars to the minimum that meets your needs. When your chart becomes less responsive because the script has been running on it for many hours, refreshing the browser tab will restart everything and bring the chart's speed back up. You will then lose the information displayed on elapsed bars.
Neutral Volume
This script represents a departure from the way I have previously calculated volume delta in my scripts. I used the notion of "neutral volume" when inspecting intrabar timeframes, for bars where price did not move. No longer. While this had little impact when using intrabar inspection because the minimum usable timeframe was 1min (where bars with zero movement are relatively infrequent), a more precise way was required to handle realtime updates, where multiple consecutive prices often have the same value. This will usually happen whenever orders are unable to move across the bid/ask levels, either because of slow action or because a large-volume bid/ask level is taking time to breach. In either case, the proper way to calculate the polarity of volume delta for those updates is to use the last known polarity, which is how I calculate now.
The Order Book
Without access to the order book's levels (the depth of market), we are limited to analyzing transactions that come in the TradingView feed for the chart. That does not mean the volume delta information calculated this way is irrelevant; on the contrary, much of the information calculated here is not available in trading consoles supplied by exchanges/brokers. Yet it's important to realize that without access to the order book, you are forfeiting the valuable information that can be gleaned from it. The order book's levels are always in movement, of course, and some of the information they contain is mere posturing, i.e., attempts to influence the behavior of other players in the market by traders/systems who will often remove their orders when price comes near their order levels. Nonetheless, the order book is an essential tool for serious traders operating at intraday timeframes. It can be used to time entries/exits, to explain the causes of particular price movements, to determine optimal stop levels, to get to know the traders/systems you are betting against (they tend to exhibit behavioral patterns only recognizable through the order book), etc. This tool in no way makes the order book less useful; I encourage all intraday traders to become familiar with it and avoid trading without one.

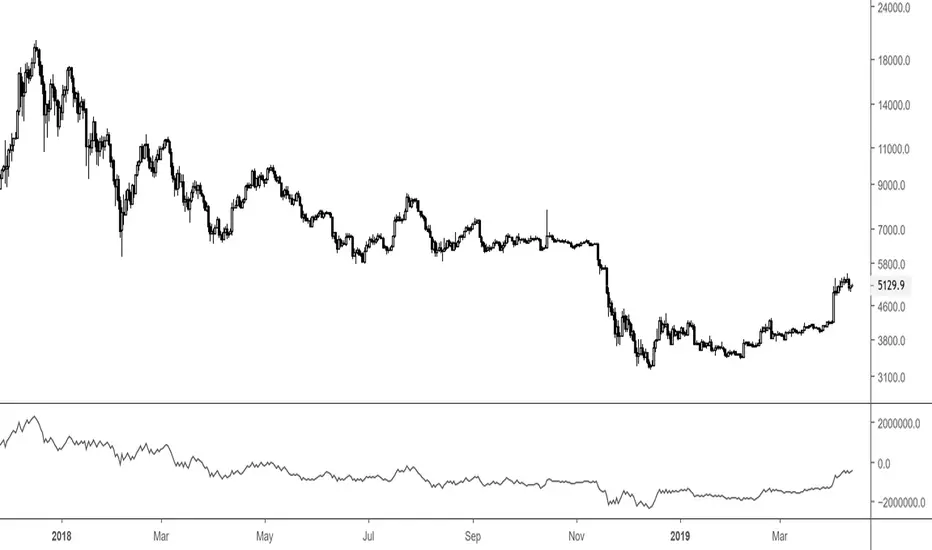
Big 9 Real volume exchanges - On Balance VolumeHere is an On Balance Volume indicator using only volume data from the 9 biggest exchanges trading BTC/USD or BTC/USDT. These 9 exchanges were chosen based on the report by Bitwise Invest stating that 95% of the volume on CoinMarketCap is fake. On these 9 exchanges, however, volume data appears to be reliable. Please note BitFlyer was not included because it does not trade in USD. Please note also that data on all 9 exchanges is only available from August 2017. A separate volume indicator indicator is available at
Anyone is welcome to share and modify.
- stargazer
Color Bars VolumeThe bars are colored exclusively according to volume average:
Ultra high Volume = Volume > Mean Volume * 3.5;
Very high Volume = Volume > (Mean Volume * 2.5) and Volume <= (Mean Volume * 3.5);
High Volume = Volume > (Mean Volume * 1.5) and Volume <= (Mean Volume *2.5);
Medium Volume = Volume > (Mean Volume * 0.5) and volume <= (Mean Volume *1.5);
Low Volume = (Volume > (Mean Volume * 0.5).

BTC Volume Index [v2018-11-21] @ LekkerCryptisch.nlIndicates the volume trend:
~50 = short term volume is the same as long term volume
> 50 = short term volume is higher than long term volume (i.e. trend is rising volume)
< 50 = short term volume is lower than long term volume (i.e. trend is declining volume)


Premarket&Regular Session VolumeThis script provides a clean and practical overview of premarket cumulative volume compared with regular session volume, helping traders instantly identify unusual early-session liquidity.
Features
Tracks total premarket volume from 4:00–9:30 ET
Shows cumulative premarket buildup as a smooth line
Helps detect early liquidity spikes that often lead to halts, gap-ups or momentum runs
Designed for intraday scalpers and small-cap/momentum traders
Why It’s Useful
Premarket activity frequently reveals hidden demand long before the opening bell.
When premarket volume significantly exceeds average daily levels, the probability of early spikes, volatility events, or continuation moves increases.
This indicator offers a simple but powerful visual tool for evaluating market interest before the open and comparing it with regular session volume

Buy vs Sell Volume EMA + Smart Momentum Shift (Crypto)This is a volume-based momentum indicator for crypto that:
Splits total volume into buy vs. sell volume based on candle direction.
Applies EMAs to buy/sell volume and tracks slope and acceleration of those EMAs.
Looks for moments where buyer volume momentum is improving and seller momentum is fading.
Optionally requires RSI and/or MACD confirmation, a “near recent low” location filter, and a score threshold based on several micro-conditions.
Outputs:
Colored background depending on whether buy or sell volume dominates.
EMA crossover arrows (“Buy” and “Sell”) for simpler regime shifts.
Green dots (“Strong Buy Momentum Shift”) when all filters are satisfied.
Alert conditions for the above signals.
It runs in a separate pane (overlay=false) and is explicitly designed for crypto, but works on any symbol/interval.

Regular Volume Indicator with 30-Day Average PointsRegular Volume Indicator with past 30-days average lines.
If the day's trading volume is more than that, it will have a dot pop out.
