Truncate Volume SpikesTruncates or caps the height of the volume bar. Many times, there is a day where the volume eclipses the recent volume and makes the rest of the volume compressed and difficult to see.
This script cuts off the volume at a user defined multiple of average daily volume and places a label above and to the left showing the true volume.
My one gripe is that it doesn't yet handle overlapping labels. At some point, I will see if I can fix that.
Cari dalam skrip untuk "volume"
Forex Multi Exchange VolumeHi traders! Forex Multi Exchange Volume (FMEV) aggregates and plots trading volumes for supported forex pairs over multiple different major forex exchanges.
Supported exchanges
- FXCM
- OANDA
- FOREX.COM
- PEPPERSTONE
- GLOBALPRIME
Limitations
Because of the fact that FMEV is pulling data from from multiple different exchanges and is computationally intensive it can take a couple of seconds to load while charting certain forex pairs.

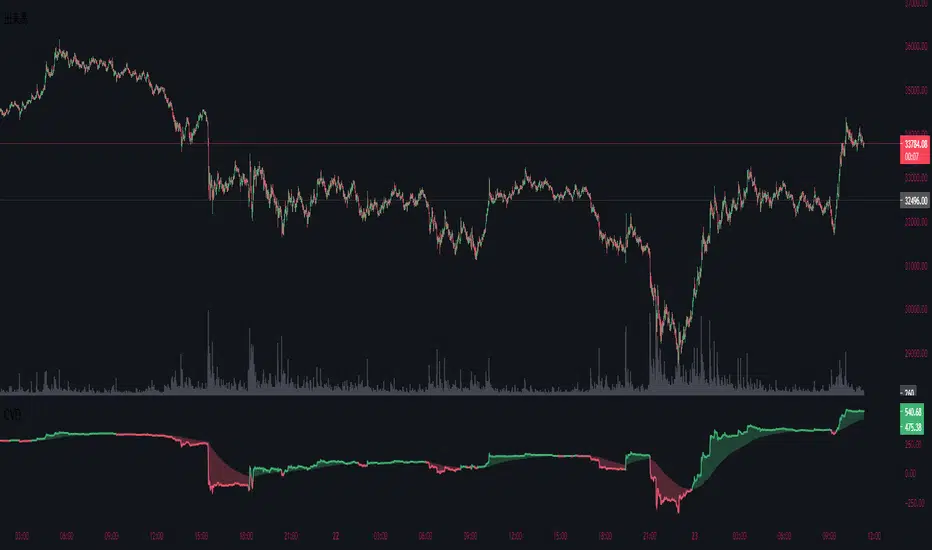
Cumulative Volume DeltaThis indicator is called Cumulative Volume Delta (CVD), and it is the cumulative difference between buying and selling pressure.
Note, however, that it is not an exact CVD, because Pine Script does not allow you to get the Bid Volume and Ask Volume.
Instead, it uses volume and candlestick length to determine the pressure.
Example: Volume is 100, price change is +1.0% → Buying pressure is 1
Volume is 100, price change is -0.5% → Selling pressure is 0.5
このインジケーターは、Cumulative Volume Delta(CVD)と呼ばれるもので、買い圧力と売り圧力の差を累積したものです。
しかし、Pine Scriptでは買い圧力と売り圧力(Bid VolumeとAsk Volume)を取得することはできないため、正確なCVDではないことに注意してください。
代わりに出来高とローソク足の長さで圧力を判断判断しています。
例:出来高が100、価格の変動が+1.0% → 買い圧力は1
出来高が100、価格の変動が-0.5% → 売り圧力は0.5
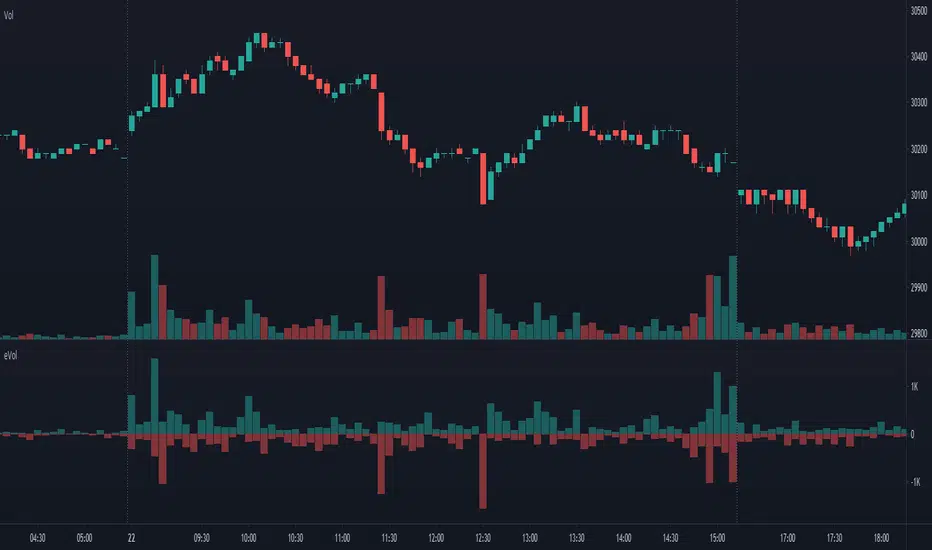
Estimated Up Down VolumeThis indicator plot estimated Up volume and Down volume.
Adjust colors to the default volume indicator.
Performante's Average Ethereum Volume IndicatorPerformante's Ethereum Volume Indicator takes the volume from the biggest exchanges and plots the average volume.

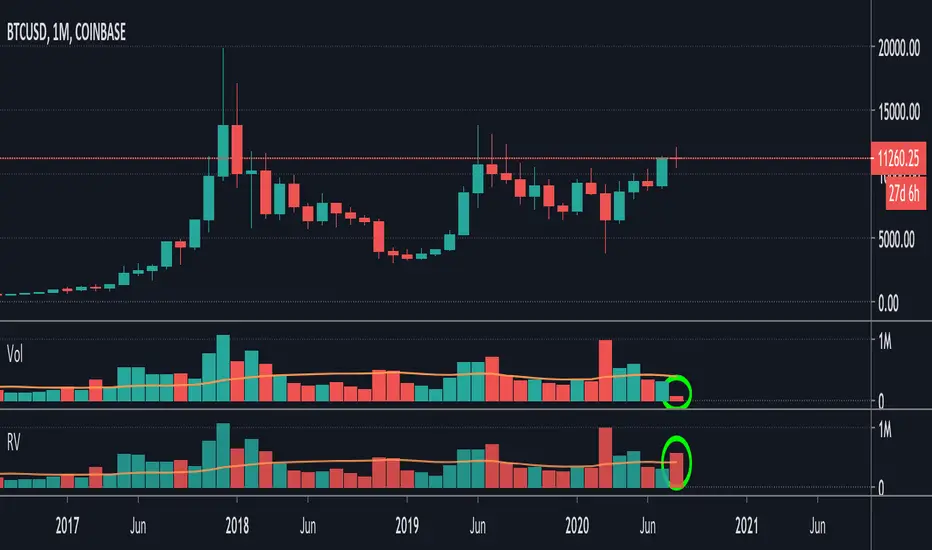
Relative VolumeIt is difficult to know how much volume is going on DURING the last bar,
therefore this "Relative Volume" (RV) script, previous bars are as usual, but the last one
adjusts the measured volume by comparing how much time passed and multiplying
this with the volume.
Examples:
Here (5 minute bar) there are 31 sec passed of the 5 minutes
The standard volume show little volume (since there is only 31s passed)
The "RV" multiplies this so you'll see how much this volume would be over 5 minutes,
IF everything goes the same for the rest of the 5'.
1' 5sec passed:
(so relatively more volume)
3' 4sec passed:
(With about 2' to go, you see there is a lot going on with the volime,
while seeing the standard volume, nothing much...)
Little 4' passed:
4,5':
Almost 5' gone:
Important:
This "RV" volume can diminish when during the bar the volume fades.
I think this can help evaluating the volume during the last bar
W example:
M example:
(You can clearly see that during the first 4 days there is a lot going on!)
Investonomer - BS VolumeBuy Sell Volume Indicator is a free indicator which can be used with any instrument (stock, index or CFD) where volume information is available on TradingView.This indicator shows us a volume based view of the market activity and it helps us distiguish whether buyer are aggressive or sellers are. Basically, this indicator plots first plots the buyer volume in green. Then the seller volume is printed in red.
If Sellers are more, you will red only, whereas if buyers are more, you will selling volumes and then extra green over it which shows how many buyers are there in the market.

Performante's Average Bitcoin Volume IndicatorPerformante's Bitcoin Volume Indicator takes the volume from the biggest exchanges and plots the average volume.
Happy Trading!

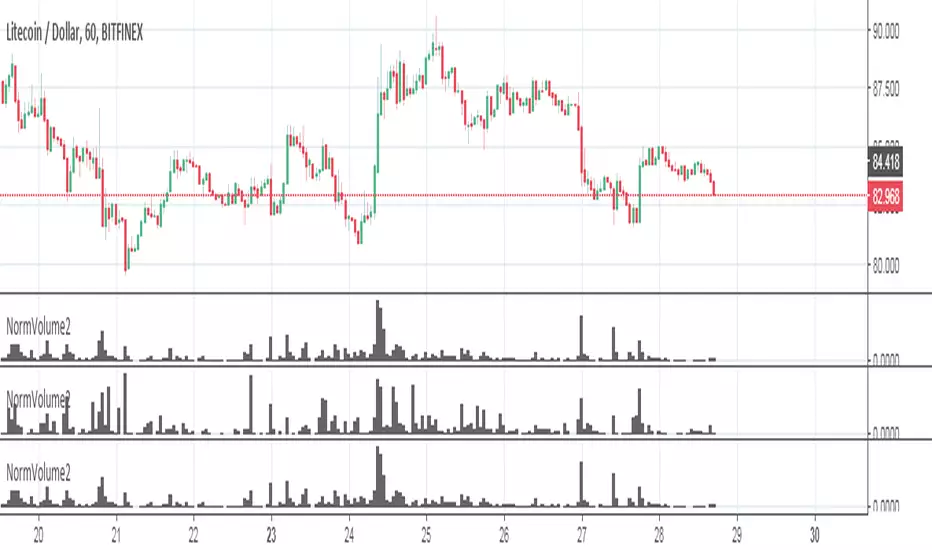
BBP (Bittex, Poloniex, Bitfinex) + standart volumeThe script wrote for pairs of crypto currency with XXX USD. On others it does not work. By and large, it is suitable only for analysis of TOP coins.
What it consists of:
The script pulls volumes from exchanges: Bitfinex, Bittrex, Poloniex + the volume of the coin itself through the dollar indicator normalized.
Based on the volume from the indicator "dollar normalized volume"
Works with pairs XXX USD (do not confuse with USDT)
Custom Monthly Volume Profile [Multi-Timeframe]This indicator renders a high-precision Monthly Volume Profile designed for intraday traders and practitioners of Auction Market Theory. Unlike standard volume profiles, this script utilizes Multi-Timeframe (MTF) data request capability to build the profile from lower timeframe data (e.g., 5-minute bars) while displaying it on your trading timeframe.
This tool is optimized to keep your chart clean while providing critical developing levels (POC, VAH, VAL) and historical context from the previous month.
Key Features:
1. Dynamic "Auto-Scaling" Width One of the biggest issues with monthly profiles is visual clutter.
Early Month: The profile starts wide (default 10% width) so you can clearly see the developing structure when data is scarce.
Late Month: As volume accumulates, the profile automatically shrinks (scales down to 2% width) to prevent the histogram from obscuring price action.
Note: This can be toggled off for a static width.
2. Developing & Static Levels
Current Month: Displays real-time Developing Point of Control (dPOC), Value Area High (dVAH), and Value Area Low (dVAL).
Previous Month: Automatically locks in the levels from the previous month at the close, providing immediate support/resistance references for the new month.
3. Time-Filtered Alerts Avoid waking up to notifications during low-volume overnight sessions. This script includes a Session Filter (Default: 0830-1500).
Alerts for crossing POC, VAH, or VAL will only trigger if the price cross occurs within the user-defined time window.
4. Calculation Precision
Multi-Timeframe Data: The profile is built using lower timeframe data (Input: Calculation Precision) rather than just the current chart bars. This ensures the Volume Profile shape remains accurate even when viewing higher timeframes.
Row Size: Fully adjustable "Tick/Row Size" to control the resolution of the volume buckets.
Settings Overview:
Calculation Precision: Determine the granularity of the data (e.g., "5" for 5-minute data).
Row Size: Controls vertical resolution (Lower = higher detail).
Value Area %: Standard 70% default, fully adjustable.
Auto-Width: Set the Start % (Day 1) and End % (Day 31).
Alerts: Toggle Current or Previous month alerts and define the active time session.
Visual Customization:
Customize colors for the Histogram (Value Area vs. Outer Area).
Customize line width and colors for POC, VAH, and VAL.
Supports Right or Left alignment.
Disclaimer: This tool is for informational purposes only. Past performance and volume levels do not guarantee future price action.

Weekly Volume USDT## Description
This Pine Script indicator displays the trading volume for each day of the current week (Monday through Sunday) in a clean table format on your TradingView chart. The volume is calculated in USDT equivalent and displayed in the top-right corner of the chart.
## Features
- **Weekly Volume Breakdown**: Shows individual daily volumes from Monday to Sunday
- **USDT Conversion**: Automatically converts volume to USDT using the average price (open + close / 2)
- **Smart Formatting**:
- Large numbers are formatted with K (thousands) and M (millions) suffixes
- Example: 1,234,567 → 1.23M USDT
- **Clean Table Display**: Fixed position table in the top-right corner
- **Current Week Focus**: Displays volumes for the current week only
- **Future Days Handling**: Days that haven't occurred yet in the current week show as "-"
## How It Works
1. The indicator calculates the average price for each day using (Open + Close) / 2
2. Multiplies the daily volume by the average price to get USDT-equivalent volume
3. Displays the results in an easy-to-read table format
## Use Cases
- **Volume Analysis**: Quickly identify which days of the week have the highest trading activity
- **Pattern Recognition**: Spot weekly volume patterns and trends
- **Trading Decisions**: Use volume information to inform your trading strategies
- **Market Activity Monitoring**: Keep track of market participation throughout the week
## Installation
Simply add this indicator to your TradingView chart and it will automatically display the weekly volume table in the top-right corner.
## Tags
#volume #weekly #USDT #table #analysis #trading #cryptocurrency

Noro's Multi-exchange VolumeThe sum of volumes (5 different exchanges) at the same time. The exchanges can be chosen. Less than five exchanges are possible. For this purpose it is necessary to erase the text in the field.

5 min volume scalperThis scalper try to do it by volumes
The exit either by take profit or the signals, make the TP fit for your need so you will get better exit points
the len control the length so higher will be less signals lower is more
alerts inside
you free to change this code and do what ever you want with it
I hope you can make it better:)

BTC Combined VolumeI edited an existing script to include Bitmex volume. I'm no expert at this but I hope it works!
Cheers,
G

Candle Color Volumescript baseado na alteração das cores do candle conforme o volume de trocas.
script based on changing the colors of the candle according to the volume.

On Balance Volume [BrightSideTrading]
# On Balance Volume - Complete User Guide
## Overview
This enhanced OBV indicator provides clean, actionable volume analysis with intelligent signal filtering. It combines On-Balance Volume (OBV) with a smoothed signal line to identify shifts in buying and selling pressure without chart clutter.
**Key Features:**
- Real-time OBV and signal line visualization
- Smart crossover detection with confirmation filtering
- Z-Score momentum analysis
- Customizable signal alerts with V-shaped markers
- Window-normalized option for detrended analysis
---
## What is On-Balance Volume (OBV)?
OBV is a volume-based momentum indicator that accumulates volume on up days and subtracts volume on down days. It answers a fundamental question: **Is volume flowing in (buying) or out (selling)?**
**Formula:**
- If Close > Previous Close: OBV = Previous OBV + Volume
- If Close < Previous Close: OBV = Previous OBV - Volume
- If Close = Previous Close: OBV = Previous OBV (unchanged)
**What it tells you:**
- **Rising OBV** = Accumulation (smart money buying)
- **Falling OBV** = Distribution (smart money selling)
- **OBV above zero line** = Net positive buying pressure
- **OBV below zero line** = Net negative selling pressure
---
## Interface & Settings
### **MAIN VISUALIZATION**
**OBV Line (Green/Red Ribbon)**
- Green when OBV is above the signal line (bullish trend)
- Red when OBV is below the signal line (bearish trend)
- Toggles between window-normalized (detrended) and raw values
**Signal Line (Orange)**
- Smoothed average of OBV
- Crossovers with OBV generate buy/sell signals
- Default: 21-period SMA
**V-Shaped Markers**
- Green upward V = Bullish crossover (buy signal)
- Red downward V = Bearish crossover (sell signal)
- Appears at the OBV value when signal is triggered
**Zero Line (Yellow)**
- Center equilibrium point for volume balance
- Acts as support/resistance for OBV
- Separates buying pressure (above) from selling pressure (below)
---
### **SOURCE GROUP**
**Source**
- **Default:** Close
- **Options:** Open, High, Low, or any custom value
- Controls which price value triggers OBV direction changes
- Most traders use Close for standard OBV calculation
---
### **SIGNAL SMOOTHING GROUP**
**Show Signal?**
- **Default:** ON
- Toggle visibility of the signal line
- Disable if you prefer to see raw OBV only
**Smoothing Type**
- **SMA (Simple Moving Average)** - Default, standard smoothing
- **EMA (Exponential Moving Average)** - Faster response, weights recent bars more heavily
- **Choose SMA** for consistent, traditional OBV signals
- **Choose EMA** for faster trend identification (more whipsaws possible)
**Smoothing Length**
- **Default:** 21 bars
- **Range:** 1-200 bars
- **Lower values** (5-14): Faster signals, more noise
- **Higher values** (30-50): Slower signals, fewer false alarms
- **Recommendation:** Use 21-25 for most timeframes
---
### **SIGNAL FILTERING GROUP**
This is your primary control for signal quality and frequency.
**Show Signal Markers?**
- **Default:** ON
- Toggle the V-shaped buy/sell markers on/off
- Disable if markers distract from your analysis
**Signal Filter Type**
- **None** - Shows every single crossover (noisy, best for skilled traders)
- **Confirmation Bars** - Waits N bars before confirming signal (recommended)
- **Strength-Based** - Only signals during strong momentum (filters weakest moves)
#### **CONFIRMATION BARS MODE** (Recommended)
Best for reducing false signals while staying responsive to real moves.
**Confirmation Bars**
- **Default:** 2 bars
- **Range:** 1-10 bars
- Waits for the signal to hold for N consecutive bars after crossover
- **Setting 1:** Every crossover (same as "None")
- **Setting 2:** Wait 1 bar confirmation (good balance)
- **Setting 3:** Wait 2 bars confirmation (filters 50% of noise)
- **Setting 4+:** Very selective, misses quick reversals
**How it works:**
1. OBV crosses signal line → Confirmation counter starts
2. If OBV stays on correct side for 2 bars → V-marker appears
3. If OBV crosses back → Counter resets, no signal
#### **STRENGTH-BASED MODE**
Only signals when momentum is statistically significant.
**Min Z-Score Strength**
- **Default:** 0.3
- **Range:** 0.0-3.0
- Requires OBV deviation from its mean to reach this threshold
- **Setting 0.1-0.3:** More signals, lower quality
- **Setting 0.5-0.8:** Moderate signals, good quality
- **Setting 1.0+:** Only the strongest momentum shifts
**How it works:**
- Calculates how far OBV is from its 50-bar average (Z-score)
- Only shows signals when this distance is meaningful
- Automatically avoids weak, choppy market conditions
---
### **VISUALS & COLORS GROUP**
**Highlight Crossovers?**
- **Default:** ON
- Master toggle for all signal markers
- Turn OFF to see only the OBV/signal lines
**Apply Ribbon Filling?**
- **Default:** ON
- Colors the space between OBV and signal line
- Green fill = OBV above signal (bullish)
- Red fill = OBV below signal (bearish)
- Provides clear visual trend confirmation
- Turn OFF for minimal chart clutter
---
### **STATS & ZONES GROUP**
**Use Window-Normalized OBV (visual only)?**
- **Default:** ON
- Removes long-term trend from OBV for clearer short-term signals
- Detrends the indicator to highlight recent momentum changes
- **ON:** Better for swing trading and identifying reversals
- **OFF:** Better for trend-following strategies
- Note: Z-Score always uses raw OBV for statistical accuracy
**OBV Normalize Window**
- **Default:** 200 bars
- Lookback period for detrending calculation
- Larger values = more aggressive detrending
- Adjust if you want OBV to oscillate more/less around zero
**Show Z-Score (OBV)?**
- **Default:** ON
- Displays statistical momentum indicator below main chart
- Ranges from -3 to +3 (most data within -2 to +2)
- High Z-Score = Strong buying momentum
- Low Z-Score = Strong selling momentum
**Z-Score Lookback**
- **Default:** 50 bars
- Period for calculating Z-Score mean and standard deviation
- Larger = smoother Z-Score, slower response
- Smaller = noisier Z-Score, faster response
**Show ROC (OBV Momentum)?**
- **Default:** OFF
- Rate of Change indicator for OBV velocity
- Useful for identifying momentum turning points
- Enable if you want to see speed of volume changes
**ROC Lookback**
- **Default:** 14 bars
- Period for ROC calculation
**Show Z-Score StdDev Zones?**
- **Default:** ON
- Shaded regions around zero line showing statistical boundaries
- Inner Zone (±1 Z) = Normal variation
- Outer Zone (±2 Z) = Extreme moves, potential reversals
- Helps identify overbought/oversold volume conditions
**Inner Zone (±Z)**
- **Default:** 1.0
- First boundary for standard deviation zones
- Most normal trading occurs within ±1
**Outer Zone (±Z)**
- **Default:** 2.0
- Second boundary for extreme conditions
- Crossing these zones indicates significant momentum shift
---
## Trading Strategy Examples
### **Strategy 1: Signal Line Crossovers (Beginner)**
**Setup:**
- Signal Filter Type: **Confirmation Bars**
- Confirmation Bars: **2-3**
- Show Signal Markers: **ON**
**Rules:**
1. **BUY signal** (green V): When OBV crosses above signal line and holds for 2-3 bars
- Confirms buying pressure is building
- Look for price to follow within 1-3 bars
2. **SELL signal** (red V): When OBV crosses below signal line and holds for 2-3 bars
- Confirms selling pressure is increasing
- Expect price decline
3. **Exit:** Take profits at next signal or use price support/resistance
**Best For:** Swing trading, intraday reversals, timeframes 5m-1h
---
### **Strategy 2: Zero Line Bounce (Intermediate)**
**Setup:**
- Signal Filter Type: **Strength-Based**
- Min Z-Score Strength: **0.5**
- Show Z-Score StdDev Zones: **ON**
**Rules:**
1. **Watch OBV approach zero line** during established trends
- OBV bouncing repeatedly off zero = trend is healthy
- OBV breaking through zero = trend reversal imminent
2. **Enter on bounce:** Buy when OBV bounces from zero line in uptrend
3. **Exit on break:** Close position when OBV breaks below zero line
4. **Confirm with Z-Score:** Only take trades when Z-Score shows momentum (|Z| > 0.5)
**Best For:** Trend traders, identifying trend strength, medium timeframes 15m-4h
---
### **Strategy 3: Momentum Extremes (Advanced)**
**Setup:**
- Signal Filter Type: **None**
- Show Z-Score StdDev Zones: **ON**
- Outer Zone: **2.0**
**Rules:**
1. **Identify extremes:** When Z-Score breaks outer zone (±2.0)
- Indicator is in extreme territory
- Likely overextended
2. **Fade extremes:** Take opposite position when Z-Score hits extreme
- High Z (>2.0) = OBV overbought, expect pullback
- Low Z (<-2.0) = OBV oversold, expect bounce
3. **Confirm:** Wait for crossover signal to enter
4. **Target:** Outer zone of opposite side or zero line
**Best For:** Range trading, mean reversion, experienced traders only
---
## Reading the Indicator in Different Markets
### **Strong Uptrend**
- OBV consistently above signal line (green)
- OBV well above zero line, rising higher lows
- Z-Score positive, trending upward
- **Action:** Buy dips to signal line, sell at resistance
### **Strong Downtrend**
- OBV consistently below signal line (red)
- OBV well below zero line, making lower highs
- Z-Score negative, trending downward
- **Action:** Sell rallies to signal line, cover at support
### **Consolidation/Choppy Market**
- OBV whipsaws around signal line frequently
- Crossovers occur every few bars
- Z-Score oscillating between -1 and +1
- **Action:** Increase confirmation bars to 3-4, or switch to strength-based filter
### **Accumulation (Bottom Formation)**
- OBV rising while price is flat or falling
- Volume flowing in despite downtrend (bullish divergence)
- Z-Score climbing while price lows hold
- **Action:** Expect breakout up; prepare buy near support
### **Distribution (Top Formation)**
- OBV falling while price is flat or rising
- Volume flowing out despite uptrend (bearish divergence)
- Z-Score falling while price continues higher
- **Action:** Expect breakdown down; prepare short near resistance
---
## Parameter Tuning Guide
### **Aggressive Settings (More Signals)**
- Smoothing Length: 14
- Signal Filter: None or Confirmation Bars: 1
- Min Z-Score: 0.1
- Best for: Day trading, high volatility stocks
- Risk: More false signals
### **Balanced Settings (Recommended)**
- Smoothing Length: 21
- Signal Filter: Confirmation Bars: 2
- Min Z-Score: 0.3
- Best for: Swing trading, most market conditions
- Risk/Reward: Moderate
### **Conservative Settings (Fewer Signals)**
- Smoothing Length: 30-40
- Signal Filter: Confirmation Bars: 3-4 or Strength-Based: 0.7+
- Min Z-Score: 0.8
- Best for: Position trading, high-conviction trades only
- Risk: May miss some moves
---
## Common Questions & Troubleshooting
**Q: Why are there more sell signals than buy signals?**
A: This reflects the actual market action. Markets often decline faster than they rise (fear > greed). Confirm signals with price action and support/resistance.
**Q: The indicator keeps whipsawing, should I hide it?**
A: Increase Confirmation Bars to 3-4 or switch to Strength-Based filter. Market conditions matter—choppy markets require stricter filters.
**Q: What's the difference between normalized and raw OBV?**
A: Normalized (detrended) shows shorter-term momentum by removing long-term trends. Raw OBV shows absolute accumulation/distribution over the full period. Use normalized for swing signals, raw for trend confirmation.
**Q: My signals come too late. How do I get faster entry?**
A: Reduce Smoothing Length (try 14 instead of 21), use EMA instead of SMA, or set Confirmation Bars to 1. Trade-off: More false signals.
**Q: Can I use this for day trading?**
A: Yes, on 1m-5m charts with aggressive settings. Use Confirmation Bars: 1 and focus on Z-Score > 0.5 entries only.
**Q: Should I trade every signal?**
A: No. Filter signals using: price near support/resistance, multiple indicators confirming, and Z-Score showing momentum. Best signals occur at key levels.
---
## Best Practices
1. **Always confirm with price action:** OBV signals work best when price is near support, resistance, or moving average. Don't trade signals in a vacuum.
2. **Use volume context:** Check if volume is increasing or decreasing on the signal. Strong signals have volume confirmation (increasing volume on OBV spikes).
3. **Adjust settings per timeframe:**
- 1m-5m: Smoothing 12, Confirmation 1, Z-Score 0.2
- 15m-1h: Smoothing 20, Confirmation 2, Z-Score 0.3
- 4h-1d: Smoothing 25, Confirmation 3, Z-Score 0.5
4. **Watch the zero line:** It's your friend. OBV behavior at the zero line reveals trend strength. Bounces = healthy trend. Breaks = reversal.
5. **Risk management:** No indicator is perfect. Use proper position sizing and stop losses. OBV should confirm your thesis, not be the only reason to trade.
6. **Combine with other indicators:**
- Price moving averages for trend confirmation
- RSI or Stochastic for overbought/oversold levels
- Support/resistance for entry/exit zones
- MACD for momentum divergences
---
## Disclaimer
This indicator is for educational and informational purposes only. It is not financial advice. Past performance does not guarantee future results. Always conduct your own research and consult with a financial advisor before making trading decisions. Trading carries risk, including potential loss of principal.
---
## Version History
**Version 1.0** - Initial release with enhanced signal filtering, Z-Score analysis, and customizable parameters.

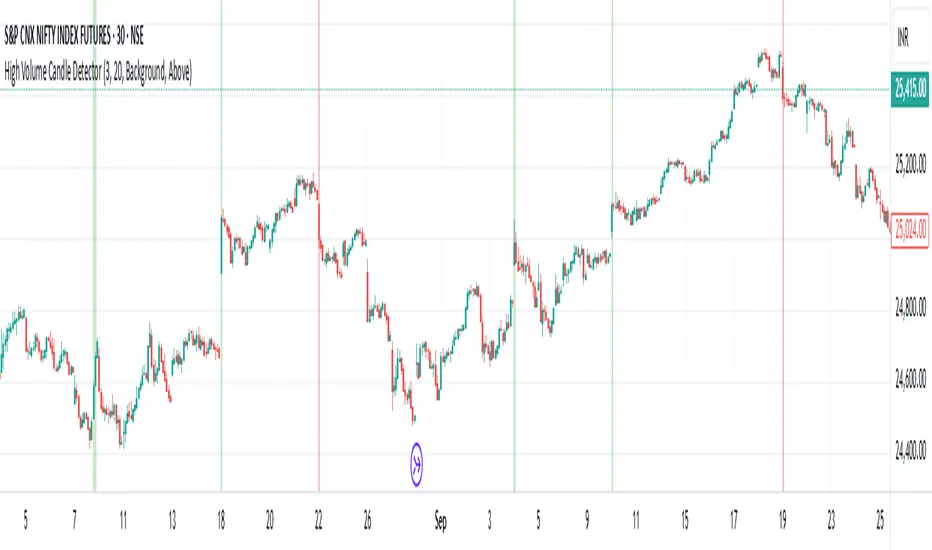
High Volume Candle Detector by Ravi Shinde📊 High Volume Candle Detector
🎯 Overview
Identify exceptional volume spikes that signal institutional activity, breakouts, and reversals. Detects candles with volume exceeding a customizable threshold (default: 3x average volume over 20 periods).
✨ Key Features
🔧 Customizable Settings
Volume Multiplier (default: 3.0x) - Define your threshold
Average Period (default: 20) - Adapt to any timeframe
Bullish/Bearish Detection - Automatic color coding (green/red)
🎨 Visual Styles
Background - Subtle colored highlighting
Border - Yellow box outline
Shape - Triangle markers with "HV" text
All - Combined display
🔔 Smart Alerts
Bullish High Volume 🟢
Bearish High Volume 🔴
Any High Volume ⚠️
📈 Derivatives Trading Method
High-volume candle highs and lows mark key breakout levels. Break above = Go Long. Break below = Go Short. Trail your stop-loss with a moving average of your choice for optimal risk management. Optimal performance on 15-minute or higher timeframes. Lower timeframes may generate excessive noise.
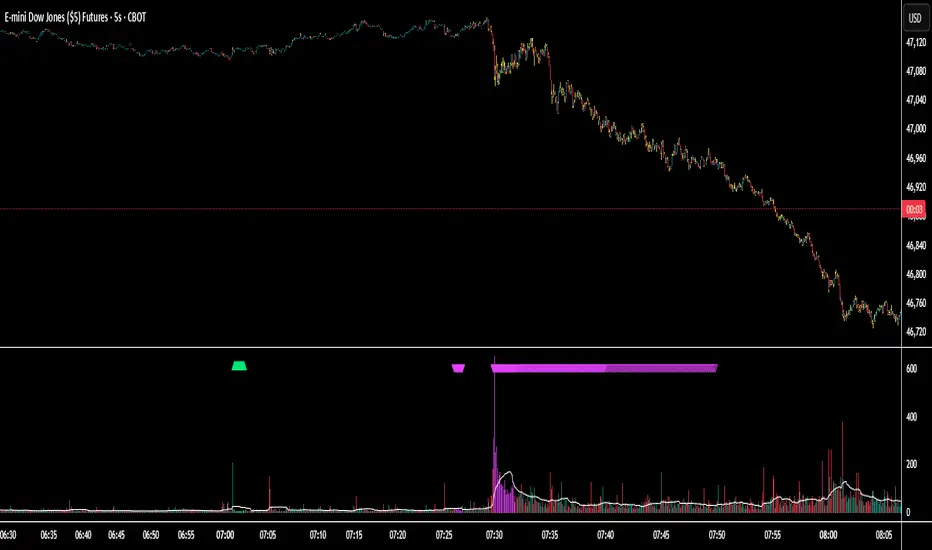
Session Volume Spike Detector (MTF Arrows)Overview
The Session Volume Spike Detector is a precision multi-timeframe (MTF) tool that identifies sudden surges in buy or sell volume during key market windows. It highlights high-impact institutional participation by comparing current volume against its historical baseline and short-term highs, then plots directional markers on your chart.
This version adds MTF awareness, showing spikes from 1-minute, 5-minute, and 10-minute frames on a single chart. It’s ideal for traders monitoring microstructure shifts across multiple time compressions while staying on a fast chart (like 1-second or 1-minute).
Key Features
Dual Session Windows (DST-aware)
Automatically tracks Morning (05:30–08:30 MT) and Midday (11:00–13:30 MT) activity, adjusted for daylight savings.
Directional Spike Detection
Flags Buy spikes (green triangles) and Sell spikes (magenta triangles) using dynamic volume gates, Z-Score normalization, and recent-bar jump filters.
Multi-Timeframe Projection
Displays higher-timeframe (1m / 5m / 10m) spikes directly on your active chart for continuous visual context — even on sub-minute intervals.
Adaptive Volume Logic
Each spike is validated against:
Volume ≥ SMA × multiplier
Volume ≥ recent-high × jump factor
Optional Z-Score threshold for statistical significance
Session-Only Filtering
Ensures spikes are only plotted within specified trading sessions — ideal for futures or intraday equity traders.
Configurable Alerts
Built-in alert conditions for:
Any timeframe (MTF aggregate)
Individual 1m, 5m, or 10m windows
Alerts trigger only when a new qualifying spike appears at the close of its bar.
Use Cases
Detect algorithmic or institutional activity bursts inside your trading window.
Track confluence of volume surges across multiple timeframes.
Combine with FVGs, bank levels, or range breakouts to identify probable continuation or reversal zones.
Build custom automation or alert workflows around statistically unusual participation spikes.
Recommended Settings
Use on 1-minute chart for full MTF display.
Adjust the SMA length (default 20) and Z-Score threshold (default 3.0) to suit market volatility.
For scalping or high-frequency environments, disable the 10m layer to reduce visual clutter.
Credits
Developed by Jason Hyde
© 2025 — All rights reserved.
Designed for clarity, precision, and MTF-synchronized institutional volume detection.
Smart Money — Volume Panel + OBV Smart Money — Volume Panel + Scaled OBV
This indicator combines classic volume analysis with a scaled On-Balance Volume (OBV) line, helping spot smart money activity:
Volume bars – color changes dynamically:
🟢 green = high volume & OBV rising
🔴 red = high volume & OBV falling
🟠 orange = high volume but OBV neutral
⚪ gray = low volume
Yellow line – volume moving average (MA)
Purple line – high-volume threshold (MA × multiplier)
OBV line (green/red) – scaled OBV plotted in the same range as volume for easier comparison.

Cumulative Volume Delta📊 Indicator Name:
Cumulative Volume Delta (CVD) + Candle Divergence (Color DIfference)
📌 Purpose:
This indicator visualizes volume delta over a user-defined time anchor and highlights divergence between volume-based momentum and price movement. It's especially useful for identifying potential reversals, fakeouts, or hidden buying/selling pressure.
🔍 How It Works:
1. Volume Delta Calculation (CVD Candles):
The script uses ta.requestVolumeDelta() to approximate volume delta data over a chosen anchor period (e.g., 1D).
Volume delta = Buy Volume – Sell Volume
Each candle on the CVD chart represents changes in cumulative volume delta, with OHLC-style values:
openVolume: cumulative delta at the start of the bar
lastVolume: cumulative delta at the end of the bar
maxVolume, minVolume: intra-bar high and low
2. Visual Representation (CVD Candles):
Green/Teal candle: Delta is increasing (buying pressure dominates)
Red candle: Delta is decreasing (selling pressure dominates)
3. Divergence Detection:
The script compares the direction of the price candle with the direction of the CVD candle:
Price Up + CVD Down → Possible hidden selling (bearish divergence)
Price Down + CVD Up → Possible hidden buying (bullish divergence)
4. Color Highlighting:
Orange candle on the CVD chart signals divergence between price and volume delta.
This color override helps you quickly spot potential discrepancies between price movement and underlying volume pressure.
5. Alerting:
An alertcondition is added so you can receive a notification whenever a divergence occurs.
⚙️ User Inputs:
Anchor period (e.g., 1D): Timeframe over which the CVD is anchored.
Use custom timeframe: Allows you to override and define the internal lower timeframe used for volume estimation (e.g., 1-min).
📈 How to Use It:
✅ Bullish Divergence (Price down, CVD up)
This may indicate:
Buyers absorbing selling pressure.
A potential reversal to the upside.
Hidden accumulation.
🚫 Bearish Divergence (Price up, CVD down)
This may indicate:
Sellers stepping in despite upward price.
A potential reversal to the downside.
Hidden distribution.
🧠 Trading Insights:
CVD is often used by order flow traders or those analyzing market depth and volume imbalances.
This version lets you visually align price action with underlying volume, improving decision-making.
The divergence signal can be combined with other technical tools like support/resistance, candlestick patterns, or trendlines for confirmation.

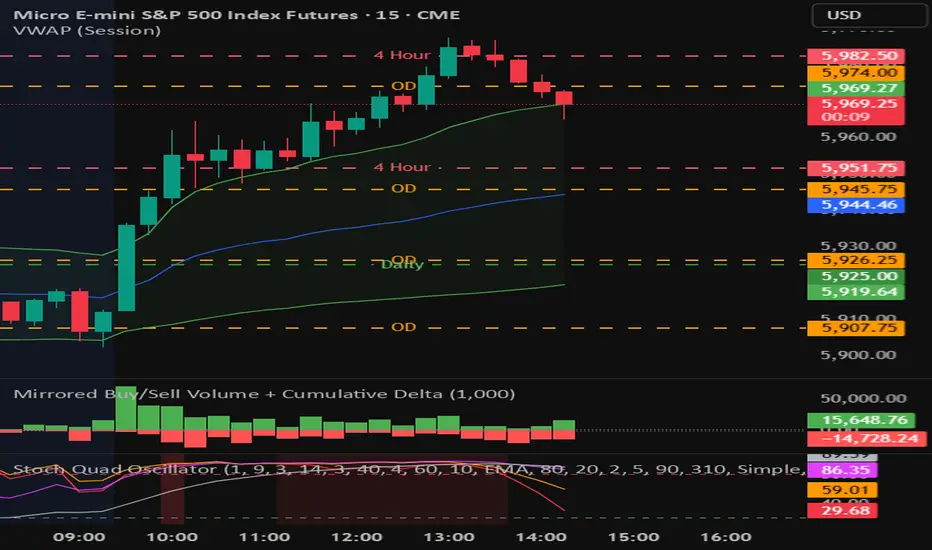
Mirrored Buy/Sell Volume + Cumulative DeltaUser Guide: Mirrored Buy/Sell Volume (Histogram)
🔍 What It Does
Displays green bars above zero for estimated buy volume
Displays red bars below zero for estimated sell volume
Adds a blue line showing Cumulative Delta (buy − sell over time)
Optional threshold lines help spot when net momentum builds up
📊 How Volume is Estimated
Same estimation method as the table version:
Buy Volume is proportion of volume estimated using (close - low) / (high - low)
Sell Volume is remainder of the total volume
Cumulative Delta = running total of (Buy − Sell) volume
This gives you:
A real-time sense of which side is gradually gaining control
More context than looking at candles or volume bars alone
✅ Best For
Visual trade decision support: who’s winning the tug-of-war?
Spotting trend initiation or momentum shifts
Combining with oscillator/trend tools for confirmation
⚠️ Limitations
Still an approximation — not based on actual trade aggressor data
Cannot separate passive vs. aggressive orders
Cumulative Delta does not reset unless specifically coded to do so
May mislead if the bar has long wicks or closes near midpoint
Bull vs Bear Volume on Price ChartThis script overlays estimated bullish and bearish volume directly on the price chart, making it easy to spot buying vs. selling pressure without switching to a separate volume pane.
🔍 Features:
📈 Bullish volume markers appear as green triangles below the candle.
📉 Bearish volume markers appear as red triangles above the candle.
🔄 Optional smoothing to reduce noise using simple moving average (SMA).
⚠️ Volume spike highlights: Bullish spikes turn lime green, bearish spikes turn bright red.
🔢 Toggle labels to see estimated volume values above/below each candle.
🔄 Works on all timeframes, from intraday to weekly/monthly charts.
📐 Methodology:
Bullish and bearish volume are estimated using the candle's range:
More bullish volume when the close is near the high.
More bearish volume when the close is near the low.
This is a visual proxy, not true order flow data.

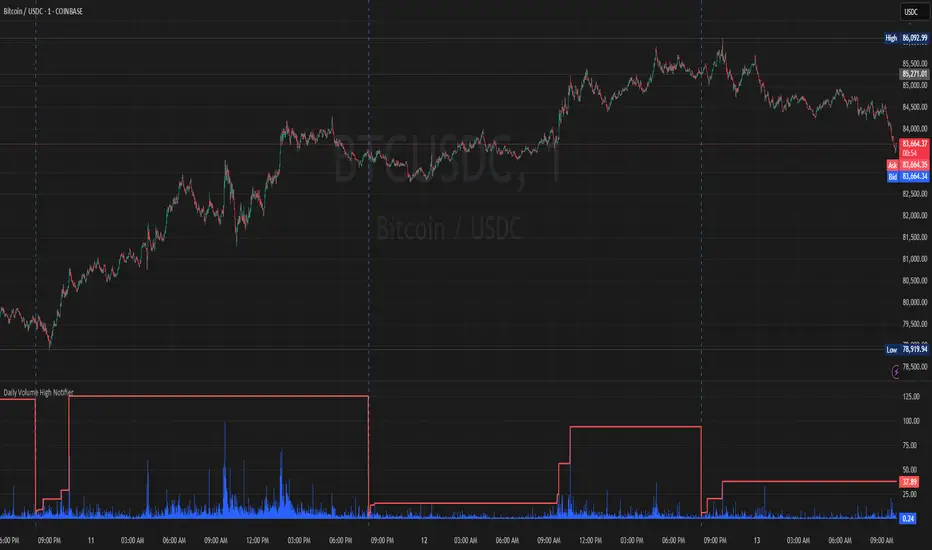
Daily Volume High Notifier📜 Script Description – Daily Volume High Notifier
This indicator monitors trade volume and sends an alert whenever a new daily high in volume is reached. The high volume is reset at the beginning of each trading day, allowing traders to stay informed of significant intraday volume spikes.
🛠️ Features:
Tracks the highest trade volume for the current day.
Resets the volume high tracker at the start of each new day.
Sends a real-time notification (alert()) whenever a new volume high is detected.
Useful for identifying unusual activity, potential breakouts, or institutional participation.
📊 Visual Elements:
Blue histogram for standard volume.
Red line showing the current day’s highest volume so far.
🔔 How to Use:
Add the script to any chart.
Enable alerts using the built-in alert() function.
Receive notifications every time volume hits a new high for the day.
🔔 Setting up Alerts in TradingView:
After adding this indicator to your chart:
Click the Alarm Clock (Alerts) icon.
Set condition: Daily Volume High Notifier → alert() function call .
Choose your alert type (app notification, email, popup, etc.).
Name it something like "Volume High Alert" and hit Create.
This tool is ideal for day traders, scalpers, and volume-based strategy traders who want to be instantly notified of spikes in market activity.