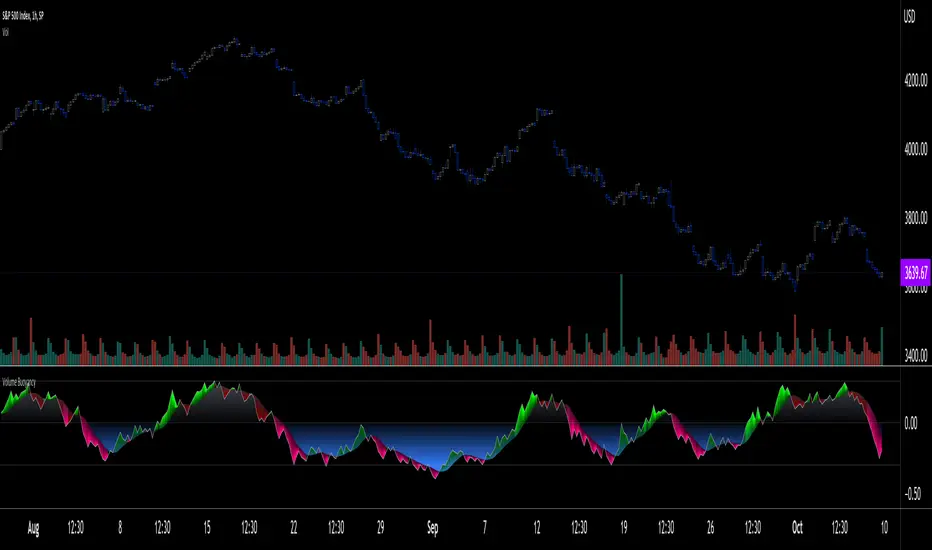
Volume Buoyancy [LucF]█ OVERVIEW
This indicator uses simple analysis of past volume to determine how well it supports recent market activity. What I call Volume buoyancy measures the strength and direction of that support.
█ CONCEPTS
Buoyancy
In physics, buoyancy is the force described in Archemedes' principle :
Any object, wholly or partially immersed in a fluid, is buoyed up by a force equal to the weight of the fluid displaced by the object.
I use the term loosely in this indicator's context, as "Volume buoyancy" here can be directed either up or down, indicating that past volume displays a bullish or bearish bias.
The calculation of buoyancy begins from a target quantity of volume summed over n bars. We then search chart bars backward, adding the volume of up and down bars in two different slots until each slot reaches the target. We then calculate two average distances: one each for the up and down bars whose volume was summed to reach the target. These average distances are then subtracted and the difference is divided by the farthest distance we had to go to find the target in either up or down bars. The last part of the calculations looks like this:
(avgDistanceDn - avgDistanceUp) / barsAnalyzed
When the average distance of down bars is greater than that of up bars, buoyancy will be positive, indicating that past activity favors the upside and vice versa. The force's strength, which in the case of actual buoyancy is the weight of the displaced fluid, in our case is measured by the size of the gap between the average distance of up vs down bars in relation to the farthest distance we had to go in the past. Buoyancy is always between +1 and -1, with values higher/lower than 0.3/-0.3 typically being unsustainable.
█ HOW TO USE THE INDICATOR
Load the indicator on an active chart (see here if you don't know how).
The default configuration displays:
• Buoyancy as a monochrome gray line.
• A channel between buoyancy and its MA, colored in one of four colors. The MA is not plotted by default, but you can see where it is with the channel.
The default settings use an Arnaud Legoux moving average over 20 bars.
• A fill between the MA and the centerline, which can be one of two colors.
• A high level at 0.30, a low level at -0.30 and the centerline at zero.
The default target is the sum of volume in the last 20 bars.
█ FEATURES
The indicator's settings allow you to define:
• A higher timeframe you want the calculations to be made on. Note that you should then ensure your chart's timeframe is always lower than the higher timeframe you specified,
as calculating on a timeframe lower than the chart's does not make much sense because the indicator is then displaying only the value of the last intrabar in the chart bar.
• The number of bars for which to add volume to obtain the target value that will be searched for in past up and down bars.
• The display of the buoyancy and MA lines, the channel between them and the fill between the MA line and the centerline.
• The type and length of the MA.
Using the "Style" tab of the indicator's settings, you can change the type and width of the lines, and the level values.
█ INTERPRETATION
Buoyancy shares the properties and shortcomings of many oscillators:
• It tends to be noisy, which is why the MA line can be helpful.
• The safest way to use it may be as a rough sentiment indicator, i.e., by paying more attention to its bull/bear state above/below the centerline.
• The more intrepid traders will want to use the channel between the main line and the MA, as it will provide earlier information than main line crosses of the centerline.
Decreasing the number of bars for which the source is added to calculate the target value will increase the noise level, somewhat like decreasing an MA's length would, but keep in mind that the number of bars is not the length of an MA.
█ LIMITATIONS
Under some circumstances, the indicator will display zero values because it cannot find the target in past bars. This will happen at the beginning of the dataset when not enough past bars have elapsed, or in the rarer cases anywhere in the dataset, when the target cannot be found in the `MAX_BARS_BACK` number of bars defined in the first line of the indicator's code (the default is 1000).
The calculations use a very primitive interpretation of volume similar to that of OBV , where all the volume of a bar is attributed to either the up or down slot. The indicator nonetheless produces results I think can be useful because we are not so much calculating precise buying/selling pressure as trying to build a big picture of where past activity over many bars appears to be taking price.
Volume data is notoriously high-variance; large values that come into or exit the calculations' scope can produce sudden variations in results, somewhat like the drop-off effect in moving averages.
█ NOTES
• The script can be used with any chart timeframe, including seconds.
• Historical values will always produce the same results. In real time, values will change until the bar closes.
Cari dalam skrip untuk "volume"
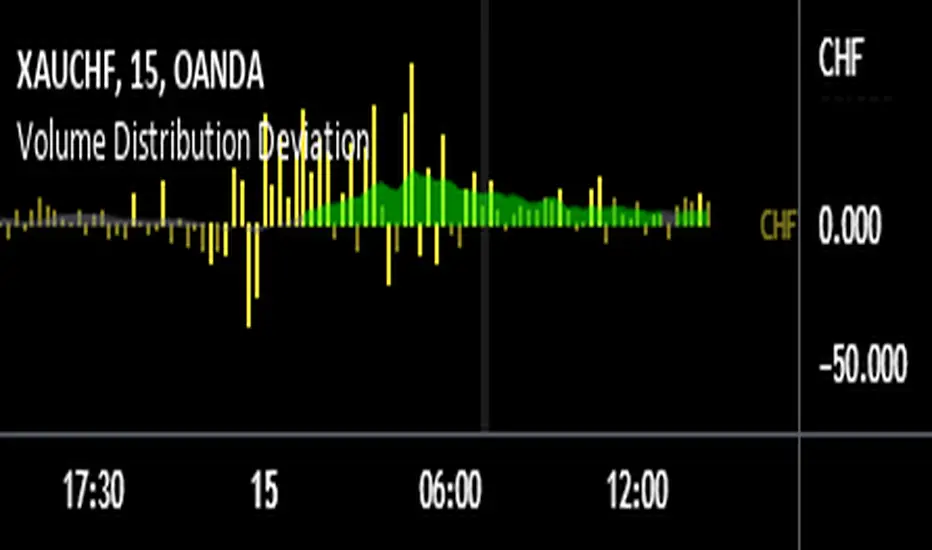
Volume Distribution DeviationThis indicator explores the question - "Does a currency's PERCENTAGE of trading volume verses other currencies show an insight into market sentiment?"
Specifically, it calculates the average market share based on the same time of day for a given number of days back (10 days by default) for trades involving the selected currency then presents fluctuations from that average as a percentage.
For example, assume that currencies involving EUR (EURUSD, EURAUD, EURCAD etc…) on average account for 20% of trading volume at 8am GMT (London open) however today at London open EUR crosses account for 30% at London open – 50% higher than usual. Does this information give us a heads up for market sentiment for the next few hours? And what if EUR volume was 50% higher than average and USD was 30% lower than average – should we focus on EUR and pass on USD that session?
Note that the indicator is not presenting information regarding volume quantity – it is showing you interest in that currency within the volume occurring that day. I already have an indicator that compares volume quantity to average volume quantity for that time of day, this takes the concept a little further and shows the normalised deviations from that average. So if USD volume was up 50% and NZD was up 50% they will show as equal on the indicator even though the actual traded volume of USD is probably x10 higher.
I find the 15 minute timeframe gives the most meaningful data. I use an 8 window chart and display the deviations for each currency (NZD, AUD, JPY, CHF, EUR, GBP, CAD, USD). If you set to 'Automatic' the indicator will automatically chose the currency based on the currency you crossed with gold (OANDA:XAUNZD, OANDA:XAUAUD, OANDA:XAUJPY, OANDA:XAUCHF, OANDA:XAUEUR, OANDA:XAUGBP, OANDA:XAUCAD, OANDA:XAUUSD). I tend to look at the average deviation rather than an isolated spike.
There are features in the indicator to try to summarise and highlight impactful data - highlighted deviations over a set tolerance (10% by default) and the SMA of the deviations.
Good luck
volume 5 min smiley JayyThis script plots volume. Intraday volume forms a smiley high at both ends and low in the middle at least for the cash session which is what this script concerns itself with. I created this as a curiosity but I figure others might be interested. If you are using 5 min charts then it will also plot the average for that particular time slot going back 10, 20 or 30 days and presents the mean for that bar as a black line. It also calculates the standard deviation over that period of time. Clearly the volume data is positively skewed so the mean and standard deviation are a little misleading. That aside it does provide a interesting perspective. The script likely could be reduced in size to accomplish the same thing with less tedium but it is what it is.
I likely will add an option for 15 minutes in the future.
If you are using BATS data you will find errors in low volume stocks because BATS data sometimes misses bars. The calculation relies on 78 5 min bars in a day (9:30 to 16:00 hrs). I built a little checker in the format. If the red line does not show at the beginning of the day then smiley will not work. For example SPY works well but NUGT does not. I have not found an issue will real time data.
There are a few options for bar colouring. They will be obvious when you play with them. current close versus last close, close versus open and volume relative to last bar.

Volume Anomaly AVWAP BiasThis indicator detects volume anomaly candles and tracks their anchored VWAPs. It measures the percentage of following candles that close on the favored side of each anomaly's VWAP and only continues to track anomalies with strong directional bias until broken.

Volume Based Ranges (VBR) [SS]Here is the Volume Based Ranges or VBR indicator.
How it works
The indicator works by:
Sorting volume into buying and selling volume, then
Calculating 2 independent Z-Scores for buying and selling data, then
Identifying the high buying and selling nodes through the use of the Z-score threshold.
Tracks the average target/move based on buying and selling nodes over a designated lookforward horizon (i.e. if you want to see the average move a high selling node happens over 20 candles, you can modify the lookforward horizon to 20).
Calculates the composition from each volume node, displaying the composition information on each line (the % of buying and selling each node contains).
How to Use it
To use this indicator:
Select the Z-Score length of assessment: By default, z-score is 75 and this is usually fine to leave.
Identify the threshold trigger: This will need to be adjusted based on your timeframe. If you are using 1 minute, the data is noiser and you want more profound signals. Thresholds generally in this range should be between 5 - 7. For larger timeframes, you want to relax this threshold, to about 2 to 3. You can toggle in increments of 0.5 to find what works the best. Generally you want to see very rigorous volume node signals instead of tons of them.
Determine what you want to see: You can turn of the support and resistance lines and just have the node identification signals and the return boxes. Or, you can just have the support and resistance lines and turn off the return boxes. You can customize the information the indicator displays in the settings menu to suit what you are most interested in.
Let's look at some examples '
DIS on the hourly. We can see that the average up move from the high buying nodes has a target of 115.42, and in between there we can see the high selling and buying nodes and their compositions.
High buying (100% of the high buying volume) is around the 112.61. This means, you would expect this to be an area of retracement.
We can also see that high selling is just below that at 111.66, which can be a resistance area.
Here is a closer look at the levels specifically:
EPAM on the daily:
You can see a successful retrace back to a high volume node.
Concluding remarks
That's the indicator!
Its one that is best to get a feel for, play around and decide on the settings you like for your individual ticker.
I have included tooltip descriptions for the settings within the indicator as well.
I hope you enjoy it and find it helpful!
Thanks for reading/checking it out and as always, safe trades!

Volume Dry-Up Detector [CANSLIM]by the GPT,
Volume ≤ 50% of 50-day average for ≥3 consecutive days
Highlights the stock as “ready for breakout” (green background + label)
Works on any ticker (WH Group, Smithfield, etc.)

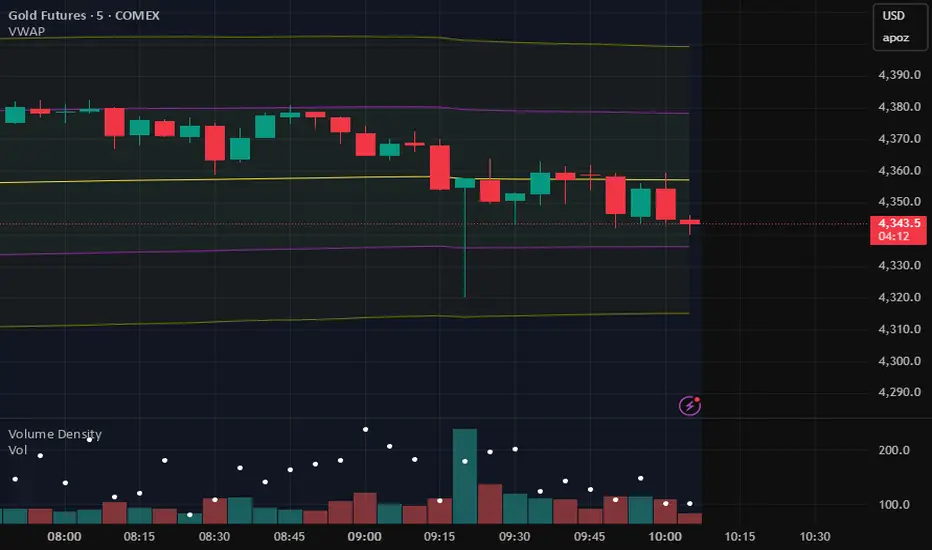
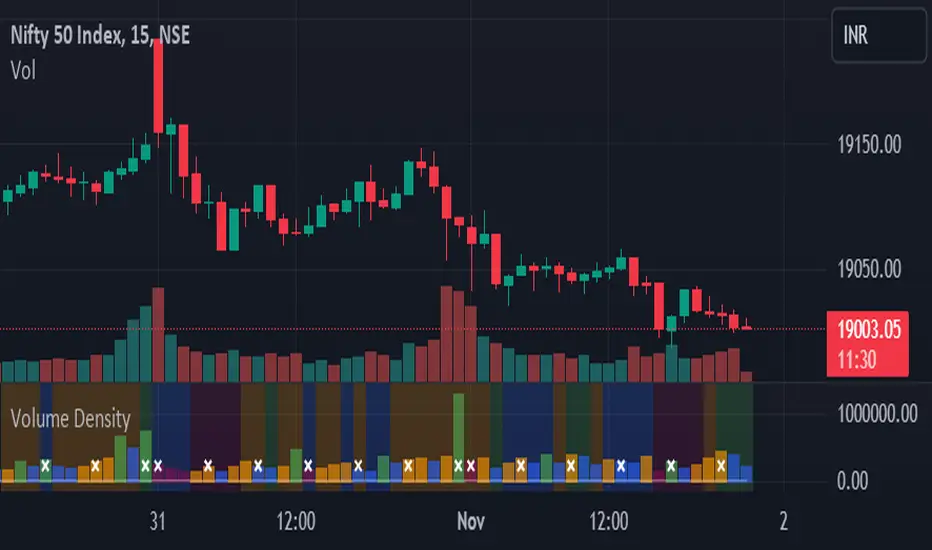
Volume DensityThis indicator calculates the volume density of each bar by dividing the trading volume by the bar's price range (high - low). It highlights bars with higher activity relative to their price movement. Density bars are colored teal if the close is higher than the open, and red if the close is lower. Zero-range bars are ignored to prevent division errors.
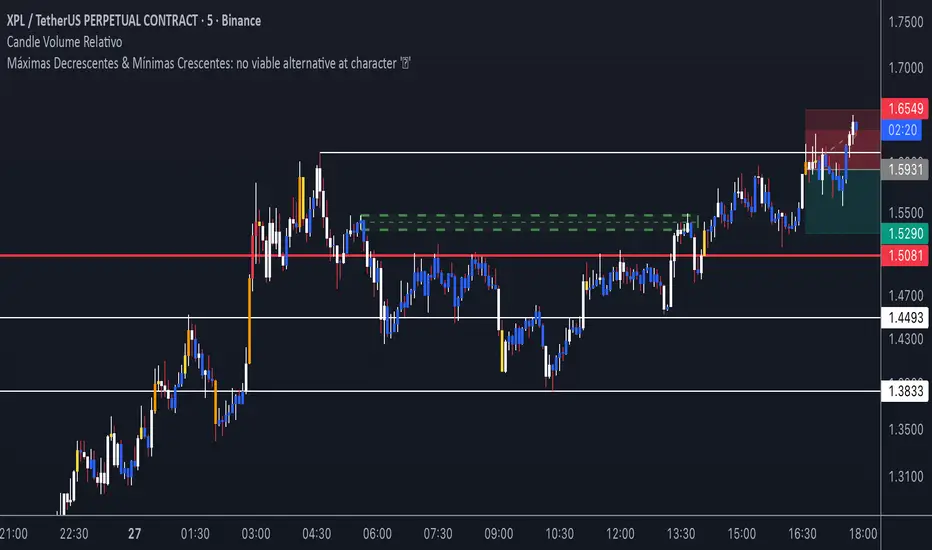
Volume Relativo - Candle Color - CriptoBraboAssinala pela cor do candle o volume relativo. Parametros customizáveis
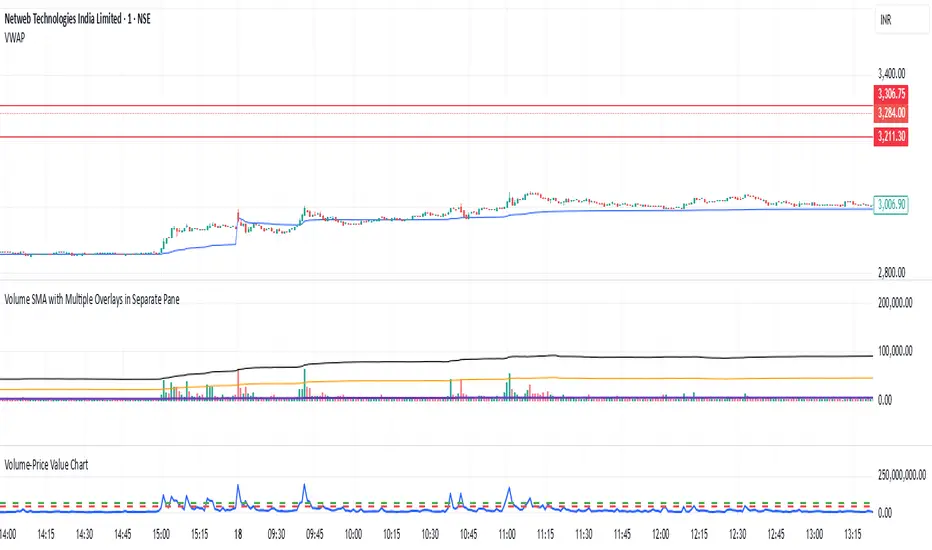
Volume-Price Value ChartPrice and volume are the two most important part of price movement. So, value which is product of the two is very critical and this can be considered as the only leading indicator.
Volume & Turnover HUD DisplayThis indicator highlights the latest candle’s trading activity directly on your chart. It displays the current candle’s volume in a large, easy-to-read format at the bottom-left corner of the screen, ensuring quick visibility without cluttering the chart.
An optional feature (enabled by default) also calculates and shows the turnover, derived from Volume × VWAP, expressed in crores (₹). This helps traders instantly assess both participation and the monetary value being traded in real time.
Ideal for intraday and swing traders who want a clear, at-a-glance view of volume and turnover strength to make faster decisions.

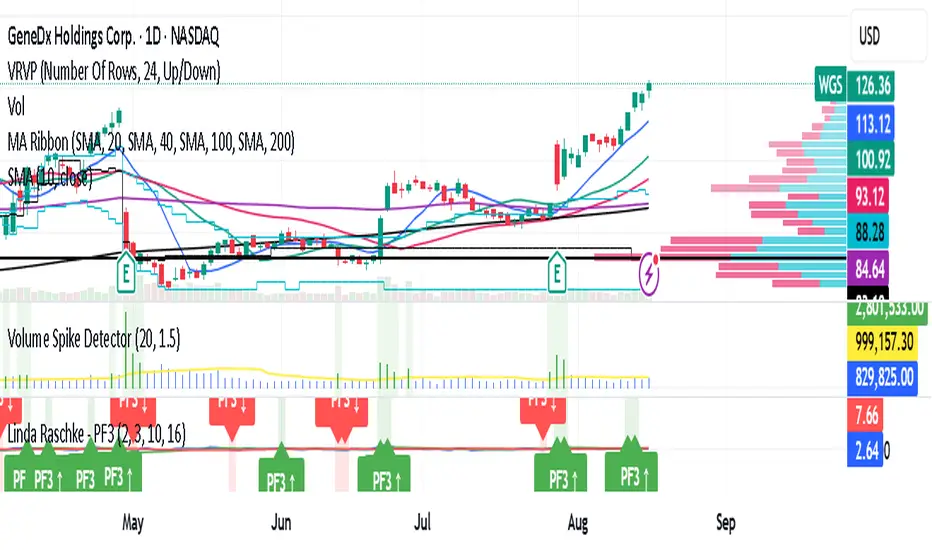
Volume Spike DetectorDetects a spike in Volume . based on volume on tradingviews. It highlights when volume is 1.5X of usual average
Volume Divergence 11192It calculates a custom volume-weighted moving average using the pine_wma() function which takes into account whether each candle is bullish or bearish
It processes volume data through multiple layers of this custom moving average
It detects four types of divergences:
Regular Bullish Divergence: When price makes a lower low but volume makes a higher low (potential bullish reversal)
Hidden Bullish Divergence: When price makes a higher low but volume makes a lower low (potential bullish continuation)
Regular Bearish Divergence: When price makes a higher high but volume makes a lower high (potential bearish reversal)
Hidden Bearish Divergence: When price makes a lower high but volume makes a higher high (potential bearish continuation)
It visualizes these divergences on the chart with colored markers and labels

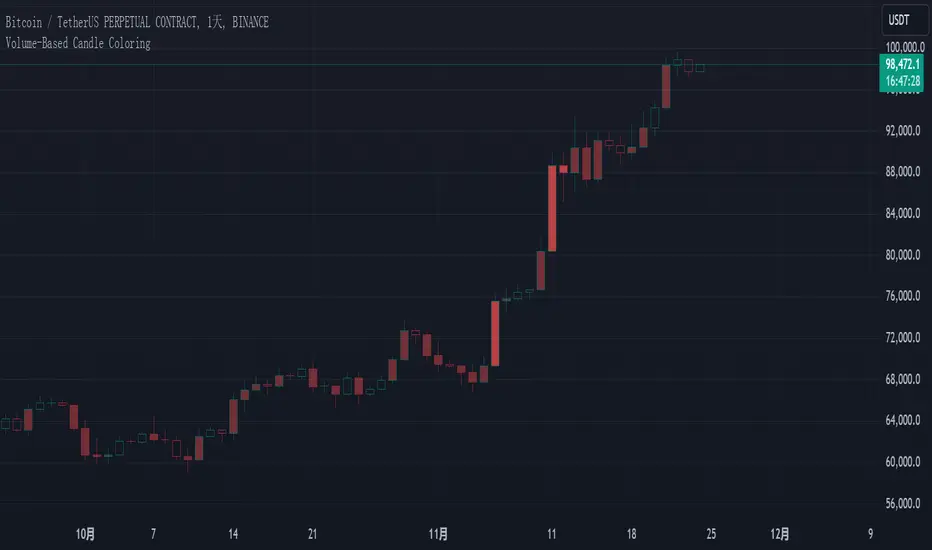
Volume-Based Candle Coloringk线会根据当前成交量高低产生渐变色,帮助你更轻松识别重要的k线。
请使用空心蜡烛图,否则该指标无法显示。
The candlestick colors will transition based on the current trading volume, making it easier for you to identify significant candlesticks.
Please use hollow candlesticks; otherwise, this indicator will not display properly.
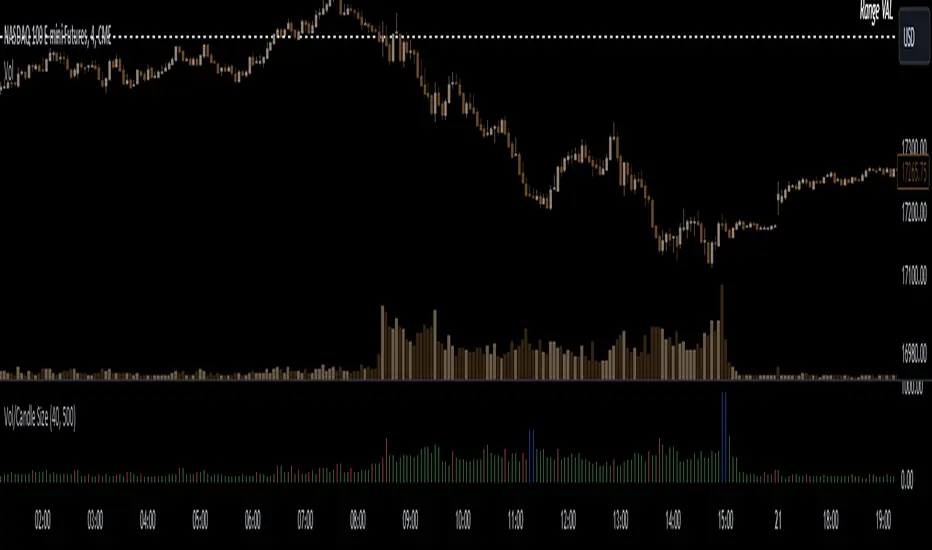
Volume to Candle Size RatioThe "Volume to Candle Size Ratio" indicator calculates the ratio of volume to candle size for any time-based candles. It offers user-defined thresholds for percentage change and absolute value, coloring histogram bars based on whether the ratio or percentage increase exceeds specified thresholds. This indicator helps traders visualize volume dynamics relative to candle size, aiding in identifying potential trading opportunities.
Volume DensityScript calculates the amount of volume involved per unit price and is colored based on its previous value. An increasing value along with a suitable price action indicates that there is more supply at that level and could be a potential reversal, a decreasing value indicates that there is less supply and the scrip may be in momentum or having a breakout.
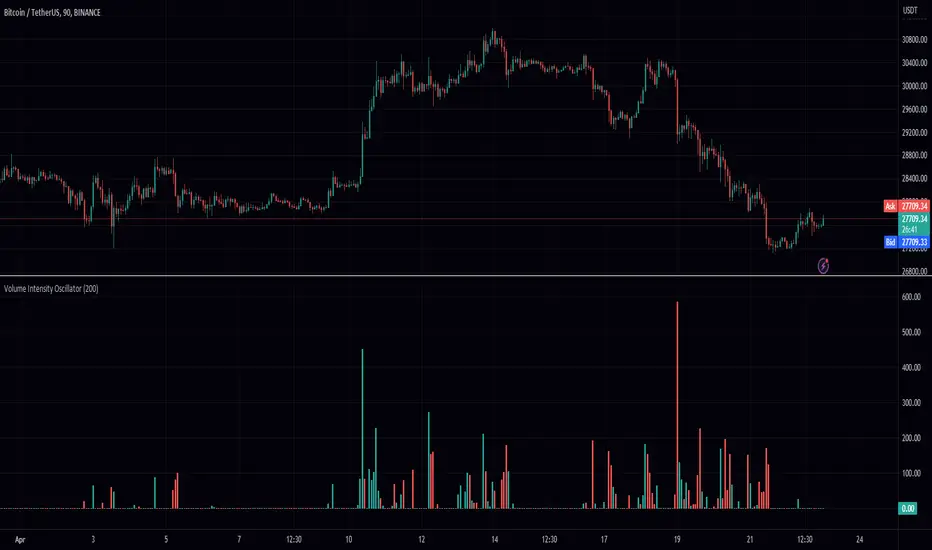
Volume Intensity OscillatorIntroducing the "Volume Intensity Oscillator" indicator, an advanced tool that utilizes the PeacefulIndicators library to gauge market volume intensity. This innovative indicator is designed to help traders identify potential market trends and improve their trading analysis.
The Volume Intensity Oscillator offers the following key features:
Adjustable input parameters, enabling you to modify the length and the option to remove negative values according to your trading preferences.
A visually appealing display, with the Volume Intensity Oscillator represented as columns in different colors based on the direction of the market movement (red for bearish and green for bullish).
Powered by the rvo function from the PeacefulIndicators library, the core functionality of the Volume Intensity Oscillator ensures accurate and reliable results.
To integrate the Volume Intensity Oscillator into your trading analysis, simply add the script to your chart and customize the input parameters as needed. We hope this script, built upon the PeacefulIndicators library, becomes a valuable asset to your trading strategy.
Volume with EMA 20 and 2 BB SALEM_ALSALEM1The highest candle amounts in trading volume exceed
average 20
Bollinger Band 1-15
Bollinger Band 20-2
Identified in dark blue

Volume in Base CurrencyShows the volume in USD, EUR, etc (whatever the base currency is for the asset) instead of number of stocks, bitcoins, etc.

Volume Sum BTC This indicator sums the bitcoin volume of the following tickers and shows the total volume as sum:
Binance:BTCUSDT
Coinbase:BTCUSD
FTX:BTCUSD
Kraken:BTCUSD
Gemini:BTCUSD
It helps to see the real volume taking place in the bitcoin market.
The code is open source so you can modify and/or add other tickers as you wish.
Volume BB Dollars Display Volume contract wise or dollar wise.
Display Sma colored based on its own slope.
Display 6 Colors based on Bollinger Bands.

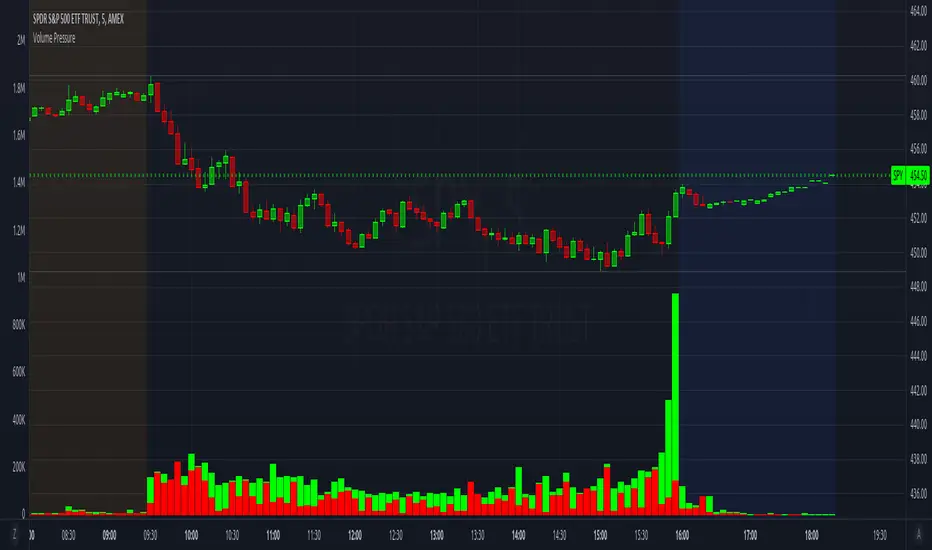
Volume PressureBreaks down volume into buyers (green part) vs sellers (red part).
It is recommended to set the volume's scale, especially if you switch tickers on the same chart. Follow these steps:
Select the Volume Pressure indicator's 3 dots (...)
Select Pin To Scale
Select a separate scale from the main chart, such as Pin To New Left Scale (Z)
Left click and hold the scale on the side of the chart and drag it up/down to bring the volume bars into the desired area
To update to the latest version, just close the indicator and add it again.
VolumeSimple and straightforward indicator. Includes - volume for Ethereum and Bitcoin to US dollar .
7 exchanges are connected:
-BINANCEUS:BTCUSD
-FTX:BTCUSD
-COINBASE:BTCUSD
-KRAKEN:XBTUSD
-GEMINI:BTCUSD
-BITFINEX:BTCUSD
-BITSTAMP:BTCUSD
Additionally, the calculation of average indicators and the amount (bull / bear separately) for a certain length is built-in.
If I missed data exchanges - write in the comments. Thank you.

Volume distance to new volume ATH This one lights up if the distance from volume ATH continues to become smaller.
Flips from color to white are a sign of trend decay/change and could be used as an exit signal or entry signal.
3rd part of the alchemy indicator.
