BG Ichimoku Tenkan & RSI MTF (Optimized)BG Ichimoku Tenkan & RSI MTF (Optimized)
The "BG Ichimoku Tenkan & RSI MTF (Optimized)" is a powerful and versatile TradingView indicator designed to provide multi-timeframe insights into market momentum using both the Tenkan-sen component of the Ichimoku Kinko Hyo and the Relative Strength Index (RSI). Developed by BAB & GINO, this tool helps traders quickly gauge trends and potential reversals across various timeframes directly on their chart.
Key Features and Functionality
This indicator combines visual clarity with comprehensive data presentation in a customizable table, making it easier to monitor multiple market dynamics at a glance.
Tenkan-sen Analysis
The Tenkan-sen (turning line) is a crucial part of the Ichimoku Kinko Hyo, calculated as the average of the highest high and lowest low over the past 9 periods. It serves as a short-term trend indicator.
Main Tenkan-sen Plot: The indicator displays the main Tenkan-sen line on your chart, colored dynamically to match the active chart's timeframe color for easy identification.
Multi-Timeframe (MTF) Tenkan Lines: You can enable additional Tenkan-sen lines for up to seven user-defined timeframes (e.g., 1m, 3m, 5m, 15m, 30m, 60m, 240m). These lines extend from the current bar with an adjustable offset, helping you visualize higher or lower timeframe Tenkan-sen levels relative to the current price.
MTF Line Labels: Each MTF Tenkan line can have a corresponding label indicating its timeframe (e.g., "1m", "3m"), with customizable size and offset for optimal visibility.
Tenkan Trend in Table: The indicator's integrated table clearly shows the current relationship between the Tenkan-sen and the price for each selected timeframe. An "🔼" symbol indicates the Tenkan-sen is above the price (bullish signal), while a "🔽" symbol indicates it's below (bearish signal), along with the Tenkan-sen's rounded value.
RSI Analysis
The Relative Strength Index (RSI) is a momentum oscillator that measures the speed and change of price movements. It typically ranges from 0 to 100 and is used to identify overbought or oversold conditions.
Customizable RSI Levels: You can set standard high (e.g., 60) and low (e.g., 40) RSI levels, as well as extreme high (e.g., 80) and extreme low (e.g., 20) levels to define zones of interest.
RSI Status in Table: The table provides a quick overview of the RSI value for each chosen timeframe, accompanied by intuitive emojis and symbols:
"🥵": Extremely overbought (above extreme high level)
"↑": Overbought (above high level)
"🥶": Extremely oversold (below extreme low level)
"↓": Oversold (below low level)
"-": Neutral (between high and low levels) The RSI value is also displayed, rounded to two decimal places.
Customizable Settings
The indicator offers extensive customization options through its input panel:
Table Position: Choose where the information table appears on your chart (Top Left, Top Right, Bottom Left, Bottom Right, Bottom Center).
Tenkan-sen Display: Toggle the visibility of the main Tenkan-sen line and the MTF Tenkan lines.
Line Offset: Adjust how far the MTF Tenkan lines extend from the current price bar.
MTF Label Settings: Control the visibility, size, and pixel offset of the MTF Tenkan line labels.
RSI Configuration: Define the RSI length and the thresholds for high, low, extreme high, and extreme low levels.
Table Text Size: Customize the font size within the indicator's table (Tiny, Small, Normal, Large).
Timeframe Selection: Independently set up to seven specific timeframes (in minutes) for both Tenkan and RSI analysis.
Timeframe Colors: Assign unique colors to each of the seven selected timeframes. These colors are used for the MTF Tenkan lines on the chart, the main Tenkan-sen line when its timeframe matches the chart, and the header cells in the information table, providing a consistent visual theme.
This "BG Ichimoku Tenkan & RSI MTF (Optimized)" indicator is a valuable tool for traders looking to enhance their market analysis with multi-timeframe confirmation, aiding in better-informed trading decisions.
Centered Oscillators

Directionality OscillatorDirectionality Oscillator is a simple momentum tool that measures net price displacement against total price activity over a chosen look-back period. It takes today’s closing price minus the close from “len” bars ago and divides that by the sum of all absolute bar-to-bar moves across the same span. The result is a value between –1 and +1, where positive values show that upward moves dominated and negative values show that downward moves prevailed.
To smooth out short-term noise, the indicator applies a five-bar simple moving average to the normalized value. A color gradient—from red at –1, through gray at 0, to green at +1—paints the line, making it easy to see whether bearish or bullish pressure is strongest. Two horizontal lines at the user-defined threshold and its negative mark zones of extreme directional strength. Readings above the positive threshold signal strong bullish momentum, and readings below the negative threshold signal strong bearish momentum.
Traders can watch for crossings above or below these threshold lines as trend confirmations or potential reversal warnings. A cross of the zero line indicates a shift in net directional control and can serve as an early trend-change alert when supported by price action or volume. Because it filters out sideways noise by normalizing against total activity, it highlights sustained directional thrust more clearly than a raw price-change measure.

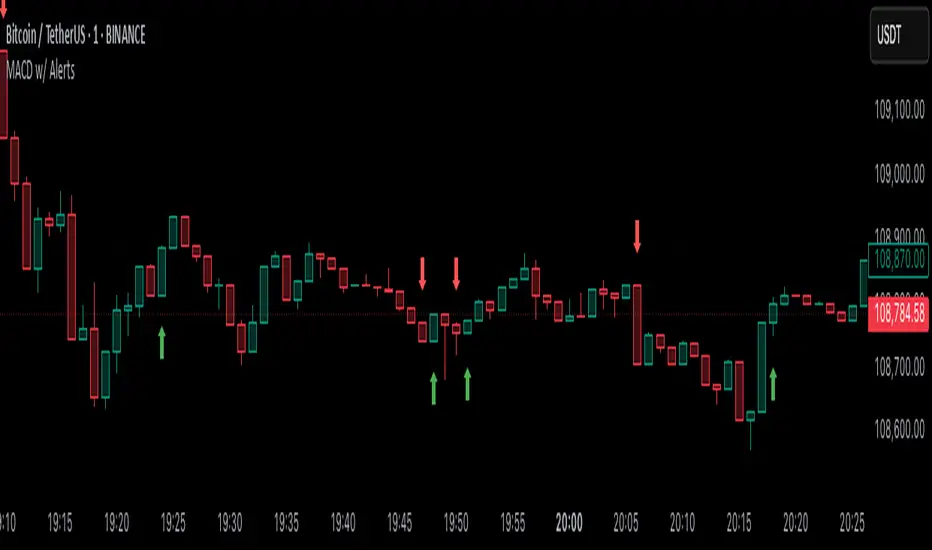
MACD Crossover with Price Action and AlertsThe MACD should use the default parameters (12, 26, 9) for fast EMA, slow EMA, and signal EMA, respectively, applied to the Close price. Instead of simple MACD crossovers, the indicator should analyze price action in relation to the MACD histogram to generate signals. Specifically: 1. BUY signal: Generate a buy signal (an up arrow displayed below the low of the signal bar in green color) when the MACD histogram crosses above zero AND the price action shows a bullish engulfing pattern (the current candle's body completely engulfs the previous candle's body). 2. SELL signal: Generate a sell signal (a down arrow displayed above the high of the signal bar in red color) when the MACD histogram crosses below zero AND the price action shows a bearish engulfing pattern (the current candle's body completely engulfs the previous candle's body). The arrows should be non-repainting, meaning that once an arrow is plotted on a bar, it should not disappear or change position as the chart updates. The indicator should also plot the MACD line, signal line, and histogram using their default calculations. The MACD line should be blue, the signal line should be orange, and the histogram should be displayed using green bars for positive values and red bars for negative values. The indicator should also have customizable inputs for the MACD fast EMA period, slow EMA period, signal EMA period and engulfing pattern check enabled/disabled. If engulfing pattern check disabled, the indicator will generate signals based only on MACD histogram crossing zero.
Adaptive Momentum Flow (AMF)Overview
The Adaptive Momentum Flow (AMF) indicator is a powerful, multi-faceted tool designed to provide a comprehensive and adaptive view of market momentum and trend strength. Unlike traditional oscillators with fixed settings, AMF dynamically adjusts its calculations based on market volatility , ensuring its signals remain relevant across varying market conditions. By combining advanced Double Exponential Moving Averages (DEMA) with a powerful volume analysis component and a customizable scoring system, AMF offers a unique perspective on price action and underlying buying/selling pressure.
Key Features & How It Works
1. Adaptive DEMA Trend Strength:
At its core, AMF utilizes three DEMA lines (Fast, Medium, Slow) to assess the current trend's alignment and strength.
The indicator dynamically adjusts the lengths of these DEMA lines based on real-time market volatility, measured by Average True Range (ATR). This means AMF becomes more responsive in volatile markets and smoother in calmer periods.
A "Volatility Sensitivity" input allows you to fine-tune how aggressively the indicator adapts to these changes.
2. Volume Analysis (Buying/Selling Pressure):
AMF incorporates a dedicated volume analysis module to gauge whether volume is predominantly supporting upward or downward price movements. This helps identify periods of significant buying or selling pressure.
This volume analysis component is smoothed with an adjustable Moving Average (SMA, EMA, WMA, or DEMA) and contributes to the overall momentum score, adding a crucial layer of volume-driven confirmation to the analysis.
3. Comprehensive Scoring System:
The indicator generates a normalized "Oscillator Score" that ranges from -100 to 100. This score is a weighted sum of:
Price's relationship to the Fast DEMA.
The Fast DEMA's relationship to the Medium DEMA.
The Medium DEMA's relationship to the Slow DEMA.
The smoothed value from the volume analysis.
Each component's influence on the final score can be individually adjusted via input weights, allowing for deep customization.
Signal Line & Crossovers:
A smoothed "Signal Line" provides additional confirmation for momentum shifts. Crossovers between the main AMF line and its Signal Line can indicate potential changes in market direction.
Overbought/Oversold Levels:
Adjustable Overbought (default 70) and Oversold (default -70) levels visually highlight extreme momentum conditions.
These zones are enhanced with a color fill effect (bright red for overbought, bright cyan for oversold), making it easy to spot when the market is entering potentially exhausted states.
Crucially, these extreme zones can often be further validated by combining them with volatility bands (like Bollinger Bands or Keltner Channels as shown in the chart above) or other confluence indicators, offering stronger signals for potential reversals or exhaustion.
Benefits for Traders
Reduced Lag: DEMA's inherent design helps minimize lag compared to traditional moving averages, providing more timely signals.
Adaptive Intelligence: Automatically adjusts to market volatility, ensuring the indicator's sensitivity is appropriate for current conditions.
Holistic Momentum View: Combines price-based trend alignment with volume-based pressure for a more robust assessment of market flow.
Clear Visual Cues: Intuitive plots, signal line, and vibrant overbought/oversold zone fills make interpretation straightforward.
Customizable: Extensive input options allow traders to tailor the indicator to their specific trading style, asset, and timeframe.
How to Use
Trend Confirmation: Look for the AMF line and its Signal Line to align with the price trend.
Momentum Shifts: Crossovers between the AMF line and its Signal Line can indicate shifts in momentum.
Extreme Conditions: Pay attention when the AMF line enters the neon-highlighted overbought or oversold zones, signaling potential reversals or pauses in the current momentum. Always consider confirming these signals with other analysis tools, such as price action, chart patterns, support/resistance levels, or volatility indicators.
Customization: Experiment with the "Volatility Sensitivity," DEMA multipliers, and scoring weights to find the optimal settings for your trading strategy.

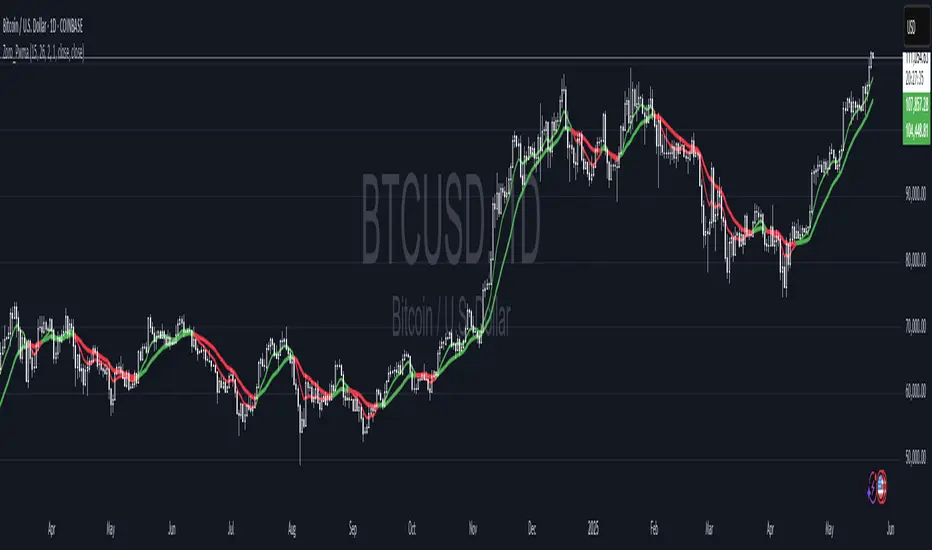
Dual Pwma Trends [ZORO_47]Key Features:
Dual PWMA System: Combines a fast and slow Parabolic Weighted Moving Average to identify momentum shifts and trend changes with precision.
Dynamic Color Coding: The indicator lines change color to reflect market conditions—green for bullish crossovers (potential buy signals) and red for bearish crossunders (potential sell signals), making it easy to interpret at a glance.
Customizable Parameters: Adjust the fast and slow PWMA lengths, power settings, and source data to tailor the indicator to your trading style and timeframe.
Clean Visualization: Plotted with bold, clear lines (3px width) for optimal visibility on any chart, ensuring you never miss a signal.
How It Works:
The indicator calculates two PWMAs using the imported ZOROLIBRARY by ZORO_47. When the fast PWMA crosses above the slow PWMA, both lines turn green, signaling a potential bullish trend. Conversely, when the fast PWMA crosses below the slow PWMA, the lines turn red, indicating a potential bearish trend. The color persists until the next crossover or crossunder, providing a seamless visual cue for trend direction.
Ideal For:
Trend Traders: Identify trend reversals and continuations with clear crossover signals.
Swing Traders: Use on higher timeframes to capture significant price moves.
Day Traders: Fine-tune settings for faster signals on intraday charts.
Settings:
Fast Length/Power: Control the sensitivity of the fast PWMA (default: 12/2).
Slow Length/Power: Adjust the smoother, slower PWMA (default: 21/1).
Source: Choose your preferred data input (default: close price).
Adaptive Multi-TF Indicator Table with Presets giua64📌 Script Name:
Adaptive Multi-Timeframe Indicator Table with Presets — giua64
📄 Description:
This script displays an adaptive multi-timeframe dashboard that summarizes the signals of three key technical indicators:
Moving Averages (MAs), Relative Strength Index (RSI), and MACD.
It provides a fast and visually intuitive overview of market conditions across five timeframes (5m, 15m, 30m, 1h, 4h), helping traders quickly identify potential directional biases (e.g., bullish, bearish, or neutral) based on either predefined presets or fully manual settings.
🧰 Preset Configurations:
You can choose between four trading styles, each with optimized indicator parameters:
Scalping
• MAs: 5 / 10 (Fast), 20 / 50 (Slow)
• RSI: 7 periods | Overbought: 70 | Oversold: 30
• MACD: 5 / 13 | Signal: 3
Intraday
• MAs: 9 / 21 (Fast), 50 / 100 (Slow)
• RSI: 14 periods | Overbought: 60 | Oversold: 40
• MACD: 12 / 26 | Signal: 9
Swing
• MAs: 10 / 20 (Fast), 50 / 200 (Slow)
• RSI: 14 periods | Overbought: 65 | Oversold: 35
• MACD: 12 / 26 | Signal: 9
Manual
• Full custom control over all indicator settings.
🛠️ All settings can be customized manually from the options panel, including the exact MA periods, RSI thresholds, and MACD structure.
🧠 How It Works:
For each timeframe, the script evaluates:
MA crossover status (two levels):
The first symbol refers to the crossover of the fast MAs
The second symbol refers to the crossover of the slow MAs
🟢 = Bullish crossover
🔴 = Bearish crossover
➖ = Flat or no clear signal
RSI Direction:
↑ = RSI above upper threshold (potential overbought)
↓ = RSI below lower threshold (potential oversold)
→ = RSI in neutral range
MACD Line vs Signal Line:
↑ = MACD line is above signal line (bullish)
↓ = MACD line is below signal line (bearish)
→ = Flat or neutral signal
Each signal is assigned a numerical score. These are aggregated per timeframe to compute a combined score that reflects the directional bias for that specific time window.
🧠 Adaptive Logic by Asset:
This script is designed to be universally compatible across all asset types — including forex, crypto, stocks, indices, and commodities.
Thanks to its multi-timeframe nature and flexible indicator presets, the script automatically adjusts its behavior based on the asset selected, ensuring relevant analysis without requiring manual recalibration.
🧾 Summary Table Output:
At the bottom of the dashboard, a combined sentiment is displayed for:
3TF → 5m, 15m, 30m
4TF → Adds 1h
5TF → Adds 4h
Each row shows:
Signal → LONG / SHORT / NEUTRAL
Confidence (%) → Based on score aggregation and signal consistency
📌 Customization Options:
Table Position: Left, Right, or Center
Text Size: Small, Normal, or Large
Full Manual Configuration: All MA, RSI, and MACD parameters can be adjusted as needed
⚠️ Disclaimer:
This script is for educational and analytical purposes only.
It does not constitute financial advice or guarantee any trading results.
Always do your own research and apply responsible risk management.

Linear Volume MACD | Lyro RS📊 Linear Volume MACD | Lyro RS is an advanced momentum and trend detection tool that fuses price action with volume-weighted MACD logic and linear regression analysis . Designed for traders seeking deeper insights into market strength and directional conviction, this indicator highlights trend shifts, volume anomalies, and potential reversal zones with precision.
✨ Key Features :
🔁 Multi-Mode Analysis: Switch between Linear Regression , Strong/Weak Trend , or Volume MACD logic.
📐 Volume-Adjusted MACD: Incorporates volume for a more realistic momentum view.
📊 Linear Regression Signal: Smoother and more reactive trend analysis.
🎯 Dynamic Stdev Bands: Visualize ±1 and ±2 standard deviation thresholds for anomaly detection.
🌈 Custom Color Themes: Choose from built-in palettes or define your own bullish/bearish signal colors.
⚠️ Alert Conditions: Built-in alerts notify you of potential trend shifts across all signal modes.
📈 How It Works :
🧮 MACD Core: Uses volume-weighted price to generate fast and slow EMAs, forming the MACD and signal lines.
📉 Histogram Logic: Histogram is either the traditional MACD histogram or its linear regression version.
📊 Signal Modes:
• Linear Regression: Detect trend based on smoothed MACD behavior.
• Strong/Weak Trend: Identifies accelerating/decelerating trend strength.
• Volume MACD: Classic volume MACD behavior for divergence spotting.
📏 Stdev Bands: Calculated over a long period (default 200) to highlight statistically significant moves.
🎨 Color-coded Feedback: Bar and background colors adjust dynamically with market condition.
⚙️ Customization Options :
🔄 Choose your Signal Type from three unique analysis modes.
📏 Modify Fast/Slow/Signal lengths and Regression parameters to suit your strategy.
📈 Enable or disable Stdev Bands and adjust multiplier.
🎨 Select from Classic, Mystic, Accented, or Royal color palettes — or create your own.
📌 Use Cases :
🟢 Identify trend continuation or reversal zones with volume-adjusted signals.
🔴 Detect volatility breakouts using standard deviation bands.
🧭 Use in confluence with price structure, RSI, or market sentiment.
⚠️ Disclaimer :
This indicator is for educational purposes only. It is not financial advice. Always use in conjunction with your own research and risk management strategy.

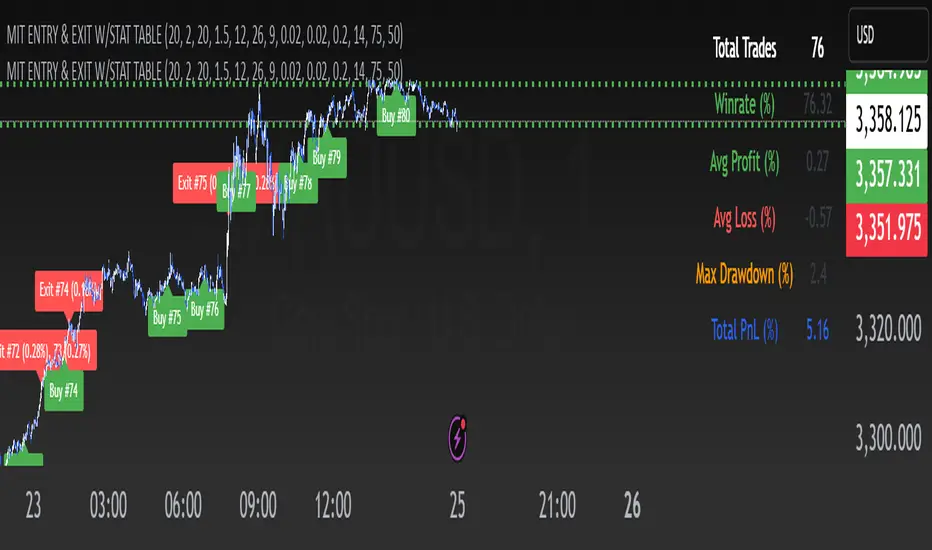
EMA Pullback Speed Strategy 📌 **Overview**
The **EMA Pullback Speed Strategy** is a trend-following approach that combines **price momentum** and **Exponential Moving Averages (EMA)**.
It aims to identify high-probability entry points during brief pullbacks within ongoing uptrends or downtrends.
The strategy evaluates **speed of price movement**, **relative position to dynamic EMA**, and **candlestick patterns** to determine ideal timing for entries.
One of the key concepts is checking whether the price has **“not pulled back too much”**, helping focus only on situations where the trend is likely to continue.
⚠️ This strategy is designed for educational and research purposes only. It does not guarantee future profits.
🧭 **Purpose**
This strategy addresses the common issue of **"jumping in too late during trends and taking unnecessary losses."**
By waiting for a healthy pullback and confirming signs of **trend resumption**, traders can enter with greater confidence and reduce false entries.
🎯 **Strategy Objectives**
* Enter in the direction of the prevailing trend to increase win rate
* Filter out false signals using pullback depth, speed, and candlestick confirmations
* Predefine Take-Profit (TP) and Stop-Loss (SL) levels for safer, rule-based trading
✨ **Key Features**
* **Dynamic EMA**: Reacts faster when price moves quickly, slower when market is calm – adapting to current momentum
* **Pullback Filter**: Avoids trades when price pulls back too far (e.g., more than 5%), indicating a trend may be weakening
* **Speed Check**: Measures how strongly the price returns to the trend using candlestick body speed (open-to-close range in ticks)
📊 **Trading Rules**
**■ Long Entry Conditions:**
* Current price is above the dynamic EMA (indicating uptrend)
* Price has pulled back toward the EMA (a "buy the dip" situation)
* Pullback depth is within the threshold (not excessive)
* Candlesticks show consecutive bullish closes and break the previous high
* Price speed is strong (positive movement with momentum)
**■ Short Entry Conditions:**
* Current price is below the dynamic EMA (indicating downtrend)
* Price has pulled back up toward the EMA (a "sell the rally" setup)
* Pullback is within range (not too deep)
* Candlesticks show consecutive bearish closes and break the previous low
* Price speed is negative (downward momentum confirmed)
**■ Exit Conditions (TP/SL):**
* **Take-Profit (TP):** Fixed 1.5% target above/below entry price
* **Stop-Loss (SL):** Based on recent price volatility, calculated using ATR × 4
💰 **Risk Management Parameters**
* Symbol & Timeframe: BTCUSD on 1-hour chart (H1)
* Test Capital: \$3000 (simulated account)
* Commission: 0.02%
* Slippage: 2 ticks (minimal execution lag)
* Max risk per trade: 5% of account balance
* Backtest Period: Aug 30, 2023 – May 9, 2025
* Profit Factor (PF): 1.965 (Net profit ÷ Net loss, including spreads & fees)
⚙️ **Trading Parameters & Indicator Settings**
* Maximum EMA Length: 50
* Accelerator Multiplier: 3.0
* Pullback Threshold: 5.0%
* ATR Period: 14
* ATR Multiplier (SL distance): 4.0
* Fixed TP: 1.5%
* Short-term EMA: 21
* Long-term EMA: 50
* Long Speed Threshold: ≥ 1000.0 (ticks)
* Short Speed Threshold: ≤ -1000.0 (ticks)
⚠️Adjustments are based on BTCUSD.
⚠️Forex and other currency pairs require separate adjustments.
🔧 **Strategy Improvements & Uniqueness**
Unlike basic moving average crossovers or RSI triggers, this strategy emphasizes **"momentum-supported pullbacks"**.
By combining dynamic EMA, speed checks, and candlestick signals, it captures trades **as if surfing the wave of a trend.**
Its built-in filters help **avoid overextended pullbacks**, which often signal the trend is ending – making it more robust than traditional trend-following systems.
✅ **Summary**
The **EMA Pullback Speed Strategy** is easy to understand, rule-based, and highly reproducible – ideal for both beginners and intermediate traders.
Because it shows **clear visual entry/exit points** on the chart, it’s also a great tool for practicing discretionary trading decisions.
⚠️ Past performance is not a guarantee of future results.
Always respect your Stop-Loss levels and manage your position size according to your risk tolerance.

Fibo Normalized RSI & RSI RibbonPlots both standard and Z-score normalized RSI ribbons using Fibonacci-based periods. Supports adjustable normalization, optional 0–100 scaling, and multi-line visualizations for momentum and deviation analysis.
This tool is designed for traders who want to go beyond standard RSI by adding:
Statistical normalization (Z-score)
Multi-period analysis (Fibonacci structure)
Advanced divergence and exhaustion detection
It gives you both classical momentum context and mathematically rigorous deviation insight, making it ideal for:
Swing traders
Quant-inclined discretionary traders
Multi-timeframe analysts
Trend Confirmation
When both RSI and normalized RSI across short and long periods are stacked in the same direction (e.g., above 50 or with high Z-scores), the trend is likely strong.
Disagreement between the two ribbons (e.g., RSI high but normalized RSI flat) may indicate late-stage trend or false strength.
Mean Reversion Trades
Look for normalized RSI values > +2 or < -2 (i.e., ~2 standard deviations).
Cross-check with standard RSI to see if the move aligns with a traditional overbought/oversold level.
Great for fade/reversal setups when Z-score RSI is extreme but classic RSI is just beginning to turn.
Divergence Detection
Compare the slope of RSI vs. normalized RSI over same period:
If RSI is rising but normalized RSI is falling → momentum is fading despite apparent strength.
Excellent for early warnings before reversals.
Multi-Timeframe Confluence
Use short-period ribbons (e.g., 3–13) for tactical entries/exits.
Use long-period ribbons (e.g., 55–233) for macro trend bias.
Alignment across both = high-confidence zone.

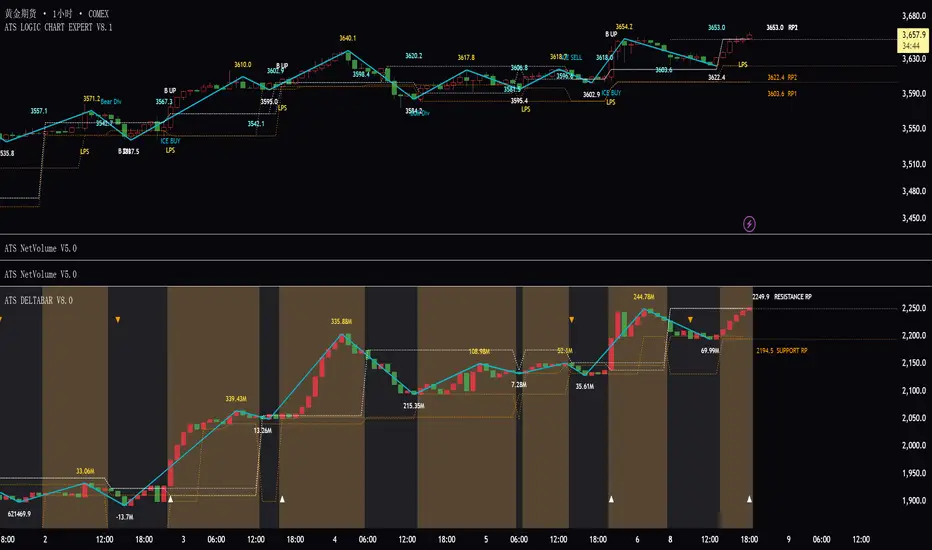
ATS DELTABAR V5.0ATS DeltaBar Indicator: Volume Trend Momentum Analysis System
——Precisely Capturing "Price-Volume Resonance" Signals for Trend Reversals
Core Positioning
The ATS DeltaBar is a sub-chart indicator focused on the synergy between volume trends and price action. It dynamically monitors changes in volume momentum and price deviations to identify trend strengthening, exhaustion, and reversal signals. Its core value lies in:
Red/Green Bars: Visually reflect volume increases/decreases, revealing capital flow direction.
Divergence Signals: Warn of potential trend reversals (top/bottom divergence).
Resonance Breakouts/Breakdowns: Confirm high-probability trend continuation signals.
Red/Green Zones: Clearly define bullish/bearish phases (red = bearish, green = bullish).
I. Core Logic & Algorithm
1. Volume Trend Visualization
Bar Color Volume State Market Implication
Green Bar Volume ↑ vs. prior period Capital inflow, trend momentum strengthens
Red Bar Volume ↓ vs. prior period Capital outflow, trend momentum weakens
Bar Height Magnitude of volume change Quantifies intensity (higher = stronger shift)
📌 Key Insight:
Green bars + rising price = Healthy uptrend.
Red bars + price新高 = Potential top divergence risk.
2. Divergence Detection
Top Divergence: Price makes higher highs, but DeltaBar peaks lower (red bars accumulate) → Bullish exhaustion.
Bottom Divergence: Price makes lower lows, but DeltaBar troughs rise (green bars accumulate) → Bearish exhaustion.
3. Resonance Signal System
Resonance Breakout: Price breaks resistance + DeltaBar green volume spike → Confirmed uptrend acceleration.
Resonance Breakdown: Price breaks support + DeltaBar red volume spike → Confirmed downtrend weakness.
4. Bullish/Bearish Zone划分
Green Zone: DeltaBar consistently above neutral line → Bullish dominance (favor longs).
Red Zone: DeltaBar consistently below neutral line → Bearish dominance (caution for downside).
II. Signal Types & Practical Applications
1. Basic Trading Signals
Signal Type DeltaBar Behavior Trading Suggestion
Green Zone + Green Bar Price & volume rise together Hold/add to longs
Red Zone + Red Bar Price & volume decline together Short/exit longs
Top Divergence Price ↑ + DeltaBar peaks ↓ (red bars) Reduce longs/test shorts
Bottom Divergence Price ↓ + DeltaBar troughs ↑ (green bars) Prepare for reversal/cover shorts
2. Advanced Resonance Strategies
Breakout Trade: Enter when price breaks a key level + DeltaBar shows green volume spike (resonance breakout) → High-probability long.
Breakdown Trade: Enter when price breaks support + DeltaBar shows red volume spike (resonance breakdown) → High-probability short.
III. Comparison with Traditional Indicators
Aspect Traditional Volume (e.g., OBV) ATS DeltaBar
Signal Dimension Single cumulative volume direction 3D analysis: divergence + resonance + zone划分
Visualization Monotonic curve Dynamic dual-color bars + zones + threshold lines
Practicality Lags price action Real-time捕捉 divergence/resonance points
IV. Usage Scenarios & Tips
1. Trend Following
In Green Zone: Price above MA + DeltaBar green bars expanding → Hold longs.
In Red Zone: Price below MA + DeltaBar red bars expanding → Stay short/avoid longs.
2. Reversal Trading
Top Divergence + Bearish candlestick (e.g., Evening Star) + red bars → Short.
Bottom Divergence + Bullish engulfing + green bars → Long.
3. Breakout Filtering
Only trade breakouts where price and DeltaBar confirm共振 (avoids false breakouts).
V. Case Study (BTC/USDT 1H Chart)
Successful Long: Price broke resistance + DeltaBar green volume spike → 15% rally.
Successful Short: Price consolidated with red bar accumulation (top divergence) → 8% drop.
VI.注意事项
Combine with price structure (support/resistance) for higher accuracy.
Prioritize divergence in ranging markets; focus on共振 signals in trending markets.
"Volume is the fuel of price" — ATS DeltaBar quantifies this relationship to pinpoint trend ignition and reversal points.
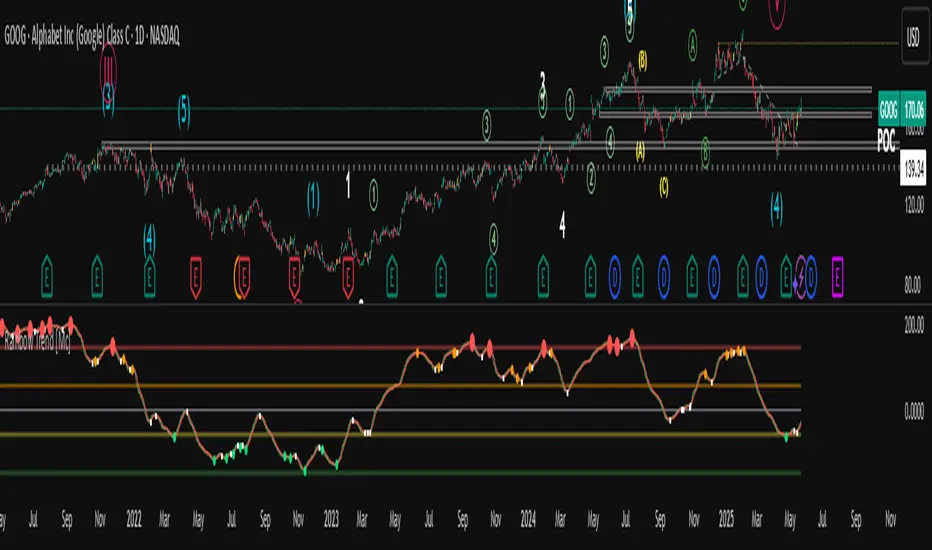
Rainbow Trend [Mc]1. Momentum-Based Foundation
This indicator measures the velocity and strength of price changes.
Rising momentum indicates that price movement (upward or downward) has strength behind it.
When momentum weakens or reverses, it often signals a potential trend reversal.
2. Long-Term Time Frame
Unlike traditional indicators like RSI or Stochastic, which use shorter lookback periods (e.g., 14 days), this indicator uses a much longer period, such as 50 to 200 days.
This extended range helps smooth out volatility and provides a clearer view of the primary trend.
3. Multicolored Gradient Lines
The indicator displays multi-layered colored curves, often with a rainbow-like gradient.
Red or pink areas indicate strong selling pressure or peak momentum in an uptrend.
Green or bright green dots often suggest recovery or bottoming momentum.
Orange or yellow colors indicate neutral or transition zones, awaiting trend confirmation.
4. Horizontal Levels (Overbought/Oversold Zones)
The chart includes reference levels such as +160, 0, -40, and -120 (as shown in the image).
These levels help identify when momentum is reaching overbought or oversold conditions.
Reversals often begin near the upper or lower extremes of these zones.
5. Reversal Signal Markers
Red dots at the top indicate extreme bullish momentum and potential topping zones.
Green dots at the bottom suggest oversold conditions and potential bullish reversals.
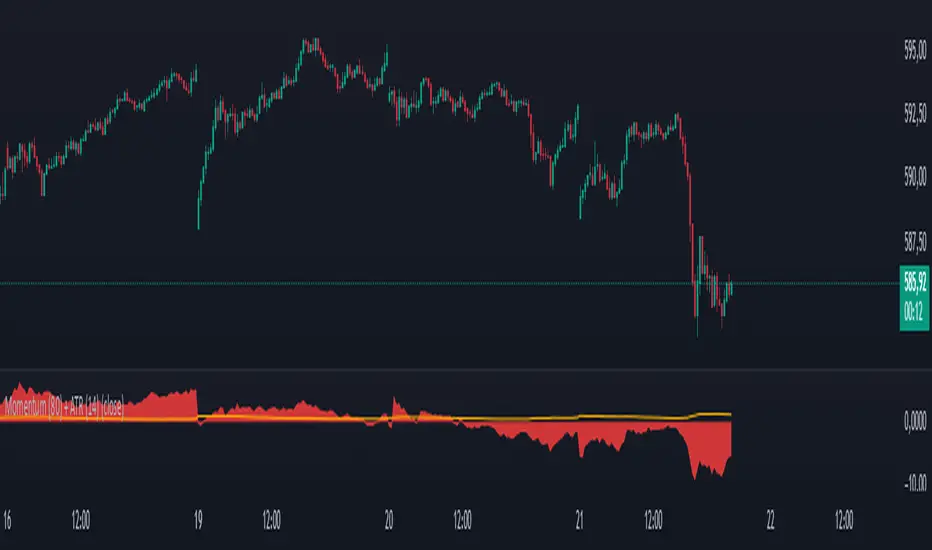
Momentum (80) + ATR (14)his indicator combines two essential technical analysis tools in a single panel for enhanced market insight:
🔹 Momentum (80 periods): Measures the difference between the current price and the price 80 bars ago. Displayed as a semi-transparent filled area, it helps to visually identify shifts in price momentum over a longer timeframe.
🔸 ATR (Average True Range, 14 periods): Shown as a fine orange line, the ATR represents average market volatility over 14 periods, highlighting phases of calm or increased price fluctuations.
By viewing both momentum and volatility simultaneously, traders can better assess trend strength and market conditions, improving decision-making across assets such as stocks, forex, and cryptocurrencies.
✅ Suitable for all asset types
✅ Complements other indicators like RSI, MACD, and Bollinger Bands
✅ Categorized under Momentum & Volatility indicators
Ultimate Scalping Tool[BullByte]Overview
The Ultimate Scalping Tool is an open-source TradingView indicator built for scalpers and short-term traders released under the Mozilla Public License 2.0. It uses a custom Quantum Flux Candle (QFC) oscillator to combine multiple market forces into one visual signal. In plain terms, the script reads momentum, trend strength, volatility, and volume together and plots a special “candlestick” each bar (the QFC) that reflects the overall market bias. This unified view makes it easier to spot entries and exits: the tool labels signals as Strong Buy/Sell, Pullback (a brief retracement in a trend), Early Entry, or Exit Warning . It also provides color-coded alerts and a small dashboard of metrics. In practice, traders see green/red oscillator bars and symbols on the chart when conditions align, helping them scalp or trend-follow without reading multiple separate indicators.
Core Components
Quantum Flux Candle (QFC) Construction
The QFC is the heart of the indicator. Rather than using raw price, it creates a candlestick-like bar from the underlying oscillator values. Each QFC bar has an “open,” “high/low,” and “close” derived from calculated momentum and volatility inputs for that period . In effect, this turns the oscillator into intuitive candle patterns so traders can recognize momentum shifts visually. (For comparison, note that Heikin-Ashi candles “have a smoother look because take an average of the movement”. The QFC instead represents exact oscillator readings, so it reflects true momentum changes without hiding price action.) Colors of QFC bars change dynamically (e.g. green for bullish momentum, red for bearish) to highlight shifts. This is the first open-source QFC oscillator that dynamically weights four non-correlated indicators with moving thresholds, which makes it a unique indicator on its own.
Oscillator Normalization & Adaptive Weights
The script normalizes its oscillator to a fixed scale (for example, a 0–100 range much like the RSI) so that various inputs can be compared fairly. It then applies adaptive weighting: the relative influence of trend, momentum, volatility or volume signals is automatically adjusted based on current market conditions. For instance, in very volatile markets the script might weight volatility more heavily, or in a strong trend it might give extra weight to trend direction. Normalizing data and adjusting weights helps keep the QFC sensitive but stable (normalization ensures all inputs fit a common scale).
Trend/Momentum/Volume/Volatility Fusion
Unlike a typical single-factor oscillator, the QFC oscillator fuses four aspects at once. It may compute, for example, a trend indicator (such as an ADX or moving average slope), a momentum measure (like RSI or Rate-of-Change), a volume-based pressure (similar to MFI/OBV), and a volatility measure (like ATR) . These different values are combined into one composite oscillator. This “multi-dimensional” approach follows best practices of using non-correlated indicators (trend, momentum, volume, volatility) for confirmation. By encoding all these signals in one line, a high QFC reading means that trend, momentum, and volume are all aligned, whereas a neutral reading might mean mixed conditions. This gives traders a comprehensive picture of market strength.
Signal Classification
The script interprets the QFC oscillator to label trades. For example:
• Strong Buy/Sell : Triggered when the oscillator crosses a high-confidence threshold (e.g. breaks clearly above zero with strong slope), indicating a well-confirmed move. This is like seeing a big green/red QFC candle aligned with the trend.
• Pullbacks : Identified when the trend is up but momentum dips briefly. A Pullback Buy appears if the overall trend is bullish but the oscillator has a short retracement – a typical buying opportunity in an uptrend. (A pullback is “a brief decline or pause in a generally upward price trend”.)
• Early Buy/Sell : Marks an initial swing in the oscillator suggesting a possible new trend, before it is fully confirmed. It’s a hint of momentum building (an early-warning signal), not as strong as the confirmed “Strong” signal.
• Exit Warnings : Issued when momentum peaks or reverses. For instance, if the QFC bars reach a high and start turning red/green opposite, the indicator warns that the move may be ending. In other words, a Momentum Peak is the point of maximum strength after which weakness may follow.
These categories correspond to typical trading concepts: Pullback (temporary reversal in an uptrend), Early Buy (an initial bullish cross), Strong Buy (confirmed bullish momentum), and Momentum Peak (peak oscillator value suggesting exhaustion).
Filters (DI Reversal, Dynamic Thresholds, HTF EMA/ADX)
Extra filters help avoid bad trades. A DI Reversal filter uses the +DI/–DI lines (from the ADX system) to require that the trend direction confirms the signal . For example, it might ignore a buy signal if the +DI is still below –DI. Dynamic Thresholds adjust signal levels on-the-fly: rather than fixed “overbought” lines, they move with volatility so signals happen under appropriate market stress. An optional High-Timeframe EMA or ADX filter adds a check against a larger timeframe trend: for instance, only taking a trade if price is above the weekly EMA or if weekly ADX shows a strong trend. (Notably, the ADX is “a technical indicator used by traders to determine the strength of a price trend”, so requiring a high-timeframe ADX avoids trading against the bigger trend.)
Dashboard Metrics & Color Logic
The Dashboard in the Ultimate Scalping Tool (UST) serves as a centralized information hub, providing traders with real-time insights into market conditions, trend strength, momentum, volume pressure, and trade signals. It is highly customizable, allowing users to adjust its appearance and content based on their preferences.
1. Dashboard Layout & Customization
Short vs. Extended Mode : Users can toggle between a compact view (9 rows) and an extended view (13 rows) via the `Short Dashboard` input.
Text Size Options : The dashboard supports three text sizes— Tiny, Small, and Normal —adjustable via the `Dashboard Text Size` input.
Positioning : The dashboard is positioned in the top-right corner by default but can be moved if modified in the script.
2. Key Metrics Displayed
The dashboard presents critical trading metrics in a structured table format:
Trend (TF) : Indicates the current trend direction (Strong Bullish, Moderate Bullish, Sideways, Moderate Bearish, Strong Bearish) based on normalized trend strength (normTrend) .
Momentum (TF) : Displays momentum status (Strong Bullish/Bearish or Neutral) derived from the oscillator's position relative to dynamic thresholds.
Volume (CMF) : Shows buying/selling pressure levels (Very High Buying, High Selling, Neutral, etc.) based on the Chaikin Money Flow (CMF) indicator.
Basic & Advanced Signals:
Basic Signal : Provides simple trade signals (Strong Buy, Strong Sell, Pullback Buy, Pullback Sell, No Trade).
Advanced Signal : Offers nuanced signals (Early Buy/Sell, Momentum Peak, Weakening Momentum, etc.) with color-coded alerts.
RSI : Displays the Relative Strength Index (RSI) value, colored based on overbought (>70), oversold (<30), or neutral conditions.
HTF Filter : Indicates the higher timeframe trend status (Bullish, Bearish, Neutral) when using the Leading HTF Filter.
VWAP : Shows the V olume-Weighted Average Price and whether the current price is above (bullish) or below (bearish) it.
ADX : Displays the Average Directional Index (ADX) value, with color highlighting whether it is rising (green) or falling (red).
Market Mode : Shows the selected market type (Crypto, Stocks, Options, Forex, Custom).
Regime : Indicates volatility conditions (High, Low, Moderate) based on the **ATR ratio**.
3. Filters Status Panel
A secondary panel displays the status of active filters, helping traders quickly assess which conditions are influencing signals:
- DI Reversal Filter: On/Off (confirms reversals before generating signals).
- Dynamic Thresholds: On/Off (adjusts buy/sell thresholds based on volatility).
- Adaptive Weighting: On/Off (auto-adjusts oscillator weights for trend/momentum/volatility).
- Early Signal: On/Off (enables early momentum-based signals).
- Leading HTF Filter: On/Off (applies higher timeframe trend confirmation).
4. Visual Enhancements
Color-Coded Cells : Each metric is color-coded (green for bullish, red for bearish, gray for neutral) for quick interpretation.
Dynamic Background : The dashboard background adapts to market conditions (bullish/bearish/neutral) based on ADX and DI trends.
Customizable Reference Lines : Users can enable/disable fixed reference lines for the oscillator.
How It(QFC) Differs from Traditional Indicators
Quantum Flux Candle (QFC) Versus Heikin-Ashi
Heikin-Ashi candles smooth price by averaging (HA’s open/close use averages) so they show trend clearly but hide true price (the current HA bar’s close is not the real price). QFC candles are different: they are oscillator values, not price averages . A Heikin-Ashi chart “has a smoother look because it is essentially taking an average of the movement”, which can cause lag. The QFC instead shows the raw combined momentum each bar, allowing faster recognition of shifts. In short, HA is a smoothed price chart; QFC is a momentum-based chart.
Versus Standard Oscillators
Common oscillators like RSI or MACD use fixed formulas on price (or price+volume). For example, RSI “compares gains and losses and normalizes this value on a scale from 0 to 100”, reflecting pure price momentum. MFI is similar but adds volume. These indicators each show one dimension: momentum or volume. The Ultimate Scalping Tool’s QFC goes further by integrating trend strength and volatility too. In practice, this means a move that looks strong on RSI might be downplayed by low volume or weak trend in QFC. As one source notes, using multiple non-correlated indicators (trend, momentum, volume, volatility) provides a more complete market picture. The QFC’s multi-factor fusion is unique – it is effectively a multi-dimensional oscillator rather than a traditional single-input one.
Signal Style
Traditional oscillators often use crossovers (RSI crossing 50) or fixed zones (MACD above zero) for signals. The Ultimate Scalping Tool’s signals are custom-classified: it explicitly labels pullbacks, early entries, and strong moves. These terms go beyond a typical indicator’s generic “buy”/“sell.” In other words, it packages a strategy around the oscillator, which traders can backtest or observe without reading code.
Key Term Definitions
• Pullback : A short-term dip or consolidation in an uptrend. In this script, a Pullback Buy appears when price is generally rising but shows a brief retracement. (As defined by Investopedia, a pullback is “a brief decline or pause in a generally upward price trend”.)
• Early Buy/Sell : An initial or tentative entry signal. It means the oscillator first starts turning positive (or negative) before a full trend has developed. It’s an early indication that a trend might be starting.
• Strong Buy/Sell : A confident entry signal when multiple conditions align. This label is used when momentum is already strong and confirmed by trend/volume filters, offering a higher-probability trade.
• Momentum Peak : The point where bullish (or bearish) momentum reaches its maximum before weakening. When the oscillator value stops rising (or falling) and begins to reverse, the script flags it as a peak – signaling that the current move could be overextended.
What is the Flux MA?
The Flux MA (Moving Average) is an Exponential Moving Average (EMA) applied to a normalized oscillator, referred to as FM . Its purpose is to smooth out the fluctuations of the oscillator, providing a clearer picture of the underlying trend direction and strength. Think of it as a dynamic baseline that the oscillator moves above or below, helping you determine whether the market is trending bullish or bearish.
How it’s calculated (Flux MA):
1.The oscillator is normalized (scaled to a range, typically between 0 and 1, using a default scale factor of 100.0).
2.An EMA is applied to this normalized value (FM) over a user-defined period (default is 10 periods).
3.The result is rescaled back to the oscillator’s original range for plotting.
Why it matters : The Flux MA acts like a support or resistance level for the oscillator, making it easier to spot trend shifts.
Color of the Flux Candle
The Quantum Flux Candle visualizes the normalized oscillator (FM) as candlesticks, with colors that indicate specific market conditions based on the relationship between the FM and the Flux MA. Here’s what each color means:
• Green : The FM is above the Flux MA, signaling bullish momentum. This suggests the market is trending upward.
• Red : The FM is below the Flux MA, signaling bearish momentum. This suggests the market is trending downward.
• Yellow : Indicates strong buy conditions (e.g., a "Strong Buy" signal combined with a positive trend). This is a high-confidence signal to go long.
• Purple : Indicates strong sell conditions (e.g., a "Strong Sell" signal combined with a negative trend). This is a high-confidence signal to go short.
The candle mode shows the oscillator’s open, high, low, and close values for each period, similar to price candlesticks, but it’s the color that provides the quick visual cue for trading decisions.
How to Trade the Flux MA with Respect to the Candle
Trading with the Flux MA and Quantum Flux Candle involves using the MA as a trend indicator and the candle colors as entry and exit signals. Here’s a step-by-step guide:
1. Identify the Trend Direction
• Bullish Trend : The Flux Candle is green and positioned above the Flux MA. This indicates upward momentum.
• Bearish Trend : The Flux Candle is red and positioned below the Flux MA. This indicates downward momentum.
The Flux MA serves as the reference line—candles above it suggest buying pressure, while candles below it suggest selling pressure.
2. Interpret Candle Colors for Trade Signals
• Green Candle : General bullish momentum. Consider entering or holding a long position.
• Red Candle : General bearish momentum. Consider entering or holding a short position.
• Yellow Candle : A strong buy signal. This is an ideal time to enter a long trade.
• Purple Candle : A strong sell signal. This is an ideal time to enter a short trade.
3. Enter Trades Based on Crossovers and Colors
• Long Entry : Enter a buy position when the Flux Candle turns green and crosses above the Flux MA. If it turns yellow, this is an even stronger signal to go long.
• Short Entry : Enter a sell position when the Flux Candle turns red and crosses below the Flux MA. If it turns purple, this is an even stronger signal to go short.
4. Exit Trades
• Exit Long : Close your buy position when the Flux Candle turns red or crosses below the Flux MA, indicating the bullish trend may be reversing.
• Exit Short : Close your sell position when the Flux Candle turns green or crosses above the Flux MA, indicating the bearish trend may be reversing.
•You might also exit a long trade if the candle changes from yellow to green (weakening strong buy signal) or a short trade from purple to red (weakening strong sell signal).
5. Use Additional Confirmation
To avoid false signals, combine the Flux MA and candle signals with other indicators or dashboard metrics (e.g., trend strength, momentum, or volume pressure). For example:
•A yellow candle with a " Strong Bullish " trend and high buying volume is a robust long signal.
•A red candle with a " Moderate Bearish " trend and neutral momentum might need more confirmation before shorting.
Practical Example
Imagine you’re scalping a cryptocurrency:
• Long Trade : The Flux Candle turns yellow and is above the Flux MA, with the dashboard showing "Strong Buy" and high buying volume. You enter a long position. You exit when the candle turns red and dips below the Flux MA.
• Short Trade : The Flux Candle turns purple and crosses below the Flux MA, with a "Strong Sell" signal on the dashboard. You enter a short position. You exit when the candle turns green and crosses above the Flux MA.
Market Presets and Adaptation
This indicator is designed to work on any market with candlestick price data (stocks, crypto, forex, indices, etc.). To handle different behavior, it provides presets for major asset classes. Selecting a “Stocks,” “Crypto,” “Forex,” or “Options” preset automatically loads a set of parameter values optimized for that market . For example, a crypto preset might use a shorter lookback or higher sensitivity to account for crypto’s high volatility, while a stocks preset might use slightly longer smoothing since stocks often trend more slowly. In practice, this means the same core QFC logic applies across markets, but the thresholds and smoothing adjust so signals remain relevant for each asset type.
Usage Guidelines
• Recommended Timeframes : Optimized for 1 minute to 15 minute intraday charts. Can also be used on higher timeframes for short term swings.
• Market Types : Select “Crypto,” “Stocks,” “Forex,” or “Options” to auto tune periods, thresholds and weights. Use “Custom” to manually adjust all inputs.
• Interpreting Signals : Always confirm a signal by checking that trend, volume, and VWAP agree on the dashboard. A green “Strong Buy” arrow with green trend, green volume, and price > VWAP is highest probability.
• Adjusting Sensitivity : To reduce false signals in fast markets, enable DI Reversal Confirmation and Dynamic Thresholds. For more frequent entries in trending environments, enable Early Entry Trigger.
• Risk Management : This tool does not plot stop loss or take profit levels. Users should define their own risk parameters based on support/resistance or volatility bands.
Background Shading
To give you an at-a-glance sense of market regime without reading numbers, the indicator automatically tints the chart background in three modes—neutral, bullish and bearish—with two levels of intensity (light vs. dark):
Neutral (Gray)
When ADX is below 20 the market is considered “no trend” or too weak to trade. The background fills with a light gray (high transparency) so you know to sit on your hands.
Bullish (Green)
As soon as ADX rises above 20 and +DI exceeds –DI, the background turns a semi-transparent green, signaling an emerging uptrend. When ADX climbs above 30 (strong trend), the green becomes more opaque—reminding you that trend-following signals (Strong Buy, Pullback) carry extra weight.
Bearish (Red)
Similarly, if –DI exceeds +DI with ADX >20, you get a light red tint for a developing downtrend, and a darker, more solid red once ADX surpasses 30.
By dynamically varying both hue (green vs. red vs. gray) and opacity (light vs. dark), the background instantly communicates trend strength and direction—so you always know whether to favor breakout-style entries (in a strong trend) or stay flat during choppy, low-ADX conditions.
The setup shown in the above chart snapshot is BTCUSD 15 min chart : Binance for reference.
Disclaimer
No indicator guarantees profits. Backtest or paper trade this tool to understand its behavior in your market. Always use proper position sizing and stop loss orders.
Good luck!
- BullByte

SuperSmoothed Volume Zone Oscillator------------------------------------------------------------------------------------
SUPERSMOOTHED VOLUME ZONE OSCILLATOR (SSVZO)
TECHNICAL INDICATOR DOCUMENTATION
------------------------------------------------------------------------------------
Table of Contents:
1. Original VZO Background
2. SuperSmoother Technology
3. SSVZO Components
3.1. Main SSVZO Oscillator
3.2. Momentum Velocity Component
3.3. Adaptive Levels
3.4. Static Levels
3.5. Trend Shift Detection
3.6. Glow Effect Visualization
4. References & Further Reading
------------------------------------------------------------------------------------
1. ORIGINAL VOLUME ZONE OSCILLATOR (VZO) BACKGROUND
------------------------------------------------------------------------------------
Creator: Walid Khalil (November 2009, Technical Analysis of Stocks & Commodities)
History: Khalil designed the VZO to address limitations in other volume indicators
by focusing on the relative balance between buying and selling volume while filtering
out market noise. The indicator identifies accumulation and distribution patterns.
Traditional Usage: The classic VZO uses a 14-period calculation setting and is
interpreted on a scale from -60% to +60%:
- Readings above +40% indicate strong buying pressure (potential overbought)
- Readings below -40% indicate strong selling pressure (potential oversold)
- The zero line acts as a key reference for trend changes
- Divergences between VZO and price offer valuable trading signals
Difference from Other Volume Indicators: Unlike simple volume indicators that only
track total volume, the VZO tracks the relative difference between up-volume and
down-volume, more effectively identifying buying/selling pressure imbalances and
potential reversal points.
------------------------------------------------------------------------------------
2. SUPERSMOOTHER FILTER TECHNOLOGY
------------------------------------------------------------------------------------
Creator: John F. Ehlers, an engineer specializing in digital signal processing for
trading systems.
Origins: Introduced in "Rocket Science for Traders" (2001) and refined in "Cybernetic
Analysis for Stocks and Futures" (2004). Represents the application of digital signal
processing techniques to financial markets.
Technical Foundation: The SuperSmoother is a two-pole low-pass filter specifically
designed to eliminate noise while preserving the underlying signal. It combines
principles of Butterworth and Gaussian filters to minimize both phase shift and
passband ripple.
Mathematical Implementation:
a1 = exp(-π * sqrt(2) / period)
b1 = 2 * a1 * cos(sqrt(2) * π / period)
c2 = b1
c3 = -a1²
c1 = 1 - c2 - c3
Advantages Over Traditional Filters:
- Reduces lag compared to simple moving averages
- Eliminates high-frequency market noise more effectively
- Minimizes unwanted ripples in the output signal
- Preserves important turning points in the data
- Superior handling of sudden market movements
According to Ehlers: "Conventional moving averages are plagued by excessive lag and/or
rippling in their passband. The SuperSmoother eliminates virtually all of this ripple
and has excellent transient response characteristics." (TASC Magazine, 2014)
------------------------------------------------------------------------------------
3. SSVZO COMPONENTS
------------------------------------------------------------------------------------
3.1. MAIN SSVZO OSCILLATOR
------------------------------------------------------------------------------------
Description: The core component measuring buying vs. selling volume pressure using
the SuperSmoother filter for enhanced noise reduction.
Calculation: SSVZO analyzes the relationship between up-volume (volume on rising
prices) and down-volume (volume on falling prices), applying exponential moving
averages to both components, then calculating their relative strength. The
SuperSmoother filter reduces market noise while preserving the underlying trend signal.
Implementation Advantage: By applying the SuperSmoother filter to the VZO calculation,
the SSVZO provides significantly cleaner signals with fewer false crossovers and more
accurate identification of true trend changes.
Interpretation:
- Values above zero indicate bullish volume dominance
- Values below zero indicate bearish volume dominance
- Readings above +60 suggest overbought conditions
- Readings below -60 suggest oversold conditions
- Crossovers of the zero line signal potential trend changes
Trading Application: Use SSVZO as a primary volume-based momentum indicator to
confirm price trends, identify divergences, and spot potential reversal zones.
------------------------------------------------------------------------------------
3.2. MOMENTUM VELOCITY COMPONENT
------------------------------------------------------------------------------------
Description: A histogram displaying the rate of change of momentum, showing how
quickly buying or selling pressure is accelerating or decelerating.
Calculation: Derived from price momentum over a user-defined period, with optional
adaptive filtering that adjusts sensitivity based on market volatility. The velocity
component shows the first derivative of momentum – essentially the "acceleration" of
market movement.
Technical Origin: Inspired by Ehlers' work on Hilbert Transforms and research on
cyclic components in financial markets, as detailed in "Cycle Analytics for Traders"
(2013).
Interpretation:
- Positive readings (teal bars) indicate accelerating upward momentum
- Negative readings (orange bars) suggest accelerating downward momentum
- Larger bars indicate stronger momentum acceleration
- Shrinking bars signal momentum deceleration
Trading Application: Use as an early warning system for potential trend exhaustion
or confirmation of a new trending move. When momentum velocity diverges from price,
it often precedes a reversal.
------------------------------------------------------------------------------------
3.3. ADAPTIVE LEVELS
------------------------------------------------------------------------------------
Description: Dynamic overbought and oversold boundaries that adjust to market
conditions, providing context-aware trading signals.
Calculation: Uses statistical methods based on the standard deviation of the SSVZO
values over a longer period. These levels automatically widen during higher volatility
periods and narrow during consolidation.
Research Base: Draws from Perry Kaufman's work on Adaptive Moving Averages (AMA) and
Bollinger's research on dynamic volatility bands, as published in "Trading Systems
and Methods" (2013).
Interpretation:
- Adaptive Overbought (dotted circles above): Dynamic ceiling that expands/contracts
based on market volatility
- Adaptive Oversold (dotted circles below): Dynamic floor that expands/contracts based
on market volatility
Trading Application: More reliable for identifying extremes than static levels,
particularly in changing market conditions or different instruments. Touching these
levels often provides higher-probability reversal signals.
------------------------------------------------------------------------------------
3.4. STATIC LEVELS
------------------------------------------------------------------------------------
Description: Fixed overbought and oversold horizontal lines that provide consistent
reference points for excess market conditions.
Calculation: Preset at +60 (overbought) and -60 (oversold) based on historical
analysis of volume behavior across multiple markets, extending the classic VZO range.
Interpretation:
- Readings above +60 suggest potential buying exhaustion
- Readings below -60 indicate potential selling exhaustion
- Duration spent beyond these levels correlates with reversal probability
Trading Application: Use as baseline reference points for extreme conditions. Most
effective when combined with other confirmation signals like divergences or
candlestick patterns.
------------------------------------------------------------------------------------
3.5. TREND SHIFT DETECTION
------------------------------------------------------------------------------------
Description: Visual markers and optional background shading highlighting potential
trend changes when the SSVZO crosses the zero line.
Calculation: Based on mathematical crossovers of the SSVZO value above or below the
zero line, with pattern recognition to reduce false signals.
Research Foundation: Incorporates concepts from Dr. Alexander Elder's "triple screen
trading system" and Mark Chaikin's volume-based trend identification research.
Interpretation:
- Upward triangles indicate bullish trend shifts (SSVZO crossing above zero)
- Downward triangles indicate bearish trend shifts (SSVZO crossing below zero)
- Background shading emphasizes the new trend direction
Trading Application: These signals often precede price trend changes and can serve
as entry triggers when aligned with the higher timeframe trend.
------------------------------------------------------------------------------------
3.6. GLOW EFFECT VISUALIZATION
------------------------------------------------------------------------------------
Description: An aesthetic enhancement creating a gradient "glow" around the main SSVZO
line, improving visual clarity and emphasizing signal strength.
Calculation: Generated using percentage-based bands around the main SSVZO value, with
multiple translucent layers to create a subtle illumination effect.
Design Inspiration: Inspired by modern UI/UX design principles for financial
dashboards and the MATS (Moving Average Trend Sniper) indicator's visual presentation,
enhancing perception of signal strength through visual intensity.
Interpretation:
- Teal glow indicates positive SSVZO values (bullish)
- Orange glow indicates negative SSVZO values (bearish)
- Glow intensity correlates with the strength of the signal
Trading Application: Beyond aesthetics, the glow creates visual emphasis that makes
trend direction, strength, and changes more immediately apparent, particularly useful
during fast-moving market conditions.
------------------------------------------------------------------------------------
4. REFERENCES & FURTHER READING
------------------------------------------------------------------------------------
1. Ehlers, J. F. (2001). "Rocket Science for Traders: Digital Signal Processing
Applications." John Wiley & Sons.
2. Ehlers, J. F. (2004). "Cybernetic Analysis for Stocks and Futures: Cutting-Edge
DSP Technology to Improve Your Trading." John Wiley & Sons.
3. Ehlers, J. F. (2013). "Cycle Analytics for Traders: Advanced Technical Trading
Concepts." John Wiley & Sons.
4. Khalil, W. (2009). "The Volume Zone Oscillator." Technical Analysis of Stocks &
Commodities, November 2009.
5. Kaufman, P. J. (2013). "Trading Systems and Methods." 5th Edition, Wiley Trading.
6. Elder, A. (2002). "Come Into My Trading Room: A Complete Guide to Trading."
John Wiley & Sons.
7. Bollinger, J. (2002). "Bollinger on Bollinger Bands." McGraw-Hill Education.
------------------------------------------------------------------------------------
END OF DOCUMENTATION
------------------------------------------------------------------------------------

[blackcat] L2 Angle Trend TrackerOVERVIEW
The " L2 Angle Trend Tracker" is a sophisticated technical analysis tool designed to monitor trend direction and momentum using multiple Exponential Moving Averages (EMAs) with different periods. 📈 This script calculates the angles of 5 EMAs (5, 8, 10, 12, and 15 periods) and displays them with gradient colors, providing a comprehensive view of market momentum. When all EMAs cross above or below specified threshold levels, it generates Buy or Sell signals with visual alerts. The indicator helps traders identify trend reversals, potential entry/exit points, and market sentiment shifts with precision. 🚀 This powerful tool is particularly useful for traders who want to combine multiple timeframe analysis with angle-based momentum confirmation.
FEATURES
Calculates angles for 5 EMAs with customizable periods (5, 8, 10, 12, and 15)
Displays angle values with distinct colors for each EMA (Green, Blue, Purple, Orange, and Red)
Generates Buy signals when all EMAs cross above the lower threshold
Generates Sell signals when all EMAs cross below the upper threshold
Shows a zero line and threshold lines for easy reference
Customizable threshold levels for Buy/Sell signals
Visual alerts with "Buy" and "Sell" labels at the point of signal generation
The script uses a mathematical formula to calculate the angle of each EMA relative to its position 11 bars ago
Angle values are converted from radians to degrees for easier interpretation
The zero line represents no change in the EMA angle
The indicator is not overlayed on the price chart by default, but can be adjusted in the script settings 📊
HOW TO USE
Adjust the EMA periods to match your trading strategy 🛠️
Shorter periods (5, 8) are more sensitive to price changes
Longer periods (10, 12, 15) provide smoother trend confirmation
Set appropriate threshold values for Buy/Sell signals based on your risk tolerance
Default thresholds are 70 for upper threshold and -70 for lower threshold
Consider adjusting thresholds based on market volatility
Watch for Buy signals when all EMAs cross above the lower threshold (default: -70)
The signal appears as a green "Buy" label on the chart
This indicates a potential trend reversal to the upside
Watch for Sell signals when all EMAs cross below the upper threshold (default: 70)
The signal appears as a red "Sell" label on the chart
This indicates a potential trend reversal to the downside
Combine with other indicators for confirmation before making trading decisions 🧠
Consider using volume confirmation, support/resistance levels, or other oscillators
The angle tracker works well with trend-following strategies
Use the angle values to gauge momentum strength
Steeper angles indicate stronger momentum
Flatter angles suggest weakening momentum or consolidation
CONFIGURATION
EMA Periods: The script uses five different EMA periods that can be customized:
EMA Period 5: Short-term trend indicator
EMA Period 8: Medium-short term trend indicator
EMA Period 10: Medium-term trend indicator
EMA Period 12: Medium-long term trend indicator
EMA Period 15: Long-term trend indicator
Threshold Settings:
Threshold Top: Sets the upper boundary for Sell signals (default: 70)
Threshold Bot: Sets the lower boundary for Buy signals (default: -70)
These thresholds can be adjusted based on market conditions and trading style
LIMITATIONS
The script may generate false signals in ranging markets or during periods of high volatility
All EMAs must cross the threshold for a signal to appear, which may filter some valid signals
The angle calculation uses a 11-bar lookback period, which may not be suitable for all timeframes
Works best in trending markets and may produce whipsaws in choppy conditions ⚠️
The indicator is more effective on higher timeframes (4H, 1D) than on very short timeframes (1M, 5M)
Signal generation requires confirmation from multiple EMAs, which may delay entry/exit points
The angle calculation method may not be suitable for all financial instruments
ADVANCED TIPS
Use multiple instances of this indicator with different EMA settings for multi-timeframe analysis
Combine with volume analysis to confirm the strength of signals
Look for confluence with support and resistance levels for more reliable signals
Consider using the angle values as a filter for other trading strategies
The indicator can be used to identify momentum exhaustion points when angles flatten
For swing trading, consider using the Buy and Sell signals as potential entry/exit points
For day trading, you may want to use shorter EMA periods and adjust threshold values accordingly
NOTES
The script uses a mathematical formula to calculate the angle of each EMA relative to its position 11 bars ago
The angle values are converted from radians to degrees for easier interpretation
The zero line represents no change in the EMA angle
The indicator is not overlayed on the price chart by default, but can be adjusted in the script settings 📊
The angle calculation provides a dynamic view of momentum that traditional moving averages don't offer
The threshold values are based on empirical testing and can be fine-tuned for specific instruments
THANKS
Special thanks to the TradingView community for their support and feedback on this indicator. If you find this script helpful, please consider leaving a comment or sharing your experiences with it. Your feedback helps improve the tool for everyone. 🙏
Also, a nod to the original concept developers who pioneered angle-based trend analysis. This script builds upon those foundational ideas to provide a more comprehensive view of market momentum. 🌟

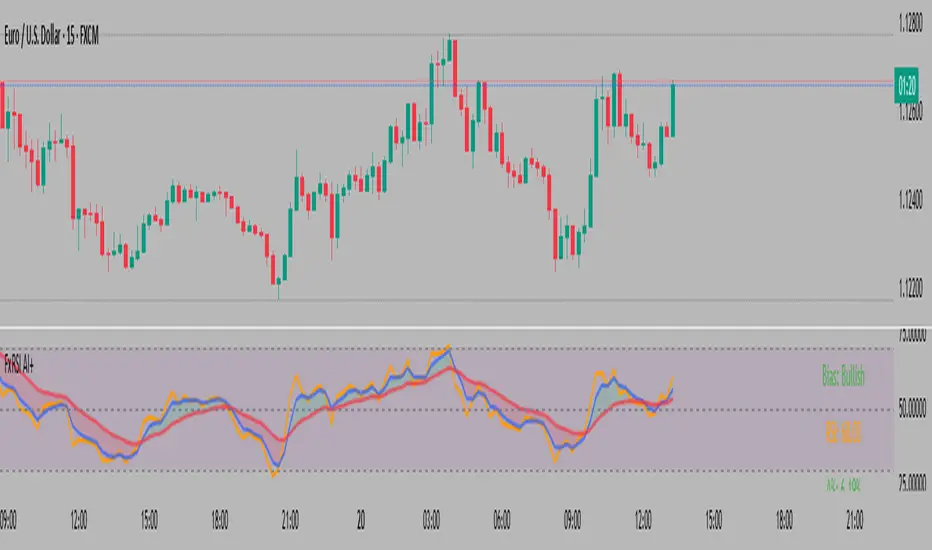
FxAST RSI Enhanced Plus [ALLDYN]
## 🟩 FxAST RSI Enhanced — Smoothed RSI Momentum with Dynamic Confluence Table
### 🔹 WHAT THIS SCRIPT DOES
This RSI enhancement script builds upon the classic Relative Strength Index by integrating:
* A **dual-layer EMA smoothing system** for RSI, allowing traders to observe fast vs. slow RSI movements
* **Real-time crossover signals** to detect early momentum shifts
* **Buy/Sell label plotting** when smoothed RSI crosses over/under with configurable thresholds
* An **optional smoothing toggle** to switch between swing and intraday trading styles
### 🔹 HOW IT WORKS
* RSI is calculated using a classic `rma` approach
* The script applies two separate EMAs (configurable lengths) to the RSI, serving as fast/slow signal lines
* Buy/Sell signals are generated when:
* The fast EMA crosses above the slow EMA (Buy) and RSI is above 40
* The fast EMA crosses below the slow EMA (Sell) and RSI is below 60
* RSI line, smoothed EMAs, and their fill are plotted for visual confirmation
**Original Feature** *(highlighting IP for protection)*:
A **confluence table** dynamically summarizes:
* The RSI fast/slow values
* The % delta between the smoothed EMAs
* A **directional bias reading** : Bullish, Bearish, or Neutral based on RSI behavior
* All values are color-coded and updated in real time to assist in fast market assessment
This table replaces cluttered on-chart signals with a **clean, structured summary** of RSI state and direction — ideal for both scalpers and swing traders.
### 🔹 HOW TO USE
1. Add the script to your chart (non-overlay).
2. Configure RSI/EMA lengths for your strategy (default: RSI 14, Fast EMA 3, Slow EMA 13).
3. Toggle “Smooth RSI?”:
* `ON` = For swing traders (smoother, slower signals)
* `OFF` = For intraday/momentum scalping (raw signals)
4. Use the **Buy/Sell labels** and **bias table** as confirmation tools, not sole entry triggers.
5. Alerts are available for both Buy and Sell crossover conditions.
### 🔹 WHAT MAKES IT ORIGINAL
While traditional RSI indicators only show the raw line or apply basic levels (30/70), this script offers:
* A **modular RSI smoothing engine** that adapts to swing or intraday preferences
* A **dual-EMA logic structure** for signal reliability
* A **real-time RSI bias assessment table**, designed to visualize RSI-based trend bias and magnitude
* The entire presentation is **decluttered** , avoiding redundant overlays while improving decision-making through the integrated data table
This script does not simply restyle RSI — it **restructures how RSI behavior is interpreted** , offering an objective confluence framework built around RSI’s smoothed motion and delta tracking.
---
Combo RSI + MACD + ADX MTF (Avec Alertes)✅ Recommended Title:
Multi-Signal Oscillator: ADX Trend + DI + RSI + MACD (MTF, Cross Alerts)
✅ Detailed Description
📝 Overview
This indicator combines advanced technical analysis tools to identify trend direction, capture reversals, and filter false signals.
It includes:
ADX (Multi-TimeFrame) for trend and trend strength detection.
DI+ / DI- for directional bias.
RSI + ZLSMA for oscillation analysis and divergence detection.
Zero-Lag Normalized MACD for momentum and entry timing.
⚙️ Visual Components
✅ Green/Red Background: Displays overall trend based on Multi-TimeFrame ADX.
✅ DI+ / DI- Lines: Green and red curves showing directional bias.
✅ Normalized RSI: Blue oscillator with orange ZLSMA smoothing.
✅ Zero-Lag MACD: Violet or fuchsia/orange oscillator depending on the version.
✅ Crossover Points: Colored circles marking buy and sell signals.
✅ ADX Strength Dots: Small black dots when ADX exceeds the strength threshold.
🚨 Included Alert System
✅ RSI / ZLSMA Crossovers (Buy / Sell).
✅ MACD / Signal Line Crossovers (Buy / Sell).
✅ DI+ / DI- Crossovers (Buy / Sell).
✅ Double Confirmation DI+ / RSI or DI+ / MACD.
✅ Double Confirmation DI- / RSI or DI- / MACD.
✅ Trend Change Alerts via Background Color.
✅ ADX Strength Alerts (Above Threshold).
🛠️ Suggested Configuration Examples
1. Short-Term Reversal Detection:
RSI Length: 7 to 14
ZLSMA Length: 7 to 14
MACD Fast/Slow: 5 / 13
ADX MTF Period: 5 to 15
ADX Threshold: 15 to 20
2. Long-Term Trend Following:
RSI Length: 21 to 30
ZLSMA Length: 21 to 30
MACD Fast/Slow: 12 / 26
ADX MTF Period: 30 to 50
ADX Threshold: 20 to 25
3. Scalping / Day Trading:
RSI Length: 5 to 9
ZLSMA Length: 5 to 9
MACD Fast/Slow: 3 / 7
ADX MTF Period: 5 to 10
ADX Threshold: 10 to 15
🎯 Why Use This Tool?
Filters false signals using ADX-based background coloring.
Provides multi-source alerting (RSI, MACD, ADX).
Helps identify true market strength zones.
Works on all markets: Forex, Crypto, Stocks, Indices.

Momentum TrackerDescription
To screen for momentum movers, one can filter for stocks that have made a noticeable move over a set period. This initial move defines the momentum or swing move. From this list of candidates, we can create a watchlist by selecting those showing a momentum pause, such as a pullback or consolidation, which later could set up for a continuation.
Momentum = Magnitude × Time
This Momentum Tracker indicator serves as a study tool to visualize when stocks historically met these momentum conditions. It marks on the chart where a stock would have appeared on the screener, allowing us to review past momentum patterns and screener requirements. The indicator measures momentum in three different ways:
Normalized Momentum
Identifies when the current price reaches a new high or low compared to a historical window. This is the most standardized measurement and adapts well across markets.
Normalized = Current Price ≥ Maximum Price in Lookback
Normalized = Current Price ≤ Minimum Price in Lookback
Relative Momentum
Measures the percentage difference between a fast and a slow moving average. This method helps capture acceleration, the rate at which momentum is building over time.
Relative = |Fast MA − Slow MA| ÷ Slow MA × 100
Absolute Momentum
Measures how far price has moved from the highest or lowest point within a defined lookback period.
Absolute = (Current Price − Lowest Price) ÷ Lowest Price × 100
Absolute = (Highest Price − Current Price) ÷ Highest Price × 100
Customization
The tool is customizable in terms of lookback period and thresholds to accommodate different trading styles and timeframes, allowing users to set criteria that align with specific hold times and momentum requirements. While the various calculations can be enabled, the tool is best used in isolation of each to visualize different momentum conditions.

Buy/Sell Ei - Premium Edition (Fixed Momentum)**📈 Buy/Sell Ei Indicator - Smart Trading System with Price Pattern Detection 📉**
**🔍 What is it?**
The **Buy/Sell Ei** indicator is a professional tool designed to identify **buy and sell signals** based on a combination of **candlestick patterns** and **moving averages**. With high accuracy, it pinpoints optimal entry and exit points in **both bullish and bearish trends**, making it suitable for forex pairs, stocks, and cryptocurrencies.
---
### **🌟 Key Features:**
✅ **Advanced Candlestick Pattern Detection**
✅ **Momentum Filter (Customizable consecutive candle count)**
✅ **Live Trade Mode (Instant signals for active trading)**
✅ **Dual MA Support (Fast & Slow MA with multiple types: SMA, EMA, WMA, VWMA)**
✅ **Date Filter (Focus on specific trading periods)**
✅ **Win/Loss Tracking (Performance analytics with success rate)**
---
### **🚀 Why Choose Buy/Sell Ei?**
✔ **Precision:** Reduces false signals with strict pattern rules.
✔ **Flexibility:** Works in both live trading and backtesting modes.
✔ **User-Friendly:** Clear labels and alerts for easy decision-making.
✔ **Adaptive:** Compatible with all timeframes (M1 to Monthly).
---
### **🛠 How It Works:**
1. **Trend Confirmation:** Uses MAs to filter trades in the trend’s direction.
2. **Pattern Recognition:** Detects "Ready to Buy/Sell" and confirmed signals.
3. **Momentum Check:** Optional filter for consecutive bullish/bearish candles.
4. **Live Alerts:** Labels appear instantly in Live Trade Mode.
---
### **📊 Ideal For:**
- **Day Traders** (Scalping & Intraday)
- **Swing Traders** (Medium-term setups)
- **Technical Analysts** (Backtesting strategies)
**🔧 Designed by Sahar Chadri | Optimized for TradingView**
**🎯 Trade Smarter, Not Harder!**

Polarity-VoVix Fusion Index (PVFI) Polarity-VoVix Fusion Index (PVFI) - Order Flow and Volatility Regime Detector
The PVFI is a next-generation indicator that fuses the Order Flow Polarity Index (OFPI) with a proprietary VoVix Volume Delta (VVD) engine. This tool is designed for traders who want to see not just how much volume is trading, but who is in control and how volatility is shifting beneath the surface.
What Makes PVFI Standout from the rest?
- Dual Engine: PVFI combines two advanced signals:
* OFPI: Measures real-time buy/sell pressure using candle body position and volume, then smooths it with a T3 moving average for clarity and responsiveness.
* VVD: Captures the "volatility of volume delta" - a normalized, memory-boosted measure of aggressive buying/selling, with a custom non-linear clamp for organic, non-pegged signals.
- Visual Clarity: Neon-glow OFPI line and shadowed, color-gradient VVD area make regime shifts and momentum instantly visible.
- Adaptive Dashboard: Toggle between a full-featured dashboard (desktop) and a compact info line (mobile) for seamless use on any device.
- Universal: Works on any asset - crypto, stocks, futures, forex - and any timeframe.
- No Chart Clutter: Clean, modern visuals and toggles for a pro look.
Inputs:
OFPI Lookback Length (ofpi_len): Sets the window for order flow pressure calculation. Shorter = more sensitive, longer = smoother. For scalping, try 5-10. For swing trading, 15-30. Crypto often benefits from shorter windows due to volatility.
OFPI T3 Smoothing Length (t3_len): Controls the smoothness of the OFPI line. Lower = more responsive, higher = smoother. Use 3-7 for fast markets, 8-15 for slow or higher timeframes.
OFPI T3 Volume Factor (t3_vf): Adjusts the T3’s sensitivity. Higher = more responsive, lower = more stable. 0.6-0.8 is typical. Raise for more “snappy” signals, lower for less noise.
VVD Delta Lookback (delta_len): Sets the window for VVD’s volume delta calculation. 10-20 for most assets. Shorter for high-volatility, longer for slow markets.
VVD Volatility Normalization Length (vol_norm_len): Normalizes VVD by recent volume. 15-30 is typical. Use higher for assets with wild volume swings.
VVD Momentum Memory (momentum_mem): Adds a “memory” boost to VVD, amplifying persistent buying/selling. 2-5 is common. Lower for choppy markets, higher for trending.
Show Dashboard (showDash): Toggles the full dashboard table (best for desktop). Turn off for a minimalist or mobile setup.
Show Compact Info Line (showInfoLabel): Toggles a single-line info label (best for mobile). Turn on for mobile or minimalist setups.
How PVFI Works:
- OFPI Calculation: Splits each candle’s volume into buy/sell pressure based on where the close is within the range. Aggregates over your chosen lookback, then smooths with a T3 moving average for a neon, lag-minimized signal.
- VVD Calculation: Measures the “aggression” of volume (body-weighted), normalizes by recent volume, and applies a memory boost for persistent trends. Uses a custom tanh clamp for a natural, non-pegged range.
- Visuals: OFPI is plotted as a neon line (with glow). VVD is a color-gradient area with a soft shadow, instantly showing regime shifts.
- Dashboard/Info Line: Desktop: Full dashboard with all key stats, color-coded and branded. Mobile: Compact info line with arrows for quick reads.
How you'll use PVFI:
- Bullish OFPI (Teal Neon, Up Arrow): Buyers are dominating. Look for breakouts, trend continuations, or confirmation with your own system.
- Bearish OFPI (Green Neon, Down Arrow): Sellers are in control. Watch for breakdowns or short setups.
- VVD Positive (Teal Area): Aggressive buying is increasing. Confirm with price action.
- VVD Negative (Purple Area): Aggressive selling is increasing. Use for risk management or short bias.
- Neutral/Flat: Market is balanced or indecisive. Consider waiting for a clear regime shift.
- Dashboard/Info Line: Use the dashboard for full context, or the info line for a quick glance on mobile.
Tips:
- For scalping, use lower lookbacks and smoothing.
- For swing trading, increase lookbacks and smoothing for stability.
- Works on all assets and timeframes - tune to your style.
Why PVFI is Unique:
- Fusion of Order Flow and Volatility: No other indicator combines body-based order flow with a volatility-of-volume delta, both visualized with modern, pro-grade graphics.
- Adaptive, Not Static: PVFI adapts to market regime, not just price movement.
- Mobile-Ready: Dashboard and info line toggles for any device.
- No Chart Clutter: Clean, color-coded, and easy to read.
For Educational Use Only
PVFI is a research and educational tool, not financial advice. Always use proper risk management and combine with your own strategy.
Trade with clarity. Trade with edge.
— Dskyz , for DAFE Trading Systems

(OFPI) Order Flow Polarity Index - Momentum Gauge (DAFE) (OFPI) Order Flow Polarity Index - Momentum Gauge: Decode Market Aggression
The (OFPI) Gauge Bar is your front-row seat to the battle between buyers and sellers. This isn’t just another indicator—it’s a momentum tracker that reveals market aggression through a sleek, centered gauge bar and a smart dashboard. Built for traders who want clarity without clutter, it’s your edge for spotting who’s driving price, bar by bar.
What Makes It Unique?
Order Flow Pressure Index (OFPI): Splits volume into buy vs. sell pressure based on candle body position. It’s not just volume—it’s intent, showing who’s got the upper hand.
T3 Smoothing Magic: Uses a Tilson T3 moving average to keep signals smooth yet responsive. No laggy SMA nonsense here.
Centered Gauge Bar: A 20-segment bar splits bullish (lime) and bearish (red) momentum around a neutral center. Empty segments scream indecision—it’s like a visual heartbeat of the market.
Momentum Shift Alerts: Catches reversals with “Momentum Shift” flags when the OFPI crests, so you’re not caught off guard.
Clean Dashboard: A compact, bottom-left table shows momentum status, the gauge bar, and the OFPI value. Color-coded, transparent, and no chart clutter.
Inputs & Customization
Lookback Length (default 10): Set the window for pressure calculations. Short for scalps, long for trends.
T3 Smoothing Length (default 5): Tune the smoothness. Tight for fast markets, relaxed for chill ones.
T3 Volume Factor (default 0.7): Crank it up for snappy signals or down for silky trends.
Toggle the dashboard for minimalist setups or mobile trading.
How to Use It
Bullish Momentum (Lime, Right-Filled): Buyers are flexing. Look for breakouts or trend continuations. Pair with support levels.
Bearish Momentum (Red, Left-Filled): Sellers are in charge. Scout for breakdowns or shorts. Check resistance zones.
Neutral (Orange, Near Center): Market’s chilling. Avoid big bets—wait for a breakout or play the range.
Momentum Shift: A reversal might be brewing. Confirm with price action before jumping in.
Not a Solo Act: Combine with your strategy—trendlines, RSI, whatever. It’s a momentum lens, not a buy/sell bot.
Why Use the OFPI Gauge?
See the Fight: Most tools just count volume. OFPI shows who’s winning with a visual that slaps.
Works Anywhere: Crypto, stocks, forex, any timeframe. Tune it to your style.
Clean & Pro: No chart spam, just a sharp gauge and a dashboard that delivers.
Unique Edge: No other indicator blends body-based pressure, T3 smoothing, and a centered gauge like this.
The OFPI Gauge catches the market’s pulse so you can trade with confidence. It’s not about predicting the future—it’s about knowing who’s in control right now.
For educational purposes only. Not financial advice. Always use proper risk management.
Use with discipline. Trade your edge.
— Dskyz , for DAFE Trading Systems

MACD of RSI [TORYS]MACD of RSI — Momentum & Divergence Scanner
Description:
This enhanced oscillator applies MACD logic directly to the Relative Strength Index (RSI) rather than price, giving traders a clearer look at internal momentum and early shifts in trend strength. Now featuring a custom histogram, dual MA types, and RSI-based divergence detection — it’s a complete toolkit for identifying exhaustion, acceleration, and hidden reversal points in real time.
How It Works:
Calculates the MACD line as the difference between a fast and slow moving average of RSI. Adds a Signal Line (MA of the MACD) and plots a Histogram to show momentum acceleration/deceleration. Both RSI MAs and the Signal Line can be toggled between EMA and SMA for custom tuning.
Divergence Detection:
Bullish Divergence : Price makes a lower low while RSI makes a higher low → labeled with a green “D” below the curve.
Bearish Divergence : Price makes a higher high while RSI makes a lower high → labeled with a red “D” above the curve.
Configurable lookback window for tuning sensitivity to pivots, with 4 as the sweet spot.
RSI Pivot Dot Signals:
Plots green dots at RSI oversold pivot lows below 30,
Plots red dots at overbought pivot highs above 70.
Helps detect short-term exhaustion or bounce zones, plotted right on the MACD-RSI curve.
RSI 50 Crosses (Optional):
Optional ▲ and ▼ labels when RSI crosses its 50 midline — useful for momentum trend shifts or pullback confirmation, or to detect consolidation.
Histogram:
Plotted as a column chart showing the distance between MACD and Signal Line.
Colored dynamically:
Bright green : Momentum rising above zero
Light green : Weakening above zero
Bright red : Momentum falling below zero
Light red : Weakening below zero
The zero line serves as the mid-point:
Above = Bullish Bias
Below = Bearish Bias
How to Interpret:
Momentum Confirmation:
Use MACD cross above Signal Line with a rising histogram to confirm breakouts or trend entries.
Histogram shrinking near zero = momentum weakening → caution or reversal.
Exhaustion & Reversals:
Dot signals near RSI extremes + histogram peak can suggest overbought/oversold pressure.
Use divergence labels ("D") to spot early reversal signals before price breaks structure.
Inputs & Settings:
RSI Length
Fast/Slow MA Lengths for MACD (applied to RSI)
Signal Line Length
MA Type: Choose between EMA and SMA for MACD and Signal Line
Pivot Sensitivity for dot markers
Divergence Logic Toggle
Show/hide RSI 50 Crosses
Best For:
Traders who want momentum insight from inside RSI, not price
Scalpers using divergence or exhaustion entries
Swing traders seeking entry confirmation from signal crossovers
Anyone using multi-timeframe confluence with RSI and trend filters
Pro Tips:
Combine this with:
Bollinger Bands breakouts and reversals
VWAP or EMAs to filter entries by trend
Volume spikes or BBW squeezes for volatility confirmation
TTM Scalper Alert to sync structure and momentum
