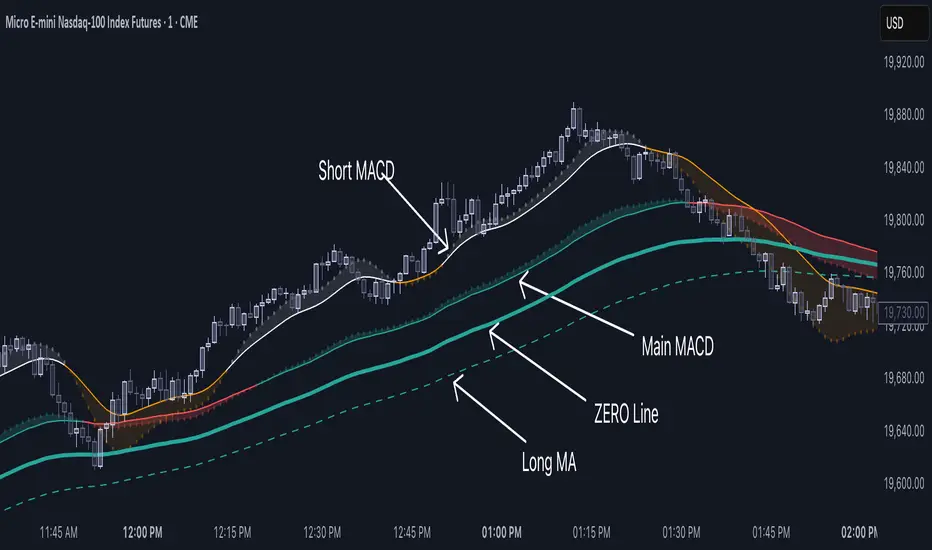
Double MACD Overlay [NLR]This indicator plots two MACD signals directly on your price chart to help you spot trends and shifts in momentum more clearly:
🔹 Main MACD - The classic MACD with customizable Fast, Slow, and Signal lengths. Great for confirming broader trend direction.
🔹 Short MACD - A faster MACD with an option to smooth the input, helping you catch early signals or identify short-term momentum changes.
Each MACD is visualized as:
A line showing the moving average
A colored histogram showing the MACD minus the signal
A zero line for reference
Why use this?
By comparing a short-term MACD with a longer-term one, you get early signals without losing the big picture. Use it for confirmation, divergence spotting, or just cleaner trend visualization.
Best For:
✅ Trend-followers
✅ Momentum traders
✅ Anyone who wants more context from their MACD signals
Recommended Settings:
Here are some ideal settings to get the most out of this indicator:
On a 5-Minute Chart:
Compare your current MACD with the 15-minute MACD.
- MACD Multiplier: 3
On a 1-Minute Chart:
Spot short-term moves while comparing them to the 5-minute MACD.
- MACD Multiplier: 5
- Use Smoothed Source (Short MACD): ON (for a cleaner short MACD signal)
Happy trading! 💹
Centered Oscillators
MACD Volume Strategy (BBO + MACD State, Reversal Type)Overview
MACD Volume Strategy (BBO + MACD State, Reversal Type) is a momentum-based reversal system that combines MACD crossover logic with volume filtering to enhance signal accuracy and minimize noise. It aims to identify structural trend shifts and manage risk using predefined parameters.
※This strategy is for educational and research purposes only. All results are based on historical simulations and do not guarantee future performance.
Strategy Objectives
Identify early trend transitions with high probability
Filter entries using volume dynamics to validate momentum
Maintain continuous exposure using a reversal-style model
Apply a consistent 1:1.5 risk-to-reward ratio per trade
Key Features
Integrated MACD and volume oscillator filtering
Zero repainting (all signals confirmed on closed candles)
Automatic position flipping for seamless direction shifts
Stop-loss and take-profit based on recent structural highs/lows
Trading Rules
Long Entry Conditions
MACD crosses above the zero line (BBO Buy arrow)
Volume oscillator is positive (short EMA > long EMA)
MACD is above the signal line
Close any existing short and enter a new long
Short Entry Conditions
MACD crosses below the zero line (BBO Sell arrow)
Volume oscillator is positive
MACD is below the signal line
Close any existing long and enter a new short
Exit Rules
Take Profit (TP) = Entry ± (risk distance × 1.5)
Stop Loss (SL) = Recent swing low (for long) or high (for short)
Early Exit = Triggered when a reversal signal appears (flip logic)
Risk Management Parameters
Pair: ETH/USD
Timeframe: 10-minute
Starting Capital: $3,000
Commission: 0.02%
Slippage: 2 pip
Risk per Trade: 5% of account equity (adjusted for sustainable practice)
Total Trades: 312 (backtest on selected dataset)
※Risk parameters are fully configurable and should be adjusted to suit each trader's personal setup and broker conditions.
Parameters & Configurations
Volume Short Length: 6
Volume Long Length: 12
MACD Fast Length: 11
MACD Slow Length: 21
Signal Smoothing: 10
Oscillator MA Type: SMA
Signal Line MA Type: SMA
Visual Support
Green arrow = Long entry
Red arrow = Short entry
MACD lines, signal line, and histogram
SL/TP markers plotted directly on the chart
Strategic Advantages & Uniqueness
Volume filtering eliminates low-participation, weak signals
Structurally aligned SL/TP based on recent market pivots
No repainting — decisions are made only on closed candles
Always in the market due to the reversal-style framework
Inspirations & Attribution
This strategy is inspired by the excellent work of:
Bitcoinblockchainonline – “BBO_Roxana_Signals MACD + vol”
Leveraging MACD zero-line cross and volume oscillator for intuitive signal generation.
HasanRifat – “MACD Fake Filter ”
Introduced a signal filter using MACD wave height averaging to reduce false positives.
This strategy builds upon those ideas to create a more automated, risk-aware, and technically adaptive system.
Summary
MACD Volume Strategy is a clean, logic-first automated trading system built for precision-seeking traders. It avoids discretionary bias and provides consistent signal logic under backtested historical conditions.
100% mechanical — no discretionary input required
Designed for high-confidence entries
Can be extended with filters, alerts, or trailing stops
※Strategy performance depends on market context. Past performance is not indicative of future results. Use with proper risk management and careful configuration.

VIDYA Auto-Trading(Reversal Logic)Overview
This script is a dynamic trend-following strategy based on the Variable Index Dynamic Average (VIDYA). It adapts in real time to market volatility, aiming to enhance entry precision and optimize risk management.
⚠️ This strategy is intended for educational and research purposes. Past performance does not guarantee future results. All results are based on historical simulations using fixed parameters.
Strategy Objectives
The objective of this strategy is to respond swiftly to sudden price movements and trend reversals, providing consistent and reliable trade signals under historical testing conditions. It is designed to be intuitive and efficient for traders of all levels.
Key Features
Momentum Sensitivity via VIDYA: Reacts quickly to momentum shifts, allowing for accurate trend-following entries.
Volatility-Based ATR Bands: Automatically adjusts stop levels and entry conditions based on current market volatility.
Intuitive Trend Visualization: Uptrends are marked with green zones, and downtrends with red zones, giving traders clear visual guidance.
Trading Rules
Long Entry: Triggered when price crosses above the upper band. Any existing short position is closed.
Short Entry: Triggered when price crosses below the lower band. Any existing long position is closed.
Exit Conditions: Positions are reversed based on signal changes, using a position reversal strategy.
Risk Management Parameters
Market: ETHUSD(5M)
Account Size: $3,000 (reasonable approximation for individual traders)
Commission: 0.02%
Slippage: 2 pip
Risk per Trade: 5% of account equity (adjusted to comply with TradingView guidelines for realistic risk levels)
Number of Trades: 251 (based on backtest over the selected dataset)
⚠️ The risk per trade and other values can be customized. Users are encouraged to adapt these to their individual needs and broker conditions.
Trading Parameters & Considerations
VIDYA Length: 10
VIDYA Momentum: 20
Distance factor for upper/lower bands: 2
Source: close
Visual Support
Trend zones, entry points, and directional shifts are clearly plotted on the chart. These visual cues enhance the analytical experience and support faster decision-making.
Visual elements are designed to improve interpretability and are not intended as financial advice or trade signals.
Strategy Improvements & Uniqueness
Inspired by the public work of BigBeluga, this script evolves the original concept with meaningful enhancements. By combining VIDYA and ATR bands, it offers greater adaptability and practical value compared to conventional trend-following strategies.
This adaptation is original work and not a direct copy. Improvements are designed to enhance usability, risk control, and market responsiveness.
Summary
This strategy offers a responsive and adaptive approach to trend trading, built on momentum detection and volatility-adjusted risk management. It balances clarity, precision, and practicality—making it a powerful tool for traders seeking reliable trend signals.
⚠️ All results are based on historical data and are subject to change under different market conditions. This script does not guarantee profit and should be used with caution and proper risk management.

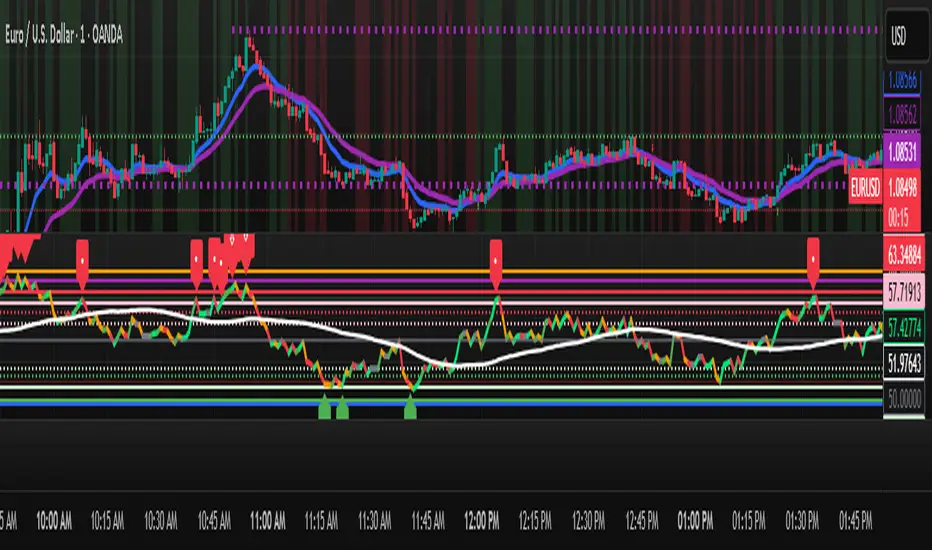
Mr_Pips817 RSI Divergence PROBuilt for professional traders who demand precision.
The TMA - RSI Divergence PRO indicator combines high-probability divergence detection with smart liquidity-based price action levels to identify turning points, trend reversals, and entry/exit zones.
✅ Detects RSI/Momentum/Smoothed divergence
✅ Marks Buy/Sell signals with graded confidence levels
✅ Includes Best / Great / Good / Quality signal types
✅ Fully customizable oscillator levels
✅ Adjustable timeframe alert filter
✅ Invite-only & source-protected
Use it on any market: FX, crypto, indices, stocks, commodities
Optimized for scalping, intraday, and swing trading strategies.
🧠 How It Works:
Select your oscillator (RSI, Momentum, or Smoothed).
When price forms a pivot high/low and diverges from the oscillator, the system flags the divergence.
When the oscillator crosses specific liquidity zones (customizable), it triggers a Buy/Sell label.
Each signal type is visually and logically ranked by quality.
Optional: Filter alerts by your desired chart timeframe for enhanced control.
🧪 Signal Tiers Explained:
Type Signal Meaning
Best Quality Sell "Sell" Optimal sell signal (buy-side liquidity sweep)
Great Quality ⇩⇩ / ⇧⇧ Strong momentum shift
Good Quality ⇩ / ⇧ Probable trend start
Quality • (dot) Early warning / low-grade signal
🚨 Alerts & Controls:
Toggle alerts on/off per signal type
Filter alerts by timeframe
Fine-tune divergence & signal thresholds for each market
📈 Suggested Settings:
Use RSI Divergence for FX and Crypto
Use Smoothed Divergence for Indexes or higher timeframes
Tune liquidity levels based on market volatility
Pro Scalper AI [BullByte]The Pro Scalper AI is a powerful, multi-faceted scalping indicator designed to assist active traders in identifying short-term trading opportunities with precision. By combining trend analysis, momentum indicators, dynamic weighting, and optional AI forecasting, this tool provides both immediate and latched trading signals based on confirmed (closed bar) data—helping to avoid repainting issues. Its flexible design includes customizable filters such as a higher timeframe trend filter, and adjustable settings for ADX, ATR, and Hull Moving Average (HMA), giving traders the ability to fine-tune the strategy to different markets and timeframes.
Key Features :
- Confirmed Data Processing :
Utilizes a helper function to lock in price and volume data only from confirmed (closed) bars, ensuring the reliability of signals without the risk of intrabar repainting.
- Trend Analysis :
Employs ADX and Directional Movement (DI) calculations along with a locally computed HMA to detect short-term trends. An optional higher timeframe trend filter can further refine the analysis.
- Flexible Momentum Modes :
Choose between three momentum calculation methods—Stochastic RSI, Fisher RSI, or Williams %R—to match your preferred style of analysis. This versatility allows you to optimize the indicator for different market conditions.
- Dynamic Weighting & Volatility Adjustments :
Adjusts the contribution of trend, momentum, volatility, and volume through dynamic weighting. This ensures that the indicator responds appropriately to varying market conditions by scaling its sensitivity with user-defined maximum factors.
- Optional AI Forecast :
For those who want an extra edge, the built-in AI forecasting module uses linear regression to predict future price moves and adjusts oscillator thresholds accordingly. This feature can be toggled on or off, with smoothing options available for more stable output.
- Latching Mode for Signal Persistenc e:
The script features a latching mechanism that holds signals until a clear reversal is detected, preventing whipsaws and providing more reliable trade entries and exits.
- Comprehensive Visualizations & Dashboard :
- Composite Oscillator & Dynamic Thresholds : The oscillator is plotted with dynamic upper and lower thresholds, and the area between them is filled with a color that reflects the active trading signal (e.g., Strong Buy, Early Sell).
- Signal Markers : Both immediate (non-latching) and stored (latched) signals are marked on the chart with distinct shapes (circles, crosses, triangles, and diamonds) to differentiate between signal types.
- Real-Time Dashboard : A customizable dashboard table displays key metrics including ADX, oscillator value, chosen momentum mode, HMA trend, higher timeframe trend, volume factor, AI bias (if enabled), and more, allowing traders to quickly assess market conditions at a glance.
How to Use :
1. S ignal Interpretation :
- Immediate Signals : For traders who prefer quick entries, the indicator displays immediate signals such as “Strong Buy” or “Early Sell” based on the current market snapshot.
- Latched Signals : When latching is enabled, the indicator holds a signal state until a clear reversal is confirmed, offering sustained trade setups.
2. Trend Confirmation :
- Use the HMA trend indicator and the optional higher timeframe trend filter to confirm the prevailing market direction before acting on signals.
3. Dynamic Thresholds & AI Forecasting :
- Monitor the dynamically adjusted oscillator thresholds and, if enabled, the AI bias to gauge potential shifts in market momentum.
4. Risk Management :
- Combine these signals with additional analysis and sound risk management practices to determine optimal entry and exit points for scalping trades.
Disclaimer :
This script is provided for educational and informational purposes only and does not constitute financial advice. Trading involves risk, and past performance is not indicative of future results. Always perform your own analysis and use proper risk management strategies before trading.

Relative Directional Index (RDI)🔍 Overview
The Relative Directional Index (RDI) is a hybrid tool that fuses the Average Directional and the Relative Strength Indices (ADX and RSI) into a single, highly visual interface. While the former captures trend strength, the latter reveals momentum shifts and potential exhaustion. Together, they can confirm trend structure, anticipate reversals, and sharpen the timing entries and exits.
📌 Why Combine ADX with RSI?
Most indicators focus on either trend-following (like ADX) or momentum detection (like RSI)—but rarely both. Each comes with trade-offs:
- ADX alone confirms trend strength but ignores momentum.
- RSI alone signals overbought/oversold, but lacks trend context.
The RDI resolves this by integrating both, offering:
- Smarter filters for trend entries
- Early warnings of momentum breakdowns
- More confident signal validation
🧠 Design Note: Fibonacci Harmony
All default values—5, 13, 21—are Fibonacci numbers. This is intentional, as these values reflect the natural rhythm of market cycles, and promote harmonic calibration between price action and indicator logic.
🔥 Key Features
✅ ADX Histogram
- Green bars = trend gaining strength
- Red bars = trend weakening
- Adjustable transparency for visual tuning
✅ ADX Line (Orange)
- Measures trend strength over time
- Rising = accelerating trend
- Falling = trend may be fading
✅ RSI Line (Lemon Yellow)
- Captures momentum surges and slowdowns
- Above 50 = bullish control
- Below 50 = bearish pressure
✅ Trend Strength Squares
- Bright green = strong uptrend
- Bright red = strong downtrend
- Faded colors = range-bound or indecisive
✅ ADX/RSI Crossover Markers
- Yellow square = RSI crosses above ADX → momentum building
- Orange square = ADX crosses above RSI → trend still dominant
✅ Customizable Reference Lines
- Yellow (50) = strong trend threshold
- Red (30) = weak trend zone
- Green (70) = overextended, potential exhaustion
_______________________________________________________
🎯 How to Trade with the RDI
The RDI helps traders identify momentum-supported trends, catch early reversals, and avoid false signals during consolidation.
✅ Trend Confirmation Entries
🔼 Bullish → Enter long on pullbacks or resistance breakouts
- ADX rising above 30
- RSI above 50
- Green trend square visible
🔽 Bearish → Enter short on breakdowns or failed retests
- ADX rising
- RSI below 50
- Red trend square visible
🧯 Exit if RSI crosses back against trend direction or ADX flattens
🚨 Reversal Setups Using Divergence
📈 Bullish Divergence → Long entry after confirmation (e.g. engulfing bar, volume spike)
- Price prints lower low
- RSI prints higher low
- Green triangle
📉 Bearish Divergence → Short entry on breakdown
- Price prints higher high
- RSI prints lower high
- Red triangle
Tip: Stronger if ADX is declining (fading trend strength)
🔂 Breakout Detection via Cross Markers
- Yellow square = RSI > ADX → breakout brewing
- Orange square = ADX > RSI → trend continuation likely
⏸️ Avoid Choppy Markets
- RSI between 45–55
- Faded trend squares
- Flat ADX below 20–30
🧠 Pro Tips
- Combine RDI with VWAPs, moving averages and/or pitchforks
- Watch for alignment between trend and momentum
- Use divergence markers as confirmation, not stand-alone triggers
_______________________________________________________
⚠️ Hidden Divergence (Optional)
The RDI includes optional hidden divergence detection. These signals suggest trend continuation but are off by default. Use with discretion—best in established trends, not sideways markets.
🙈 Hidden Bullish
- Price prints higher low
- RSI prints lower low
🙈 Hidden Bearish
- Price prints lower high
- RSI prints higher high

Golden Lines[MedAlgo]## Overview
This custom TradingView indicator applies Fibonacci retracement and extension levels to logarithmic price scales, providing more accurate analysis for assets that exhibit exponential growth patterns. By utilizing logarithmic axes instead of linear ones, the indicator offers more relevant support and resistance zones for volatile assets like cryptocurrencies, high-growth stocks, and commodities that frequently move in percentage-based increments rather than absolute price movements.
## Key Features
- **Logarithmic Fibonacci Placement**: Automatically calculates Fibonacci levels based on logarithmic price distribution rather than linear values
- **Dynamic Level Adjustment**: Adjusts Fibonacci levels in real-time as prices move through logarithmic space
- **Custom Ratio Support**: Includes both traditional Fibonacci ratios (0.236, 0.382, 0.5, 0.618, 0.786, 1.0, 1.618, 2.618) and extended logarithmic-optimized ratios
- **Multi-timeframe Analysis**: Works across all timeframes while maintaining logarithmic consistency
- **Visual Alerts**: Color-coded zones show strength of price reactions at critical Fibonacci boundaries
- **Historical Backtesting**: Highlights how previous price action respected logarithmic Fibonacci levels
## How to Use
1. **IMPORTANT**: Ensure logarithmic scale is activated on your chart by clicking the "Log" button (marked as "L") in the bottom right corner of your chart
2. Add the indicator to your chart from the indicator menu
3. After adding the indicator, you'll be prompted to select:
- A high point (click on a significant peak)
- A low point (click on a significant trough)
4. The indicator will automatically draw all Fibonacci levels based on these two points
5. Lines will be drawn automatically on the chart, calculating the proper logarithmic Fibonacci ratios
6. No additional configuration is needed - the indicator automatically adapts to the logarithmic scaling
## Technical Explanation
The indicator transforms price data using natural logarithms before applying Fibonacci calculations. This approach acknowledges that percentage-based price movements appear as equal distances on logarithmic charts, making Fibonacci levels more relevant for identifying psychological and technical barriers in markets that move exponentially.
Unlike standard Fibonacci tools, this indicator:
1. Converts price to logarithmic values
2. Calculates Fibonacci sequences in log space
3. Maps these levels back to price chart display
4. Tracks reaction strength at each level
## Usage Guide
1. Select high and low points for your Fibonacci analysis
2. The indicator automatically draws the levels on logarithmic scale
3. Monitor price action as it approaches key logarithmic Fibonacci levels
4. Use color intensity to gauge the historical significance of each level
5. Set alerts for when price approaches logarithmic Fibonacci zones
## Interpretation
- **Strong Bounces**: When price strongly reacts at a logarithmic Fibonacci level, it often indicates a significant psychological barrier in percentage terms
- **Minimal Reaction**: Levels that show little price reaction may indicate logarithmic zones with less market interest
- **Confluence Areas**: Where multiple logarithmic Fibonacci levels converge from different timeframes, expect stronger support/resistance
- **Breakout Confirmation**: Price decisively moving through a significant logarithmic Fibonacci level often signals a strong trend continuation
## Best Applications
This indicator is particularly effective for:
- Cryptocurrency analysis
- High-growth technology stocks
- Commodities during trending markets
- Any asset that historically moves in percentage terms rather than absolute price
## Troubleshooting
- If Fibonacci levels appear distorted, verify that logarithmic scale is activated (check for highlighted "L" button)
- For best results, select major swing highs and lows that represent significant market turning points
- The indicator may need recalibration during extreme volatility events
Disclaimer
This indicator is provided for informational purposes only and should not be considered financial advice. Past performance is not indicative of future results. The signals generated are based on historical patterns and technical analysis, which may not always predict future market movements accurately. Trading involves substantial risk of loss. Always use proper risk management and consider using this indicator as part of a comprehensive trading strategy rather than as a standalone system. Test thoroughly before using with real capital.

Trend Strength MeterThe Trend Strength Meter (TSM) is a powerful and versatile indicator designed to help traders identify market trends, measure their strength, and detect potential reversals with ease. This indicator combines the power of moving averages, divergence detection, and a clean, customizable dashboard to provide actionable insights for traders of all levels.
How It Works
Trend Strength Calculation:
1. The TSM calculates the trend strength using the difference between two Exponential Moving Averages (EMAs): a fast EMA (default: 20) and a slow EMA (default: 50).
2. The difference is expressed as a percentage of the slow EMA, providing a clear measure of the trend's strength and direction.
Histogram Visualization:
1. A color-coded histogram visually represents the trend strength:
Green: Bullish trend
Red: Bearish trend
Gray: Neutral or no significant trend
2. A smoothed trend strength line (SMA of the trend strength) is also plotted for better clarity.
Divergence Detection:
1. The indicator detects bullish and bearish divergences using the RSI (Relative Strength Index) and price action.
2. Bullish Divergence: Price makes a lower low, but RSI makes a higher low, signaling potential upward momentum.
3. Bearish Divergence: Price makes a higher high, but RSI makes a lower high, signaling potential downward momentum.
=> Divergences are marked with arrows on the chart:
Green Arrow: Bullish divergence
Red Arrow: Bearish divergence
Dashboard:
1. A clean and informative dashboard displays key information:
Trend Strength Value: The current strength of the trend
Trend Direction: Bullish, Bearish, or Neutral
Last Signal: Buy, Sell, or None (based on divergence signals)
The dashboard is fully customizable and can be positioned anywhere on the chart (e.g., top-right, bottom-left, center, etc.).
Key Features
1. Trend Strength Measurement: Quickly identify the strength and direction of the trend.
2. Divergence Detection: Spot potential reversals before they occur with bullish and bearish divergence signals.
3. Customizable Dashboard: Move the dashboard to your preferred location on the chart for better visibility.
4. User-Friendly Design: Clean visuals and intuitive color coding make it easy to interpret market conditions.
5. Actionable Signals: Provides clear Buy/Sell signals based on divergence, helping traders make informed decisions.
How to Use
1. Trend Confirmation:
Use the histogram and trend strength value to confirm the current market trend.
Green bars indicate a bullish trend, while red bars indicate a bearish trend.
2. Divergence Signals:
Look for divergence arrows (green for bullish, red for bearish) to anticipate potential reversals.
Combine divergence signals with other technical analysis tools for higher accuracy.
3. Dashboard Insights:
Monitor the dashboard for real-time updates on trend strength, direction, and the latest signal.
Use the "Last Signal" (Buy/Sell) to validate your trading decisions.
4. Custom Settings:
Adjust the EMA lengths and divergence lookback period to suit your trading style and timeframe.
Position the dashboard anywhere on the chart for convenience.
Best Practices
1. Use the TSM in conjunction with other indicators or price action analysis for confirmation.
2. Test the indicator on different timeframes to find the one that works best for your strategy.
3. Always practice proper risk management when trading.
Disclaimer
This indicator is a tool to assist in technical analysis and should not be used as a standalone trading strategy. Past performance is not indicative of future results. Always conduct your own research and consult with a financial advisor before making trading decisions.

Momentum Shift [Bigbeluga]
This indicator identifies momentum shifts using a smoothed momentum calculation. It plots dynamic shift zones consisting of five levels that expand or contract based on price action. When momentum rises, the indicator creates an upward shift zone, and when momentum falls, it generates a downward shift zone. The shift zones dynamically react to price, stopping extension when a level is crossed.
🔵Key Features:
Smoothed Momentum Calculation:
➣ Utilizes a Hull Moving Average (HMA) to smooth momentum and reduce noise.
➣ Identifies momentum shifts with crossovers between the current momentum value and its previous state.
➣ Uses a gradient color scheme to highlight momentum strength.
Dynamic Shift Zones:
➣ When momentum rises, the indicator plots an upper shift zone with five incremental levels.
➣ When momentum falls, a lower shift zone is formed with five descending levels.
➣ Each level within the shift zone represents a progressively stronger momentum shift.
Level Extension Control:
➣ Shift zones stop extending once a level is crossed by price.
➣ Levels closer to price act as key momentum resistance or support zones.
➣ If price retraces after a shift, the remaining levels stay intact for further reference.
Momentum Direction Indications:
➣ Labels (▲ and ▼) appear at momentum shift points to indicate rising or falling momentum.
🔵Usage:
Momentum-Based Entries: Identify momentum shifts early by using shift zones as confirmation for trade entries.
Trend Continuation & Exhaustion: Observe which shift levels price respects—if momentum shift zones hold, the trend may continue; if they break, momentum may reverse.
Dynamic Support & Resistance: Use the five-level shift zones as temporary support and resistance areas that adapt to momentum shifts.
Momentum Strength Analysis: If price moves through multiple shift levels in one direction, it signals strong momentum in that direction.
Momentum Shift is a powerful tool for traders looking to analyze momentum shifts with structured visual zones. By combining smoothed momentum calculations with dynamic shift zones, this indicator provides a clear view of market momentum and helps traders navigate price action effectively.

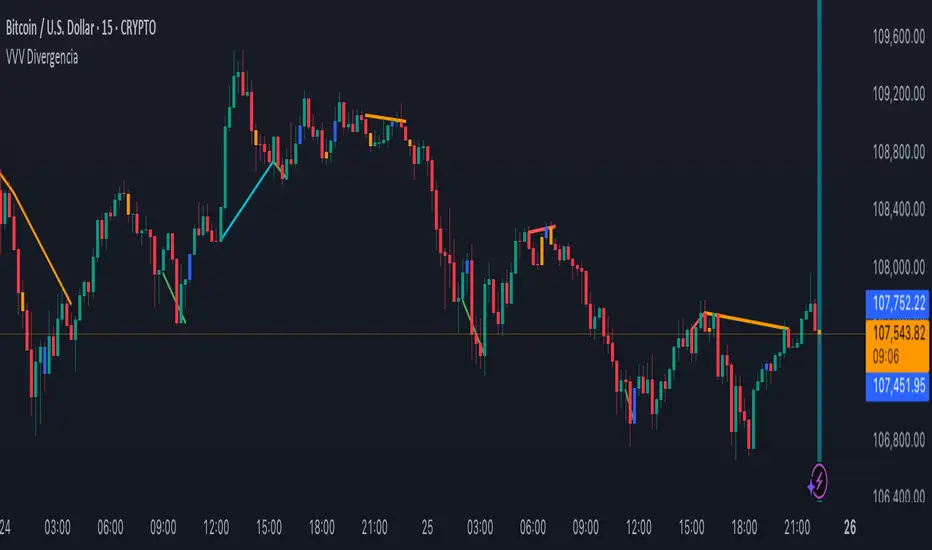
VVV DivergenciaThe **VVV Divergencia** indicator identifies bullish and bearish divergences on the chart by analyzing price action and fractal patterns. Here's a summary of its functions:
**Divergence Detection**: The indicator identifies regular and hidden divergences:
- **Bullish Divergence**: Occurs when the price forms a lower low while the oscillator makes a higher low, indicating potential upward momentum.
- **Bearish Divergence**: Occurs when the price forms a higher high while the oscillator makes a lower high, suggesting possible downward momentum.
- **Hidden Divergences**: These occur when the price does not align with the oscillator's movement, signaling potential continuation of the trend.
**Visual Indicators**: The script visually highlights these divergences on the chart:
- Bullish and bearish divergences are drawn as lines with different colors.
- The background color of the bars is changed based on the divergence signal, where green and orange indicate bullish patterns and red and aqua indicate bearish patterns.
**Customizable Parameters**: Users can adjust the source of the price data BASED ON ANY indicator.
This indicator is useful for traders looking to spot divergence patterns, which are often used to predict potential reversals or continuations in price trends.
A **VVV Divergencia** indikátor a divergenciák felismerésére szolgál a grafikonon.
**Divergenciák Felismerése**: Az indikátor a normál és rejtett divergenciákat is felismeri:
- **Bika Divergencia (Bullish Divergence)**: Akkor fordul elő, amikor az ár alacsonyabb mélypontot képez, miközben az oszcillátor magasabb mélypontot formál, ami emelkedésre utalhat.
- **Medve Divergencia (Bearish Divergence)**: Akkor jelenik meg, amikor az ár magasabb csúcsot ér el, miközben az oszcillátor alacsonyabb csúcsot mutat, ami csökkenésre utalhat.
- **Rejtett Divergenciák**: Ezek akkor fordulnak elő, amikor az ár nem igazodik az oszcillátor mozgásához, ami a trend folytatódására utalhat.
**Vizualizálás**: Az indikátor vizuálisan kiemeli a divergenciákat a grafikonon:
- A bullish és bearish divergenciák különböző színekkel vonalakként jelennek meg.
- A gyertyák háttérszíne is változik a divergenciák jelei alapján: a zöld és a türkiz bullish mintát, míg a piros és a narancssárga bearish mintát jelez.
**Testreszabható Paraméterek**: A felhasználók beállíthatják az árforrást ami bármilyen indikátorra beállítható.
Ez az indikátor hasznos lehet azoknak a tradereknek, akik a divergenciák alapján szeretnének előrejelzéseket készíteni, mivel ezek a minták gyakran előre jelzik az árfolyam fordulatait vagy a trendek folytatódását.
MACD Boundary PSA - CoffeeKillerMACD Boundary PSA - CoffeeKiller Indicator Guide
Welcome traders! This guide will walk you through the MACD Boundary PSA indicator, a powerful market analysis tool developed by CoffeeKiller that enhances the traditional MACD with advanced boundary detection and peak signaling features.
🔔 **Warning: This Indicator Has No Signal Line or MACD Line** 🔔 This indicator is my version of the MACD, that I use in conjunction with the Rev&Line indicator.
Core Concept: Enhanced MACD Analysis
The foundation of this indicator builds upon the classic Moving Average Convergence Divergence (MACD) indicator, adding boundary tracking and peak detection systems to provide clearer signals and market insights.
Histogram Bars: Market Momentum
- Positive Green Bars: Bullish momentum
- Negative Red Bars: Bearish momentum
- Color intensity varies based on momentum strength
- Special coloring for new high/low boundaries
Marker Lines: Dynamic Support/Resistance
- High Marker Line (Magenta): Tracks the highest point reached during a bullish phase
- Low Marker Line (Cyan): Tracks the lowest point reached during a bearish phase
- Acts as dynamic boundaries that help identify strength of current moves
Peak Detection System:
- Triangular markers identify significant local maxima and minima
- Background highlighting shows important momentum peaks
- Helps identify potential reversal points and momentum exhaustion
Core Components
1. MACD Calculation
- Customizable fast and slow moving averages
- Signal line smoothing options
- Flexible MA type selection (SMA or EMA)
- Custom source input options
2. Boundary Tracking System
- Automatic detection of highest values in bullish phases
- Automatic detection of lowest values in bearish phases
- Step-line visualization of boundaries
- Color-coded for easy identification
3. Peak Detection System
- Identification of local maxima and minima
- Background highlighting of significant peaks
- Triangle markers for peak visualization
- Zero-line cross detection for trend changes
4. Time Resolution Control
- Normal mode: calculations based on chart timeframe
- Custom resolution mode: calculations based on specified timeframe
Main Features
Time Resolution Settings
- Normal mode: calculations match your chart's timeframe
- Custom resolution mode: calculations based on specified timeframe
- Helps identify stronger signals from other timeframes
Visual Elements
- Color-coded histogram bars
- Dynamic marker lines for boundaries
- Peak triangles for significant turning points
- Background highlighting for peak identification
Signal Generation
- Zero-line crosses for trend change signals
- Boundary breaks for momentum strength
- Peak formation for potential reversals
- Color changes for momentum direction
Customization Options
- MA types and lengths
- Signal smoothing
- Color schemes
- Marker line visibility
- Peak background display options
Trading Applications
1. Trend Identification
- Histogram crossing above zero: bullish trend beginning
- Histogram crossing below zero: bearish trend beginning
- Histogram color: indicates momentum direction
- Consistent color intensity: trend strength
2. Reversal Detection
- Peak triangles after extended trend: potential exhaustion
- Background highlighting: significant reversal points
- Histogram approaching marker lines: potential trend change
- Color shifts from bright to muted: decreasing momentum
3. Momentum Analysis
- Histogram breaking above previous high boundary: accelerating bullish momentum
- Histogram breaking below previous low boundary: accelerating bearish momentum
- Special coloring (magenta/cyan): boundary breaks indicating strength
- Distance from zero line: overall momentum magnitude
4. Market Structure Assessment
- Consecutive higher peaks: strengthening bullish structure
- Consecutive lower troughs: strengthening bearish structure
- Peak comparisons: relative strength of momentum phases
- Boundary line steps: market structure levels
Optimization Guide
1. MACD Settings
- Fast Length: Shorter values (8-12) for responsiveness, longer values (20+) for smoother signals
- Slow Length: Shorter values (21-34) for more signals, longer values (72+) for major moves
- Default settings (22, 72, 9): balanced approach for most timeframes
- Consider using 8, 21, 5 for shorter timeframes and 34, 144, 5 for longer timeframes
2. MA Type Selection
- EMA: More responsive, follows price more closely
- SMA: Smoother, fewer false signals, potentially more lag
- Mix and match for oscillator and signal lines based on your preference
3. Time Resolution
- Match chart timeframe: for aligned analysis
- Use higher timeframe: for filtering signals
- Lower timeframe: for earlier entries but more noise
4. Color Customization
- Normal bullish/bearish colors: represent standard momentum
- High/low marker line colors: customize visibility
- Peak marker colors: adjust for your visual preference
- Consider chart background when selecting colors
Best Practices
1. Signal Confirmation
- Wait for zero-line crosses to confirm trend changes
- Look for peak formations to identify potential reversals
- Check for boundary breaks to confirm strong momentum
- Use custom timeframe option for higher timeframe confirmation
2. Timeframe Selection
- Lower timeframes: more signals, potential noise
- Higher timeframes: cleaner signals, less frequent
- Custom resolution: allows comparison across timeframes
- Consider using multiple timeframes for confirmation
3. Market Context
- Strong bullish phase: positive histogram breaking above marker line
- Strong bearish phase: negative histogram breaking below marker line
- Histogram approaching zero: potential trend change
- Peak formations: potential exhaustion points
4. Combining with Other Indicators
- Use with trend indicators for confirmation
- Pair with oscillators for overbought/oversold conditions
- Combine with volume analysis for validation
- Consider support/resistance levels with boundary lines
Advanced Trading Strategies
1. Boundary Break Strategy
- Enter long when histogram breaks above previous high marker line
- Enter short when histogram breaks below previous low marker line
- Use zero-line as initial stop-loss reference
- Take profits at formation of opposing peaks
2. Peak Trading Strategy
- Identify significant peaks with triangular markers
- Look for consecutive lower peaks in bullish phases for shorting opportunities
- Look for consecutive higher troughs in bearish phases for buying opportunities
- Use zero-line crosses as confirmation
3. Multi-Timeframe Strategy
- Use custom resolution for higher timeframe MACD trend
- Enter trades when both timeframes align
- Higher timeframe for trend direction
- Chart timeframe for precise entry
4. Histogram Color Strategy
- Enter long when histogram turns bright green (increasing momentum)
- Enter short when histogram turns bright red (increasing momentum)
- Exit when color intensity fades (decreasing momentum)
- Use marker lines as dynamic support/resistance
Practical Analysis Examples
Bullish Market Scenario
- Histogram crosses above zero line
- Green bars grow in height and intensity
- High marker line forms steps upward
- Peak triangles appear at local maxima
- Background highlights appear at significant momentum peaks
Bearish Market Scenario
- Histogram crosses below zero line
- Red bars grow in depth and intensity
- Low marker line forms steps downward
- Peak triangles appear at local minima
- Background highlights appear at significant momentum troughs
Consolidation Scenario
- Histogram oscillates around zero line
- Bar colors alternate frequently
- Marker lines remain relatively flat
- Few or no new peak highlights appear
- Histogram values remain small
Understanding Market Dynamics Through MACD Boundary PSA
At its core, this indicator provides a unique lens to visualize market momentum and boundaries:
1. Momentum Strength: The histogram height/depth shows the strength of current momentum, with color intensity providing additional context about acceleration or deceleration.
2. Dynamic Boundaries: The marker lines create a visual representation of the "high water marks" of momentum in both directions, helping to identify when markets are making new momentum extremes.
3. Exhaustion Signals: The peak detection system highlights moments where momentum has reached a local maximum or minimum, often precursors to reversals or consolidations.
4. Trend Confirmation: The histogram color and intensity provide instant feedback about the current trend direction and strength, with special colors highlighting particularly significant moves.
Remember:
- Combine signals from histogram, marker lines, and peak formations
- Use appropriate timeframe settings for your trading style
- Customize the indicator to match your visual preferences
- Consider market conditions and correlate with price action
This indicator works best when:
- Used as part of a comprehensive trading system
- Combined with proper risk management
- Applied with an understanding of current market conditions
- Signals are confirmed by price action and other indicators
**DISCLAIMER**: This indicator and its signals are intended solely for educational and informational purposes. They do not constitute financial advice. Trading involves significant risk of loss. Always conduct your own analysis and consult with financial professionals before making trading decisions.

RSI3M3+ v.1.8RSI3M3+ v.1.8 Indicator
This script is an advanced trading indicator based on Walter J. Bressert's cycle analysis methodology, combined with an RSI (Relative Strength Index) variation. Let me break it down and explain how it works.
Core Concepts
The RSI3M3+ indicator combines:
A short-term RSI (3-period)
A 3-period moving average to smooth the RSI
Bressert's cycle analysis principles to identify optimal trading points
RSI3M3+ Indicator VisualizationImage Walter J. Bressert's Cycle Analysis Concepts
Walter Bressert was a pioneer in cycle analysis trading who believed markets move in cyclical patterns that can be measured and predicted. His key principles integrated into this indicator include:
Trading Cycles: Markets move in cycles with measurable time spans from low to low
Timing Bands: Projected periods when the next cyclical low or high is anticipated
Oscillator Use: Using oscillators like RSI to confirm cycle position
Entry/Exit Rules: Specific rules for trade entry and exit based on cycle position
Key Parameters in the Script
Basic RSI Parameters
Required bars: Minimum number of bars needed (default: 20)
Overbought region: RSI level considered overbought (default: 70)
Oversold region: RSI level considered oversold (default: 30)
Bressert-Specific Parameters
Cycle Detection Length: Lookback period for cycle identification (default: 30)
Minimum/Maximum Cycle Length: Expected cycle duration in days (default: 15-30)
Buy Line: Lower threshold for buy signals (default: 40)
Sell Line: Upper threshold for sell signals (default: 60)
How the Indicator Works
RSI3M3 Calculation:
Calculates a 3-period RSI (sRSI)
Smooths it with a 3-period moving average (sMA)
Cycle Detection:
Identifies bottoms: When the RSI is below the buy line (40) and starting to turn up
Identifies tops: When the RSI is above the sell line (60) and starting to turn down
Records these points to calculate cycle lengths
Timing Bands:
Projects when the next cycle bottom or top should occur
Creates visual bands on the chart showing these expected time windows
Signal Generation:
Buy signals occur when the RSI turns up from below the oversold level (30)
Sell signals occur when the RSI turns down from above the overbought level (70)
Enhanced by Bressert's specific timing rules
Bressert's Five Trading Rules (Implemented in the Script)
Cycle Timing: The low must be 15-30 market days from the previous Trading Cycle bottom
Prior Top Validation: A Trading Cycle high must have occurred with the oscillator above 60
Oscillator Behavior: The oscillator must drop below 40 and turn up
Entry Trigger: Entry is triggered by a rise above the price high of the upturn day
Protective Stop: Place stop slightly below the Trading Cycle low (implemented as 99% of bottom price)
How to Use the Indicator
Reading the Chart
Main Plot Area:
Green line: 3-period RSI
Red line: 3-period moving average of the RSI
Horizontal bands: Oversold (30) and Overbought (70) regions
Dotted lines: Buy line (40) and Sell line (60)
Yellow vertical bands: Projected timing windows for next cycle bottom
Signals:
Green up arrows: Buy signals
Red down arrows: Sell signals
Trading Strategy
For Buy Signals:
Wait for the RSI to drop below the buy line (40)
Look for an upturn in the RSI from below this level
Enter the trade when price rises above the high of the upturn day
Place a protective stop at 99% of the Trading Cycle low
For Sell Signals:
Wait for the RSI to rise above the sell line (60)
Look for a downturn in the RSI from above this level
Consider exiting or taking profits when a sell signal appears
Alternative exit: When price moves below the low of the downturn day
Cycle Timing Enhancement:
Pay attention to the yellow timing bands
Signals occurring within these bands have higher probability of success
Signals outside these bands may be less reliable
Practical Tips for Using RSI3M3+
Timeframe Selection:
The indicator works best on daily charts for intermediate-term trading
Can be used on weekly charts for longer-term position trading
On intraday charts, adjust cycle lengths accordingly
Market Applicability:
Works well in trending markets with clear cyclical behavior
Less effective in choppy, non-trending markets
Consider additional indicators for trend confirmation
Parameter Adjustment:
Different markets may have different natural cycle lengths
You may need to adjust the min/max cycle length parameters
Higher volatility markets may need wider overbought/oversold levels
Trade Management:
Enter trades when all Bressert's conditions are met
Use the protective stop as defined (99% of cycle low)
Consider taking partial profits at the projected cycle high timing
Advanced Techniques
Multiple Timeframe Analysis:
Confirm signals with the same indicator on higher timeframes
Enter in the direction of the larger cycle when smaller and larger cycles align
Divergence Detection:
Look for price making new lows while RSI makes higher lows (bullish)
Look for price making new highs while RSI makes lower highs (bearish)
Confluence with Price Action:
Combine with support/resistance levels
Use with candlestick patterns for confirmation
Consider volume confirmation of cycle turns
This RSI3M3+ indicator combines the responsiveness of a short-term RSI with the predictive power of Bressert's cycle analysis, offering traders a sophisticated tool for identifying high-probability trading opportunities based on market cycles and momentum shifts.
THANK YOU FOR PREVIOUS CODER THAT EFFORT TO CREATE THE EARLIER VERSION THAT MAKE WALTER J BRESSERT CONCEPT IN TRADINGVIEW @ADutchTourist

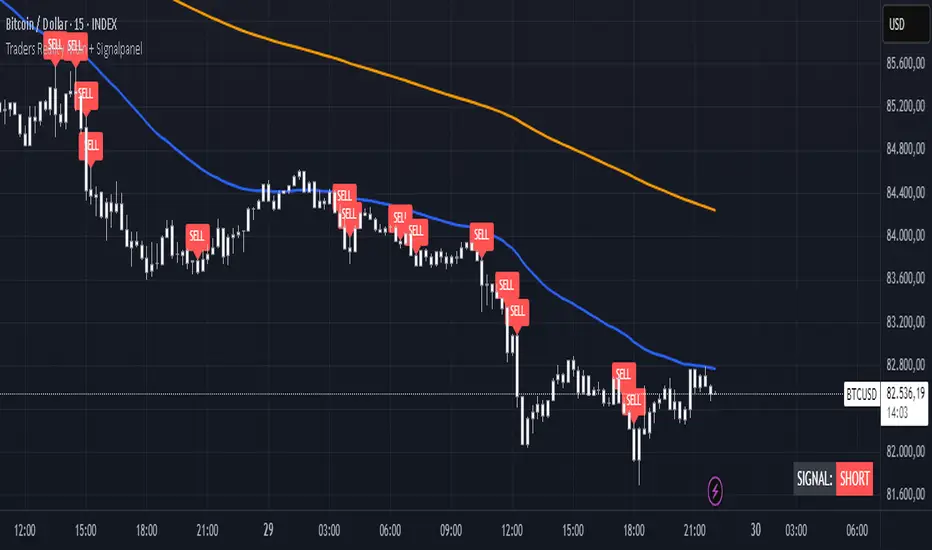
TR Buy/Sell Signal PanelI scripted this with chatgpt have fun guys
📊 TR Buy/Sell Signal Panel – Smart Trade Signals with Visual Clarity
The TR Buy/Sell Signal Panel is a standalone indicator inspired by the powerful Traders Reality (TR) methodology.
It detects potential long and short trade setups using classic market behavior patterns such as volume spikes, EMA crossovers, and session-based timing – all visualized cleanly and statically on your chart.
✅ Key Features
Buy Signals (LONG):
Green PVSRA candle (strong bullish candle with momentum)
EMA13 crossing above EMA50
Volume spike (current volume exceeds 20-period average × multiplier)
Triggered only during London or New York trading sessions (UTC)
Sell Signals (SHORT):
Red PVSRA candle (strong bearish move)
EMA13 crossing below EMA50
Volume spike
Also restricted to active session times
📌 Visual Components
Green/Red arrows on the chart indicate Buy/Sell entries
A static info panel in the bottom-right corner displays all signal conditions:
PVSRA active ✅
Volume Spike ✅
EMA Crossover ✅
Session Time ✅
Last Signal: 🟢 BUY / 🔴 SELL
Current Direction: 🟢 LONG / 🔴 SHORT / ❌ NONE
⚙️ Fully Customizable
Adjustable volume spike multiplier
Optional toggle for showing/hiding short signals
Extremely user-friendly layout – ideal for both beginners & experienced traders
📦 Best For:
Scalpers & Intraday Traders
Traders who follow the Traders Reality / Market Maker Method
Anyone who values clean, rule-based trade entries
Note: Works across all timeframes with sufficient volume (e.g., 5min – 4hr). Sessions are based on UTC time – adjust if needed based on your timezone or trading hours.
Reversal + Confirm ZonesThis script is written in Pine Script (version 5) for TradingView and creates an indicator called **"Reversal + Confirm Zones"**. It overlays visual zones on a price chart to identify potential reversal points and confirmation signals for trading. The indicator combines **Bollinger Bands** and **RSI** to detect overbought/oversold conditions (reversal zones) and uses **EMA crosses** and **MACD zero-line crosses** to confirm bullish or bearish trends. Below is a detailed explanation:
---
### **1. Purpose**
- The script highlights:
- **Reversal Zones**: Areas where the price might reverse due to being overbought (green) or oversold (red).
- **Confirmation Zones**: Areas where a trend reversal is confirmed using EMA and MACD signals (green for bullish, red for bearish).
- It provides visual backgrounds and alerts to assist traders in spotting potential trade setups.
---
### **2. Components**
The script is divided into two main parts: **Reversal Logic** and **Confirmation Logic**.
---
### **3. Reversal Logic (Red & Green Zones)**
#### **Bollinger Bands**
- **Parameters**:
- Length: 20 periods.
- Source: Closing price (`close`).
- Multiplier: 2.0 (standard deviations).
- **Calculation**:
- `basis`: 20-period Simple Moving Average (SMA).
- `dev`: 2 times the standard deviation of the price over 20 periods.
- `upper`: `basis + dev` (upper band).
- `lower`: `basis - dev` (lower band).
- **Purpose**: Identifies when the price moves outside the normal range (beyond 2 standard deviations).
#### **Relative Strength Index (RSI)**
- **Parameters**:
- Length: 14 periods.
- Low Threshold: 30 (oversold).
- High Threshold: 70 (overbought).
- **Calculation**: `rsiValue = ta.rsi(close, rsiLength)`.
- **Purpose**: Measures momentum to confirm overbought or oversold conditions.
#### **Zone Conditions**
- **Red Zone (Oversold)**:
- Condition: `close < lower` (price below lower Bollinger Band) AND `rsiValue < rsiLowThreshold` (RSI < 30).
- Visual: Light red background (`color.new(color.red, 80)`).
- Alert: "Deep Oversold Signal triggered!".
- **Green Zone (Overbought)**:
- Condition: `close > upper` (price above upper Bollinger Band) AND `rsiValue > rsiHighThreshold` (RSI > 70).
- Visual: Light green background (`color.new(color.green, 80)`).
- Alert: "Deep Overbought Signal triggered!".
#### **Interpretation**
- Red Zone: Suggests the price is oversold and may reverse upward.
- Green Zone: Suggests the price is overbought and may reverse downward.
---
### **4. Confirmation Logic (EMA and MACD Crosses)**
#### **Exponential Moving Averages (EMAs)**
- **Parameters**:
- Short EMA Length: 9 periods (user adjustable).
- Long EMA Length: 21 periods (user adjustable).
- **Calculation**:
- `emaShort = ta.ema(close, emaShortLength)`.
- `emaLong = ta.ema(close, emaLongLength)`.
- **Conditions**:
- **Bullish EMA Cross**: `emaCrossBullish = ta.crossover(emaShort, emaLong)` (9 EMA crosses above 21 EMA).
- **Bearish EMA Cross**: `emaCrossBearish = ta.crossunder(emaShort, emaLong)` (9 EMA crosses below 21 EMA).
#### **MACD**
- **Parameters**:
- Fast Length: 12 periods (user adjustable).
- Slow Length: 26 periods (user adjustable).
- Signal Smoothing: 9 periods (user adjustable).
- **Calculation**:
- ` = ta.macd(close, macdFastLength, macdSlowLength, macdSignalSmoothing)`.
- Only the MACD line and signal line are used; the histogram is ignored (`_`).
- **Conditions**:
- **Bullish MACD Cross**: `macdCrossBullish = ta.crossover(macdLine, 0)` (MACD crosses above zero).
- **Bearish MACD Cross**: `macdCrossBearish = ta.crossunder(macdLine, 0)` (MACD crosses below zero).
#### **Combined Confirmation Conditions**
- **Bullish Confirmation**:
- Condition: `bullishConfirmation = emaCrossBullish and macdCrossBullish`.
- Visual: Very light green background (`color.new(color.green, 90)`).
- Meaning: A bullish trend is confirmed when the 9 EMA crosses above the 21 EMA AND the MACD crosses above zero.
- **Bearish Confirmation**:
- Condition: `bearishConfirmation = emaCrossBearish and macdCrossBearish`.
- Visual: Very light red background (`color.new(color.red, 90)`).
- Meaning: A bearish trend is confirmed when the 9 EMA crosses below the 21 EMA AND the MACD crosses below zero.
---
### **5. Visual Outputs**
- **Reversal Zones**:
- Red background for oversold conditions.
- Green background for overbought conditions.
- **Confirmation Zones**:
- Light green background for bullish confirmation.
- Light red background for bearish confirmation.
- Note: The script does not plot the Bollinger Bands, EMAs, or MACD lines—only the background zones are visualized.
---
### **6. Alerts**
- **Deep Oversold Alert**: Triggers when the red zone condition is met.
- **Deep Overbought Alert**: Triggers when the green zone condition is met.
- No alerts are set for the confirmation zones (EMA/MACD crosses).
---
### **7. How It Works**
1. **Reversal Detection**:
- The script uses Bollinger Bands and RSI to flag extreme price levels (red for oversold, green for overbought).
- These zones suggest potential reversals but are not confirmed yet.
2. **Trend Confirmation**:
- EMA crosses (9/21) and MACD zero-line crosses provide confirmation of a trend direction.
- Bullish confirmation (green) occurs when both indicators align upward.
- Bearish confirmation (red) occurs when both indicators align downward.
3. **Trading Strategy**:
- Look for a red zone (oversold) followed by a bullish confirmation for a potential long entry.
- Look for a green zone (overbought) followed by a bearish confirmation for a potential short entry.
---
### **8. How to Use**
1. Add the script to TradingView.
2. Adjust inputs (EMA lengths, MACD settings) if desired.
3. Monitor the chart:
- Red zones indicate oversold conditions—watch for a potential upward reversal.
- Green zones indicate overbought conditions—watch for a potential downward reversal.
- Light green/red backgrounds confirm the trend direction after a reversal zone.
4. Set up alerts for oversold/overbought conditions to catch reversal signals early.
---
### **9. Key Features**
- **Dual Purpose**: Combines reversal detection (Bollinger Bands + RSI) with trend confirmation (EMA + MACD).
- **Visual Simplicity**: Uses background colors instead of plotting lines, keeping the chart clean.
- **Customizable**: Allows users to tweak EMA and MACD periods.
- **Alerts**: Notifies users of extreme conditions for timely action.
---
### **10. Limitations**
- No plotted indicators (e.g., Bollinger Bands, EMAs, MACD) for visual reference—relies entirely on background shading.
- Confirmation signals (EMA/MACD) may lag behind reversal zones, potentially missing fast reversals.
- No alerts for confirmation zones, limiting real-time notification of trend confirmation.
This script is ideal for traders who want a straightforward way to spot potential reversals and confirm them with trend-following indicators, all overlaid on the price chart.

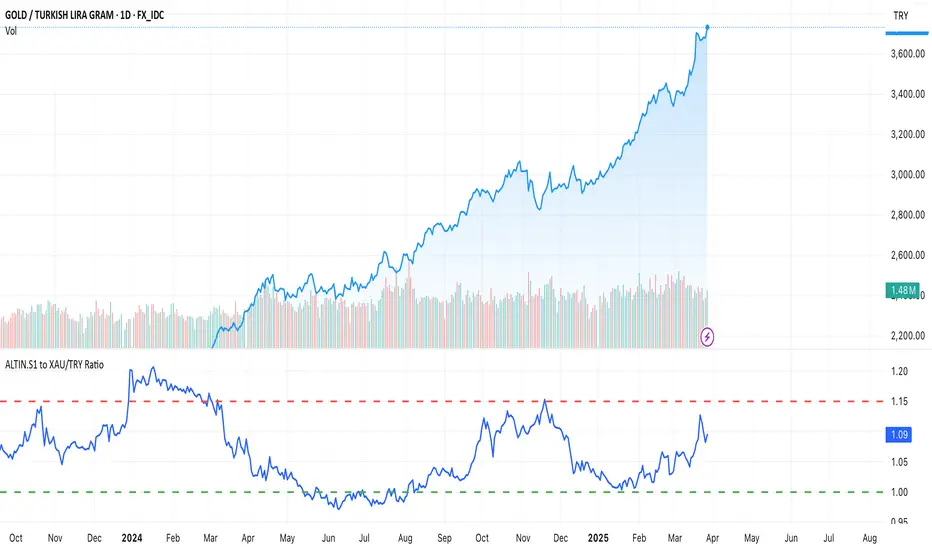
ALTIN.S1 to XAU/TRY RatioThis script calculates the ratio between the Turkish Mint Gold Certificate (ALTIN.S1) and the gold price in TRY (XAU/TRY). It helps traders track the premium or discount of ALTIN.S1 compared to the actual gold price. The script also includes upper (1.15) and lower (1.00) boundary lines for reference.
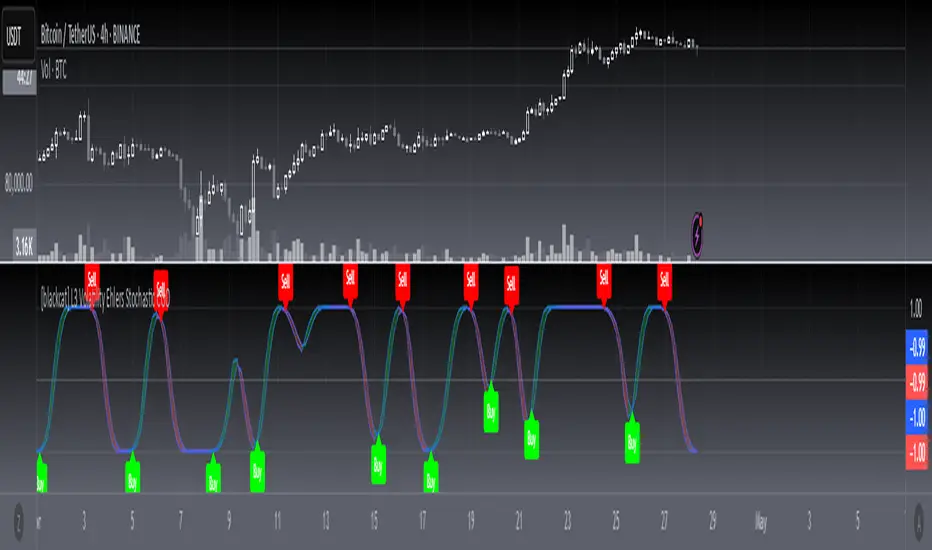
[blackcat] L3 Volatility Ehlers Stochastic CGOOVERVIEW
This advanced indicator integrates the Center of Gravity Oscillator (CGO) with an Ehlers-Stochastic framework and an Adaptive Local Minimum-Maximum Average (ALMA) smoothing algorithm. Designed for non-overlaid charts, it identifies market momentum shifts by analyzing price action through multi-layer volatility analysis.
FEATURES
• Dual-line system:
✓ Stochastic CGO: Core oscillating line derived from weighted OHLC price calculations
✓ ALMA Lagging Line: Smoothing component using customizable offset/sigma parameters
• Dynamic color scheme:
✓ Green/red trend differentiation via crossover comparison
✓ Optional fill areas between lines (toggleable)
• Clear trade signals:
✓ Buy/Sell labels triggered by mathematically defined crossovers
✓ Zero-reference baseline marker (#0ebb23)
• Customizable parameters:
Fast Length (9 default) controls CGO sensitivity
Slow Length (5 default) governs ALMA responsiveness
ALMA Offset/Sigma allow adaptive curve optimization
HOW TO USE
Configure core parameters:
• Adjust Fast Length (CGO timeframe window)
• Set Slow Length, ALMA Offset, and Sigma for smoother/laggier response
Interpret visuals:
• Bullish trend = green shaded zone (when primary line above lagging line)
• Bearish trend = red shaded zone (primary line below lagging line)
Analyze signals:
• Buy triggers occur when rising CGO crosses above ALMA while below zero
• Sell triggers activate when falling CGO breaks below ALMA after exceeding zero base
Optimize display:
✓ Enable/disable fill area via Fill Between Lines
LIMITATIONS
• Relies heavily on lookback periods - rapid market changes may reduce predictive accuracy
• Signal frequency increases during high-volatility environments
• Requires additional confirmation methods due to occasional premature crossovers
• Default parameter settings may lack universality across asset classes
NOTES
• Best paired with volume-based confirmations for stronger signals
• Reducing ALMA Sigma sharpens line responsiveness at cost of noise susceptibility
• Increasing Fast Length extends calculation horizon while reducing peak sensitivity
• Weighted OHLC source formula prioritizes closing prices for swing direction assessment
Smart MACD Reversal Oscillator Pro [TradeDots]The TradeDots Smart MACD Reversal Oscillator Pro is an advanced technical analysis tool that combines traditional MACD functionality with multi-layered signal detection and divergence identification systems. This comprehensive oscillator helps traders identify potential market reversals, trend continuations, and extremes with greater precision than conventional indicators.
📝 HOW IT WORKS
Accumulation & Distribution Detection System
The indicator begins with a proprietary calculation that identifies potential accumulation and distribution phases:
Calculation: Processes EMA differentials with specific time constants to detect underlying accumulation/distribution pressure
Visualization: Green-filled areas indicate accumulation phases (bullish pressure building) while red-filled areas show distribution phases (bearish pressure building)
Significance: This system often identifies trend reversals before traditional indicators by detecting institutional buying/selling activity
Multi-Timeframe MACD Implementation
Unlike traditional MACD indicators that use a single timeframe, this oscillator incorporates multiple calculation methods:
1. Primary Oscillator: Uses a proprietary calculation that combines price extremes with smoothed averages:
Implements specialized moving average types (SMMA and ZLEMA)
Generates a histogram that changes color based on price position relative to these averages
Produces a signal line that identifies crossover opportunities
2. Secondary MACD: Traditional MACD implementation with customizable parameters:
User-selectable MA types (SMA/EMA) for both oscillator and signal line
Color-coded histogram for momentum visualization
Separate crossover detection system
Dynamic Band System
The indicator implements an innovative dynamic band system to identify overbought and oversold conditions:
Band Calculation: Analyzes historical oscillator values to establish statistically significant extremes
Adaptive Scaling: Automatically adjusts to different market volatility regimes using a customizable Y-axis scale factor
Signal Integration: Incorporates band levels into signal generation for higher-probability trades
Signal Generation System
Four distinct signal types are generated to identify potential trading opportunities:
Green Dots: Bullish crossover signals (primary oscillator crosses above signal line)
Red Dots: Bearish crossover signals (primary oscillator crosses below signal line)
Blue Dots: Secondary MACD bullish crossovers in oversold territory
Orange Dots: Secondary MACD bearish crossovers in overbought territory
Advanced Divergence Detection
The oscillator incorporates a sophisticated divergence detection system:
Regular Divergences: Identifies when price makes lower lows while the oscillator makes higher lows (bullish) or price makes higher highs while the oscillator makes lower highs (bearish)
Hidden Divergences: Optional detection of continuation patterns (currently disabled by default)
Visual Markers: Clear labels identifying divergence formations directly on the chart
Zero-Line Filter: Optional filtering to only detect divergences that don't cross the zero line
🛠️ HOW TO USE
Signal Interpretation
Momentum Direction
Histogram Color: Green shades indicate bullish momentum, red shades indicate bearish momentum
Oscillator Position: Above zero indicates bullish momentum, below zero indicates bearish momentum
Filled Background: Green fill shows accumulation phases, red fill shows distribution phases
Buy Signals (In Order of Strength)
Bullish Divergence + Green Dot: Highest probability reversal signal (price making lower lows while oscillator makes higher lows, followed by crossover)
Green Dot Below Short Average Line: Strong oversold reversal signal
Green Dot + Blue Dot Alignment: Multiple indicator confirmation
Green Dot During Green Fill Expansion: Trend continuation signal
Sell Signals (In Order of Strength)
Bearish Divergence + Red Dot: Highest probability reversal signal (price making higher highs while oscillator makes lower highs, followed by crossover)
Red Dot Above Long Average Line: Strong overbought reversal signal
Red Dot + Orange Dot Alignment: Multiple indicator confirmation
Red Dot During Red Fill Expansion: Trend continuation signal
Trading Strategies
Divergence Trading Strategy
Identify "Bullish" or "Bearish" divergence labels on the chart
Wait for confirming dot signal in the same direction
Enter when both divergence and dot signal align
Set stops based on recent swing points
Target the opposite band or previous significant level
Overbought/Oversold Reversal Strategy
Wait for the oscillator to reach extreme bands (Long or Short Average lines)
Look for crossover signals at these extreme levels:
Bullish Crossover (Oversold): Green dots when oscillator is below Short Average
Bearish Crossover (Overbought): Red dots when oscillator is above Long Average
Enter when price confirms the reversal
Set stops beyond the recent extreme
Target the opposite band or at least the zero line
Multi-Confirmation Strategy
For highest probability trades, look for:
Multiple signal types aligning (e.g., Green + Blue dots or Red + Orange dots)
Signals occurring at band extremes
Divergence patterns reinforcing the signal direction
Background fill color supporting the signal (green fill for buys, red fill for sells)
⚙️ CUSTOMIZATION OPTIONS
The indicator offers extensive customization to adapt to different markets and trading styles:
Y-axis scale factor: Controls the band range multiplier (default 2.5)
Parameter 1: Controls the smoothing period for main calculations (default 8)
Parameter 2: Controls the signal line calculation period (default 9)
Fast/Slow Length: Controls traditional MACD calculation periods (12/26)
Oscillator MA Type: Selection between SMA and EMA for main oscillator
Signal Line MA Type: Selection between SMA and EMA for signal line
Divergence Settings: Customizable lookback parameters and display options
Don't touch the zero line?: Toggle option for divergence filtering
❗️LIMITATIONS
Signal Lag: The system identifies reversals after they have begun, potentially missing the absolute bottom or top
False Signals: Can occur during periods of high volatility or during ranging markets
Divergence Validation: Not all divergences lead to reversals; confirmation is essential
Timeframe Sensitivity: The indicator works best on intermediate timeframes (15m to 4h) for most markets
Bar Closing Requirement: All signals are based on closed candles and may be subject to change until the candle closes
RISK DISCLAIMER
Trading involves substantial risk, and most traders may incur losses. All content, tools, scripts, articles, and education provided by TradeDots are for informational and educational purposes only. Past performance is not indicative of future results.
This oscillator should be used as part of a complete trading approach that includes proper risk management, consideration of the broader market context, and confirmation from price action patterns. No trading system can guarantee profits, and users should always exercise caution and use appropriate position sizing.

Uptrick: Reversal Matrix +Overview
The Uptrick: Reversal Matrix + is designed as a comprehensive tool that organizes market information in a visually intuitive way. It presents a variety of signals and data points on the chart, aiming to provide clarity about potential reversals, directional momentum, and the broader context surrounding price behavior. By consolidating numerous indicators and statistics into a single interface, it serves as a versatile companion for different trading styles and time horizons.
Purpose
This indicator offers a multifunctional approach to market analysis. It seeks to help users gain a more holistic view of current conditions rather than focusing on isolated data points. Its primary goal is to guide traders toward recognizing evolving market structures, shifts in buying or selling pressure, and periods where price movement may exhibit stronger or weaker momentum. Because it is designed for adaptive use, it can cater to fast, intraday styles or more deliberate, long-term strategies, depending on how the user configures it.
Originality and Uniqueness
The Reversal Matrix + stands out by merging various categories of market data into cohesive visuals and tables. While many indicators offer singular signals or straightforward buy/sell prompts, this script integrates numerous underlying components and displays them in organized panels. Each piece of data, from volume characteristics to volatility states, is contextualized. This multi-layered approach helps traders see more than just a single dimension of the market. Whether one is exploring short-term breakouts, potential traps, or broader market regimes, the tool accommodates multiple perspectives within a single framework.
Inputs
1. Sensitivity.
This setting allows you to choose different levels based on how frequently you would like signals to appear. Selecting a higher sensitivity may capture faster changes but can produce a greater number of signals. More moderate or smoother settings can be preferable for users looking for less frequent but potentially clearer indications of shifts.
2. Trading Style.
This option adapts the tool to match conservative, normal, or more aggressive preferences. When choosing a conservative style, the script attempts to filter out smaller fluctuations, while the aggressive style might highlight more potential turning points as they emerge.
3. Potential Signal Threshold Difference
This setting adjusts the sensitivity of potential reversal signals. A lower value means the script will highlight only the most distinct setups, filtering out weaker or borderline scenarios. A higher value makes the tool more receptive to subtle shifts, potentially flagging more frequent signals. It allows users to fine-tune how responsive the script is to early momentum changes, depending on their preferred level of signal strictness.
4. Table Positions (Optional).
There are inputs that let you decide the on-chart position of the tables. You can enable or disable these tables and choose where they appear (for instance, top-right or bottom-left), depending on how you want the data displayed alongside price bars.
Table and Its Position
When enabled, a large table, known as the Full Metrics Table, offers extensive details about various technical and behavioral metrics. You can place it anywhere on your chart layout for convenience. It is designed to give you a granular view of current conditions without overwhelming the main price candles themselves.
Another, smaller panel known as the Final Verdict Table can also be displayed at a user-chosen position. This panel simplifies the script’s internal assessments into broader verdicts or summaries, allowing for a quick read on the market’s status.
Features
Multi-Faceted Signal and Alert System.
The indicator continuously scans market activity, highlighting events such as sudden rises or drops, changes in volatility, and shifts in momentum. Users can configure an array of alerts that instantly notify them of these occurrences, reducing the need to constantly monitor the chart.
Candle Overlays and Fading Effects .
In addition to standard chart candles, the script offers visual cues by shading or coloring candles differently when it detects certain signals. The fading mechanism gradually diminishes the bar color of older signals so that recent ones are more noticeable. This helps keep the focus on current opportunities while retaining a historical context.
Contextual Market Synopsis .
Each time a candle closes, the tool updates a variety of behind-the-scenes checks. This process helps the user see whether the market remains within the same general state (trending, ranging, or reversing) or is shifting rapidly. It also adds clarity when conditions may be transitioning between bullish and bearish inclinations.
Adaptable Settings for Different Styles .
Since traders differ in their tolerance for rapid fluctuations, the script’s adjustable Sensitivity and Trading Style inputs provide a way to fine-tune how it reacts. Someone trading on shorter timeframes can opt for more frequent signals that capture subtle changes, whereas a position trader might lean toward smoother outputs that highlight only stronger, more sustained conditions.
Extended Data Analysis .
Beyond immediate buy/sell possibilities, the Reversal Matrix+ delivers comprehensive data to help users confirm or question a market stance. A wide range of volume, volatility, and price action elements are factored in, giving each signal additional context rather than a simple green or red highlight.
Final Verdict Summaries .
When the second table is enabled, it condenses key aspects of the indicator’s internal logic into straightforward statements. Rather than navigating multiple data rows, you can check if the market appears more stable or volatile, potentially bullish or bearish, and whether a reversal probability is deemed high or low.
Large-Scale Alert Coverage .
More than fifty specialized alerts focus on distinct aspects, enabling users to track everything from volume anomalies to momentum acceleration.
Specialized Color Schemes .
To assist in quickly spotting bullish or bearish tendencies, candles and background components may be tinted in line with the latest recognized conditions. This visual reinforcement makes it easier to decide if ongoing signals confirm a previous stance or suggest a change.
Buy/Sell Signals
A core function of the script is to present buy and sell indications on the chart, identifying moments when price momentum may be shifting in a meaningful way. These signals come in two varieties: potential reversals and confirmed reversals. Potential reversals appear sooner, providing an early heads-up that market behavior could be turning. Confirmed reversals require a stronger confluence of underlying conditions, aiming to reduce the likelihood of false starts.
Internally, the script examines multiple facets—such as momentum flow, changes in volatility, and volume characteristics—to determine when a potential transition is noteworthy enough to highlight as a signal. As soon as those conditions line up, the script applies distinct markers or shapes to the candles, making it easy to spot these pivotal points on the chart. In addition, each new signal is emphasized through color-based candle shading, while older signals gradually fade to keep attention on the most relevant opportunities.
Although these signals can function as standalone cues, many traders pair them with the script’s other outputs—such as the Full Metrics Table, the Final Verdict Table, and specialized alerts—to form a more complete perspective. For instance, a potential buy signal spotted in real time may gain extra weight if certain metrics in the table reflect a constructive market backdrop. Meanwhile, the final verdict can offer a succinct confirmation or contradiction to what the buy or sell signal suggests. By combining these elements, traders can pursue strategies that balance both immediacy and context, tailoring their entries and exits to their own tolerance for risk and time horizon.
These features collectively allow users to explore the market from multiple angles. Whether one seeks a deeper technical dive or simpler guidance, the indicator’s layered design aims to cater to a broad spectrum of trading approaches.
Full Metrics Table
A key element of Uptrick: Reversal Matrix+ is the extensive set of data displayed within the Full Metrics Table. Below is an expanded explanation of the sixty-four core metrics. Each is accompanied by a brief statement about its practical significance.
Price
Displays current price.
Price Percent
Shows how much the price has shifted in percentage terms over a recent comparison point. Useful for gauging recent moves.
Vo Open
Presents price movement in relation to the candle’s open. Helps traders see if momentum favored bullish or bearish direction within the candle.
Range Percent
Depicts the span between high and low over the candle’s range, offering a measure of volatility within that candle.
Bodi Percent
Indicates how much of the candle is body as opposed to wick. Shows whether there was more decisive movement or more back-and-forth trading.
Volatility
Generically measures how dramatically price has been fluctuating over a given period. Helps users notice if the market is calm or very active.
Mpeed
Represents a sense of speed in price movement, potentially revealing if momentum is picking up or slowing down.
Accel
Points to how quickly price movement shifts from one level of speed to another. Can hint at a market that is accelerating or flattening out.
Volume
Reflects how many shares, contracts, or units are traded within the current bar. Higher volume may suggest stronger conviction.
Vol Percent
Shows how the volume compares, in percentage, to a previous period’s volume. Useful for spotting surges or drops in trading activity.
Mession Hi
Captures the highest point within a recent observed period or session. Often watched for potential breakout or reversal clues.
Mession Lo
Captures the lowest point within a recent observed period or session. Similarly, used to watch for support or breakdowns.
Pos Percent
Indicates how far the current price stands within its range. Being near the upper percentile suggests strength or an overbought scenario, depending on the viewpoint.
Mpread
Offers a sense of the overall spread in price action, which can reflect the determination of buyers or sellers within a candle.
Gap
Shows the difference in price from a prior close or from some previous reference point. Helps identify abrupt shifts in sentiment.
Conf. (Core)
Presents a general level of signal confidence based on internal checks. Assists in quickly scanning for whether a candle is aligned with broader market patterns.
Availability
Describes liquidity conditions, such as whether the market seems actively traded or comparatively thinner.
Conf. Bias
Highlights if price and momentum appear to confirm a prevailing direction, or if there is a noticeable lack of such alignment.
Valuation
Suggests how current price compares to an internal yardstick of fair or undervalued settings. Useful for spotting potential discount or premium zones.
Reversal
Warns about the possibility that price may turn from its recent direction. Intriguing for those who look for turning points at the end of trends.
Vol. Mtate
Indicates whether conditions are characterized by subdued or elevated swings. A higher reading may signal that caution is warranted.
Direction
Reflects a bullish or bearish inclination based on internal data. Provides a simplified way to see whether momentum is leaning up or down.
Vol. Clarity
Measures the clarity of volume movement, potentially detecting spikes or plateaus that can confirm or contradict price action.
Mtructure
Offers insight into how recent highs and lows are forming. A market that keeps printing higher highs and lows might suggest ongoing upward momentum.
Reaction
Shows how quickly the market responds to new information. Speedy changes may indicate more emotionally driven or news-influenced trading.
Trend Conf.
Suggests the tool’s assessment of how solid or fragile a given direction is. Useful for quickly seeing if a trend might persist.
Zone
Labels whether price is running near top or bottom levels of a selected range, helping identify if a market is pushing extremes.
Ehhaustion
Reveals if a move might be overextended and could retrace. Helpful in deciding whether to take profits or wait for a deeper confirmation.
Range Env
Describes whether the market is operating in a tight or wide range. Can help in choosing strategies like breakout or range-bound approaches.
Demand
Reports on whether buying demand or selling supply is more dominant in the current period. Assists in gauging short-term pressure.
Conf. Level
Provides an additional notion of how firm a signal might be. It may be labeled as early or fully formed, helping with timing considerations.
Momentum
Conveys whether price is accelerating upward, decelerating, or shifting into a more neutral gear.
Higher Close Percent
Indicates the frequency of consecutive higher closes over recent bars. Demonstrates if a market is consistently pushing upward.
Bear Trap
Points to scenarios where sellers could be caught off guard if the market reverses after a seemingly bearish move.
Bull Trap
Opposite of the above, hinting that buyers may be misled if price fails to hold after a seemingly bullish shift.
Vol Mqueeze
Identifies periods where volume and volatility might be compressing. Often used by traders to anticipate a potential abrupt expansion in movement.
Divergence
Suggests a mismatch between price and internal momentum signals. May foretell a hidden reversal or shift in direction.
Hist. Vol
Provides a longer-term viewpoint of how volatility stands in the broader scope, enabling comparison between current choppiness and previous norms.
Velocity
Tracks the overall vigor of price movement. A high velocity can mean powerful directional drive.
Wick Ratio
Analyzes the presence of upper or lower wicks and can suggest whether buying or selling tails are dominant within each bar.
Decision Bias
Indicates how the script perceives near-term market consensus. A strong bias may reveal one side’s momentum more clearly.
Break Chance
Hints at whether a local high or low has a fair possibility of being broken, which can be relevant to breakout-style trading.
Trend Mlope
Observes the slope of the ongoing trend, showing whether price is inclining, declining, or moving sideways over a specified window.
Trend Dir
Concisely states if that slope leans upward or downward. Useful for determining basic directional posture at a glance.
Regime
Groups the market environment into stable bullish, stable bearish, or a more unsettled pattern, helping shape strategic decisions.
Price Comparison
Shows whether price is trading above or below certain historical or moving references. Provides a broad sense of market posture.
Vol Mhift
Highlights any general upswing or downswing in traded volume, indicating whether participants are stepping in or scaling back.
Mtructural Balance
Offers an overview of whether the chart bars show more wick dominance or more body dominance. Helps in reading subtle shifts in power.
Flow Mtability
Portrays how orderly or choppy the price movement is. Less stable flow can lead to more frequent reversals or whipsaws.
Liquidity Pull
Shows the extent to which trading activity may be magnetizing price, helping gauge if there is substantial interest at certain zones.
Bar Mhape
Describes the candle’s shape, such as longer upper or lower tails, which can point to rejections or confirmations of direction.
Bui/Mell Rating
Reveals which side holds greater influence at a glance. Might display more leaning to buy strength or to sell pressure.
Range Vol Flow
Monitors the interplay between how wide the range is and how volume is behaving. If both are expanding, more powerful swings may follow.
Hiper Move
Spots especially strong or sudden moves. Could be a swift jump up or down, prompting attention to volatility management.
Candle Force
Indicates how forceful a candle’s close is compared to its full range. Strong force bars often underscore decisive momentum.
Hi/Lo Tag
Alerts you to newly formed session extremes, helping confirm if recent highs or lows are significant.
Price Action
Labels the candle as leaning bullish, leaning bearish, or neutral, providing a concise understanding of the immediate tone.
Vol Abnorm
Distinguishes between typical volume and unusually high volume that might signal institutional trading or news releases.
Trend Match
Checks if short-term direction is aligned with a broader trend. Clear alignment can strengthen confidence in that direction.
Move Confirm
Conveys whether the tool sees a price movement as already established or still in a formative state.
Momentum Focus
Gives a quick snapshot of whether price momentum is generally tilting higher, lower, or holding steady.
Vol Total
Presents a broad average or accumulated sense of volume over a longer window, providing context for current activity.
Hist. Accum
Positions price within a more extended historical range, allowing one to see if the asset is near major peaks or troughs.
Trap Bias
Informs if the market may be showing conditions that lead to bull traps or bear traps, cautioning traders who chase rapid moves.
Final Verdict Table
The secondary table, known as the Final Verdict Table, condenses the tool’s main findings into concise statements. It watches for patterns such as alignment of trends, clarity of momentum, perceived volatility conditions, and possible reversals. Depending on what the script observes, the table might suggest a bullish confluence, a bearish confluence, an unstable market environment, or a more neutral outlook. This feature is particularly helpful for traders who prefer quick insights over a detailed breakdown of every metric.
Metrics Included in the Final Verdict Table
Directional Momentum Flow
This entry shows how the indicator interprets short-term momentum for the current market. If momentum appears to be gaining strength in one direction, it may indicate that buyers or sellers have a slight edge, whereas a flat reading might suggest indecision.
Volatility Regime Assessment
This metric provides insight into whether the market is relatively calm, moderate, or experiencing elevated volatility. A calmer volatility state might favor steadier strategies, while higher volatility could signal the potential for wider price swings.
Trend Continuity Confidence
This section reflects how confident the tool is in the market’s current trend. It helps traders see whether recent action supports a persistent uptrend, downtrend, or if there is ambiguity that undermines the idea of a consistent directional movement.
Reversal Probability Index
Here, the table evaluates whether conditions are conducive to a market turnaround. If the script observes signs of exhaustion or conflict in momentum, it may suggest an increased possibility of the price switching direction.
Manipulation Detector
This component looks for signals that the market may be attempting to trap buyers or sellers. For instance, a sudden shift might hint at a bull or bear trap scenario. This readout serves to caution against seemingly obvious moves that could quickly reverse.
Final Verdict
Below these metrics, the table presents a single overall statement that integrates the above factors. This final verdict can range from identifying a bullish or bearish confluence to calling the market unstable or neutral if conditions are inconclusive. It is intended to be a quick, high-level summary of the script’s general stance on the market.
Any Other Features
Users can access more than fifty specialized alerts that target different market conditions, from potential trap scenarios to shifts in volatility regimes. These alerts can be integrated into various platforms, ensuring that traders receive immediate notifications when critical triggers occur. The color-coded candle approach, combined with fading effects, helps maintain chart readability. Over time, this setup encourages a balance between a detailed backdrop of market data and a clear depiction of fresh signals.
Why More than One Indicator
Integrating multiple components under one roof offers several advantages. It reduces the chance of relying on a single dimension, such as price action alone, which can sometimes mislead or generate frequent false signals. By combining various measures of volatility, volume, and price structure, the script can reveal confluences or disagreements among different elements. This multi-faceted approach can improve clarity, making it easier to decide when conditions line up favorably or when they conflict, thereby prompting caution.
Conclusion
In summary, the Uptrick: Reversal Matrix + aims to deliver a sweeping overview of market dynamics. It guides users from raw observations—like price and volume—to broader insights concerning trend stability, potential reversals, and overall liquidity. Its dual-table system allows for both fine-grained analysis and fast verdicts, catering to traders with varying degrees of time and attention. The numerous alerts and color coding schemes further round out its capacity for real-time monitoring and visually clear signal presentation.
Disclaimer
Trading involves inherent risks, and no tool can entirely eliminate uncertainty. This indicator’s materials are provided for informational purposes, without guarantees regarding future performance. Traders should exercise due diligence, apply sound risk management, and consider professional advice. The Uptrick: Reversal Matrix+ does not assume responsibility for financial decisions made based on its output.

Spot - Fut spread v2"Spot - Fut Spread v2"
indicator is designed to track the difference between spot and futures prices on various exchanges. It automatically identifies the corresponding instrument (spot or futures) based on the current symbol and calculates the spread between the prices. This tool is useful for analyzing the delta between spot and futures markets, helping traders assess arbitrage opportunities and market sentiment.
Key Features:
- Automatic detection of spot and futures assets based on the current chart symbol.
- Flexible asset selection: the ability to manually choose the second asset if automatic selection is disabled.
- Spread calculation between futures and spot prices.
- Moving average of the spread for smoothing data and trend analysis.
Flexible visualization:
- Color indication of positive and negative spread.
- Adjustable background transparency.
- Text label displaying the current spread and moving average values.
- Error alerts in case of invalid data.
How the Indicator Works:
- Determines whether the current symbol is a futures contract.
- Based on this, selects the corresponding spot or futures symbol.
- Retrieves price data and calculates the spread between them.
- Displays the spread value and its moving average.
- The chart background color changes based on the spread value (positive or negative).
- In case of an error, the indicator provides an alert with an explanation.
Customization Parameters:
-Exchange selection: the ability to specify a particular exchange from the list.
- Automatic pair selection: enable or disable automatic selection of the second asset.
- Moving average period: user-defined.
- Colors for positive and negative spread values.
- Moving average color.
- Background transparency.
- Background coloring source (based on spread or its moving average).
Application:
The indicator is suitable for traders who analyze the difference between spot and futures prices, look for arbitrage opportunities, and assess the premium or discount of futures relative to the spot market.

MTF TRIX Divergence Pro: Hidden & Regular Pattern DetectionTRIX Divergence Pro: Multi-Timeframe Analysis with Hidden & Regular Pattern Detection
📊 This TRIX indicator with extended features enables you to analyze price action across multiple timeframes with divergence detection capabilities.
🔍 Multi-Timeframe Analysis
View TRIX simultaneously across three timeframes:
• Current Timeframe - For primary analysis
• Higher Timeframe - To identify the overall market trend
• Lower Timeframe - For precise entry timing
🔮 Divergence Detection
This indicator identifies four types of divergences:
• Regular Bullish Divergence (Yellow) ⬆️
Price makes lower lows but TRIX makes higher lows
Indication: Potential end of downtrend
• Regular Bearish Divergence (Blue) ⬇️
Price makes higher highs but TRIX makes lower highs
Indication: Potential end of uptrend
• Hidden Bullish Divergence (Green) ↗️
Price makes higher lows but TRIX makes lower lows
Indication: Potential buying opportunity during price correction
• Hidden Bearish Divergence (Red) ↘️
Price makes lower highs but TRIX makes higher highs
Indication: Potential selling opportunity during temporary price recovery
⚙️ Advanced Features
• Smart scoring system to filter out weak signals
• Customizable timeframe display (current, higher, lower, or all)
• Divergence detection on TRIX signal line
• Option to show only the last divergence to reduce chart clutter
• Adjustable divergence line thickness and style
• Minimum price and oscillator deviation filters to reduce noise
📈 Trading Strategies
“Trend Surfing” Strategy 🌊
• Use higher timeframe TRIX to identify the main trend
• Wait for a price correction in the trend direction
• Look for hidden divergence on the current timeframe
• Enter when price may resume in the main trend direction
“Trend Reversal Hunter” Strategy 🔄
• Identify regular divergence on the current timeframe
• Confirm it with regular divergence on the higher timeframe
• Wait for TRIX to cross its signal line
• Consider a counter-trend position with proper risk management
⚡ Recommended Settings
Balanced Profile 🔋
• TRIX Length: 17
• Signal Length: 14
• Pivot Period: 5
• TRIX Display: CURRENT+UPPER
• TRIX Divergence: CURRENT+UPPER
• Min Bars Between Divs: 10
• Min Div Strength: 1.5
• Use Scoring System: yes
• Min Score: 3.5
Trend Following Profile 🧭
• TRIX Length: 21
• Signal Length: 17
• Pivot Period: 6
• TRIX Display: CURRENT+UPPER
• TRIX Divergence: CURRENT+UPPER
• Min Bars Between Divs: 8
• Min Div Strength: 1.2
• Use Scoring System: yes
• Min Score: 3.0
Scalping Profile 🔍
• TRIX Length: 9
• Signal Length: 6
• Pivot Period: 3
• TRIX Display: CURRENT+LOWER
• TRIX Divergence: CURRENT+LOWER
• Min Bars Between Divs: 5
• Min Div Strength: 0.8
• Use Scoring System: no
• Last Divergence: yes
💡 Practical Tips
• “Stacked” divergences across multiple timeframes may provide stronger potential signals
• Consider using hidden divergences for trend trades and regular divergences for reversals
• When TRIX crosses zero in the higher timeframe, it may suggest a significant trend change
• Thicker divergence lines = potentially stronger signals (automatically displayed)
• In choppy markets, increase the minimum divergence strength to help filter out false signals
• Always combine indicator signals with other forms of analysis and confirmation
⚠️ Risk Disclaimer
Trading involves risk. This indicator provides analysis tools but cannot guarantee profitable trades. Past performance is not indicative of future results. Users should combine this indicator with proper risk management and their own analysis. Financial markets lack certainty, and each user is responsible for their trading decisions.
Trade responsibly.

PARK Oscillator with BOS Percentage ChangePark Oscillator Pro - Smart Money Flow & Institutional Structure Analysis
Professional-Grade Market Structure Indicator
The Park Oscillator Pro is an advanced trading tool that reveals institutional order flow through:
🔹 Precision Market Structure Detection
Accurate Break of Structure (BOS) identification with volume confirmation
Clear Change of Character (CHoCH) markings for trend reversals
Dynamic polarity system for trend bias visualization
🔹 Post-BOS Performance Metrics (Unique Feature!)
Measures maximum price extension after BOS
Quantifies initial pullback strength (first 3 candles)
Auto-labels showing performance statistics
🔹 Smart Money Zones
Normalized oscillator (-100 to +100)
Premium/Discount areas for institutional levels
Adaptive moving average filter
🔹 Professional Divergence System
Regular & hidden divergences (bullish/bearish)
Customizable sensitivity filters
Visual trendlines connecting pivot points
Why Traders Love It:
✅ Institutional-grade market structure analysis
✅ Objective BOS/CHoCH detection (no repainting)
✅ Quantitative performance metrics for trade management
✅ Fully customizable visual alerts
Ideal For:
Institutional order flow traders
Market structure analysts
Price action traders looking for confluence
Those trading breakouts/breakdowns
"Not just signals - it quantifies the institutional footprint in your market."

Nasan Ultimate Health Index (NUHI)The Nasan Ultimate Health Index (NUHI) is a technical indicator designed to measure the relative health of a stock compared to a benchmark index or sector. By incorporating price action, volume dynamics, and volatility, NUHI provides traders with a clearer picture of a stock’s performance relative to the broader market.
The NUHI is based on the idea that a stock’s relative strength and momentum can be assessed more effectively when adjusted for volume behavior and benchmark comparison. Instead of looking at price movement alone, this indicator factors in:
The stock’s price trend (via EMA)
Volume participation (green vs. red volume) and volume ratio - SMA(volume, 21)/ SMA(volume, 252)
Volatility-adjusted performance (ATR-based scaling)
Comparison with a selected benchmark (e.g., SPX, NDX, sector ETFs)
This results in a normalized and comparative score that helps traders identify outperforming, neutral, and underperforming stocks within a specific market environment.
The NUHI is constructed using the following elements:
1️⃣ Stock Raw Score (Unadjusted Momentum)
The exponential moving average (EMA) of the hlc3 (average of high, low, close) is used to define the price trend.
The difference between the current EMA and the EMA from n bars ago shows whether the stock is gaining or losing momentum.
This difference is divided by the ATR (Average True Range) to adjust for volatility.
2️⃣ Volume Behavior Adjustment
Volume is split into green volume (up candles) and red volume (down candles).
The ratio of green to red volume determines whether buyers or sellers dominate over the selected period (n bars).
If the stock is in an uptrend, green volume is weighted higher; if in a downtrend, red volume is weighted higher.
The stock’s Volume Ratio (short-term SMA divided by long-term SMA) is adjusted based on this weight.
3️⃣ Benchmark Comparison
A similar Raw Score calculation is performed on the selected benchmark (SPX, NDX, or sector ETF).
Benchmark price movements, volume behavior, and ATR adjustments mirror the stock’s calculations.
This provides a reference point for evaluating the stock’s relative strength.
4️⃣ Normalization Process
Both the stock and benchmark raw scores are min-max normalized over the past 252 bars (1-year lookback).
This scales values between 0 and 1, ensuring fair comparisons regardless of absolute price differences.
5️⃣ NUHI Calculation
The final NUHI value is computed using a logarithmic ratio between the normalized stock score and the normalized benchmark score:
This transformation ensures a more symmetrical representation of overperformance and underperformance.
Performance Zones
Strong Outperforming (NUHI between >0.41 and 0.69)
Leading (NUHI between >0.10 and 0.41)
Transitioning Outperformance (NUHI between 0.10 and 0)
Equilibrium (NUHI 0)
Transitioning Underperformance (NUHI between -0.10 and 0)
Lagging (NUHI between < -0.1 and -0.41)
Strong Underperforming (NUHI between< -0.41 and -0.69 )
How to Use NUHI
✅ Identifying Strong Stocks
If NUHI > 0, the stock is outperforming its benchmark.
If NUHI < 0, the stock is underperforming the benchmark.
✅ Trend Confirmation
A steadily rising NUHI and raw score (colored green) suggests sustained strength bullish conditions.
A falling NUHI and raw score (colored orange) indicates weakness and possible rotation into other assets.
✅ Finding Reversals
Bullish Divergence: If NUHI is improving while the stock’s raw score is negative, it may signal a bottoming opportunity.
Bearish Signs: If NUHI is dropping despite price strength, it could hint at underlying weakness.
Why a Stock in a Downtrend Can Have NUHI > 0 (and Vice Versa )
NUHI measures performance relative to both its own history and the benchmark.
A stock’s recent movement is compared to how it usually behaves and how the benchmark is performing.
Example Scenarios:
Stock in a Downtrend but NUHI > 0
The stock may still be in a downtrend (negative raw score), but it’s performing better relative to its past downtrend behavior and better than the benchmark over the same period.
This could mean it’s showing relative strength compared to the broader market or sector.
Stock in an Uptrend but NUHI < 0
Even in a uptrend (positive raw score), the stock might be underperforming relative to its past uptrend behavior and underperforming the benchmark.
What This Means:
NUHI > 0 in a downtrend → The stock is falling less aggressively than usual and/or holding up better than the benchmark.
NUHI < 0 in an uptrend → The stock is gaining less than expected based on its history and/or lagging behind the benchmark.
NUHI helps identify relative strength or weakness .
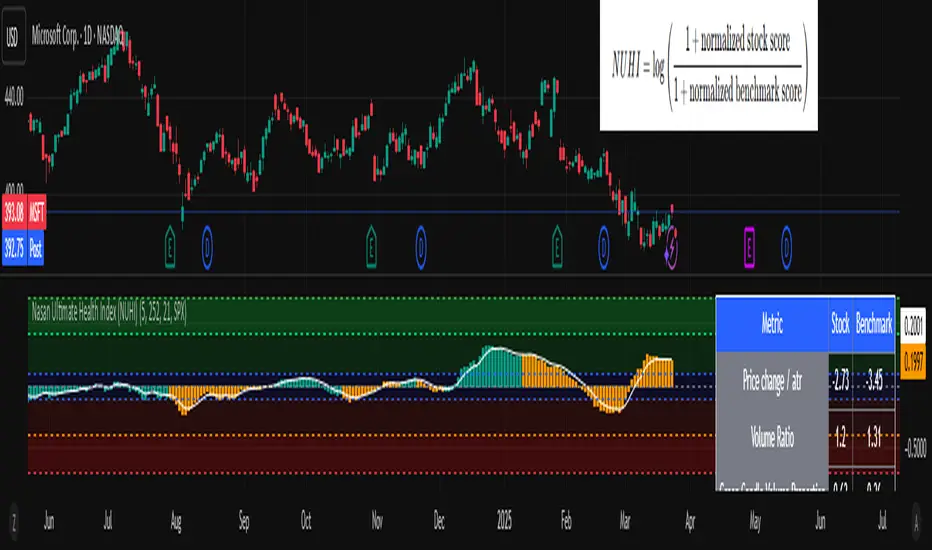
alphaJohnny Dynamic RSI IndicatorAlphaJohnny Dynamic RSI Indicator (Dyn RSI)
The Dynamic RSI Indicator (Dyn RSI) is a custom Pine Script tool designed for TradingView that aggregates Relative Strength Index (RSI) signals from multiple timeframes to provide a comprehensive view of market momentum. It combines RSI data from Weekly, Daily, 4-hour, 1-hour, and 30-minute intervals, offering traders a flexible and customizable way to analyze trends across different periods.
Key Features:
Multi-Timeframe RSI Aggregation: Combines RSI signals from user-selected timeframes for a holistic momentum assessment.
Dynamic or Equal Weighting: Choose between correlation-based dynamic weights (adjusting based on each timeframe’s correlation with price changes) or equal weights for simplicity.
Smoothed Momentum Line: A visually intuitive line that reflects the strength of the aggregate signal, smoothed for clarity.
Color-Coded Signal Strength:
Dark Green: Strong buy signal
Light Green: Weak buy signal
Yellow: Neutral
Light Red: Weak sell signal
Dark Red: Strong sell signal
Visual Markers: Large green triangles at the bottom for strong buy signals and red triangles at the top for strong sell signals.
How to Use:
Apply to Chart: Add the indicator to your TradingView chart (it will appear in a separate pane).
Customize Settings: Adjust inputs like RSI period, signal thresholds, included timeframes, weighting method, and smoothing period to fit your trading style.
Interpret Signals:
Momentum Line: Watch for color changes to gauge market conditions.
Triangles: Green at the bottom for strong buy opportunities, red at the top for strong sell opportunities.
Notes:
The indicator is designed for a separate pane (overlay=false), with triangles positioned relative to the pane’s range.
Fine-tune thresholds and weights based on your strategy and the asset being analyzed.
The source code is open for modification to suit your needs.
This indicator is ideal for traders seeking a multi-timeframe perspective on RSI to identify potential trend reversals and momentum shifts.
