RSI Convergence DivergenceRSI based oscillator inspired by the MACD.
Indicator that consists of two RSI calibrated at different lengths to take advantage of their convergence, divergence, overall direction, overall strength and several other metrics to extract signals from the price action.
This indicator includes:
- Fast RSI
- Slow RSI
- Signal line to identify convergence/divergence
- Simple moving average applied to the average of the two RSI
- DEMA applied to the average of the two RSI
- An average moving average of the SMA and DEMA
Some of the applications of this indicator:
- Simple convergence/divergence signaled by the moving average going above or below zero.
- Crossover between SMA and DEMA
- Combination of convergence/divergence and one of the 3 MAs reaching overbought or oversold threshold
- Average moving average going above or below 50
The combinations of different conditions are countless and limited only by the imagination of the user.
The visualization inputs, besides allowing to choose the candle coloring, give the user the ability to keep the chart clean and only see the signals he is interested into.
Centered Oscillators

Uptrick: Oscillator SpectrumUptrick: Oscillator Spectrum is a versatile trading tool designed to bring together multiple aspects of technical analysis—oscillators, momentum signals, divergence checks, correlation insights, and more—into one script. It includes customizable overlays and alert conditions intended to address a wide range of market conditions and trading styles.
Developed in Pine Script™, Uptrick: Oscillator Spectrum represents an extended version of the classic Ultimate Oscillator concept. It consolidates short-, medium-, and long-term momentum readings, applies correlation analysis across different symbols, and offers optional table-based metrics to provide traders with a more structured overview of potential trade setups. Whether used alongside your existing charts or as a standalone toolkit, it aims to build on and enhance the functionality of the standard Ultimate Oscillator.
### A Few Key Features
- Momentum Insights: Multiple timeframes for oscillators, plus buy/sell signal modes for flexible identification of overbought/oversold situations or crossovers.
- Divergence Detection: Automated checks for bullish/bearish divergences, aiming to help traders spot potential shifts in momentum.
- Correlation Meter: A visual histogram summarizing how selected assets are collectively trending. It is useful for tracking the bigger market picture.
- Gradient Overlays & Bar Coloring: Dynamic color transitions designed to emphasize changes in momentum, trend shifts, and overall sentiment without cluttering the chart.
- Money Flow Tracker: Tracks the flow of money into and out of the market using a smoothed Money Flow Index (MFI). Highlights overbought/oversold conditions with dynamic bar coloring and visual gradient fills, helping traders assess volume-driven sentiment shifts.
- Advanced Table Metrics: An optional table showing return on investment (ROI), collateral risk, and other contextual metrics for supported assets.
- Alerts & Automation: Configurable alerts covering divergence events, crossing of critical levels, and more, helping to keep traders informed of developments in real time.
### Intended Usage
- For Multiple Markets: Works on various markets (cryptocurrencies, forex pairs, stocks) to deliver a consistent view of momentum, potential entry/exit signals, and correlation.
- Adaptable Trading Styles: With customizable input settings, you can enable or disable specific features to align with your preferred strategies—intraday scalping, swing trading, or position holding.
By combining these elements under one indicator, Uptrick: Oscillator Spectrum allows traders to streamline analysis workflows, helping them stay focused on interpreting market moves and making informed decisions rather than juggling multiple scripts.
Purpose
Purpose of the “Uptrick: Oscillator Spectrum” Indicator
The “Uptrick: Oscillator Spectrum” indicator is intended to bring together several technical analysis elements into one tool. It combines oscillator-based momentum readings across different lookback periods, checks for potential divergences, provides optional buy/sell signal triggers, and offers correlation-based insights across multiple symbols. Additionally, it includes features such as bar coloring, gradient visualization, and user-configurable alerts to help highlight various market conditions.
By consolidating these functions, the script aims to help users systematically observe changing momentum, identify when prices reach user-defined overbought or oversold levels, detect when oscillator movements diverge from price, and examine whether different assets are aligning or diverging in their trends. The indicator also allows for optional advanced metric tables, which can supply further context on risk, ROI calculations, or other factors for supported assets. Overall, the script’s purpose is to organize multiple layers of technical analysis so that users have a structured way to evaluate potential trade opportunities and market behavior.
## Usage Guide
Below is an outline of how you can utilize the various components and features of Uptrick: Oscillator Spectrum in your charting workflow.
---
### 1. Using the Core Oscillator
- Basic View: By default, the script calculates a multi-timeframe oscillator (commonly displayed as the “Ultimate Oscillator”). This oscillator combines short-, medium-, and long-term measurements of buying pressure and true range.
- Overbought/Oversold Zones: You can configure thresholds (e.g., 70 for overbought, 30 for oversold) to help identify potential turning points. When the oscillator crosses these levels, it may indicate that price is extended in one direction.
- You can use the colors of the main oscillator to help you take short-term trades as well: cyan : Buy , red: Sell
- Alerts: If you enable alerts, the indicator can notify you when the oscillator crosses above or below your chosen overbought/oversold boundaries or when you get buy/sell signals.
---
### 2. Buy/Sell Signals in Overlay Modes
Uptrick: Oscillator Spectrum provides several signal modes and a choice between overlay true and overlay false or both. Additionally, you can pick which “line” (data source) the script uses to generate signals. This is set in the “Line to Analyze” dropdown, which includes Oscillator, HMA of Oscillator, and Moving Average. The following sections describe how each piece fits together.
---
#### Line to Analyze - Overlay Flase: Oscillator / HMA of Oscillator / Moving Average
1. Oscillator
- The core momentum reading, reflecting short-, medium-, and long-term periods combined.
2. HMA of Oscillator
- Applies a Hull Moving Average to the oscillator, creating a smoother but still responsive curve.
- Signals will be derived from this smoothed line. Some traders find it filters out minor fluctuations while remaining quicker to react than standard averages.
3. Moving Average
- Uses a user-selected MA type (SMA, EMA, WMA, etc.) over the oscillator values, rather than the raw oscillator itself.
- Tends to be more stable than the raw oscillator, but might delay signals more depending on the chosen MA settings.
---
#### Signal Modes
Regardless of which line you choose to analyze, you can use one of the following seven signal modes in overlay being true:
1. Overbought/Oversold (Pyramiding)
- What It Does:
- Buy signal when the chosen line crosses below the oversold threshold.
- Sell signal when it crosses above the overbought threshold.
- Pyramiding:
- Allows multiple triggers within the same overbought/oversold event.
2. Overbought/Oversold (Non Pyramiding)
- What It Does:
- Same thresholds but only one signal per oversold or overbought event.
- Use Case:
- Prevents repeated signals and chart clutter.
3. Smoothed MA Middle Crossover
- What It Does:
- Uses an MA defined by the user.
- Buy when crossing above the midpoint (50), Sell when crossing below.
- Use Case:
- Generates fewer signals, focusing on broader momentum shifts. There is no pyramiding.
In this image ,for example, the VWMA is used with length of 14 to identify buy sell signals.
4. Crossing Above Overbought/Below Oversold (Non Pyramiding)
- What It Does:
- Buy occurs if the line exits oversold territory by crossing back above it.
- Sell occurs if the line exits overbought territory by crossing back below it.
- Non Pyramiding:
- Restricts repeated signals until conditions reset.
5. Crossing Above Overbought/Below Oversold (Pyramiding)
- What It Does:
- Same thresholds, but allows multiple signals if the line repeatedly dips in and out of overbought or oversold.
- Use Case:
- More frequent entries/exits for active traders.
6. Divergence (Non Pyramiding)
- What It Does:
- Identifies bullish or bearish divergences using the chosen line vs. price.
- Buy for bullish divergence (higher low on the line vs. lower low on price), Sell for bearish divergence.
- Single Trigger:
- Only one signal per identified divergence event. (non pyramiding)
7. Divergence (Pyramiding)
- What It Does:
- Same divergence logic but triggers multiple times if the script sees repeated divergence in the same direction.
- Use Case:
- Could suit traders who layer positions during sustained divergence scenarios.
#### Overlay Modes: True vs. False
1. Overlay True
- Buy/sell arrows or labels plot directly on the main price chart, often at or near candlesticks.
- Bar Coloring:
- Can turn the candlestick bars green (buy) or red (sell), with intensity reflecting signal recency if bar coloring is enabled for this mode. (read below.)
- Advantage:
- Everything (price, signals, bar colors) is in one spot, making it straightforward to associate signals with current market action. You can adjust the periods of the main oscillator or lookback periods of divergences or overbought/oversold thresholds, to play around with your signals.
2. Overlay False
- Signal Placement:
- Signals appear in a sub-window or oscillator panel, leaving the main price chart uncluttered.
- Bar Coloring:
- You may still enable bar colors on the main chart (green for buy, red for sell) if desired.
- Alternatively, you can keep them neutral if you prefer a completely separate display of signals.
- Advantage:
- Clear separation of price action from signals, useful for cleaner charts or if using multiple overlay-based tools.
At the bottom are the signals for overlay being false and on the chart are the signals for overlay being true:
#### Bar Color Adjustments
1. Coloring Logic
- Bars typically go green on buy signals, red on sell signals.
- The opacity or brightness can vary to indicate signal freshness. When a new signal is formed, the color gets brighter. When there is no signal for a longer period of time, then the color slowly fades.
2. Enabling Bar Coloring
- In the indicator’s settings, turn on Bar Coloring.
- Choose “Signals Overlay True” or “Signals Overlay False” from the “Color should depend on:” dropdown, depending on which overlay approach you want to drive your bar colors. You can also chose the cloud fill in overlay false, correlation meter and smoothed HMA to color bars. Read more below:
### Bar Color Options:
When you enable bar coloring in Uptrick: Oscillator Spectrum, you can select which component or signal logic drives the color changes. Below are the five available choices:
---
#### Option 1: Overlay True Signals
- What It Does:
- Uses signals generated under the Overlay True mode to color the bars on your main chart.
- If a buy signal is triggered, bars turn green. If a sell signal occurs, bars turn red.
- Color Intensity:
- Bars appear brighter (more opaque) immediately after a new signal fires, then gradually fade over subsequent bars if no new signal appears.
---
#### Option 2: Overlay False Signals
- What It Does:
- Links bar coloring to signals generated when Overlay False mode is active.
- Buy/sell labels typically plot in a separate sub-window instead of the main chart, but your price bars can still change color based on these signals.
- Color Intensity:
- Similar to Overlay True, new buy/sell signals yield stronger color intensity, which fades over time.
- Use Case:
- Helps maintain a clean main chart (with signals off-chart) while still providing an immediate color-coded indication of a buy or sell state.
- Particularly useful if you prefer less clutter from signal markers on your price chart yet still want a visual representation of signal timing.
In this example normal divergence Pyramiding Signals are used in the overlay being true and the signals in overlay false are signals that analyze the HMA. This can help clear out noise (using a combo of both).
Option 3: Money Flow Tracker
What It Does:
The Money Flow Tracker uses the Money Flow Index (MFI), a volume-weighted oscillator, to measure the strength of money flowing into or out of an asset. The script smooths the raw MFI data using an EMA for a more responsive and visually intuitive output.
The feature also includes dynamic color gradients and bar coloring that highlight whether money flow is positive or negative.
Green Fill/Bar Color: Indicates positive money flow, suggesting potential accumulation.
Red Fill/Bar Color: Indicates negative money flow, signaling potential distribution.
Overbought and oversold thresholds are dynamically emphasized with transparency, making it easier to identify high-confidence zones.
Use Case:
Ideal for traders focusing on volume-driven sentiment to identify turning points or confirm existing trends.
Suitable for assessing broader market conditions when used alongside other indicators like oscillators or correlation analysis.
Provides additional clarity in spotting areas of accumulation or distribution, making it a valuable complement to price action and momentum studies.
---
#### Option 4: Correlation Meter
- What It Does:
- Colors the bars based on the indicator’s Correlation Meter output. The script checks multiple chosen tickers and sums up how many are trending positively or negatively.
- If the meter indicates an overall bullish bias (e.g., more than three assets in uptrend), bars turn green; if it’s bearish, bars turn red.
- Trend Readings:
- The correlation meter typically plots a histogram of bullish/neutral/bearish states. The bar color option links your chart’s candlestick coloring to that higher-level market sentiment.
- Use Case:
- Useful for traders wanting a quick visual prompt of whether the broader market (or a selection of related assets) is bullish or bearish at any given time.
- Helps avoid signals that conflict with the market majority.
#### Option 5: Smoothed HMA
- What It Does:
- Bar colors are driven by the slope or state of the Hull Moving Average (HMA) of the oscillator, rather than individual buy/sell triggers or correlation data.
- If the HMA indicates a strong upward slope (possibly darkening), bars may turn green; if the slope is downward (purple in the HMA line), bars turn red.
- Use Case:
- Ideal for those who focus on momentum continuity rather than discrete signals like overbought/oversold or divergence.
- May help identify smoother, more sustained moves, as the HMA filters out minor oscillations.
---
### 3. Using the Hull Moving Average (HMA) of the Oscillator
- HMA Calculation: You can enable a dedicated Hull Moving Average (HMA) for the oscillator. This creates a smoother line of the same underlying momentum reading, typically responding more quickly than classic moving averages.
- Color Intensity: As the HMA sustains an uptrend or downtrend, the script can adjust the line’s color. When slope momentum persists in one direction, the color appears more opaque. This intensification can hint that the existing direction may be well-established.
- Reversal Potential: If you observe the HMA color shifting or darkening after multiple bars of slope in the same direction, it may indicate increasing momentum. Conversely, a sudden flattening or change in color can be a clue that momentum is waning.
---
### 4. Moving Average Overlays & Gradient Cloud
- Oscillator MA: The script allows you to apply moving average types (SMA, EMA, SMMA, WMA, or VWMA) to the core oscillator, rather than to price. This can smooth out noise in the oscillator, potentially highlighting more consistent momentum shifts.
- Gradient Cloud: You can also enable a cloud in overlay true between two moving averages (for instance, a Hull MA and a Double EMA) on the price chart. The cloud fills with different colors, depending on which MA is above the other. This can provide a quick visual reference to bullish or bearish areas.
---
### 5. Divergence Detection
- Bullish & Bearish Divergence: By toggling “Calculate Divergence,” the script looks for oscillator pivots that contrast with price pivots (e.g., price making a lower low while the oscillator makes a higher low).
- A divergence is when the price makes an opposite pivot to the indicator value. E.g. Price makes lower low but indicator does higher low - This suggests a bullish divergence. THe opposite is for a bearish divergence.
- Visual Labels: When a divergence is found, labels (such as “Bull” or “Bear”) appear on the oscillator. This helps you see if the oscillator’s momentum patterns differ from the price movement.
- Filtering Signals: You can combine divergence signals with other features like overbought/oversold or the HMA slope to refine potential entries or exits.
---
### 6. Correlation & Multi-Ticker Analysis
- Correlation Meter: You can select up to five tickers in the settings. The script calculates a slope-based metric for each, then combines those metrics to show an overall bullish or bearish tendency (displayed as a histogram).
- Bar Coloring & Overlay: If you activate correlation-based bar coloring, it will reflect the broader trend alignment among the selected assets, potentially indicating when most are trending in the same direction.
- Use Case: If you trade multiple markets, the correlation histogram can help you quickly see if several major assets support the same market bias or are diverging from one another.
—
### 7. Money Flow Tracker
Money Flow Calculation: The Money Flow Tracker calculates the Money Flow Index (MFI) based on price and volume data, factoring in buying pressure and selling pressure. The output is smoothed using a low-lag EMA to reduce noise and enhance usability.
Visual Features:
Dynamic Gradient Fill:
The space between the smoothed MFI line and the midline (set at 50) is filled with a gradient.
Above 50: Green gradient, with intensity increasing as the MFI moves further above the midline.
Below 50: Red gradient, with intensity increasing as the MFI moves further below the midline.
This gradient provides a clear visual representation of money flow strength and direction, making it easier to assess sentiment shifts at a glance.
Overbought/Oversold Levels: Default thresholds are set at 70 (overbought) and 30 (oversold). When the MFI crosses these levels, it signals potential reversals or trend continuations.
Bar Coloring:
Bars turn green for positive money flow and red for negative money flow.
Color intensity fades over time, ensuring recent signals stand out while older ones remain visible without dominating the chart.
Alerts:
Alerts are triggered when the Money Flow Tracker crosses into overbought or oversold zones, keeping traders informed of critical conditions without constant monitoring.
Practical Applications:
Trend Confirmation: Use the Money Flow Tracker alongside the oscillator or HMA to confirm trends or identify potential reversals.
Volume-Based Reversal Signals: Spot turning points where price action aligns with shifts in money flow direction.
Sentiment Analysis: Gauge whether market participants are accumulating (positive flow) or distributing (negative flow) assets, offering an additional layer of insight into price movement.
(Space for an example chart: “Money Flow Tracker with gradient fills and overbought/oversold levels”)
### 8. Putting It All Together
- Combining Signals: A practical approach might be to watch for a bullish divergence in the oscillator, confirm it with a shift in the HMA slope color, and then wait for the price to be near or below oversold conditions. The correlation histogram may further confirm if the broader market is also leaning bullish at that time.
- Visual Cues: Bar coloring adds another layer, making your chart easier to interpret at a glance. You can also set alerts to ensure you don’t miss key events like divergences, crossovers, or moving average flips.
- Flexibility: Not every feature needs to be used simultaneously. You might opt to focus on divergences and overbought/oversold signals, or you could emphasize the correlation histogram and bar colors. The settings let you enable or disable each module to suit your style.
---
### 9. Tips for Customization
- Adjust Periods: Shorter periods can yield more signals but also more noise. Longer periods may provide steadier, but fewer, signals.
- Set Appropriate Alert Conditions: Only alert on events most relevant to your strategy to avoid overload.
- Explore Different MAs: Depending on the instrument, some moving average types may give a smoother or more responsive indication.
- Monitor Risk Management: As with any tool, these signals do not guarantee performance, so consider position sizing and stop-loss strategies.
---
By toggling and experimenting with the features described above—buy/sell signals, divergences, moving averages, dynamic gradient clouds, and correlation analysis—you can tailor Uptrick: Oscillator Spectrum to your specific trading approach. Each module is designed to give you a clearer, structured view of potential momentum shifts, overbought or oversold states, and the alignment or divergence of multiple assets.
## Features Explanation
Below is a detailed overview of key features in Uptrick: Oscillator Spectrum. Each component is designed to provide different angles of market analysis, allowing you to customize the tool to your preferences.
---
### 1. Main Oscillator
- Purpose: The primary oscillator in this script merges short-, medium-, and long-term views of buying pressure and true range into a single line.
- Calculation: It weights each period’s contribution (e.g., a heavier focus on the short period if desired) and normalizes the result on a 0–100 scale, where higher readings may suggest more robust momentum. (like from the classic Ultimate Oscillator)
- Practical Use:
- Traders can watch for overbought/oversold conditions at user-defined thresholds (e.g., 70/30).
- It can also provide a straightforward momentum reading for those who prefer to see if momentum is rising, falling, or leveling off.
---
### 2. HMA of the Smoothed Oscillator
- What It Is: A Hull Moving Average (HMA) applied to the main oscillator values. The HMA is often more responsive than standard MAs, offering smoother lines while preserving relatively quick reaction to changes.
- How It Works:
- The script takes the oscillator’s output and processes it through a Hull MA calculation.
- The HMA’s slope and color can change more dynamically, highlighting sharper momentum shifts.
- Why It’s Useful:
- By smoothing out minor fluctuations, the HMA can highlight trends in the oscillator’s trajectory.
- If you see an extended run in the HMA slope, it may indicate a more persistent trend in momentum.
- Color Intensity:
- As the HMA continues in one direction for several bars, the script can intensify the color, signaling stronger or more sustained momentum in that direction.
- Sudden changes in color or slope can signal the start of a new momentum swing.
---
### 3. Gradient Fill
This script uses two gradient-based visual elements:
1. Shining/Layered Gradient on the Main Oscillator
- Purpose: Adds multiple layers around the oscillator line (above and below) to emphasize slope changes and highlight how quickly the oscillator is moving up or down.
- Color Changes:
- When the oscillator rises, it uses a color scheme (e.g., aqua/blue) that intensifies as the slope grows.
- When the oscillator declines, it uses a distinct color (e.g., red/pink).
- User Benefit: Makes it easier to see at a glance if momentum is accelerating or decelerating, beyond just the numerical reading.
2. Dynamic Cloud Fill (Between MAs)
- Purpose: Allows you to plot two moving averages (for example, a short-term Hull MA and a longer-term DEMA) and fill the area between them with a color gradient.
- Bullish vs. Bearish:
- When the short MA is above the long MA, the cloud might appear in a greenish hue.
- When the short MA is below the long MA, the cloud can switch to red or another color.
- Transparency/Intensity:
- The fill can get more opaque if the difference between the two MAs is large, indicating a stronger trend but a higher probability of a reversal.
- User Benefit: Helps visualize changes in trend or momentum across multiple time horizons, all within a single chart overlay.
---
### 4. Correlation Meter & Symbol Inputs
- What It Is: This feature looks at multiple user-selected symbols (e.g., BTC, ETH, BNB, etc.) and computes each symbol’s short-term slope. It then aggregates these slopes into an overall “trend” score.
- Inputs Configuration:
1. Ticker Inputs: You can specify up to five different tickers.
2. Timeframe: Decide whether to pull data from different chart timeframes for each symbol.
3. Slope Calculation: The script may compute, for instance, a 5-period SMA minus a 20-period SMA to gauge if each symbol is trending up or down.
- Market Trend Histogram:
- Displays a column that goes above/below zero depending on how many symbols are bullish or bearish.
- If more than three (out of five) symbols are bullish, the histogram can show a green bar at +1; if fewer than three are bullish, it can show red at –1.
- How to Use:
- Quick Glance: Lets you know if most correlated assets are aligning or diverging.
- Bar Coloring (Optional): If enabled, your main chart’s bars can reflect the aggregated correlation, turning green or red depending on the meter’s reading.
---
### 5. Advanced Metrics Table
- What It Is: An optional table displaying additional metrics for several cryptocurrencies (or any symbols you define).
- Metrics Included:
1. ROI (30D): Calculates return relative to the lowest price in a 30-day period.
2. Collateral Risk: Uses standard deviation to assess volatility (higher risk if standard deviation is large).
3. Liquidity Recovery: A rolling average of volume, aiming to show how liquidity flows might recover over time.
4. Weakening (Rate of Change): Reflects how quickly price is changing compared to previous bars.
5. Monetary Bias (SMA): A simple average of recent prices. If price is below this SMA, it might be seen as undervalued relative to the short term.
6. Risk Phase: Categorizes risk as low, medium, or high based on the standard deviation figure.
7. DCA Signal: Suggests “Accumulate” or “Do Not Accumulate” by checking if the current price is below or above the SMA.
- Why It’s Useful:
- Offers a concise view of multiple assets in one place—helpful for portfolio-level insight.
- DCA (Dollar-Cost Averaging) suggestions can guide longer-term strategies, while volatility (collateral risk) helps gauge how aggressive the price swings might be.
---
### 6. Other Vital Aspects
- Alerts & Notifications:
- The script can trigger alerts for various conditions—crossovers, divergence detections, overbought/oversold transitions, or correlation-based signals.
- Useful for automating watchlists or ensuring you don’t miss a key setup while away from the screen.
- Customization:
- Each module (oscillator settings, divergence detection, correlation meter, advanced metrics table, etc.) can be enabled or disabled based on your preferences.
- You can fine-tune parameters (e.g., periods, smoothing lengths, alert triggers) to align the indicator with different trading styles—scalping, swing, or position trading.
- Combining Features:
- One might watch the main oscillator for momentum extremes, confirm via the HMA slope, check if correlation supports the same bias, and look at the table for risk-phase validation.
- This multi-layer approach can help develop a more structured and informed trading view.
(Space for an example chart: “A fully configured layout showing oscillator, HMA, gradient cloud, correlation meter, and table all in use.”)
7. Money Flow Tracker
Purpose: The Money Flow Tracker adds a volume-based perspective to the indicator suite by incorporating the Money Flow Index (MFI), which assesses buying and selling pressure over a defined period. By smoothing the MFI using an exponential moving average (EMA), the feature highlights the directional flow of capital into and out of the market with greater clarity and reduced noise.
Dynamic Gradient Visualization:
The Money Flow Tracker enhances visual analysis with gradient fills that reflect the MFI’s relationship to the midline (50).
Above 50: A green gradient emerges, intensifying as the MFI moves higher, indicating stronger positive money flow.
Below 50: A red gradient appears, with deeper shades signifying increasing selling pressure.
Transparency dynamically adjusts based on the MFI’s proximity to the midline, making high-confidence zones (closer to 0 or 100) visually distinct.
Directional Sensitivity:
The Tracker emphasizes the importance of overbought (above 70) and oversold (below 30) zones. These thresholds help traders identify when an asset might be overextended, signaling potential reversals or trend continuations.
The inclusion of a midline (50) as a neutral zone helps gauge shifts between accumulation (money flowing in) and distribution (money flowing out).
Bar Integration:
By enabling bar coloring linked to the Money Flow Tracker, traders can visualize its impact directly on price bars.
Green bars reflect positive money flow (above 50), signaling bullish conditions.
Red bars indicate negative money flow (below 50), highlighting bearish sentiment.
Intensity adjustments ensure that recent signals are more visually prominent, while older signals gradually fade for a clean, non-cluttered chart.
Key Advantages:
Volume-Informed Context: Traditional oscillators often focus solely on price; the Money Flow Tracker incorporates volume, adding a crucial dimension for analyzing market behavior.
Adaptive Filtering: The EMA-smoothing feature ensures that sudden, insignificant spikes in volume don’t trigger false signals, providing a clearer and more actionable representation of money flow trends.
Early Warning System: Divergences between price movement and the Money Flow Tracker’s trends can signal potential turning points, helping traders anticipate reversals before they occur.
Practical Use Cases:
Trend Confirmation: Pair the Money Flow Tracker with the oscillator or HMA to confirm bullish or bearish trends. For example, a rising oscillator with positive money flow indicates strong buying interest.
Identifying Entry/Exit Zones: Use overbought/oversold conditions as entry/exit points, particularly when combined with other features like divergence detection.
Market Sentiment Analysis: The Tracker’s ability to dynamically assess buying and selling pressure provides a clear picture of market sentiment, helping traders adjust their strategies to align with broader trends.
By understanding these features—main oscillator readings, the HMA’s smoothing capabilities, gradient-based visual highlights, correlation insights, advanced metrics, and the money flow tracker—you can tailor Uptrick: Oscillator Spectrum to your specific needs, whether you’re focusing on quick trades, longer-term market moves, or broad portfolio health.
Originality of the “Uptrick: Oscillator Spectrum” Indicator
While it includes elements of standard momentum analysis, Uptrick: Oscillator Spectrum sets itself apart by adding an array of features that broaden the typical oscillator’s scope:
1. Slope Coloring & Layered Gradient Effects
- Beyond just plotting a single line, the indicator visually highlights momentum shifts using color changes and gradient fills.
- As the oscillator’s slope becomes steeper or flatter, these gradients intensify or fade, helping users see at a glance when momentum is accelerating, slowing, or reversing.
2. Mean Reversion & Divergence Detection
- The script offers optional logic for marking potential mean reversion points (e.g., overbought/oversold crossovers) and flagging divergences between price and the oscillator line.
- These divergence signals come with adjustable lookback parameters, giving traders control over how recent or extended the pivots should be for detection.
- This functionality can reveal subtle momentum discrepancies that a basic oscillator might overlook.
3. Integrated Multi-Asset Correlation Meter
- In addition to monitoring a single symbol, the indicator can fetch data for multiple tickers. It aggregates each symbol’s slope into a histogram showing whether the broader market (or a group of assets) leans bullish or bearish.
- This cross-market insight moves beyond standard “one-symbol, one-oscillator” usage, adding a bigger-picture perspective in one tool.
4. Advanced Metrics Table
- Users can enable a table that covers ROI calculations, volatility-based risk (“Collateral Risk”), liquidity checks, DCA signals, and more.
- Rather than just seeing an oscillator value, traders can view additional metrics for selected assets in one place, helping them judge overall market conditions or assess multiple instruments simultaneously.
5. Flexible Overlay & Bar Coloring
- Signals can be displayed directly on the price chart (Overlay True) or in a sub-window (Overlay False).
- Bars themselves may change color (e.g., green for bullish or red for bearish) according to different rules—signals, dynamic cloud fill, correlation meter states, etc.
- This adaptability allows traders to keep the chart as simple or as info-rich as they prefer.
6. Custom Smoothing Options & HMA Extensions
- The oscillator can be processed further with a Hull Moving Average (HMA) to reduce noise while still reacting quickly to market changes.
- Slope-based coloring on the HMA provides an additional layer of visual feedback, which is not common in a standard oscillator.
By blending traditional momentum checks with slope-based color feedback, mean reversion triggers, divergence signals, correlation analysis, and an optional metrics table, Uptrick: Oscillator Spectrum offers a more rounded approach than a typical oscillator. It integrates multiple market insights—both visual and analytical—into one script, giving users a broader toolkit for studying potential reversals, gauging momentum strength, and assessing multi-asset trends.
## Conclusion
Uptrick: Oscillator Spectrum brings together multiple layers of analysis—oscillator momentum, divergence detection, correlation insights, HMA smoothing, and more—into one adaptable toolkit. It aims to streamline your charting process by offering meaningful visual cues (such as gradient fills and bar color shifts), advanced tables for broader market data, and flexible alerts to keep you informed of potential setups.
Traders can choose the specific features that suit their style, whether they prefer to focus on raw oscillator signals, multi-ticker correlation, or smooth trend cues from the HMA. By centralizing these different methods in one place, Uptrick: Oscillator Spectrum can help users build more structured approaches to spotting trend shifts and extended conditions, while also remaining compatible with additional analysis techniques.
---
### Disclaimer
This script is provided for informational purposes only and does not constitute financial or investment advice. Past performance is not indicative of future results, and all trading involves risk. You should carefully consider your objectives, risk tolerance, and financial situation before making any trading decisions.

OBV TSI IndicatorThe OBV TSI Indicator combines two powerful technical analysis tools: the On-Balance Volume (OBV) and the True Strength Index (TSI). This hybrid approach provides insights into both volume dynamics and momentum, helping traders identify potential trend reversals, breakouts, or continuations with greater accuracy.
The OBV TSI Indicator tracks cumulative volume shifts via OBV and integrates the TSI for momentum analysis. It offers customizable moving average options for further smoothing. Visual trendlines, pivot points, and signal markers enhance clarity.
The OBV tracks volume flow by summing volumes based on price changes. Positive volume is added when prices rise, and negative volume is subtracted when prices fall. The result is smoothed to detect meaningful trends in volume. A volume spread is derived from the difference between the smoothed OBV and cumulative volume. This is then adjusted by the price deviation to generate the shadow spread, which highlights critical volume-driven price levels.
The shadow spread is added to either the high or low price, depending on its sign, producing a refined OBV output. This serves as the main source for the subsequent TSI calculation. The TSI is a momentum oscillator calculated using double-smoothed price changes. It provides an accurate measure of trend strength and direction.
Various moving average options, such as EMA, DEMA, or TEMA, are applied to the smoothed OBV for additional trend filtering. Users can select their preferred type and length to suit their trading strategy. Trendlines are plotted to visualize the overall direction. When a significant change in trend is detected, up or down arrows indicate potential buy or sell signals. The script identifies key pivot points based on the highest and lowest levels within a defined period. These pivots help pinpoint reversal zones.
The indicator offers customization options, allowing users to adjust the OBV length for smoothing, choose from various moving average types, and fine-tune the short, long, and signal periods for TSI. Additionally, users can toggle visibility for trendlines, signals, and pivots to suit their preferences.
This indicator is ideal for practical use cases such as spotting potential trend reversals by observing TSI crossovers and pivot levels, anticipating breakouts from key price levels using the shadow spread, and validating trends by aligning TSI signals with OBV and moving averages.
The OBV TSI Indicator is a versatile tool designed to enhance decision-making in trading by combining volume and momentum analysis. Its flexibility and visual aids make it suitable for traders of all experience levels. By leveraging its insights, you can confidently navigate market trends and improve your trading outcomes.

CDVDThis script calculates and visualizes the Cumulative Delta Volume Divergence (CDVD) with the MACD indicator. It combines volume-based market analysis with MACD-style momentum to help identify false signals with divergences, trends or potential reversals.
The cumulative delta volume divergence is derived by summing up the differences between uptick volume (volume during price increases) and downtick volume (volume during price decreases) over time.
A Fast EMA and Slow EMA are calculated from the cumulative delta volume to smooth the data.
The difference between these EMAs forms the MACD Line.
A Signal Line is created by applying another EMA to the MACD Line.
The difference between the MACD Line and the Signal Line forms the Histogram:
This indicator helps traders:
Identify false signals with divergences unseen on MACD and Price Action.
Identify bullish or bearish momentum in market volume.
Spot potential trend reversals based on changes in cumulative delta volume dynamics.
Analyze the interplay between price momentum and volume flow.
It’s especially useful for traders who focus on volume-based market dynamics.
Snapshot: Use in conjunction with MACD to identify true divergences.
Important Notice:
Trading financial markets involves significant risk and may not be suitable for all investors. The use of technical indicators like this one does not guarantee profitable results. This indicator should not be used as a standalone analysis tool. It is essential to combine it with other forms of analysis, such as fundamental analysis, risk management strategies, and awareness of current market conditions. Always conduct thorough research.
Disclaimer:
Past performance is not indicative of future results. This indicator is provided for informational and educational purposes only and should not be considered investment advice. Always conduct your own research before making any trading decisions.
Note: The effectiveness of any technical indicator can vary based on market conditions and individual trading styles. It's crucial to test indicators thoroughly using historical data before applying them in live trading scenarios.

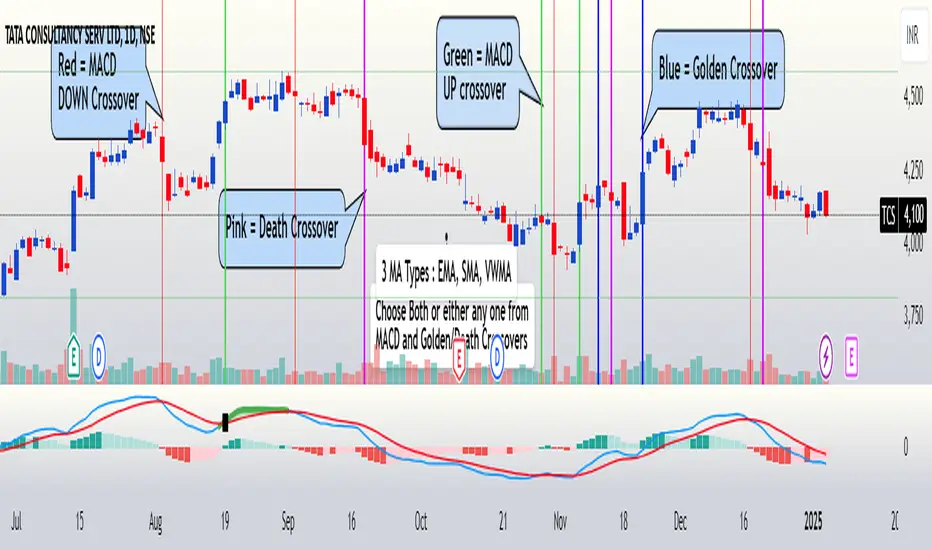
FuTech : MACD Crossovers Advanced Alert Lines=============================================================
Indicator : FuTech: MACD Crossovers Advanced Alert Lines
Overview:
The "FuTech: MACD Crossovers Advanced Alert Lines" indicator is designed to assist traders in identifying key technical patterns using the :-
1. MACD (Moving Average Convergence Divergence) and
2. Golden/Death Crossovers
By visualizing these indicators directly on the chart with advanced lines, it helps traders make more informed decisions on when to enter or exit trades.
=============================================================
Key Features of "FuTech: MACD Crossovers Advanced Alert Lines":
1. MACD Crossovers:
a) The MACD is one of the most widely used indicators for identifying momentum shifts and potential buy/sell signals. This indicator plots vertical lines on the chart whenever the MACD line crosses the signal line.
b) Upward Crossover (Bullish Signal) : When the MACD line crosses above the signal line, a green vertical line will appear, indicating a potential buying opportunity.
c) Downward Crossover (Bearish Signal) : When the MACD line crosses below the signal line, a red vertical line will appear, signaling a potential selling opportunity.
2. Golden Cross & Death Cross:
a) The Golden Cross occurs when the price moves above a long-term moving average (like the 50-day moving average), signaling a potential upward trend.
b) The Death Cross occurs when the price moves below a long-term moving average, signaling a potential downward trend.
c) These crossovers are displayed with customizable lines on the chart to easily spot when the market is shifting direction.
d) Golden Cross (Bullish Signal) : A blue vertical line appears when the price crosses above the selected long-term moving average.
e) Death Cross (Bearish Signal) : A purple vertical line appears when the price crosses below the selected long-term moving average.
=============================================================
Customization Options:
This indicator offers several customization options to suit your trading preferences:
1) MACD Settings:
a) Choose between different moving average types (EMA, SMA, or VWMA) for calculating the MACD.
b) Adjust the lengths of the fast, slow, and signal MACD periods.
c) Control the width and color of the vertical lines drawn on the chart for both up and down crossovers.
2) Golden Cross / Death Cross Settings:
a) Select the moving average type for the Golden Cross / Death Cross (EMA, SMA, or VWMA).
b) Define the lookback period for calculating the Golden Cross / Death Cross.
c) Customize the appearance of the Golden and Death Cross lines, including their width and color.
You can use both as well as either of the MACD lines or Golden Crossover / Death Crossover Lines respectively as per your trading strategies
=============================================================
How "FuTech: MACD Crossovers Advanced Alert Lines" indicator Works:
a) The indicator monitors the price and calculates the MACD and Golden/Death Crosses.
b) When the MACD line crosses above or below the signal line, or when the price crosses above or below the long-term moving average, it plots a vertical line on the chart.
c) These lines help traders quickly spot potential turning points in the market, providing clear signals to act upon.
=============================================================
Use Case:
a) Swing Traders: The indicator is useful for spotting momentum shifts and trend reversals, helping you time entries and exits for short- to medium-term trades.
b) Long-Term Traders: The Golden and Death Cross signals help identify major trend changes, giving insights into potential market shifts.
=============================================================
Why Use This "FuTech: MACD Crossovers Advanced Alert Lines" Indicator ?
a) Clear Visuals : The vertical lines provide clear and easy-to-spot signals for MACD crossovers and Golden/Death Crosses.
b) Customizable : Adjust settings for your personal trading strategy, whether you're focusing on short-term momentum or long-term trend shifts.
c) Supports Decision Making : With its advanced line plotting and customizable features, this indicator helps you make quicker and more informed trading decisions.
=============================================================
How to Use:
a) MACD Crossovers: Look for green lines to signal potential buying opportunities (when the MACD line crosses above the signal line) and red lines for selling opportunities (when the MACD line crosses below the signal line).
b) Golden Cross / Death Cross: Use the blue lines to confirm when a positive trend may begin (Golden Cross) and purple lines to warn when a negative trend may start (Death Cross).
=============================================================
Conclusion:
"FuTech: MACD Crossovers Advanced Alert Lines" indicator combines two powerful technical analysis tools, the MACD and Golden/Death Crosses, to provide clear, actionable signals on your chart.
By customizing the appearance of these signals and combining them with your trading strategy, you can enhance your decision-making process and improve your trading outcomes.
=============================================================
Thank you !
Jai Swaminarayan Dasna Das !
He Hari ! Bas Ek Tu Raji Tha !
=============================================================
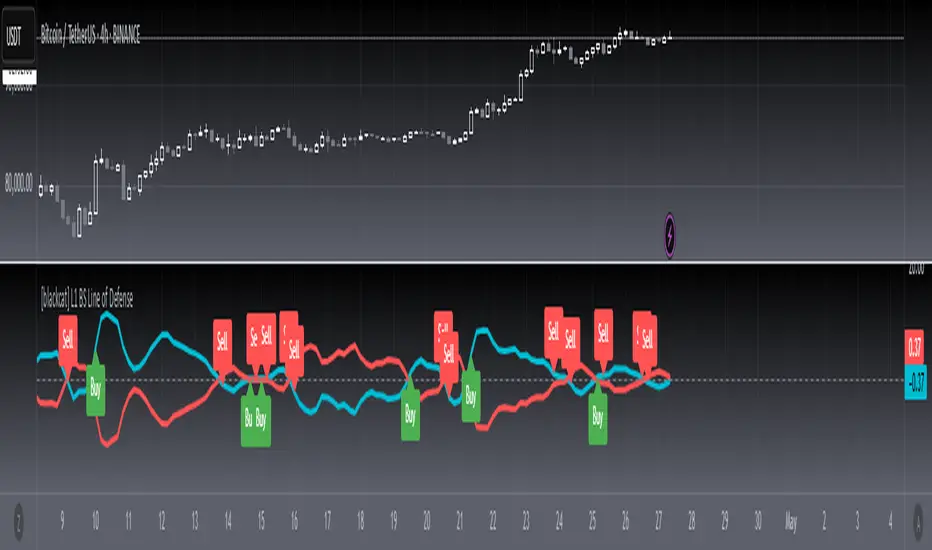
Regime Classifier Oscillator (AiBitcoinTrend)The Regime Classifier Oscillator (AiBitcoinTrend) is an advanced tool for understanding market structure and detecting dynamic price regimes. By combining filtered price trends, clustering algorithms, and an adaptive oscillator, it provides traders with detailed insights into market phases, including accumulation, distribution, advancement, and decline.
This innovative tool simplifies market regime classification, enabling traders to align their strategies with evolving market conditions effectively.
👽 What is a Regime Classifier, and Why is it Useful?
A Regime Classifier is a concept in financial analysis that identifies distinct market conditions or "regimes" based on price behavior and volatility. These regimes often correspond to specific phases of the market, such as trends, consolidations, or periods of high or low volatility. By classifying these regimes, traders and analysts can better understand the underlying market dynamics, allowing them to adapt their strategies to suit prevailing conditions.
👽 Common Uses in Finance
Risk Management: Identifying high-volatility regimes helps traders adjust position sizes or hedge risks.
Strategy Optimization: Traders tailor their approaches—trend-following strategies in trending regimes, mean-reversion strategies in consolidations.
Forecasting: Understanding the current regime aids in predicting potential transitions, such as a shift from accumulation to an upward breakout.
Portfolio Allocation: Investors allocate assets differently based on market regimes, such as increasing cash positions in high-volatility environments.
👽 Why It’s Important
Markets behave differently under varying conditions. A regime classifier provides a structured way to analyze these changes, offering a systematic approach to decision-making. This improves both accuracy and confidence in navigating diverse market scenarios.
👽 How We Implemented the Regime Classifier in This Indicator
The Regime Classifier Oscillator takes the foundational concept of market regime classification and enhances it with advanced computational techniques, making it highly adaptive.
👾 Median Filtering: We smooth price data using a custom median filter to identify significant trends while eliminating noise. This establishes a baseline for price movement analysis.
👾 Clustering Model: Using clustering techniques, the indicator classifies volatility and price trends into distinct regimes:
Advance: Strong upward trends with low volatility.
Decline: Downward trends marked by high volatility.
Accumulation: Consolidation phases with subdued volatility.
Distribution: Topping or bottoming patterns with elevated volatility.
This classification leverages historical price data to refine cluster boundaries dynamically, ensuring adaptive and accurate detection of market states.
Volatility Classification: Price volatility is analyzed through rolling windows, separating data into high and low volatility clusters using distance-based assignments.
Price Trends: The interaction of price levels with the filtered trendline and volatility clusters determines whether the market is advancing, declining, accumulating, or distributing.
👽 Dynamic Cycle Oscillator (DCO):
Captures cyclic behavior and overlays it with smoothed oscillations, providing real-time feedback on price momentum and potential reversals.
Regime Visualization:
Regimes are displayed with intuitive labels and background colors, offering clear, actionable insights directly on the chart.
👽 Why This Implementation Stands Out
Dynamic and Adaptive: The clustering and refit mechanisms adapt to changing market conditions, ensuring relevance across different asset classes and timeframes.
Comprehensive Insights: By combining price trends, volatility, and cyclic behaviors, the indicator provides a holistic view of the market.
This implementation bridges the gap between theoretical regime classification and practical trading needs, making it a powerful tool for both novice and experienced traders.
👽 Applications
👾 Regime-Based Trading Strategies
Traders can use the regime classifications to adapt their strategies effectively:
Advance & Accumulation: Favorable for entering or holding long positions.
Decline & Distribution: Opportunities for short positions or risk management.
👾 Oscillator Insights for Trend Analysis
Overbought/oversold conditions: Early warning of potential reversals.
Dynamic trends: Highlights the strength of price momentum.
👽 Indicator Settings
👾 Filter and Classification Settings
Filter Window Size: Controls trend detection sensitivity.
ATR Lookback: Adjusts the threshold for regime classification.
Clustering Window & Refit Interval: Fine-tunes regime accuracy.
👾 Oscillator Settings
Dynamic Cycle Oscillator Lookback: Defines the sensitivity of cycle detection.
Smoothing Factor: Balances responsiveness and stability.
Disclaimer: This information is for entertainment purposes only and does not constitute financial advice. Please consult with a qualified financial advisor before making any investment decisions.

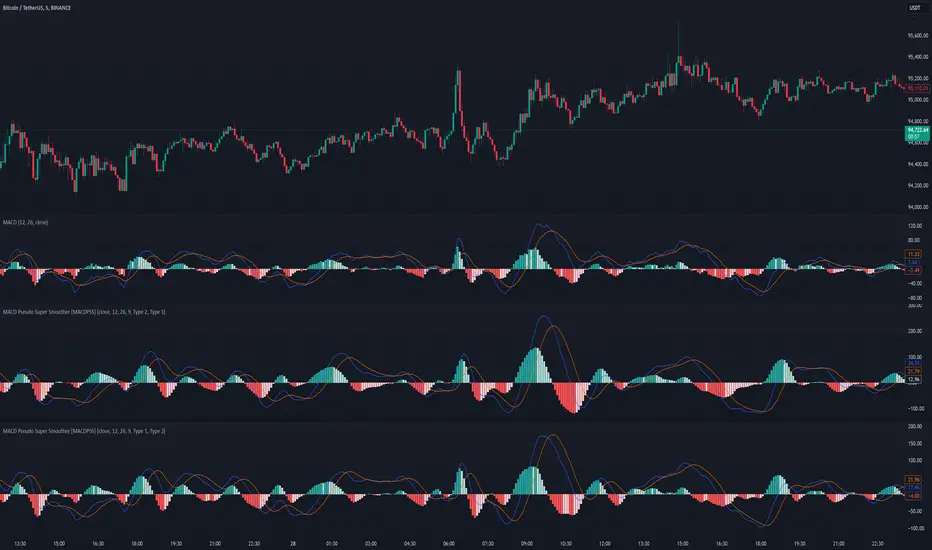
MACD Pseudo Super Smoother [MACDPSS]The MACD Pseudo Super Smoother (MACDPSS) is a variation of the classic Moving Average Convergence Divergence (MACD) indicator. It utilizes the Pseudo Super Smoother (PSS) filter, a Finite Impulse Response (FIR) filter, to smooth both the MACD line and the signal line, providing a potentially refined representation of momentum compared to the traditional MACD which typically uses Exponential Moving Averages (EMAs).
The PSS, inspired by the Super Smoother filter (an Infinite Impulse Response (IIR) filter), aims to reduce noise while minimizing lag. The MACDPSS leverages this FIR implementation to create a unique MACD variant. The core concept of MACD, which involves analyzing the relationship between two moving averages of different lengths to identify momentum shifts, remains intact.
Filter Types and Customization
The MACDPSS offers independent control over the smoothing applied to the MACD line and the signal line through two "Filter Style" inputs:
Oscillator MA Type: This setting determines the filter type used to calculate the fast and slow moving averages that form the basis of the MACD line.
Signal Line MA Type: This setting controls the filter type used to smooth the MACD line, generating the signal line.
Each of these settings allows a choice between two distinct PSS filter types:
Type 1: Provides a smoother output with a more gradual response, characterized by greater attenuation of high-frequency components.
Type 2: Exhibits increased reactivity, allowing for a faster response to shifts in momentum, but with a potential for overshoot.
This dual-filter approach provides flexibility in tailoring the indicator's responsiveness and smoothness to individual preferences and specific market conditions. The user can, for example, choose a smoother Type 1 filter for the MACD line and a more reactive Type 2 filter for the signal line, or vice-versa.
Calculations
The MACDPSS calculates the MACD line by subtracting the slow moving average from the fast moving average, both derived using the PSS filter with the selected "Oscillator MA Type." The signal line is then calculated by applying the PSS filter with the selected "Signal Line MA Type" to the MACD line. The histogram represents the difference between the MACD line and the signal line.
Interpretation
The interpretation of the MACDPSS is similar to the standard MACD. Crossovers between the MACD line and the signal line, the position of the MACD line relative to the zero line, and the slope and direction of the histogram are all used to gauge momentum and potential trend changes.
Disclaimer
The MACDPSS, while inspired by the Super Smoother, utilizes a distinct FIR approximation (the PSS). Therefore, its behavior will not perfectly mirror that of a MACD calculated using IIR filters. The PSS is designed to be a rough approximation. This indicator should be used in conjunction with other technical analysis tools, and users should be aware of the inherent differences between FIR and IIR filter characteristics when interpreting the indicator's signals. Like any moving average based indicator, the MACDPSS is a lagging indicator, although it tries to improve it. The novelty of this indicator comes from applying a unique FIR filter to a classic momentum oscillator in a configurable way.
Buy/Sell Signals (MACD + RSI) 1HThis is a Pine Script indicator for TradingView that plots Buy/Sell signals based on the combination of MACD and RSI indicators on a 1-hour chart.
Description of the Code:
Indicator Setup:
The script is set to overlay the Buy/Sell signals directly on the price chart (using overlay=true).
The indicator is named "Buy/Sell Signals (MACD + RSI) 1H".
MACD Settings:
The MACD (Moving Average Convergence Divergence) uses standard settings of:
Fast Length: 12
Slow Length: 26
Signal Line Smoothing: 9
The MACD line and the Signal line are calculated using the ta.macd() function.
RSI Settings:
The RSI (Relative Strength Index) is calculated with a 14-period setting using the ta.rsi() function.
Buy/Sell Conditions:
Buy Signal:
Triggered when the MACD line crosses above the Signal line (Golden Cross).
RSI value is below 50.
Sell Signal:
Triggered when the MACD line crosses below the Signal line (Dead Cross).
RSI value is above 50.
Signal Visualization:
Buy Signals:
Green "BUY" labels are plotted below the price bars where the Buy conditions are met.
Sell Signals:
Red "SELL" labels are plotted above the price bars where the Sell conditions are met.
Chart Timeframe:
While the code itself doesn't enforce a specific timeframe, the name indicates that this indicator is intended to be used on a 1-hour chart.
To use it effectively, apply the script on a 1-hour chart in TradingView.
How It Works:
This indicator combines MACD and RSI to generate Buy/Sell signals:
The MACD identifies potential trend changes or momentum shifts (via crossovers).
The RSI ensures that Buy/Sell signals align with broader momentum (e.g., Buy when RSI < 50 to avoid overbought conditions).
When the defined conditions for Buy or Sell are met, visual signals (labels) are plotted on the chart.
How to Use:
Copy the code into the Pine Script editor in TradingView.
Save and apply the script to your 1-hour chart.
Look for:
"BUY" signals (green): Indicating potential upward trends or buying opportunities.
"SELL" signals (red): Indicating potential downward trends or selling opportunities.
This script is simple and focuses purely on providing actionable Buy/Sell signals based on two powerful indicators, making it ideal for traders who prefer a clean chart without clutter. Let me know if you need further customization!

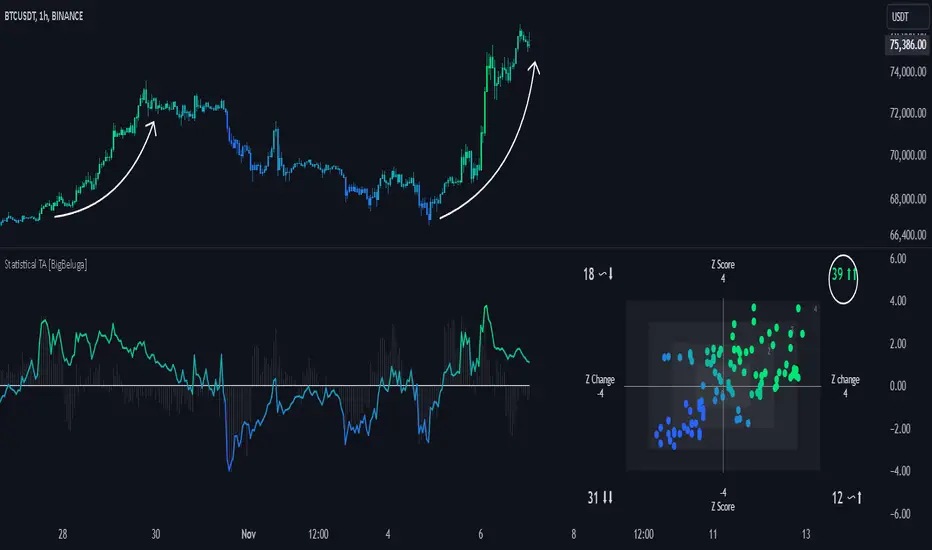
Statistical Trend Analysis (Scatterplot) [BigBeluga]Statistical Trend Analysis (Scatterplot) provides a unique perspective on market dynamics by combining the statistical concept of z-scores with scatterplot visualization to assess price momentum and potential trend shifts.
🧿 What is Z-Score?
Definition: A z-score is a statistical measure that quantifies how far a data point is from the mean, expressed in terms of standard deviations.
In this Indicator:
A high positive z-score indicates the price is significantly above the average.
A low negative z-score indicates the price is significantly below the average.
The indicator also calculates the rate of change of the z-score, helping identify momentum shifts in the market.
🧿 Key Features:
Scatterplot Visualization:
Displays data points of z-score and its change across four quadrants.
Quadrants help interpret market conditions:
Upper Right (Strong Bullish Momentum): Most data points here signal an ongoing uptrend.
Upper Left (Weakening Momentum): Data points here may indicate a potential market shift or ranging market.
Lower Left (Strong Bearish Momentum): Indicates a dominant downtrend.
Lower Right (Trend Shift to Bullish/Ranging): Suggests weakening bearish momentum or an emerging uptrend.
Color-Coded Candles:
Candles are dynamically colored based on the z-score, providing a visual cue about the price's deviation from the mean.
Z-Score Time Series:
A line plot of z-scores over time shows price deviation trends.
A gray histogram displays the rate of change of the z-score, highlighting momentum shifts.
🧿 Usage:
Use the scatterplot and quadrant gauges to understand the current market momentum and potential shifts.
Monitor the z-score line plot to identify overbought/oversold conditions.
Utilize the gray histogram to detect momentum reversals and trend strength.
This tool is ideal for traders who rely on statistical insights to confirm trends, detect potential reversals, and assess market momentum visually and quantitatively.
Profitability Visualization with Bid-Ask Spread ApproximationOverview
The " Profitability Visualization with Bid-Ask Spread Approximation " indicator is designed to assist traders in assessing potential profit and loss targets in relation to the current market price or a simulated entry price. It provides flexibility by allowing users to choose between two methods for calculating the offset from the current price:
Bid-Ask Spread Approximation: The indicator attempts to estimate the bid-ask spread by using the highest (high) and lowest (low) prices within a given period (typically the current bar or a user-defined timeframe) as proxies for the ask and bid prices, respectively. This method provides a dynamic offset that adapts to market volatility.
Percentage Offset: Alternatively, users can specify a fixed percentage offset from the current price. This method offers a consistent offset regardless of market conditions.
Key Features
Dual Offset Calculation Methods: Choose between a dynamic bid-ask spread approximation or a fixed percentage offset to tailor the indicator to your trading style and market analysis.
Entry Price Consideration: The indicator can simulate an entry price at the beginning of each trading session (or the first bar on the chart if no sessions are defined). This feature enables a more realistic visualization of potential profit and loss levels based on a hypothetical entry point.
Profit and Loss Targets: When the entry price consideration is enabled, the indicator plots profit target (green) and loss target (red) lines. These lines represent the price levels at which a trade entered at the simulated entry price would achieve a profit or incur a loss equivalent to the calculated offset amount.
Offset Visualization: Regardless of whether the entry price is considered, the indicator always displays upper (aqua) and lower (fuchsia) offset lines. These lines represent the calculated offset levels based on the chosen method (bid-ask approximation or percentage offset).
Customization: Users can adjust the percentage offset, toggle the bid-ask approximation and entry price consideration, and customize the appearance of the lines through the indicator's settings.
Inputs
useBidAskApproximation A boolean (checkbox) input that determines whether to use the bid-ask spread approximation (true) or the percentage offset (false). Default is false.
percentageOffset A float input that allows users to specify the percentage offset to be used when useBidAskApproximation is false. The default value is 0.63.
considerEntryPrice A boolean input that enables the consideration of a simulated entry price for calculating and displaying profit and loss targets. Default is true.
Calculations
Bid-Ask Approximation (if enabled): bidApprox = request.security(syminfo.tickerid, timeframe.period, low) Approximates the bid price using the lowest price (low) of the current period. askApprox = request.security(syminfo.tickerid, timeframe.period, high) Approximates the ask price using the highest price (high) of the current period. spreadApprox = askApprox - bidApprox Calculates the approximate spread.
Offset Amount: offsetAmount = useBidAskApproximation ? spreadApprox / 2 : close * (percentageOffset / 100) Determines the offset amount based on the selected method. If useBidAskApproximation is true, the offset is half of the approximated spread; otherwise, it's the current closing price (close) multiplied by the percentageOffset.
Entry Price (if enabled): var entryPrice = 0.0 Initializes a variable to store the entry price. if considerEntryPrice Checks if entry price consideration is enabled. if barstate.isnew Checks if the current bar is the first bar of a new session. entryPrice := close Sets the entryPrice to the closing price of the first bar of the session.
Profit and Loss Targets (if entry price is considered): profitTarget = entryPrice + offsetAmount Calculates the profit target price level. lossTarget = entryPrice - offsetAmount Calculates the loss target price level.
Plotting
Profit Target Line: Plotted in green (color.green) with a dashed line style (plot.style_linebr) and increased linewidth (linewidth=2) when considerEntryPrice is true.
Loss Target Line: Plotted in red (color.red) with a dashed line style (plot.style_linebr) and increased linewidth (linewidth=2) when considerEntryPrice is true.
Upper Offset Line: Always plotted in aqua (color.aqua) to show the offset level above the current price.
Lower Offset Line: Always plotted in fuchsia (color.fuchsia) to show the offset level below the current price.
Limitations
Approximation: The bid-ask spread approximation is based on high and low prices and may not perfectly reflect the actual bid-ask spread of a specific broker, especially during periods of high volatility or low liquidity.
Simplified Entry: The entry price simulation is basic and assumes entry at the beginning of each session. It does not account for specific entry signals or order types.
No Order Execution: This indicator is purely for visualization and does not execute any trades.
Data Discrepancies: The high and low values used for approximation might not always align with real-time bid and ask prices due to differences in data aggregation and timing between TradingView and various brokers.
Disclaimer
This indicator is for educational and informational purposes only and should not be considered financial advice. Trading involves substantial risk, and past performance is not indicative of future results. Always conduct thorough research and consider your own risk tolerance before making any trading decisions. It is recommended to combine this indicator with other technical analysis tools and a well-defined trading strategy.

Sunil High-Frequency Strategy with Simple MACD & RSISunil High-Frequency Strategy with Simple MACD & RSI
This high-frequency trading strategy uses a combination of MACD and RSI to identify quick market opportunities. By leveraging these indicators, combined with dynamic risk management using ATR, it aims to capture small but frequent price movements while ensuring tight control over risk.
Key Features:
Indicators Used:
MACD (Moving Average Convergence Divergence): The strategy uses a shorter MACD configuration (Fast Length of 6 and Slow Length of 12) to capture quick price momentum shifts. A MACD crossover above the signal line triggers a buy signal, while a crossover below the signal line triggers a sell signal.
RSI (Relative Strength Index): A shorter RSI length of 7 is used to gauge overbought and oversold market conditions. The strategy looks for RSI confirmation, with a long trade initiated when RSI is below the overbought level (70) and a short trade initiated when RSI is above the oversold level (30).
Risk Management:
Dynamic Stop Loss and Take Profit: The strategy uses ATR (Average True Range) to calculate dynamic stop loss and take profit levels based on market volatility.
Stop Loss is set at 0.5x ATR to limit risk.
Take Profit is set at 1.5x ATR to capture reasonable price moves.
Trailing Stop: As the market moves in the strategy’s favor, the position is protected by a trailing stop set at 0.5x ATR, allowing the strategy to lock in profits as the price moves further.
Entry & Exit Signals:
Long Entry: Triggered when the MACD crosses above the signal line (bullish crossover) and RSI is below the overbought level (70).
Short Entry: Triggered when the MACD crosses below the signal line (bearish crossover) and RSI is above the oversold level (30).
Exit Conditions: The strategy exits long or short positions based on the stop loss, take profit, or trailing stop activation.
Frequent Trades:
This strategy is designed for high-frequency trading, with trade signals occurring frequently as the MACD and RSI indicators react quickly to price movements. It works best on lower timeframes such as 1-minute, 5-minute, or 15-minute charts, but can be adjusted for different timeframes based on the asset’s volatility.
Customizable Parameters:
MACD Settings: Adjust the Fast Length, Slow Length, and Signal Length to tune the MACD’s sensitivity.
RSI Settings: Customize the RSI Length, Overbought, and Oversold levels to better match your trading style.
ATR Settings: Modify the ATR Length and multipliers for Stop Loss, Take Profit, and Trailing Stop to optimize risk management according to market volatility.
Important Notes:
Market Conditions: This strategy is designed to capture smaller, quicker moves in trending markets. It may not perform well during choppy or sideways markets.
Optimizing for Asset Volatility: Adjust the ATR multipliers based on the asset’s volatility to suit the risk-reward profile that fits your trading goals.
Backtesting: It's recommended to backtest the strategy on different assets and timeframes to ensure optimal performance.
Summary:
The Sunil High-Frequency Strategy leverages a simple combination of MACD and RSI with dynamic risk management (using ATR) to trade small but frequent price movements. The strategy ensures tight stop losses and reasonable take profits, with trailing stops to lock in profits as the price moves in favor of the trade. It is ideal for scalping or intraday trading on lower timeframes, aiming for quick entries and exits with controlled risk.

HOD/LOD/PMH/PML/PDH/PDL Strategy by @tradingbauhaus This script is a trading strategy @tradingbauhaus designed to trade based on key price levels, such as the High of Day (HOD), Low of Day (LOD), Premarket High (PMH), Premarket Low (PML), Previous Day High (PDH), and Previous Day Low (PDL). Below, I’ll explain in detail what the script does:
Core Functionality of the Script:
Calculates Key Price Levels:
HOD (High of Day): The highest price of the current day.
LOD (Low of Day): The lowest price of the current day.
PMH (Premarket High): The highest price during the premarket session (before the market opens).
PML (Premarket Low): The lowest price during the premarket session.
PDH (Previous Day High): The highest price of the previous day.
PDL (Previous Day Low): The lowest price of the previous day.
Draws Horizontal Lines on the Chart:
Plots horizontal lines on the chart for each key level (HOD, LOD, PMH, PML, PDH, PDL) with specific colors for easy visual identification.
Defines Entry and Exit Rules:
Long Entry (Buy): If the price crosses above the PMH (Premarket High) or the PDH (Previous Day High).
Short Entry (Sell): If the price crosses below the PML (Premarket Low) or the PDL (Previous Day Low).
Long Exit: If the price reaches the HOD (High of Day) during a long position.
Short Exit: If the price reaches the LOD (Low of Day) during a short position.
How the Script Works Step by Step:
Calculates Key Levels:
Uses the request.security function to fetch the HOD and LOD of the current day, as well as the highs and lows of the previous day (PDH and PDL).
Calculates the PMH and PML during the premarket session (before 9:30 AM).
Plots Levels on the Chart:
Uses the plot function to draw horizontal lines on the chart representing the key levels (HOD, LOD, PMH, PML, PDH, PDL).
Each level has a specific color for easy identification:
HOD: White.
LOD: Purple.
PDH: Orange.
PDL: Blue.
PMH: Green.
PML: Red.
Defines Trading Rules:
Uses conditions with ta.crossover and ta.crossunder to detect when the price crosses key levels.
Long Entry: If the price crosses above the PMH or PDH, a long position (buy) is opened.
Short Entry: If the price crosses below the PML or PDL, a short position (sell) is opened.
Long Exit: If the price reaches the HOD during a long position, the position is closed.
Short Exit: If the price reaches the LOD during a short position, the position is closed.
Executes Orders Automatically:
Uses the strategy.entry and strategy.close functions to open and close positions automatically based on the defined rules.
Advantages of This Strategy:
Based on Key Levels: Uses important price levels that often act as support and resistance.
Easy to Visualize: Horizontal lines on the chart make it easy to identify levels.
Automated: Entries and exits are executed automatically based on the defined rules.
Limitations of This Strategy:
Dependent on Volatility: Works best in markets with significant price movements.
False Crosses: There may be false crosses that generate incorrect signals.
No Advanced Risk Management: Does not include dynamic stop-loss or take-profit mechanisms.
How to Improve the Strategy:
Add Stop-Loss and Take-Profit: To limit losses and lock in profits.
Filter Signals with Indicators: Use RSI, MACD, or other indicators to confirm signals.
Optimize Levels: Adjust key levels based on the asset’s behavior.
In summary, this script is a trading strategy that operates based on key price levels, such as HOD, LOD, PMH, PML, PDH, and PDL. It is useful for traders who want to trade based on significant support and resistance levels.

Catalyst TrendCatalyst Trend – A Comprehensive Trend and Regime Analyzer
The Catalyst Trend indicator was designed to dynamically and intuitively merge various classic analytical techniques. The goal is to filter out short-term market noise and reveal reliable trend phases or potential turning points. Below is a detailed explanation of its core elements and practical usage.
1. Concept and Idea
Multidimensional Trend Detection
This indicator goes beyond a simple momentum or volatility focus. It factors in multiple measurements to provide a more well-rounded market perspective.
Versatile Indicator Fusion
Linear Regression (LinReg): Multiple LinReg calculations are combined to smooth out price fluctuations and produce a robust trendline—known here as the “Cycle Reduced Line.”
ADX (Average Directional Index): Measures trend strength.
RSI (Relative Strength Index): Flags potential overbought or oversold conditions, in both the current timeframe and a higher timeframe.
ATR (Average True Range): Assesses volatility; used to dynamically adjust calculation lengths.
By weaving these elements together, the indicator adds value beyond simply stacking multiple indicators. It adapts to real-time market conditions, aiming to highlight genuine trends and reduce false signals.
2. Key Functions and Calculations
Dynamic Length & Smoothing
A blend of volatility (ATR), ADX values, and RSI inputs determines how many candles are used in the LinReg calculations and how heavily the data is smoothed.
This allows the indicator to respond promptly during periods of high volatility, while automatically adjusting to filter out unnecessary noise in quieter phases.c
Cycle Reduced Line
The script averages several offset LinReg calculations to produce a cleaner overall signal. Random outliers are thus minimized, making the trend path more visually consistent.
An additional EMA smoothing (“Final Smoothing”) further stabilizes this trendline, reducing the impact of minor price fluctuations.
Channel Bands (Optional)
These bands are derived from the standard deviation of the price residual (the difference between the smoothed price and the trendline).
They highlight potential over-extension zones: the upper band can mark short-term overbought areas, while the lower band might indicate oversold conditions.
Trend and Sideways Determination
Slope Calculation: The slope of the trendline (comparing the current bar to the previous one) helps identify short-term directional shifts.
DX Threshold: Once the ADX surpasses a user-defined threshold and the slope is positive, it may indicate a developing uptrend. Similarly, if the slope is negative and ADX > threshold, it could signal a potential downtrend.
Multi-Level Color Coding
Original Mode: Interpolated colors reflect uptrends, downtrends, and sideways phases, factoring in metrics like ADX and RSI.
Single Color: For a neutral look, the indicator can be displayed in one uniform color.
HTF RSI: This mode uses the higher-timeframe RSI to color the trendline (Long/Short/Neutral), offering a quick gauge of overarching market pressure.
3. Use Cases and Interpretation
Timeframes & Markets
The indicator is versatile and adapts well to different intervals, from 5-minute charts to weekly views.
It can be applied to various markets—crypto, forex, stocks—since volatility and trend strength are universal concepts.
Signal Recognition
Color Swings into a more pronounced upward hue (e.g., green) may signal mounting strength.
Neutral or mixed tones often point to sideways phases, which breakout traders might watch for potential price surges.
A shift to downward colors (e.g., red) may indicate a growing bearish trend.
Channel Bands & Volatility
When the bands spread widely, it’s wise to proceed with caution: abrupt spikes above the upper band or below the lower band can flag rapid short-term extremes.
These bands are more of a reference for potential overextension than a strict buy or sell trigger.
Additional Confirmations
Not a standalone panacea: The Catalyst Trend indicator is an analytical tool, best used alongside other methods such as volume analysis or price action (candlestick patterns, support/resistance levels) to bolster confidence in trading decisions.
4. Practical Tips
Parameter Adjustments
Depending on the market—crypto vs. traditional currency pairs—different ADX, RSI, or smoothing periods may be more effective. Experiment with the settings to tailor the indicator to your preferred timeframe.
Strategic Integration
Trailing Stops: For those riding a trend, the trendline or the channel bands may serve as a reference to trail stop-loss orders.
Trend Confirmation: Using RSI and ADX filters can help traders avoid sideways markets or stay the course when the trend is strong.
5. Important Final Notes
No Guarantee of Profits
No indicator can predict the future. Markets are inherently volatile and often unpredictable.
Responsible Risk Management
Test the indicator in a demo environment or with smaller positions before committing to large trades.

Range PolarityDescription:
This indicator is a "Rate of Change" style oscillator designed to measure market dynamics through the lens of price ranges. By utilizing the true range in conjunction with high and low separation, this script produces two distinct oscillators: one for positive price shifts and one for negative price shifts.
Key Features:
High/Low Isolation:
The script calculates the relative movement of upwards and downwards price movements over a user-defined period. This separation provides a nuanced view of market behavior, offering two separate signals for comparison.
Dynamic Transform Smoothing:
A smoothing transform is applied to the signals, ensuring better outlier handling while maintaining sensitivity to price extremes. This makes the oscillator especially suited for identifying overbought and oversold conditions.
Zero-Centered:
The zero line acts as a "gravity point," where shifts away or toward zero indicate market momentum. Signal crosses or reversals from extreme zones can signal potential entry or exit points.
Outlier Identification:
Unlike traditional ATR based strategies (e.g., Keltner Channels ), this indicator isolates high and low ranges, creating a more granular view of market extremes. These measurements can help identify shifts from the outlying positions and reversal opportunities.
Visual Enhancements:
Multiple layers enhance the visual distinction of the positive and negative transformations. Horizontal lines at key thresholds provide visual reference for overbought, oversold, and equilibrium zones.
How to Use:
Primary signals are shifts from outlying positions or a positive/negative cross. An extreme reading itself can reveal an incoming reversal when calibrated with other indicators or compared with higher timeframes. Pairing "Range Polarity" with volume and momentum can create a comprehensive strategy.
In conclusion, be aware the base length controls the window for high/low contributions while the transform smoothing enhances the raw data through normalization within a tempered range to filter out insignificant fluctuations.
Merry Christmas to all and have a Happy New Year!

Multi-Feature IndicatorThe Multi-Feature Indicator combines three popular technical analysis tools — RSI, Moving Averages (MA), and MACD — into a single indicator to provide unified buy and sell signals. This script is designed for traders who want to filter out noise and focus on signals confirmed by multiple criteria.
Features:
RSI (Relative Strength Index):
Measures momentum and identifies overbought (70) and oversold (30) conditions.
A signal is triggered when RSI crosses these thresholds.
Moving Averages (MA):
Uses a short-term moving average (default: 9 periods) and a long-term moving average (default: 21 periods).
Buy signals occur when the short-term MA crosses above the long-term MA, indicating an uptrend.
Sell signals occur when the short-term MA crosses below the long-term MA, indicating a downtrend.
MACD (Moving Average Convergence Divergence):
A trend-following momentum indicator that shows the relationship between two moving averages of an asset's price.
Signals are based on the crossover of the MACD line and its signal line.
Unified Buy and Sell Signals:
Buy Signal: Triggered when:
RSI crosses above 30 (leaving oversold territory).
Short-term MA crosses above the long-term MA.
MACD line crosses above the signal line.
Sell Signal: Triggered when:
RSI crosses below 70 (leaving overbought territory).
Short-term MA crosses below the long-term MA.
MACD line crosses below the signal line.
Visualization:
The indicator plots the short-term and long-term moving averages on the price chart.
Green "BUY" labels appear below price bars when all buy conditions are met.
Red "SELL" labels appear above price bars when all sell conditions are met.
Parameters:
RSI Length: Default is 14. This controls the sensitivity of the RSI.
Short MA Length: Default is 9. This determines the short-term trend.
Long MA Length: Default is 21. This determines the long-term trend.
Use Case:
The Multi-Feature Indicator is ideal for traders seeking higher confirmation before entering or exiting trades. By combining momentum (RSI), trend (MA), and momentum shifts (MACD), it reduces false signals and enhances decision-making.
How to Use:
Apply the indicator to your chart in TradingView.
Look for "BUY" or "SELL" signals, which appear when all conditions align.
Use this tool in conjunction with other analysis techniques for best results.
Note:
The default settings are suitable for many assets, but you may need to adjust them for different timeframes or market conditions.
This indicator is meant to assist in trading decisions and should not be used as the sole basis for trading.

Twiggs Money FlowTwiggs Money Flow (TMF)
This indicator is an implementation of the Twiggs Money Flow (TMF), a volume-based tool designed to measure buying and selling pressure over a specified period. TMF is an enhancement of Chaikin Money Flow (CMF), utilizing more sophisticated smoothing techniques for improved accuracy and reduced noise. This version is highly customizable and includes advanced features for both new and experienced traders.
What is Twiggs Money Flow?
Twiggs Money Flow was developed by Colin Twiggs to provide a clearer picture of market momentum and the balance between buyers and sellers. It uses a combination of price action, trading volume, and range calculations to assess whether a market is under buying or selling pressure.
Unlike traditional volume indicators, TMF incorporates Weighted Moving Averages (WMA) by default but allows for other moving average types (SMA, EMA, VWMA) for added flexibility. This makes it adaptable to various trading styles and market conditions.
Features of This Script:
Customizable Moving Average Types:
Select from SMA , EMA , WMA , or VWMA to smooth volume and price-based calculations.
Tailor the indicator to align with your trading strategy or the asset's behavior.
Optional HMA Smoothing:
Apply Hull Moving Average (HMA) smoothing for a cleaner, faster-reacting TMF line.
Perfect for traders who want to reduce lag and capture trends earlier.
Dynamic Thresholds for Signal Filtering:
Set user-defined thresholds for Long (LT) and Short (ST) signals to highlight significant momentum.
Focus on actionable trends by ignoring noise around neutral levels.
Bar Coloring for Visual Clarity:
Automatically colors your chart bars based on TMF values:
Aqua for strong bullish signals (above the long threshold).
Fuchsia for strong bearish signals (below the short threshold).
Gray for neutral or undecided market conditions.
Ensures that trend direction and strength are visually intuitive.
Configurable Lookback Period:
Adjust the sensitivity of TMF by customizing the length of the lookback period to suit different timeframes and market conditions.
How It Works:
True Range Calculation: The script determines the high, low, and close range to calculate buying and selling pressure.
Adjusted Volume: Incorporates the relationship between price and volume to gauge whether trading activity is favoring buyers or sellers.
Weighted Moving Averages (WMAs): Smooths both volume and adjusted volume values to eliminate erratic fluctuations.
TMF Line: Computes the ratio of adjusted volume to total volume, representing the net buying/selling pressure as a percentage.
HMA Option (if enabled): Smooths the TMF line further to reduce lag and enhance trend identification.
Bar Coloring Logic:
Bars are colored dynamically based on TMF values, thresholds, and smoothing preferences.
Provides an at-a-glance understanding of market conditions.
Input Parameters:
Lookback Period: Defines the number of bars used to calculate TMF (default: 21).
Use HMA Smoothing: Toggle Hull Moving Average smoothing (default: true).
HMA Smoothing Length: Length of the HMA smoothing period (default: 14).
Moving Average Type: Select SMA, EMA, WMA, or VWMA (default: WMA).
Long Threshold (LT): Threshold value above which a long signal is considered (default: 0).
Short Threshold (ST): Threshold value below which a short signal is considered (default: 0).
How to Use It:
Confirm Trends: TMF can validate trends by identifying periods of sustained buying or selling pressure.
Divergence Signals: Watch for divergences between price and TMF to anticipate potential reversals.
Filter Trades: Use the thresholds to ignore weak signals and focus on strong trends.
Combine with Other Indicators: Pair TMF with trend-following or momentum indicators (e.g., RSI, Bollinger Bands) for a comprehensive trading strategy.
Example Use Cases:
Spotting breakouts when TMF crosses above the long threshold.
Identifying sell-offs when TMF dips below the short threshold.
Avoiding sideways markets by ignoring neutral (gray) bars.
Notes:
This indicator is highly customizable, making it versatile across different assets (e.g., stocks, crypto, forex).
While the default settings are robust, tweaking the lookback period, moving average type, and thresholds is recommended for different trading instruments or strategies.
Always backtest thoroughly before applying the indicator to live trading.
This version of Twiggs Money Flow goes beyond standard implementations by offering advanced smoothing, custom thresholds, and enhanced visual feedback to give traders a competitive edge.
Add it to your charts and experience the power of volume-driven analysis!

[blackcat] L2 Enhanced MACD Trend█ OVERVIEW
The Enhanced MACD Trend script combines traditional Moving Average Convergence Divergence (MACD) analysis with On-Balance Volume (OBV) insights to provide traders with a comprehensive understanding of market trends. By examining both price momentum and volume fluctuations, this tool aids in identifying potential upward or downward market transitions.
█ LOGICAL FRAMEWORK
Initially, the script prompts users to configure fundamental parameters such as the speed of moving averages. It subsequently utilizes a specialized auxiliary function named calculate_macd_obv_signals to perform intricate computations. This function calculates the discrepancy between two distinct types of moving averages (captured via MACD analysis), evaluates the direction of capital inflows and outflows within securities (using OBV), and applies smoothing techniques to mitigate undue influence from minor fluctuations. Ultimately, visual representations of these calculations are rendered on an additional chart pane for enhanced interpretability.
█ CUSTOM FUNCTIONS
Function: calculate_macd_obv_signals
• Purpose: Determines critical aspects associated with MACD and OBV.
• Parameters:
• fastLength (int): Dictates the responsiveness of the shorter Exponential Moving Average (EMA) to price variations.
• slowLength (int): Specifies the reactivity of the longer EMA.
• signalSmoothing (int): Defines the degree of smoothness applied to the divergence between EMAs.
• Functionality:
• macd_diff: Illustrates whether price increases have accelerated relative to previous levels or decelerated, providing insight into existing momentum.
• macd_signal_line: Smoothens macd_diff values, serving akin to a trailing indicator for macd_diff.
• macd_histogram: Visually accentuates disparities between macd_diff and macd_signal_line employing color-coded bars, facilitating identification of significant divergences.
• obv_signal: Represents a refined variant of short-term OBV concentrating solely on periods characterized by elevated buying interest, aiding in reduction of extraneous signals.
• moving_average_short: Analyzes recent closing prices across several sessions to corroborate burgeoning bullish or bearish tendencies.
• Returns: An array encompassing .
█ KEY POINTS AND TECHNIQUES
Advanced Features: Employs sophisticated functions including ta.ema() and ta.sma(), enabling accurate calculation of EMAs and SMAs respectively, thus enhancing precision in trend detection.
Optimization Techniques: Incorporates customizable inputs (input.int) permitting strategic adjustments alongside scrutiny of escalating or declining volumes to accurately gauge genuine sentiment shifts while discounting insignificant anomalies.
Best Practices: Maintains separation between algorithmic processes and graphical outputs, preserving organizational clarity; hence simplifying debugging efforts and future enhancements.
Unique Approaches: Integrates multifaceted assessments simultaneously – amalgamating candlestick formations and volumetric activities – offering a holistic perspective instead of reliance on singular indicators. Consequently, delivers astute recommendations grounded in diverse analytical underpinnings rather than speculative forecasts.
█ EXTENDED KNOWLEDGE AND APPLICATIONS
Potential Modifications:
1 — Implement automated alert mechanisms signaling crossover events pinpointing optimal buy/sell junctures to fine-tune timing preemptively minimizing losses proactively.
2 — Enable user customization of sensitivity criteria governing trigger intensity thereby eliminating trivial aberrations and emphasizing substantial patterns exclusively.
Application Scenarios:
Beneficial for high-frequency trading aiming to capitalize on fleeting price movements swiftly. Suitable for dynamic environments necessitating rapid responses due to frequent market volatility demanding prompt reactions. Perfect for individuals engaging in regular transactions seeking unparalleled accuracy navigating fluctuating circumstances ensuring consistent profitability amidst disturbances maintaining steady yields irrespective of upheavals.
Related Concepts:
Contemplate interactions among oscillators (such as MACD) and volume metrics detecting instances wherein they oppose each other (indicative of divergences) or concur (signaling crossovers). Profound comprehension of these interrelationships substantially refines trading strategies integrating broader economic factors, seasonal influences guiding overarching plans resulting in heightened predictive capabilities elevating trading effectiveness leveraging cumulative information transforming unprocessed statistics into actionable intelligence empowering informed decisions advancing confidently toward objectives effortlessly scaling achievements seamlessly realizing aspirations effortlessly.

RSI+EMA+MZONES with DivergencesFeatures:
1. RSI Calculation:
Uses user-defined periods to calculate the RSI and visualize momentum shifts.
Plots key RSI zones, including upper (overbought), lower (oversold), and middle levels.
2. EMA of RSI:
Includes an Exponential Moving Average (EMA) of the RSI for trend smoothing and confirmation.
3. Bullish and Bearish Divergences:
Detects Regular divergences (labeled as “Bull” and “Bear”) for classic signals.
Identifies Hidden divergences (labeled as “H Bull” and “H Bear”) for potential trend continuation opportunities.
4. Customizable Labels:
Displays divergence labels directly on the chart.
Labels can be toggled on or off for better chart visibility.
5. Alerts:
Predefined alerts for both regular and hidden divergences to notify users in real time.
6. Fully Customizable:
Adjust RSI period, lookback settings, divergence ranges, and visibility preferences.
Colors and styles are easily configurable to match your trading style.
How to Use:
RSI Zones: Use RSI and its zones to identify overbought/oversold conditions.
EMA: Look for crossovers or confluence with divergences for confirmation.
Divergences: Monitor for “Bull,” “Bear,” “H Bull,” or “H Bear” labels to spot key reversal or continuation signals.
Alerts: Set alerts to be notified of divergence opportunities without constant chart monitoring.

[blackcat] L2 Quantitative Trading Reference█ OVERVIEW
The script " L2 Quantitative Trading Reference" calculates and plots various directional indicators based on price movements over a specified period. It primarily focuses on identifying trends, trend strength, and specific candlestick patterns such as strong bearish candles.
█ LOGICAL FRAMEWORK
The script consists of several main components:
Input Parameters:
None explicitly set; however, implicit inputs include high, low, and close prices.
Custom Functions:
count_periods: Counts occurrences of a condition within a given lookback period.
every_condition: Checks if a condition holds true for an entire lookback period.
calculate_and_plot_directional_indicators: Computes directional movement indices and determines market conditions like direction, strength, and specific candle types.
Calculations:
• The script calculates the True Range, differences between highs/lows, and computes directional movement indices.
• It then uses these indices to determine the current market direction, strength, and identifies strong bearish candles.
Plotting:
• Plots histograms representing different conditions including negative directional movement in red, positive directional movement in green, continuous strength in yellow, and strong bearish candles in aqua.
Data flows from the calculation of basic price metrics through more complex computations involving sums and comparisons before being plotted according to their respective conditions.
█ CUSTOM FUNCTIONS
count_periods:
Counts how many times a certain condition occurs within a specified number of periods.
every_condition:
Determines whether a particular condition has been met continuously throughout a specified number of periods.
calculate_and_plot_directional_indicators:
This function encompasses multiple tasks including calculating the True Range, Positive/Negative Directional Movements and Indices, determining the market direction, assessing strength via bar continuity since the last change, and identifying strong bearish candles. It returns four arrays containing directional movement, positivity status, continuous strength, and strong bearish candle occurrence respectively.
█ KEY POINTS AND TECHNIQUES
• Utilizes custom functions for modular and reusable code.
• Employs math.sum and ta.barssince for efficient computation of cumulative values and counting bars since a condition was met.
• Uses ternary operators (condition ? value_if_true : value_if_false) extensively for concise conditional assignments.
• Leverages Pine Script’s built-in mathematical functions (math.max, math.min, etc.) for robust financial metric calculations.
• Implements histogram plotting styles to visually represent distinct market states effectively.
█ EXTENDED KNOWLEDGE AND APPLICATIONS
Potential enhancements can involve adding alerts when specific conditions are met, incorporating additional technical indicators, or refining existing logic for better accuracy. This script's approach could be adapted for creating strategies that react to changes in market dynamics identified by these directional indicators. Related topics worth exploring in Pine Script include backtesting frameworks, multi-timeframe analysis, risk management techniques, and integration with external data sources.

Directional Volume IndexDirectional Volume Index (DVI) (buying/selling pressure)
This index is adapted from the Directional Movement Index (DMI), but based on volume instead of price movements. The idea is to detect building directional volume indicating a growing amount of orders that will eventually cause the price to follow. (DVI is not displayed by default)
The rough algorithm for the Positive Directional Volume Index (green bar):
calculate the delta to the previous green bar's volume
if the delta is positive (growing buying pressure) add it to an SMA, else add 0 (also for red bars)
divide these average deltas by the average volume
the result is the Positive Directional Volume Index (DVI+) (vice versa for DVI-)
Differential Directional Volume Index (DDVI) (relative pressure)
Creating the difference of both Directional Volume Indexes (DVI+ - DVI-) creates the Differential Directional Volume Index (DDVI) with rising values indicating a growing buying pressure, falling values a growing selling pressure. (DDVI is displayed by default, smoothed by a custom moving average)
Average Directional Volume Index (ADVX) (pressure strength)
Putting the relative pressure (DDVI) in relation to the total pressure (DVI+ + DVI-) we can determine the strength and duration of the currently building volume change / trend. For the DMI/ADX usually 20 is an indicator for a strong trend, values above 50 suggesting exhaustion and approaching reversals. (ADVX is not displayed by default, smoothed by a custom moving average)
Divergences of the Differential Directional Volume Index (DDVI) (imbalances)
By detecting divergences we can detect situations where e.g. bullish volume starts to build while price is in a downtrend, suggesting that there is growing buying pressure indicating an imminent bullish pullback/order block or reversal. (strong and hidden divergences are displayed by default)
Divergences Overview:
strong bull: higher lows on volume, lower lows on price
medium bull: higher lows on volume, equal lows on price
weak bull: equal lows on volume, lower lows on price
hidden bull: lower lows on volume, higher lows on price
strong bear: lower highs on volume, higher highs on price
medium bear: lower highs on volume, equal highs on price
weak bear: equal highs on volume, higher highs on price
hidden bear: higher highs on volume, lower highs on price
DDVI Bands (dynamic overbought/oversold levels)
Using Bollinger Bands with DDVI as source we receive an averaged relative pressure with stdev band offsets. This can be used as dynamic overbought/oversold levels indicating reversals on sharp crossovers.
Alerts
As of now there are no alerts built in, but all internal data is exposed via plot and plotshape functions, so it can be used for custom crossover conditions in the alert dialog. This is still a personal research project, so if you find good setups, please let me know.

Relative Price Position Flow (RPPF)Market work by short and long players positions. By commodities, players buy or sell positions based in market expectations. The volume of negotiations defines the optimum point to buy or sell. It means how much more volume in a price line, much of the players thinking this is the real value. So, in this indicator I calculate the volume of trades for some price line. And divide it to the total volume, to define whats the historical price line optimum. The diference between the actual price to the historical optimum trade, define some directions of the market. Some times the price is bigger, and sometimes it is smaller.
By experience, after some times the price is deviated to the flow price, it will search a compensation, starting a reversion movement.

[blackcat] L1 Swing Reversal█ OVERVIEW
The script is an indicator that calculates and plots the L1 Swing Reversal, which involves smoothing price data and calculating a modified RSI to identify potential swing reversals in the market. It overlays columns representing the smoothed price data and a line for the adjusted RSI.
█ LOGICAL FRAMEWORK
The script begins by defining input parameters for customizable periods. It then calculates the typical price, derives components of the swing reversal indicator, smooths these components, and computes an adjusted RSI. The main sections include input parameter definitions, function definition, and plotting. The script flows data through calculations and logical operations to produce final plot values.
█ CUSTOM FUNCTIONS
Function: l1_swing_reversal
This function calculates the L1 Swing Reversal indicators based on high, low, close, and open prices, along with three periods. It computes a smoothed price component and an adjusted RSI.
Parameters:
• high : High prices of the asset.
• low : Low prices of the asset.
• close : Close prices of the asset.
• period_n : Period for the first component calculation.
• period_m : Period for standard deviation and moving average calculations.
• period_n1 : Period for RSI calculation.
Return Values:
• cc1_column_red : Red column values for the first component.
• cc1_column_green : Green column values for the first component.
• rsi : Adjusted RSI values.
█ KEY POINTS AND TECHNIQUES
The script uses several key Pine Script features such as the sma (simple moving average), stdev (standard deviation), max, abs, and ema (exponential moving average) functions. It also demonstrates the use of conditional operators to cap the column values at -100 and 100. The script’s structure is clear and follows best practices by encapsulating the main logic within a function and using descriptive variable names.
█ EXTENDED KNOWLEDGE AND APPLICATIONS
Potential modifications could include adding more sophisticated reversal signals based on the RSI and column values, or enhancing the visualization with additional plot types. This script could be used in scenarios where traders are interested in identifying potential swing reversals using a combination of smoothed price data and momentum indicators. Related Pine Script concepts include using barssince for counting bars since a condition, crossover and crossunder for detecting trend changes, and hline for adding horizontal lines to the chart.
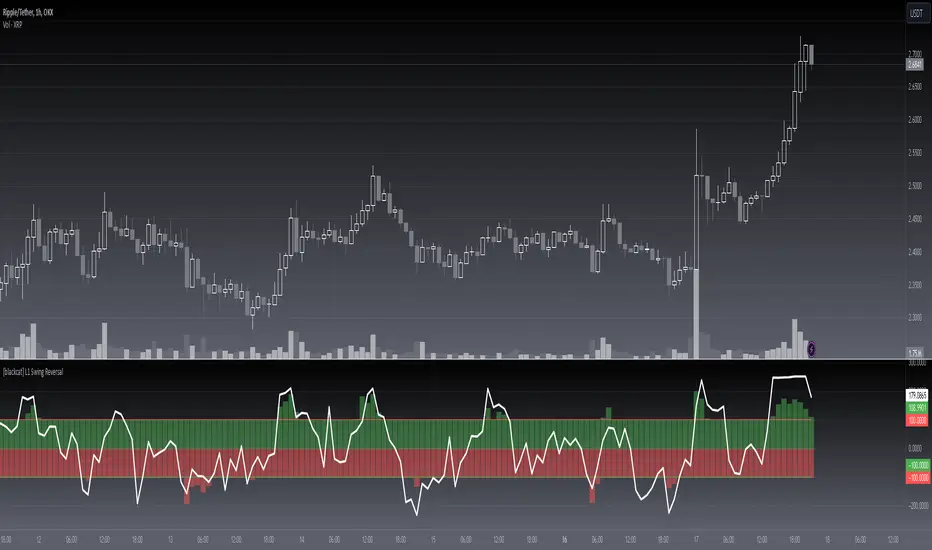
[blackcat] L1 BS Line of Defense █ OVERVIEW
The Pine Script provided is an advanced technical indicator designed to generate reliable buy and sell signals by integrating momentum, moving averages, and price level analyses. It employs a custom weighted moving average (WMA) and exponential moving averages (EMAs) to compute key signals known as the "Buy/Sell Signal" and the "Short Line." These signals aim to pinpoint optimal entry and exit points for trades by evaluating their relationship with current market dynamics.
█ FEATURES
Key Components:
• Custom Weighted Moving Average ( WMA ): Provides enhanced flexibility compared to traditional moving averages.
• Exponential Moving Averages ( EMA ): Smooths the defense line and its short-term counterpart to filter out market noise.
• Momentum Indicators: Includes both short-term and long-term momentum adjusted via custom WMA and EMAs.
• Conditional Signal Generation: Signals are triggered based on precise crossovers and price conditions.
Logical Framework:
1 — Input Parameters:
No explicit user-defined inputs; defaults are used for internal calculations.
2 — Custom Functions:
• custom_wma : Calculates a custom WMA.
• calculate_buy_sell_signals : Generates buy and sell signals.
3 — Calculations:
• Momentum and Range Analysis over 9, 34, and 60-bar periods.
• Application of custom WMA and EMAs to smooth and refine data.
• Derivation of the "defense line" and "short_ema_defense."
4 — Plotting:
• Main signal lines ("Buy/Sell Signal" and "Short Line") are visualized.
• A horizontal zero line serves as a reference point.
█ HOW TO USE
To utilize this script effectively:
1 — Add the script to your TradingView chart.
2 — Observe the "Buy/Sell Signal" and "Short Line" relative to the zero line and each other.
3 — Look for crossovers and divergence patterns to identify potential trade opportunities.
4 — Combine the signals with additional technical indicators or fundamental analysis for better accuracy.
█ LIMITATIONS
While the script provides valuable insights, users should consider the following limitations:
• Default settings may not suit all markets or instruments; customization might be necessary.
• False signals can occur during volatile or ranging markets.
• Backtesting and optimization are recommended before live trading.
█ NOTES
For further enhancement and personalization:
• Introduce adjustable input parameters for WMA and EMA lengths and weights.
• Extend the script into a full-fledged trading strategy with entry and exit rules.
• Apply the script across multiple timeframes for comprehensive analysis.
• Incorporate risk management practices such as stop-loss and take-profit levels.
• Explore related Pine Script functions like security() for multi-timeframe analysis and [pine>alertcondition() for automated alerts.
Understanding core concepts like momentum, moving averages, and crossovers will aid in developing similar indicators or refining existing ones.