WaveTrend Divergences, Candle Colouring and TP Signal [LuciTech]WaveTrend is a momentum-based oscillator designed to track trend strength, detect divergences, and highlight potential take-profit zones using Bollinger Bands. It provides a clear visualization of market conditions to help traders identify trend shifts and exhaustion points.
The WaveTrend Oscillator consists of a smoothed momentum line (WT Line) and a signal line, which work together to indicate trend direction and possible reversals. When the WT Line crosses above the signal line, it suggests bullish momentum, while crossing below signals bearish momentum.
Candle colouring changes dynamically based on WaveTrend crossovers. If the WT Line crosses above the signal line, candles turn bullish. If the WT Line crosses below the signal line, candles turn bearish. This provides an immediate visual cue for trend direction.
Divergence Detection identifies when price action contradicts the WaveTrend movement.
Bullish Divergence appears when price makes a lower low, but the WT Line forms a higher low, suggesting weakening bearish pressure.
Bearish Divergence appears when price makes a higher high, but the WT Line forms a lower high, indicating weakening bullish pressure.
Plus (+) Divergences are stronger signals that occur when the first pivot of the divergence happens at an extreme level—above +60 for bearish divergence or below -60 for bullish divergence. These levels suggest the market is overbought or oversold, making the divergence more significant.
Bollinger Band Signals highlight potential take-profit zones by detecting when the WT Line moves beyond its upper or lower Bollinger Band.
If the WT Line crosses above the upper band, it signals stretched bullish momentum, suggesting a possible pullback or reversal.
If the WT Line crosses below the lower band, it indicates stretched bearish momentum, warning of a potential bounce.
How It Works
The WaveTrend momentum calculation is based on an EMA-smoothed moving average to filter out noise and provide a more reliable trend indication.
The WT Line (momentum line) fluctuates based on market momentum.
The signal line smooths out the WT Line to help identify trend shifts.
When the WT Line crosses above the signal line, it suggests buying pressure, and when it crosses below, it indicates selling pressure.
Divergences are detected by comparing pivot highs and lows in price with pivot highs and lows in the WT Line.
A pivot forms when a local high or low is confirmed after a certain number of bars.
The indicator tracks whether price action and the WT Line are making opposite movements.
If a divergence occurs and the first pivot was beyond ±60, it is marked as a Plus Divergence, making it a stronger reversal signal.
Bollinger Bands are applied directly to the WT Line instead of price, identifying when the WT Line moves outside its volatility range. This helps traders recognize when momentum is overstretched and a potential reversal or retracement is likely.
Settings
Channel Length (default: 8) controls the period used to calculate the WT Line.
Average Length (default: 16) smooths the WT Line for better trend detection.
Divergences (on/off) enables or disables divergence plotting.
Candle colouring (on/off) applies or removes trend-based candle colour changes.
Bollinger Band Signals (on/off) toggles take-profit signals when the WT Line crosses the bands.
Bullish/Bearish colours allow customization of divergence and signal colours.
Interpretation
The WaveTrend Oscillator helps traders assess market momentum and trend strength.
Crossovers between the WT Line and signal line indicate potential trend reversals.
Divergences warn of weakening momentum and possible reversals, with Plus Divergences acting as stronger signals.
Bollinger Band Crosses highlight areas where momentum is overstretched, signaling potential profit-taking opportunities.
Centered Oscillators

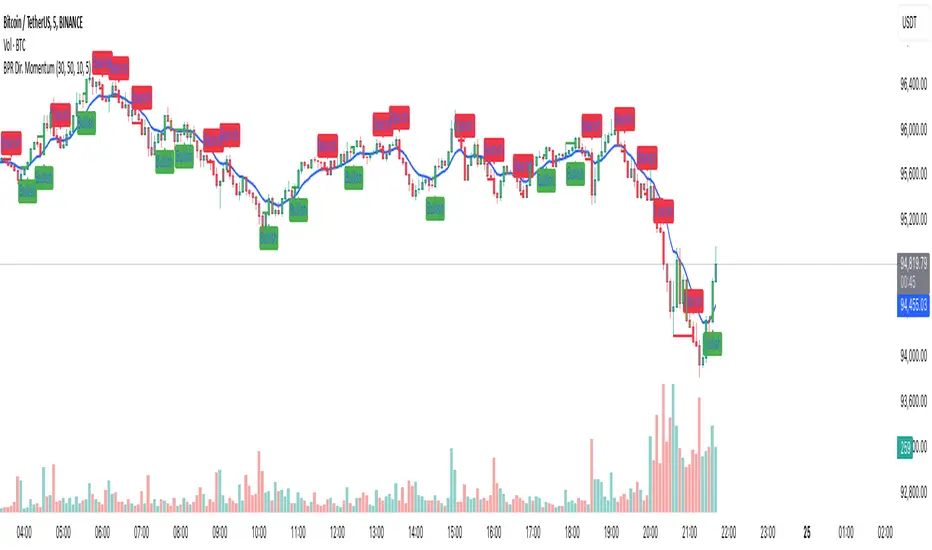
Balance Price Range (BPR) IndicatorOverview
The BPR with Directional Momentum-Filtered Breakouts indicator is designed to identify Balanced Price Ranges (BPR) and d etect high-probability breakouts and breakdowns with directional momentum confirmation . By leveraging historical BPR structures, EMA-based momentum filtering , and a trade cooldown mechanism , this script provides a structured approach to identifying potential trading opportunities while reducing false signals.
This invite-only indicator is ideal for traders who seek precise breakout confirmation, reduced noise, and trend-following logic while maintaining flexibility through adjustable parameters.
How It Works
The script follows a multi-step breakout detection process by integrating multiple key technical components:
1. Balanced Price Range (BPR) Detection:
• A Balanced Candle is identified when the price remains within a specific percentage of its range midpoint.
• These BPR zones represent areas of equilibrium , where a breakout or breakdown is likely to occur.
• The script historically tracks BPR levels across the entire chart to monitor price action around key areas.
2. Momentum-Filtered Breakout & Breakdown Logic:
• Bullish Breakout: Occurs when the price breaks above the historical BPR high with bullish momentum.
• Bearish Breakdown: Occurs when the price breaks below the historical BPR low with bearish momentum.
• Momentum Confirmation: Each breakout requires a strong directional move, measured against the Exponential Moving Average (EMA) .
• Only confirmed breakouts are marked, reducing the likelihood of false signals in choppy markets.
3. Candle-Based Background Visualization:
• Grey Background: Represents a Balanced Price Range (BPR), indicating potential breakout zones.
• Green Background: Indicates a Bullish Breakout when the price successfully breaks and holds above the BPR high.
• Red Background: Indicates a Bearish Breakdown when the price drops below the BPR low.
4. Trade Cooldown Mechanism:
• Prevents consecutive signals from triggering too frequently.
• Default cooldown period: 5 bars (adjustable).
• Ensures that trades are not clustered, improving signal quality.
5. EMA for Trend Direction & Confirmation:
• A 20-period EMA (default, adjustable) is used to confirm trade direction.
• Breakouts above the EMA align with uptrend continuation.
• Breakdowns below the EMA align with downtrend momentum.
Key Features
✔️ Historical BPR Detection – Tracks past BPR levels across the entire chart for structured breakout zones.
✔️ Momentum-Based Breakouts – Ensures breakouts are confirmed by directional price movement before generating signals.
✔️ Candle-Based Background Logic – Subtle candle highlights rather than full background fills, for better chart clarity.
✔️ Trade Cooldown Period – Prevents consecutive buy/sell signals within a defined period, improving signal efficiency.
✔️ Dynamic EMA Confirmation – Ensures trades align with the overall trend, reducing counter-trend trades.
✔️ Customizable Inputs – Adjust breakout thresholds, EMA length, and cooldown periods as per trading style.
✔️ Works Across Multiple Timeframes – Can be applied to intraday, swing, and positional trading strategies.
How to Use
1. Look for Balanced Price Ranges ( BPR )
• These zones highlight equilibrium areas where price is likely to break out.
• Grey-shaded candles indicate potential breakout zones.
2. Monitor for Bullish or Bearish Breakouts
• A green candle background signals a bullish breakout above BPR.
• A red candle background signals a bearish breakdown below BPR.
• The EMA filter helps confirm whether the breakout aligns with the prevailing trend.
3. Follow the Cooldown Logic
• After a breakout signal, wait for the cooldown period before another trade is allowed.
• This helps filter out noisy price action and prevents excessive trading.
4. Use Alongside Other Indicators
• Works well with volume analysis, support/resistance levels, and price action strategies.
• Can be combined with other momentum indicators for further trade confirmation.
Why This Combination?
Unlike generic breakout indicators, this script uniquely combines:
• BPR historical structures for defining potential breakout zones.
• Momentum-based breakout filtering using EMA confirmation.
• Trade cooldown logic to avoid excessive trading signals.
• Subtle candle-based highlights instead of cluttered full-background fills.
This structured approach makes the indicator more robust, adaptive, and reliable in different market conditions.
Why It’s Worth Using?
🔹 Avoid False Breakouts: Built-in momentum confirmation prevents weak or fake breakouts.
🔹 Clean Visualization: No excessive overlays—just precise, meaningful background coloring for breakouts.
🔹 Works in Any Market: Use on stocks, crypto, forex, indices, and commodities across different timeframes.
🔹 User-Friendly & Customizable: Fine-tune parameters to match individual trading styles.
⚠️ Note: This is an Invite-Only script. Access is granted to selected users.
✅ If you find it useful, consider incorporating it into your trend-following & breakout trading strategies.
🚀 Optimize your trading with structured breakout detection! 🚀
Bar Color - Moving Average Convergence Divergence [nsen]The Pine Script you've provided creates a custom indicator that utilizes the MACD (Moving Average Convergence Divergence) and displays various outputs, such as bar color changes based on MACD signals, and a table of data from multiple timeframes. Here's a breakdown of how the script works:
1. Basic Settings (Input)
• The script defines several user-configurable parameters, such as the MACD values, bar colors, the length of the EMA (Exponential Moving Average) periods, and signal smoothing.
• Users can also choose timeframes to analyze the MACD values, like 5 minutes, 15 minutes, 1 hour, 4 hours, and 1 day.
2. MACD Calculation
• It uses the EMA of the close price to calculate the MACD value, with fast_length and slow_length representing the fast and slow periods. The signal_length is used to calculate the Signal Line.
• The MACD value is the difference between the fast and slow EMA, and the Signal Line is the EMA of the MACD.
• The Histogram is the difference between the MACD and the Signal Line.
3. Plotting the Histogram
• The Histogram values are plotted with colors that change based on the value. If the Histogram is positive (rising), it is colored differently than if it's negative (falling). The colors are determined by the user inputs, for example, green for bullish (positive) signals and red for bearish (negative) signals.
4. Bar Coloring
• The bar color changes based on the MACD's bullish or bearish signal. If the MACD is bullish (MACD > Signal), the bar color will change to the color defined for bullish signals, and if it's bearish (MACD < Signal), the bar color will change to the color defined for bearish signals.
5. Multi-Timeframe Data Table
• The script includes a table displaying the MACD trend for different timeframes (e.g., 5m, 15m, 1h, 4h, 1d).
• Each timeframe will show a colored indicator: green (🟩) for bullish and red (🟥) for bearish, with the background color changing based on the trend.
6. Alerts
• The script has alert conditions to notify the user when the MACD shows a bullish or bearish entry:
• Bullish Entry: When the MACD turns bullish (crosses above the Signal Line).
• Bearish Entry: When the MACD turns bearish (crosses below the Signal Line).
• Alerts are triggered with custom messages such as "🟩 MACD Bullish Entry" and "🟥 MACD Bearish Entry."
Key Features:
• Customizable Inputs: Users can adjust the MACD settings, histogram colors, and timeframe options.
• Visual Feedback: The color changes of the histogram and bars provide instant visual cues for bullish or bearish trends.
• Multi-Timeframe Analysis: The table shows the MACD trend across multiple timeframes, helping traders monitor trends in different timeframes.
• Alert Conditions: Alerts notify users when key MACD crossovers occur.

SuperTrend AI Oscillator StrategySuperTrend AI Oscillator Strategy
Overview
This strategy is a trend-following approach that combines the SuperTrend indicator with oscillator-based filtering.
By identifying market trends while utilizing oscillator-based momentum analysis, it aims to improve entry precision.
Additionally, it incorporates a trailing stop to strengthen risk management while maximizing profits.
This strategy can be applied to various markets, including Forex, Crypto, and Stocks, as well as different timeframes. However, its effectiveness varies depending on market conditions, so thorough testing is required.
Features
1️⃣ Trend Identification Using SuperTrend
The SuperTrend indicator (a volatility-adjusted trend indicator based on ATR) is used to determine trend direction.
A long entry is considered when SuperTrend turns bullish.
A short entry is considered when SuperTrend turns bearish.
The goal is to capture clear trend reversals and avoid unnecessary trades in ranging markets.
2️⃣ Entry Filtering with an Oscillator
The Super Oscillator is used to filter entry signals.
If the oscillator exceeds 50, it strengthens long entries (indicating strong bullish momentum).
If the oscillator drops below 50, it strengthens short entries (indicating strong bearish momentum).
This filter helps reduce trades in uncertain market conditions and improves entry accuracy.
3️⃣ Risk Management with a Trailing Stop
Instead of a fixed stop loss, a SuperTrend-based trailing stop is implemented.
The stop level adjusts automatically based on market volatility.
This allows profits to run while managing downside risk effectively.
4️⃣ Adjustable Risk-Reward Ratio
The default risk-reward ratio is set at 1:2.
Example: A 1% stop loss corresponds to a 2% take profit target.
The ratio can be customized according to the trader’s risk tolerance.
5️⃣ Clear Trade Signals & Visual Support
Green "BUY" labels indicate long entry signals.
Red "SELL" labels indicate short entry signals.
The Super Oscillator is plotted in a separate subwindow to visually assess trend strength.
A real-time trailing stop is displayed to support exit strategies.
These visual aids make it easier to identify entry and exit points.
Trading Parameters & Considerations
Initial Account Balance: Default is $7,000 (adjustable).
Base Currency: USD
Order Size: 10,000 USD
Pyramiding: 1
Trading Fees: $0.94 per trade
Long Position Margin: 50%
Short Position Margin: 50%
Total Trades (M5 Timeframe): 1,032
Visual Aids for Clarity
This strategy includes clear visual trade signals to enhance decision-making:
Green "BUY" labels for long entries
Red "SELL" labels for short entries
Super Oscillator plotted in a subwindow with a 50 midline
Dynamic trailing stop displayed for real-time trend tracking
These visual aids allow traders to quickly identify trade setups and manage positions with greater confidence.
Summary
The SuperTrend AI Oscillator Strategy is developed based on indicators from Black Cat and LuxAlgo.
By integrating high-precision trend analysis with AI-based oscillator filtering, it provides a strong risk-managed trading approach.
Important Notes
This strategy does not guarantee profits—performance varies based on market conditions.
Past performance does not guarantee future results. Markets are constantly changing.
Always test extensively with backtesting and demo trading before using it in live markets.
Risk management, position sizing, and market conditions should always be considered when trading.
Conclusion
This strategy combines trend analysis with momentum filtering, enhancing risk management in trading.
By following market trends carefully, making precise entries, and using trailing stops, it seeks to reduce risk while maximizing potential profits.
Before using this strategy, be sure to test it thoroughly via backtesting and demo trading, and adjust the settings to match your trading style.

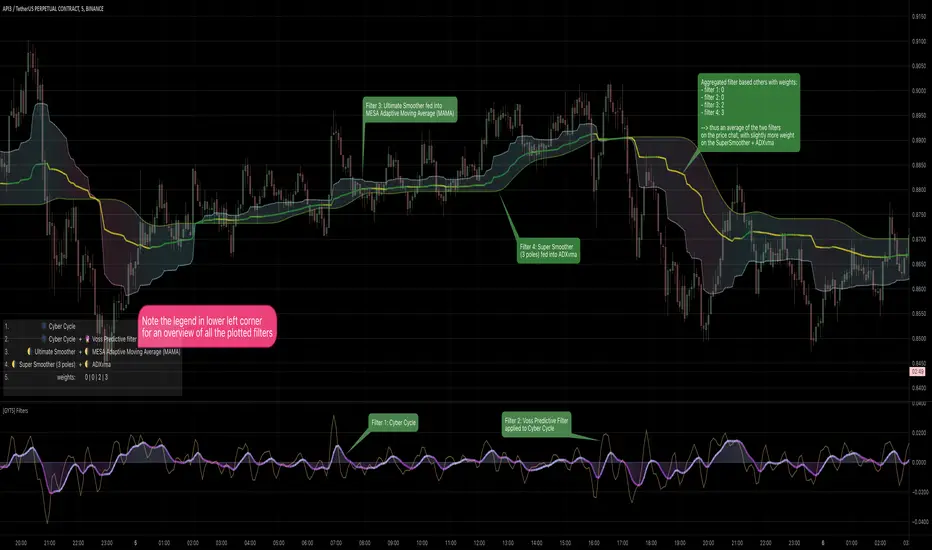
[GYTS] Filters ToolkitFilters Toolkit indicator
🌸 Part of GoemonYae Trading System (GYTS) 🌸
🌸 --------- 1. INTRODUCTION --------- 🌸
💮 Overview
The GYTS Filters Toolkit indicator is an advanced, interactive interface built atop the high‐performance, curated functions provided by the FiltersToolkit library . It allows traders to experiment with different combinations of filtering methods -— from smoothing low-pass filters to aggressive detrenders. With this toolkit, you can build custom indicators tailored to your specific trading strategy, whether you're looking for trend following, mean reversion, or cycle identification approaches.
🌸 --------- 2. FILTER METHODS AND TYPES --------- 🌸
💮 Filter categories
The available filters fall into four main categories, each marked with a distinct symbol:
🌗 Low Pass Filters (Smoothers)
These filters attenuate high-frequency components (noise) while allowing low-frequency components (trends) to pass through. Examples include:
Ultimate Smoother
Super Smoother (2-pole and 3-pole variants)
MESA Adaptive Moving Average (MAMA) and Following Adaptive Moving Average (FAMA)
BiQuad Low Pass Filter
ADXvma (Adaptive Directional Volatility Moving Average)
A2RMA (Adaptive Autonomous Recursive Moving Average)
Low pass filters are displayed on the price chart by default, as they follow the overall price movement. If they are combined with a high-pass or bandpass filter, they will be displayed in the subgraph.
🌓 High Pass Filters (Detrenders)
These filters do the opposite of low pass filters - they remove low-frequency components (trends) while allowing high-frequency components to pass through. Examples include:
Butterworth High Pass Filter
BiQuad High Pass Filter
High pass filters are displayed as oscillators in the subgraph below the price chart, as they fluctuate around a zero line.
🌑 Band Pass Filters (Cycle Isolators)
These filters combine aspects of both low and high pass filters, isolating specific frequency ranges while attenuating both higher and lower frequencies. Examples include:
Ehlers Bandpass Filter
Cyber Cycle
Relative Vigor Index (RVI)
BiQuad Bandpass Filter
Band pass filters are also displayed as oscillators in a separate panel.
🔮 Predictive Filter
Voss Predictive Filter: A special filter that attempts to predict future values of band-limited signals (only to be used as post-filter). Keep its prediction horizon short (1–3 bars) for reasonable accuracy.
Note that the the library contains elaborate documentation and source material of each filter.
🌸 --------- 3. INDICATOR FEATURES --------- 🌸
💮 Multi-filter configuration
One of the most powerful aspects of this indicator is the ability to configure multiple filters. compare them and observe their combined effects. There are four primary filters, each with its own parameter settings.
💮 Post-filtering
Process a filter’s output through an additional filter by enabling the post-filter option. This creates a filter chain where the output of one filter becomes the input to another. Some powerful combinations include:
Ultimate Smoother → MAMA: Creates an adaptive smoothing effect that responds well to market changes, good for trend-following strategies
Butterworth → Super Smoother → Butterworth: Produces a well-behaved oscillator with minimal phase distortion, John Ehlers also calls a "roofing filter". Great for identifying overbought/oversold conditions with minimal lag.
A bandpass filter → Voss Prediction filter: Attempts to predict future movements of cyclical components, handy to find peaks and troughs of the market cycle.
💮 Aggregate filters
Arguably the coolest feature: aggregating filters allow you to combine multiple filters with different weights. Important notes about aggregation:
You can only aggregate filters that appear on the same chart (price chart or oscillator panel).
The weights are automatically normalised, so only their relative values matter
Setting a weight to 0 (zero) excludes that filter from the aggregation
Filters don't need to be visibly displayed to be included in aggregation
💮 Rich visualisation & alerts
The indicator intelligently determines whether a filter is displayed on the price chart or in the subgraph (as an oscillator) based on its characteristics.
Dynamic colour palettes, adjustable line widths, transparency, and custom fill between any of enabled filters or between oscillators and the zero-line.
A clear legend showing which filters are active and how they're configured
Alerts for direction changes and crossovers of all filters
🌸 --------- 4. ACKNOWLEDGEMENTS --------- 🌸
This toolkit builds on the work of numerous pioneers in technical analysis and digital signal processing:
John Ehlers, whose groundbreaking research forms the foundation of many filters.
Robert Bristow-Johnson for the BiQuad filter formulations.
The TradingView community, especially @The_Peaceful_Lizard, @alexgrover, and others mentioned in the code of the library.
Everyone who has provided feedback, testing and support!
Ultimate Trading BotHow the "Ultimate Trading Bot" Works:
This Pine Script trading bot executes buy and sell trades based on a combination of technical indicators:
Indicators Used:
RSI (Relative Strength Index)
Measures momentum and determines overbought (70) and oversold (30) levels.
A crossover above 30 suggests a potential buy, and a cross below 70 suggests a potential sell.
Moving Average (MA)
A simple moving average (SMA) of 50 periods to track the trend.
Prices above the MA indicate an uptrend, while prices below indicate a downtrend.
Stochastic Oscillator (%K and %D)
Identifies overbought and oversold conditions using a smoothed stochastic formula.
A crossover of %K above %D signals a buy, and a crossover below %D signals a sell.
MACD (Moving Average Convergence Divergence)
Uses a 12-period fast EMA and a 26-period slow EMA, with a 9-period signal line.
A crossover of MACD above the signal line suggests a bullish move, and a cross below suggests bearish movement.
Trade Execution:
Buy (Long Entry) Conditions:
RSI crosses above 30 (indicating recovery from an oversold state).
The closing price is above the 50-period moving average (showing an uptrend).
The MACD line crosses above the signal line (indicating upward momentum).
The Stochastic %K crosses above %D (indicating bullish momentum).
→ If all conditions are met, the bot enters a long (buy) position.
Sell (Exit Trade) Conditions:
RSI crosses below 70 (indicating overbought conditions).
The closing price is below the 50-period moving average (downtrend).
The MACD line crosses below the signal line (bearish signal).
The Stochastic %K crosses below %D (bearish momentum).
→ If all conditions are met, the bot closes the long position.
Visuals:
The bot plots the moving average, RSI, MACD, and Stochastic indicators for reference.
It also displays buy/sell signals with arrows:
Green arrow (Buy Signal) → When all buy conditions are met.
Red arrow (Sell Signal) → When all sell conditions are met.
How to Use It in TradingView:

Squeeze Momentum Indicator Strategy [LazyBear + PineIndicators]The Squeeze Momentum Indicator Strategy (SQZMOM_LB Strategy) is an automated trading strategy based on the Squeeze Momentum Indicator developed by LazyBear, which itself is a modification of John Carter's "TTM Squeeze" concept from his book Mastering the Trade (Chapter 11). This strategy is designed to identify low-volatility phases in the market, which often precede explosive price movements, and to enter trades in the direction of the prevailing momentum.
Concept & Indicator Breakdown
The strategy employs a combination of Bollinger Bands (BB) and Keltner Channels (KC) to detect market squeezes:
Squeeze Condition:
When Bollinger Bands are inside the Keltner Channels (Black Crosses), volatility is low, signaling a potential upcoming price breakout.
When Bollinger Bands move outside Keltner Channels (Gray Crosses), the squeeze is released, indicating an expansion in volatility.
Momentum Calculation:
A linear regression-based momentum value is used instead of traditional momentum indicators.
The momentum histogram is color-coded to show strength and direction:
Lime/Green: Increasing bullish momentum
Red/Maroon: Increasing bearish momentum
Signal Colors:
Black: Market is in a squeeze (low volatility).
Gray: Squeeze is released, and volatility is expanding.
Blue: No squeeze condition is present.
Strategy Logic
The script uses historical volatility conditions and momentum trends to generate buy/sell signals and manage positions.
1. Entry Conditions
Long Position (Buy)
The squeeze just released (Gray Cross after Black Cross).
The momentum value is increasing and positive.
The momentum is at a local low compared to the past 100 bars.
The price is above the 100-period EMA.
The closing price is higher than the previous close.
Short Position (Sell)
The squeeze just released (Gray Cross after Black Cross).
The momentum value is decreasing and negative.
The momentum is at a local high compared to the past 100 bars.
The price is below the 100-period EMA.
The closing price is lower than the previous close.
2. Exit Conditions
Long Exit:
The momentum value starts decreasing (momentum lower than previous bar).
Short Exit:
The momentum value starts increasing (momentum higher than previous bar).
Position Sizing
Position size is dynamically adjusted based on 8% of strategy equity, divided by the current closing price, ensuring risk-adjusted trade sizes.
How to Use This Strategy
Apply on Suitable Markets:
Best for stocks, indices, and forex pairs with momentum-driven price action.
Works on multiple timeframes but is most effective on higher timeframes (1H, 4H, Daily).
Confirm Entries with Additional Indicators:
The author recommends ADX or WaveTrend to refine entries and avoid false signals.
Risk Management:
Since the strategy dynamically sizes positions, it's advised to use stop-losses or risk-based exits to avoid excessive drawdowns.
Final Thoughts
The Squeeze Momentum Indicator Strategy provides a systematic approach to trading volatility expansions, leveraging the classic TTM Squeeze principles with a unique linear regression-based momentum calculation. Originally inspired by John Carter’s method, LazyBear's version and this strategy offer a refined, adaptable tool for traders looking to capitalize on market momentum shifts.

Power Play Signal Indicator [Masky18]Power Play Signal Indicator
The Power Play Signal Indicator is a sophisticated custom trading strategy designed to identify high-probability breakout and breakdown opportunities by combining consolidation detection, trend alignment, volume analysis, and relative strength ranking. Unlike simple mashups of existing indicators, this script integrates multiple technical concepts into a cohesive strategy that helps traders capitalize on market momentum with precision.
What Makes This Indicator Unique?
The PowerPlay Signal Indicator is not just a combination of existing indicators; it is a custom-built strategy that uses original logic to filter out low-probability setups and focus on high-quality trading opportunities. Here’s how it works:
Consolidation Detection:
The script identifies consolidation zones by analyzing price action over a user-defined period (default: 6 bars). It calculates the high, low, and midpoint of the consolidation range and ensures the price stays within a specified percentage range (default: 13%).
Consolidations are classified as Tight, Loose, or Okay, helping traders gauge the strength of the potential breakout or breakdown.
Breakout & Breakdown Logic:
Breakouts and breakdowns are confirmed using a combination of:
Price Action: The script checks if the price closes above the consolidation high (breakout) or below the consolidation low (breakdown).
Volume Analysis: A significant volume spike (default: 20% increase) is required to confirm the move.
MACD & Moving Averages: The script uses MACD and moving averages (50-day and 200-day) to ensure the breakout/breakdown aligns with the prevailing trend.
Trend Alignment:
The script ensures trades are aligned with the long-term trend by using:
50-day SMA and 200-day SMA to confirm uptrends or downtrends.
150-day SMA as an additional filter to ensure the trend is strong.
52-week high/low conditions to ensure the price is in a favorable position relative to its historical range.
Relative Strength Ranking:
The script compares the asset’s performance against a benchmark asset (e.g., SPY) to ensure it is outperforming the market. This is done using a customizable Relative Strength (RS) Threshold (default: 70).
Golden Candle Signals:
For high-probability setups, the script identifies Golden Candles—strong breakout or breakdown candles with:
Large price movement (default: 7.5% to 12.5% candle size).
High volume (default: 2x the average consolidation volume).
Alignment with MACD and moving averages.
Risk Management:
The script provides stop loss, trailing stop, and take profit levels based on:
ATR (Average True Range): Dynamic stop loss levels are calculated using ATR (default: 14-period ATR with a 2x multiplier).
Trailing Stop Percentage: User-defined trailing stop (default: 2%).
Take Profit Percentage: User-defined take profit (default: 5%).
Performance Tracking:
The script includes a Performance Table that tracks:
Total breakouts and breakdowns.
Successful and failed trades.
Win rates for breakouts and breakdowns.
Golden candle signals.
How Does It Work?
The PowerPlay Signal Indicator combines the following key components to generate signals:
Consolidation Detection:
The script calculates the high, low, and midpoint of the consolidation range over a user-defined period.
It ensures the price stays within a specified percentage range (default: 13%) to confirm consolidation.
Breakout/Breakdown Confirmation:
A breakout is confirmed when:
The price closes above the consolidation high.
Volume increases by at least 20%.
MACD is positive and above the signal line.
The price is above the 50-day and 200-day SMAs.
A breakdown is confirmed when:
The price closes below the consolidation low.
Volume increases by at least 20%.
MACD is negative and below the signal line.
The price is below the 50-day and 200-day SMAs.
Golden Candle Signals:
Golden Candles are identified when:
The candle size is between 7.5% and 12.5%.
Volume is at least 2x the average consolidation volume.
The candle aligns with the prevailing trend and MACD.
Risk Management:
Stop loss levels are calculated using ATR (default: 14-period ATR with a 2x multiplier).
Trailing stop and take profit levels are based on user-defined percentages.
How to Use the Indicator
Input Parameters:
Consolidation Periods: Set the number of bars to analyze for consolidation (default: 6).
Maximum Consolidation Range: Define the maximum percentage range for consolidation (default: 13%).
Stop Loss Factor: Adjust the stop loss multiplier based on the midpoint of the consolidation range (default: 0.985).
RS Threshold: Set the relative strength threshold for trend alignment (default: 70).
Comparison Asset: Enable comparison with a benchmark asset (e.g., SPY) to ensure the asset is outperforming the market.
Trailing Stop Percentage: Set the trailing stop percentage (default: 2%).
Take Profit Percentage: Set the take profit percentage (default: 5%).
Time Exit Bars: Define the maximum number of bars to hold a trade (default: 10).
Interpreting Signals:
Breakout Signal: A green label ("BO") appears when a breakout is detected.
Breakdown Signal: A red label ("BD") appears when a breakdown is detected.
Golden Candle Signal: A gold medal icon (🥇) appears for high-probability setups.
Performance Table:
The performance table displays the number of trades, successful trades, failed trades, and win rates for breakouts and breakdowns.
Alerts:
Enable alerts for breakouts, breakdowns, and golden candles to stay informed about potential trading opportunities.
Why Choose the PowerPlay Signal Indicator?
Original Logic: Combines consolidation detection, trend alignment, volume analysis, and relative strength ranking into a unique strategy.
High-Probability Signals: Focuses on high-quality setups with strong volume and trend alignment.
Risk Management: Built-in stop loss, trailing stop, and take profit options help you manage risk effectively.
Performance Tracking: Tracks trade outcomes and win rates to help you refine your strategy.
Customizable: Fully adjustable inputs allow you to adapt the indicator to your trading style and market conditions.

Sniper TradingSniper Trader Indicator Overview
Sniper Trader is a comprehensive trading indicator designed to assist traders by providing valuable insights and alerting them to key market conditions. The indicator combines several technical analysis tools and provides customizable inputs for different strategies and needs.
Here’s a detailed breakdown of all the components and their functions in the Sniper Trader indicator:
1. MACD (Moving Average Convergence Divergence)
The MACD is a trend-following momentum indicator that helps determine the strength and direction of the current trend. It consists of two lines:
MACD Line (Blue): Calculated by subtracting the long-term EMA (Exponential Moving Average) from the short-term EMA.
Signal Line (Red): The EMA of the MACD line, typically set to 9 periods.
What does it do?
Buy Signal: When the MACD line crosses above the signal line, it generates a buy signal.
Sell Signal: When the MACD line crosses below the signal line, it generates a sell signal.
Zero Line Crossings: Alerts are triggered when the MACD line crosses above or below the zero line.
2. RSI (Relative Strength Index)
The RSI is a momentum oscillator used to identify overbought or oversold conditions in the market.
Overbought Level (Red): The level above which the market might be considered overbought, typically set to 70.
Oversold Level (Green): The level below which the market might be considered oversold, typically set to 30.
What does it do?
Overbought Signal: When the RSI crosses above the overbought level, it’s considered a signal that the asset may be overbought.
Oversold Signal: When the RSI crosses below the oversold level, it’s considered a signal that the asset may be oversold.
3. ATR (Average True Range)
The ATR is a volatility indicator that measures the degree of price movement over a specific period (14 bars in this case). It provides insights into how volatile the market is.
What does it do?
The ATR value is plotted on the chart and provides a reference for potential market volatility. It's used to detect flat zones, where the price may not be moving significantly, potentially indicating a lack of trends.
4. Support and Resistance Zones
The Support and Resistance Zones are drawn by identifying key swing highs and lows over a user-defined look-back period.
Support Zone (Green): Identifies areas where the price has previously bounced upwards.
Resistance Zone (Red): Identifies areas where the price has previously been rejected or reversed.
What does it do?
The indicator uses swing highs and lows to define support and resistance zones and highlights these areas on the chart. This helps traders identify potential price reversal points.
5. Alarm Time
The Alarm Time feature allows you to set a custom time for the indicator to trigger an alarm. The time is based on Eastern Time and can be adjusted directly in the inputs tab.
What does it do?
It triggers an alert at a user-defined time (for example, 4 PM Eastern Time), helping traders close positions or take specific actions at a set time.
6. Market Condition Display
The Market Condition Display shows whether the market is in a Bullish, Bearish, or Flat state based on the MACD line’s position relative to the signal line.
Bullish (Green): The market is in an uptrend.
Bearish (Red): The market is in a downtrend.
Flat (Yellow): The market is in a range or consolidation phase.
7. Table for Key Information
The indicator includes a customizable table that displays the current market condition (Bull, Bear, Flat). The table is placed at a user-defined location (top-left, top-right, bottom-left, bottom-right), and the appearance of the table can be adjusted for text size and color.
8. Background Highlighting
Bullish Reversal: When the MACD line crosses above the signal line, the background is shaded green to highlight the potential for a trend reversal to the upside.
Bearish Reversal: When the MACD line crosses below the signal line, the background is shaded red to highlight the potential for a trend reversal to the downside.
Flat Zone: A flat zone is identified when volatility is low (ATR is below the average), and the background is shaded orange to signal periods of low market movement.
Key Features:
Customizable Time Inputs: Adjust the alarm time based on your local time zone.
User-Friendly Table: Easily view market conditions and adjust display settings.
Comprehensive Alerts: Receive alerts for MACD crossovers, RSI overbought/oversold conditions, flat zones, and the custom alarm time.
Support and Resistance Zones: Drawn automatically based on historical price action.
Trend and Momentum Indicators: Utilize the MACD and RSI for identifying trends and market conditions.
How to Use Sniper Trader:
Set Your Custom Time: Adjust the alarm time to match your trading schedule.
Monitor Market Conditions: Check the table for real-time market condition updates.
Use MACD and RSI Signals: Watch for MACD crossovers and RSI overbought/oversold signals.
Watch for Key Zones: Pay attention to the support and resistance zones and background highlights to identify market turning points.
Set Alerts: Use the built-in alerts to notify you of buy/sell signals or when it’s time to take action at your custom alarm time.

Multi-Asset & TF RSI
Multi-Asset & TF RSI
This indicator allows you to compare the Relative Strength Index (RSI) values of two different assets across multiple timeframes in a single pane. It’s ideal for traders who wish to monitor momentum across different markets or instruments simultaneously.
Key Features:
Primary Asset RSI:
The indicator automatically calculates the RSI for the chart’s asset. You can adjust the timeframe for this asset using a dropdown that offers standard TradingView timeframes, a "Chart" option (which syncs with your current chart timeframe), or a "Custom" option where you can enter any timeframe.
Optional Second Asset RSI:
Enable the “Display Second Asset” option to compare another asset’s RSI. Simply select the symbol (default is “DXY”) and choose its timeframe from an identical dropdown. When enabled, the second asset’s RSI is computed and plotted for easy comparison.
RSI Settings:
Customize the RSI length and choose the data source (e.g., close price) to suit your trading strategy.
Visual Aids:
Overbought (70) and oversold (30) levels are clearly marked, along with a midline at 50. These visual cues help you quickly assess market conditions.
Asset Information Table:
A dynamic table at the top of the pane displays the symbols being analysed – the chart’s asset as the “1st” asset and, if enabled, the second asset as the “2nd.”
How to Use:
Apply the Indicator:
Add the indicator to your chart. By default, it will calculate the RSI for the chart’s current asset using your chart’s timeframe.
Adjust Primary Asset Settings:
Use the “Main Asset Timeframe” dropdown to choose the timeframe for the RSI calculation on the chart asset. Select “Chart” to automatically match your current chart’s timeframe or choose a preset/custom timeframe.
Enable and Configure the Second Asset:
Toggle the “Display Second Asset” option to enable the second asset’s RSI. Select the asset symbol and its desired timeframe using the provided dropdown. The RSI for the second asset will be plotted if enabled.
Monitor the RSI Values:
Observe the plotted RSI lines along with the overbought/oversold levels. Use the table at the top-centre of the pane to verify which asset symbols are being displayed.
This versatile tool is designed to support multi-asset analysis and can be a valuable addition to your technical analysis toolkit. Enjoy enhanced RSI comparison across markets and timeframes!
Happy Trading!

Multi Asset & TF Stochastic
Multi Asset & TF Stochastic
This indicator allows you to compare the stochastic oscillator values of two different assets across multiple timeframes in a single pane. It’s designed for traders who want to analyse the momentum of one asset (by default, the chart’s asset) alongside a second asset of your choice (e.g., comparing EURUSD to the USD Index).
How It Works:
Main Asset:
The indicator automatically uses the chart’s asset for the primary stochastic calculation. You have the option to adjust the timeframe for this asset using a dropdown that includes TradingView’s standard timeframes, a "Chart" option (which automatically uses your chart’s timeframe), or a "Custom" option where you can type in any timeframe.
Second Asset:
You can enable the display of a second asset by toggling the “Display Second Asset” option. Choose the asset symbol (default is “DXY”) and select its timeframe from an identical dropdown. When enabled, the script calculates the stochastic oscillator for the second asset, allowing you to compare its momentum (%K and %D lines) with that of the main asset.
Stochastic Oscillator Settings:
Customize the %K length, the smoothing period for %K, and the smoothing period for %D. Both assets’ stochastic values are calculated using these parameters.
Visual Display:
The indicator plots the %K and %D lines for the main asset in prominent colours. If the second asset is enabled, its %K and %D lines are also plotted in different colours. Additionally, overbought (80) and oversold (20) levels are marked, with a midline at 50, making it easier to gauge market conditions at a glance.
%D line can be toggled off for a cleaner view if required:
Asset Information Table:
A table at the top-centre of the pane displays the active asset symbols—ensuring you always know which assets are being analysed.
How to Use:
Apply the Indicator:
Add the script to your chart. By default, it will use the chart’s current asset and timeframe for the primary stochastic oscillator.
Adjust the Main Asset Settings:
Use the “Main Asset Timeframe” dropdown to select a specific timeframe for the main asset or stick with the “Chart” option for automatic syncing with your current chart.
Enable and Configure the Second Asset (Optional):
Toggle on “Display Second Asset” if you wish to compare another asset. Select the desired symbol and adjust its timeframe using the provided dropdown. Choose “Custom” if you need a timeframe not listed by default.
Review the Plots and Table:
Observe the stochastic %K and %D lines for each asset. The overbought/oversold levels help indicate potential market turning points. Check the table at the top-centre to confirm the asset symbols being displayed.
This versatile tool is ideal for traders who rely on momentum analysis and need to quickly compare the stochastic signals of different markets or instruments. Enjoy seamless multi-asset analysis with complete control over your timeframe settings!

Pay Attention CandleThis is an attempt to detect the so called Pay Attention Candles from RexDog Trading System (RDTS). (They are not clearly defined by any specific set in stone rule, so this is just my interpretation)
You can turn on and off the bar highlight/triangles if chart gets too busy and you want only one of the indication types.
The way this is defined as evident in the code is - it looks at the candle size (without the wicks!!! only open to close) to decide whether it is larger than ATR mutlipied by a multiplier (1.5 by default here - you can adjust)
ATR period can also be adjusted but it's set to 9 by default.
Enjoy.

MACD+RSI Indicator Moving Average Convergence/Divergence or MACD is a momentum indicator that shows the relationship between two Exponential Moving Averages (EMAs) of a stock price. Convergence happens when two moving averages move toward one another, while divergence occurs when the moving averages move away from each other. This indicator also helps traders to know whether the stock is being extensively bought or sold. Its ability to identify and assess short-term price movements makes this indicator quite useful.
The Moving Average Convergence/Divergence indicator was invented by Gerald Appel in 1979.
Moving Average Convergence/Divergence is calculated using a 12-day EMA and 26-day EMA. It is important to note that both the EMAs are based on closing prices. The convergence and divergence (CD) values have to be calculated first. The CD value is calculated by subtracting the 26-day EMA from the 12-day EMA.
---------------------------------------------------------------------------------------------------------------------
The relative strength index (RSI) is a momentum indicator used in technical analysis. RSI measures the speed and magnitude of a security's recent price changes to detect overbought or oversold conditions in the price of that security.
The RSI is displayed as an oscillator (a line graph) on a scale of zero to 100. The indicator was developed by J. Welles Wilder Jr. and introduced in his seminal 1978 book, New Concepts in Technical Trading Systems.
In addition to identifying overbought and oversold securities, the RSI can also indicate securities that may be primed for a trend reversal or a corrective pullback in price. It can signal when to buy and sell. Traditionally, an RSI reading of 70 or above indicates an overbought condition. A reading of 30 or below indicates an oversold condition.
---------------------------------------------------------------------------------------------------------------------
By combining them, you can create a MACD/RSI strategy. You can go ahead and search for MACD/RSI strategy on any social platform. It is so powerful that it is the most used indicator in TradingView. It is best for trending market. Our indicator literally let you customize MACD/RSI settings. Explore our indicator by applying to your chart and start trading now!

MACD Volume Strategy for XAUUSD (15m) [PineIndicators]The MACD Volume Strategy is a momentum-based trading system designed for XAUUSD on the 15-minute timeframe. It integrates two key market indicators: the Moving Average Convergence Divergence (MACD) and a volume-based oscillator to identify strong trend shifts and confirm trade opportunities. This strategy uses dynamic position sizing, incorporates leverage customization, and applies structured entry and exit conditions to improve risk management.
⚙️ Core Strategy Components
1️⃣ Volume-Based Momentum Calculation
The strategy includes a custom volume oscillator to filter trade signals based on market activity. The oscillator is derived from the difference between short-term and long-term volume trends using Exponential Moving Averages (EMAs)
Short EMA (default = 5) represents recent volume activity.
Long EMA (default = 8) captures broader volume trends.
Positive values indicate rising volume, supporting momentum-based trades.
Negative values suggest weak market activity, reducing signal reliability.
By requiring positive oscillator values, the strategy ensures momentum confirmation before entering trades.
2️⃣ MACD Trend Confirmation
The strategy uses the MACD indicator as a trend filter. The MACD is calculated as:
Fast EMA (16-period) detects short-term price trends.
Slow EMA (26-period) smooths out price fluctuations to define the overall trend.
Signal Line (9-period EMA) helps identify crossovers, signaling potential trend shifts.
Histogram (MACD – Signal) visualizes trend strength.
The system generates trade signals based on MACD crossovers around the zero line, confirming bullish or bearish trend shifts.
📌 Trade Logic & Conditions
🔹 Long Entry Conditions
A buy signal is triggered when all the following conditions are met:
✅ MACD crosses above 0, signaling bullish momentum.
✅ Volume oscillator is positive, confirming increased trading activity.
✅ Current volume is at least 50% of the previous candle’s volume, ensuring market participation.
🔻 Short Entry Conditions
A sell signal is generated when:
✅ MACD crosses below 0, indicating bearish momentum.
✅ Volume oscillator is positive, ensuring market activity is sufficient.
✅ Current volume is less than 50% of the previous candle’s volume, showing decreasing participation.
This multi-factor approach filters out weak or false signals, ensuring that trades align with both momentum and volume dynamics.
📏 Position Sizing & Leverage
Dynamic Position Calculation:
Qty = strategy.equity × leverage / close price
Leverage: Customizable (default = 1x), allowing traders to adjust risk exposure.
Adaptive Sizing: The strategy scales position sizes based on account equity and market price.
Slippage & Commission: Built-in slippage (2 points) and commission (0.01%) settings provide realistic backtesting results.
This ensures efficient capital allocation, preventing overexposure in volatile conditions.
🎯 Trade Management & Exits
Take Profit & Stop Loss Mechanism
Each position includes predefined profit and loss targets:
Take Profit: +10% of risk amount.
Stop Loss: Fixed at 10,100 points.
The risk-reward ratio remains balanced, aiming for controlled drawdowns while maximizing trade potential.
Visual Trade Tracking
To improve trade analysis, the strategy includes:
📌 Trade Markers:
"Buy" label when a long position opens.
"Close" label when a position exits.
📌 Trade History Boxes:
Green for profitable trades.
Red for losing trades.
📌 Horizontal Trade Lines:
Shows entry and exit prices.
Helps identify trend movements over multiple trades.
This structured visualization allows traders to analyze past performance directly on the chart.
⚡ How to Use This Strategy
1️⃣ Apply the script to a XAUUSD (Gold) 15m chart in TradingView.
2️⃣ Adjust leverage settings as needed.
3️⃣ Enable backtesting to assess past performance.
4️⃣ Monitor volume and MACD conditions to understand trade triggers.
5️⃣ Use the visual trade markers to review historical performance.
The MACD Volume Strategy is designed for short-term trading, aiming to capture momentum-driven opportunities while filtering out weak signals using volume confirmation.

NLS - 52W High Screener (3, 5, 7 Days)This indicator automatically detects stocks that have reached a new 52-week high within the last 3, 5, or 7 days. Perfect for traders looking for breakouts and strong momentum stocks!
📊 Features:
✅ Identifies new 52-week highs within the last 3, 5, or 7 days
✅ Fully Screener-compatible – Easily filter stocks in the TradingView Screener
✅ Plots the 52-week high as a blue line in the chart for better visualization
✅ Built-in alerts to notify you when a new 52W high is reached
✅ Optimized for the 1D (daily) timeframe
🛠️ How to Use in the Screener:
1️⃣ Add & activate the indicator
2️⃣ Open the TradingView Screener
3️⃣ Filter using one of these columns:
Screener 52W High Last 3 Days
Screener 52W High Last 5 Days
Screener 52W High Last 7 Days
4️⃣ Set the filter to "is true" to see relevant stocks
📢 Alerts:
Get notified when a stock reaches a new 52-week high in the last 3, 5, or 7 days!
🔍 Ideal for:
✔ Trend-following & breakout traders 🚀
✔ Swing traders looking for strong stocks 📈
✔ Screener users searching for momentum setups

TradFi Fundamentals: Enhanced Macroeconomic Momentum Trading Introduction
The "Enhanced Momentum with Advanced Normalization and Smoothing" indicator is a tool that combines traditional price momentum with a broad range of macroeconomic factors. I introduced the basic version from a research paper in my last script. This one leverages not only the price action of a security but also incorporates key economic data—such as GDP, inflation, unemployment, interest rates, consumer confidence, industrial production, and market volatility (VIX)—to create a comprehensive, normalized momentum score.
Previous indicator
Explanation
In plain terms, the indicator calculates a raw momentum value based on the change in price over a defined lookback period. It then normalizes this momentum, along with several economic indicators, using a method chosen by the user (options include simple, exponential, or weighted moving averages, as well as a median absolute deviation (MAD) approach). Each normalized component is assigned a weight reflecting its relative importance, and these weighted values are summed to produce an overall momentum score.
To reduce noise, the combined momentum score can be further smoothed using a user-selected method.
Signals
For generating trade signals, the indicator offers two modes:
Zero Cross Mode: Signals occur when the smoothed momentum line crosses the zero threshold.
Zone Mode: Overbought and oversold boundaries (which are user defined) provide signals when the momentum line crosses these preset limits.
Definition of the Settings
Price Momentum Settings:
Price Momentum Lookback: The number of days used to compute the percentage change in price (default 50 days).
Normalization Period (Price Momentum): The period over which the price momentum is normalized (default 200 days).
Economic Data Settings:
Normalization Period (Economic Data): The period used to normalize all economic indicators (default 200 days).
Normalization Method: Choose among SMA, EMA, WMA, or MAD to standardize both price and economic data. If MAD is chosen, a multiplier factor is applied (default is 1.4826).
Smoothing Options:
Apply Smoothing: A toggle to enable further smoothing of the combined momentum score.
Smoothing Period & Method: Define the period and type (SMA, EMA, or WMA) used to smooth the final momentum score.
Signal Generation Settings:
Signal Mode: Select whether signals are based on a zero-line crossover or by crossing user-defined overbought/oversold (OB/OS) zones.
OB/OS Zones: Define the upper and lower boundaries (default upper zones at 1.0 and 2.0, lower zones at -1.0 and -2.0) for zone-based signals.
Weights:
Each component (price momentum, GDP, inflation, unemployment, interest rates, consumer confidence, industrial production, and VIX) has an associated weight that determines its contribution to the overall score. These can be adjusted to reflect different market views or risk preferences.
Visual Aspects
The indicator plots the smoothed combined momentum score as a continuous blue line against a dotted zero-line reference. If the Zone signal mode is selected, the indicator also displays the upper and lower OB/OS boundaries as horizontal lines (red for overbought and green for oversold). Buy and sell signals are marked by small labels ("B" for buy and "S" for sell) that appear at the bottom or top of the chart when the score crosses the defined thresholds, allowing traders to quickly identify potential entry or exit points.
Conclusion
This enhanced indicator provides traders with a robust approach to momentum trading by integrating traditional price-based signals with a suite of macroeconomic indicators. Its normalization and smoothing techniques help reduce noise and mitigate the effects of outliers, while the flexible signal generation modes offer multiple ways to interpret market conditions. Overall, this tool is designed to deliver a more nuanced perspective on market momentum.

ZenAlgo - QZenAlgo - Q
Description
ZenAlgo - Q is an oscillator based on the QQE (Quantitative Qualitative Estimation) method. This version incorporates refinements for additional visualization and interpretation options. It is designed to help traders observe momentum changes and divergence patterns in price movements.
Key Features
QQE-Based Calculation : Derived from the open-source QQE script by Glaz (Metastock Version of QQE), with modifications for alternative visualization.
Dual RSI-Based Analysis : Uses two RSI calculations to provide additional context on price movements.
Adaptive Trend Bands : Adjust dynamically based on the market conditions.
Divergence Identification : Highlights potential differences between price action and oscillator movement.
Dynamic Color Coding : Displays histogram bars to illustrate shifts in oscillator values.
Configurable Alerts : Enables notifications for specific oscillator conditions.
How It Works
The indicator calculates a smoothed RSI-based oscillator that tracks the relative strength of price movement. It applies an exponential moving average (EMA) smoothing to reduce noise while maintaining responsiveness.
Two adaptive bands are calculated using a variation of the QQE method, which helps define dynamic overbought and oversold conditions.
The histogram bars shift in color based on the position of the oscillator relative to the bands. Lighter shades indicate weaker momentum, while stronger momentum is represented by more saturated colors.
The script also includes a secondary RSI component, which provides an additional layer of analysis. This secondary RSI helps refine momentum trends by smoothing out short-term fluctuations.
Divergence identification is built-in, highlighting where price action deviates from oscillator readings. Bullish divergence occurs when price forms a lower low while the oscillator forms a higher low, and bearish divergence is identified when price forms a higher high while the oscillator forms a lower high.
The indicator does not generate buy or sell signals but instead provides contextual information that can be used alongside other trading strategies.
Use Cases
Trend Observation : Traders can use the histogram to observe whether momentum is strengthening or weakening over time. A shift in color can indicate a potential change in trend strength.
Divergence Analysis : By comparing oscillator divergence with price movement, traders can identify situations where price action may be losing momentum. Divergences do not guarantee reversals but can serve as an early warning to re-evaluate positions.
Momentum Tracking : The dual RSI structure allows users to monitor both short-term and long-term momentum. When both RSI components are aligned, it suggests a more stable trend, while divergence between them may indicate potential consolidation or trend shifts.
Supplementary Analysis : This indicator is best used as a supporting tool alongside volume-based or trend-following indicators. It helps visualize underlying price behavior but should not be used in isolation for decision-making.
Market Context Interpretation : The combination of adaptive bands and histogram visualization allows traders to assess how recent price action compares to historical movement, helping to place current conditions in a broader market context.
Attribution
This script is an adaptation of the open-source QQE script originally developed by Glaz. We acknowledge and appreciate the original author's work, which served as a foundation for our modifications.
Disclaimer
This indicator is intended for informational purposes only. It should not be interpreted as financial advice. Always conduct independent research and risk management before making trading decisions.

Multi timeframe RSIMulti-Timeframe RSI Indicator
This indicator displays the Relative Strength Index (RSI) from multiple timeframes—1 minute, 5 minutes, 15 minutes, and 30 minutes—on a single chart. Designed for intraday scalpers and short-term traders, it provides a comprehensive view of momentum across different timeframes, helping traders make more informed decisions.
✨ Why Use This Indicator?
✔ Enhanced Confirmation – Identify trends and momentum shifts with RSI signals from multiple timeframes.
✔ Perfect for Scalping & Intraday Trading – Quickly spot overbought/oversold conditions across different timeframes.
✔ Multi-Timeframe Confluence – Align entries and exits with stronger confirmation by analyzing RSI across short-term charts.
✔ Customizable & Easy to Use – Adjust RSI settings to suit your trading style.
This is a must-have tool for traders looking to refine their entries and exits with a multi-timeframe perspective! 🚀

Squeeze Momentum Indicator with Entry Tactics### **Squeeze Momentum Indicator with Stacked EMAs**
#### **Description:**
This indicator is an enhanced version of the **Squeeze Momentum Indicator** (originally by John Carter and later modified by LazyBear). It identifies **periods of consolidation (squeeze)** and signals potential **explosive price moves** when momentum shifts. The added **stacked EMA concept** further refines entry signals by confirming trend strength. This is also an update to version 6 of PineScript
#### **How to Use:**
The indicator provides **three different entry tactics**, allowing traders to choose signals based on their strategy:
1. **Inside Day Pattern** – Detects inside candles, which indicate potential breakouts when volatility contracts.
2. **Consecutive Black Crosses (Squeeze Signal)** – A certain number of black crosses (low volatility periods) suggests a strong move is coming.
3. **Stacked EMA Concept** – When the **8 EMA > 21 EMA > 34 EMA**, combined with a momentum shift from negative to positive, it signals a **high-probability bullish entry**.
#### **Visual Cues:**
- **Histogram Bars**: Show momentum (green for increasing bullish, red for increasing bearish).
- **Black & Gray Dots**: Represent different squeeze states (low volatility vs. breakout conditions).
- **🔥 Bullish Label**: Appears when the stacked EMAs align and momentum shifts from negative to positive.
#### **Best Practices:**
- Look for **momentum shifts during a squeeze** for high-probability trades.
- Use **stacked EMAs as trend confirmation** before entering.
- Combine with **price action and volume analysis** for additional confluence.
This indicator helps traders **anticipate major price moves** rather than react, making it a powerful tool for trend-following and breakout strategies. 🚀

Candle Bias ForecastCandle Bias Forecast Indicator
Description:
The Candle Bias Forecast Indicator is an original multi‐timeframe analysis tool that generates price forecast levels based on the difference between candle biases on two different timeframes. It uses innovative calculations to provide potential forecast levels that align with current price action.
How It Works:
1. Candle Bias Calculation:
For each candle, the indicator computes a “candle bias” using the formula:
candleBias = (((open + close)/2 - (high + low)/2) + ((close - open)/(high - low)))/2
This measure captures both the positioning of the candle’s body within its range and the normalized move from open to close.
2. Multi-Timeframe Analysis:
The script uses multiple timeframe pairs (e.g., 5-minute vs. 30-minute, 10-minute vs. 60-minute, etc.). For each pair, the bias is computed on the lower timeframe and on the higher timeframe.
3. Normalization with ATR:
To translate the dimensionless bias difference into price terms, the indicator multiplies the difference by the lower timeframe’s Average True Range (ATR). This scales the forecast adjustment to current market volatility.
4. Forecast Computation:
The forecast level for each pair is then calculated as:
forecast = close + (lowerTF_ATR * (lowerTF_bias - higherTF_bias))
This yields forecast levels that are plotted on the chart and connected by lines for a visual guide.
How to Use:
- Visual Confirmation: Add the indicator to your 1 to 15 minute chart to see forecast levels overlaid on the price.
- Supplementary Analysis: Use these forecast levels as an additional tool alongside your other analysis methods. They can help indicate potential support/resistance areas or directional bias.
Important Notes:
- Not a Standalone Signal: This indicator is intended to supplement your analysis. Always combine it with other tools and sound risk management practices.
- For Educational & Research Use: The indicator is provided “as is” without any guarantee of performance. It is designed to illustrate an innovative approach to multi-timeframe analysis.
- Disclaimer: Past performance is not indicative of future results. Use this tool at your own risk.
By combining candle bias with ATR-based normalization and multi-timeframe analysis, this indicator offers a unique perspective on market dynamics that can enrich your trading strategy.
---
*This is an original script designed to add value to the TradingView community. Please test and validate its outputs thoroughly before using it in live trading.*

Normalized RSI Oscillator with DivergencesNormalized RSI with Divergences {A Next-Level Trading Tool}
The Normalized RSI with Divergences indicator is a powerful and innovative tool designed to enhance your trading precision. By normalizing the Relative Strength Index (RSI) and detecting divergences between the standard and normalized RSI, this script helps traders identify potential trend reversals and continuations with remarkable clarity.
Key Features
🔹 Advanced RSI Normalization
• Transforms the traditional RSI into a normalized range of , making overbought and oversold conditions more intuitive.
• Utilizes a dynamic lookback period to adapt to market conditions.
🔹 Divergence Detection for Smarter Trading
• Identifies Bullish, Hidden Bullish, Bearish, and Hidden Bearish divergences by analyzing RSI pivot points.
• Provides early signals of trend reversals and continuations for better trade execution.
🔹 Clear & Visual Trade Signals
• Divergences are automatically labeled on the chart:
o Bullish Divergence: 🟢 “Bull” (Green) – Possible upward reversal.
o Hidden Bullish Divergence: 🟢 “Hid.” (Lime) – Continuation of an uptrend.
o Bearish Divergence: 🔴 “Bear” (Red) – Possible downward reversal.
o Hidden Bearish Divergence: 🟠 “Hid.” (Orange) – Continuation of a downtrend.
🔹 Fully Customizable Inputs
• Adjust RSI period, normalization lookback, and divergence parameters to fit your strategy.
• Tailor the indicator to your preferred trading style and market conditions.
________________________________________
How It Works
🔹 RSI Normalization Formula:
Norm=2×(RSI−MinMax−Min)−1\text{Norm} = 2 \times \left(\frac{\text{RSI} - \text{Min}}{\text{Max} - \text{Min}}\right) - 1Norm=2×(Max−MinRSI−Min)−1
• Min & Max represent the lowest and highest RSI values over the selected lookback period.
🔹 Divergence Detection Process:
• Identifies pivot points in both the normalized RSI and the standard RSI.
• Compares their directions to detect potential trading signals.
🔹 Real-Time Chart Labeling:
• Uses label.new to visually highlight divergence points for quick and efficient decision-making.
________________________________________
Input Parameters
• Source: Price source for RSI calculation (Default: hlc3).
• Signal Period: RSI calculation period (Default: 50).
• Lookback Range: Normalization period (Default: 200, Max: 5000).
• Trend Length: Smoothing period for normalized RSI (Default: 5).
• Band Width: Center line & bands calculation period (Default: 34).
• Divergence Range: Lookback period for divergence detection (Default: 5).
________________________________________
How to Use
1. Add the script to your trading chart.
2. Customize the settings to match your trading approach.
3. Watch for divergence labels to identify potential market moves:
o 🟢 Bullish Divergence: Possible upward reversal.
o 🟢 Hidden Bullish Divergence: Continuation of an uptrend.
o 🔴 Bearish Divergence: Possible downward reversal.
o 🟠 Hidden Bearish Divergence: Continuation of a downtrend.
________________________________________
Why Use This Indicator?
✅ Enhanced RSI Analysis: Normalization simplifies overbought/oversold conditions.
✅ Crystal-Clear Divergence Signals: Instantly spot key trend shifts.
✅ Fully Customizable: Adjust settings for your specific strategy.
✅ Improve Trade Accuracy: Gain an edge with precise divergence detection.
________________________________________
⚠️ Disclaimer
This script is for educational and informational purposes only. It does not constitute financial advice. Always conduct thorough research and backtesting before using it in live trading.
📜 License
This script is released under the Mozilla Public License 2.0.
Enjoy the Normalized RSI with Divergences indicator, and happy trading! 🚀📈
— Kerem Ertem

TTC EMA Scalping Machine with RSI Filter and MACDTTC EMA Scalping Machine with RSI Filter and MACD
TTC EMA Scalping Machine with RSI Filter and MACD is a multi-layered technical analysis tool designed for traders looking to scalp the markets with a combination of trend-following and momentum-based indicators. This strategy leverages Exponential Moving Averages (EMAs) , Relative Strength Index (RSI) , MACD , and Volume Analysis to help traders identify high-probability entry points for short and long trades. The indicator can be used in multiple market conditions and is suited for both beginners and experienced traders looking for clear entry signals.
---
Key Features :
1. EMA-Based Trend Filtering :
- The indicator uses four Exponential Moving Averages (EMAs) with different periods:
- EMA 10 (Short-Term) : The fastest-moving average for detecting quick price movements.
- EMA 20 (Medium-Term) : A central trendline for market momentum.
- EMA 30 (Long-Term) : To observe broader market trends.
- EMA 50 (Longest-Term) : To identify the overall market direction.
- These EMAs are plotted on the chart and used to create EMA bands , visually displaying potential support and resistance levels. Price action inside these bands helps identify scalping opportunities.
2. RSI Filter :
- RSI (Relative Strength Index) is used to gauge overbought and oversold conditions in the market:
- Overbought condition (RSI > 70) : The market may be overextended, signaling the possibility of a short.
- Oversold condition (RSI < 30) : The market may be undervalued, signaling the possibility of a long.
- The RSI filter ensures that trades are not taken when the market is overextended, offering a more conservative approach to trade entries.
3. MACD Momentum Analysis :
- The MACD (Moving Average Convergence Divergence) indicator is included to confirm the trend and momentum direction:
- Long Condition : The MACD line crosses above the signal line, confirming a bullish momentum.
- Short Condition : The MACD line crosses below the signal line, confirming a bearish momentum.
- This serves as an additional filter to verify if the market momentum aligns with the long or short entry criteria.
4. Long Entry (Buy Signal) :
- A long entry signal is triggered when the following conditions are met:
- The price is above EMA 20 (indicating an overall bullish market).
- The price is within the green EMA band (EMA 10 and EMA 20), suggesting short-term support.
- The RSI is below 70 (indicating the market is not overbought).
- The MACD line is above the signal line , showing bullish momentum.
- These conditions combined suggest an ideal environment for entering a long position.
5. Short Entry (Sell Signal) :
- A short entry signal is triggered when the following conditions are met:
- The price is below EMA 20 (indicating an overall bearish market).
- The price is within the green EMA band (EMA 20 and EMA 30), suggesting short-term resistance.
- The RSI is above 30 (indicating the market is not oversold).
- The MACD line is below the signal line , showing bearish momentum.
- These conditions combined suggest an ideal environment for entering a short position.
6. Signal Alerts :
- Long Alerts : Users can set alerts to notify them when a long condition is met. These alerts are triggered when all the criteria for a long entry are satisfied.
- Short Alerts : Similarly, users can set alerts for short signals, notifying them when all the conditions for a short entry are satisfied.
7. EMA Bands :
- The EMA bands are visually represented with colored fills between the EMAs, providing a visual aid to recognize potential trading zones. These zones can serve as a reference for traders to make quick decisions regarding entries and exits.
8. Volume Filter :
- The indicator also includes a volume filter , which compares the current volume to its 20-period simple moving average. Higher volumes provide confirmation of price movement, which can indicate stronger potential for the trade.
---
How It Works :
- Long Trades : The indicator suggests a long position when the price is above the EMA 20, within the green EMA band, the RSI is not overbought, and MACD confirms bullish momentum (MACD line above the signal line).
- Short Trades : The indicator suggests a short position when the price is below the EMA 20, within the green EMA band, the RSI is not oversold, and MACD confirms bearish momentum (MACD line below the signal line).
- Volume Confirmation : The indicator uses a volume-based filter to ensure the trade is backed by sufficient market participation.
---
Usage :
- Best for Scalping : This strategy is designed for short-term trades ( scalping ) and can be applied to any time frame, though it works best on intraday charts, such as 5-minute or 15-minute charts.
- Ideal for Trend-Following : With the use of EMAs and MACD, the strategy is best suited for markets that exhibit clear trends. It helps to avoid whipsaw trades and focuses on capturing medium-term trends.
- Risk Management : By using RSI, MACD, and volume analysis together, this strategy reduces the likelihood of entering a trade in an overextended market, which helps with risk management.
---
Alerts and Signals :
- Long Signals : When all conditions are met for a long trade, a green label appears below the price bar, indicating a potential buy opportunity. An alert is also generated, notifying the user.
- Short Signals : When all conditions are met for a short trade, a red label appears above the price bar, indicating a potential sell opportunity. An alert is also generated, notifying the user.
---
This combination of EMA , RSI , MACD , and volume-based filters creates a balanced approach to scalping, ensuring that traders receive clear, actionable entry signals with trend confirmation, while avoiding overbought and oversold conditions that may lead to false signals. The indicator is designed to help traders confidently identify high-probability trades while maintaining simplicity and clarity in its setup.

TradFi Fundamentals: Momentum Trading with Macroeconomic DataIntroduction
This indicator combines traditional price momentum with key macroeconomic data. By retrieving GDP, inflation, unemployment, and interest rates using security calls, the script automatically adapts to the latest economic data. The goal is to blend technical analysis with fundamental insights to generate a more robust momentum signal.
Original Research Paper by Mohit Apte, B. Tech Scholar, Department of Computer Science and Engineering, COEP Technological University, Pune, India
Link to paper
Explanation
Price Momentum Calculation:
The indicator computes price momentum as the percentage change in price over a configurable lookback period (default is 50 days). This raw momentum is then normalized using a rolling simple moving average and standard deviation over a defined period (default 200 days) to ensure comparability with the economic indicators.
Fetching and Normalizing Economic Data:
Instead of manually inputting economic values, the script uses TradingView’s security function to retrieve:
GDP from ticker "GDP"
Inflation (CPI) from ticker "USCCPI"
Unemployment rate from ticker "UNRATE"
Interest rates from ticker "USINTR"
Each series is normalized over a configurable normalization period (default 200 days) by subtracting its moving average and dividing by its standard deviation. This standardization converts each economic indicator into a z-score for direct integration into the momentum score.
Combined Momentum Score:
The normalized price momentum and economic indicators are each multiplied by user-defined weights (default: 50% price momentum, 20% GDP, and 10% each for inflation, unemployment, and interest rates). The weighted components are then summed to form a comprehensive momentum score. A horizontal zero line is plotted for reference.
Trading Signals:
Buy signals are generated when the combined momentum score crosses above zero, and sell signals occur when it crosses below zero. Visual markers are added to the chart to assist with trade timing, and alert conditions are provided for automated notifications.
Settings
Price Momentum Lookback: Defines the period (in days) used to compute the raw price momentum.
Normalization Period for Price Momentum: Sets the window over which the price momentum is normalized.
Normalization Period for Economic Data: Sets the window over which each macroeconomic series is normalized.
Weights: Adjust the influence of each component (price momentum, GDP, inflation, unemployment, and interest rate) on the overall momentum score.
Conclusion
This implementation leverages TradingView’s economic data feeds to integrate real-time macroeconomic data into a momentum trading strategy. By normalizing and weighting both technical and economic inputs, the indicator offers traders a more holistic view of market conditions. The enhanced momentum signal provides additional context to traditional momentum analysis, potentially leading to more informed trading decisions and improved risk management.
The next script I release will be an improved version of this that I have added my own flavor to, improving the signals.
