High Frequency Day Trading IndicatorMentioned Indicator uses RSI, Stoch RSI, SMA, EMA, SMMA, Double EMA to check for quick buying and selling areas for Day Trading.
For utilizing the tool, you'll need to wait for a Possible Trend Reversal (Represented by Triangle) and a confirmation to go Long by using a combination of Moving Averages which are then represented by circular dots on chart upon Bar Closure.
For Stop Loss once can simply place a Stop below/above the last Low/High respectively.
This trading Indicator is only recommended for high frequency trading on smaller time frames if you're using a highly volatile Coin/Asset Class.
Disclaimer: Please use this indicator in Test Environment to get a hold of concepts of this indicator. We do not advise using 100% capital for each order, as a matter of fact, we only recommend a risk of upto 1% on each position so Risk to Reward is maintained in proper sense. Please use Stops with all indicators and do not ever use an indicator without stop losses to save your capital.
NOTE: Indicator can be developed further to be used Trading Bots such as 3commas, Autoview, Wunderbit Bot, and Trailing Crypto Bots. For configuration of Automation Bots, you can contact us here on tradingview itself! :)
Kripto

Comparative Relative Strength for Crypto (USDT/USD)Comparative Relative Strength for Crypto (USDT/USD)
An adaption of the indicator as published by © bharatTrader->
Please visit the link for details as published by the original coder.
Configured for Crypto by presetting (per filter) for CIX100 usage - either in USDT (Kucoin) or USD (Capitolcom)
Hulk Strategy x35 Leverage 5m chart w/Alerts This strategy is a pullback strategy that utilizes 2 EMAs as a way of identifying trend, MACD as an entry signal, and RSI and ADX to filter bad trades. By using the confirmation of all of these indicators the strategy attempts to catch pullbacks, and it is optimized to wait for high probability setups. Take not that the strategy is optimized for use on BTCUSDT along with 35 times leverage(Using leverage is risky). The Hulk Strategy waits for strong trend confirmation and then attempts to identify pullbacks using MACD and RSI. By using these it identifies strong short term movement against the trend(hence the name Hulk). To use the strategy wait for the strategy to make an entry, and then enter with a stop loss of 1.1% and a take profit of 1.35% with respect to if it is a long or short position. The trade frequency of this strategy is high as it is made for use on the 5m timeframe. But this does not mean you will have to be staring at your computer constantly as an average of 1 trade takes place each day. This will vary a lot though, somedays the strategy enters up to 4 times. I wish you good trading and hope that you like this strategy!
P.S. The indicators on my chart are visualizations of the indicators used in the strategy, they are not necessary for the strategy to work though. Also the colored in cloud on the price chart is an EMA cloud and it comes with the strategy when you add it to your chart. This EMA cloud consists of two EMAs a 50 and a 200 EMA.

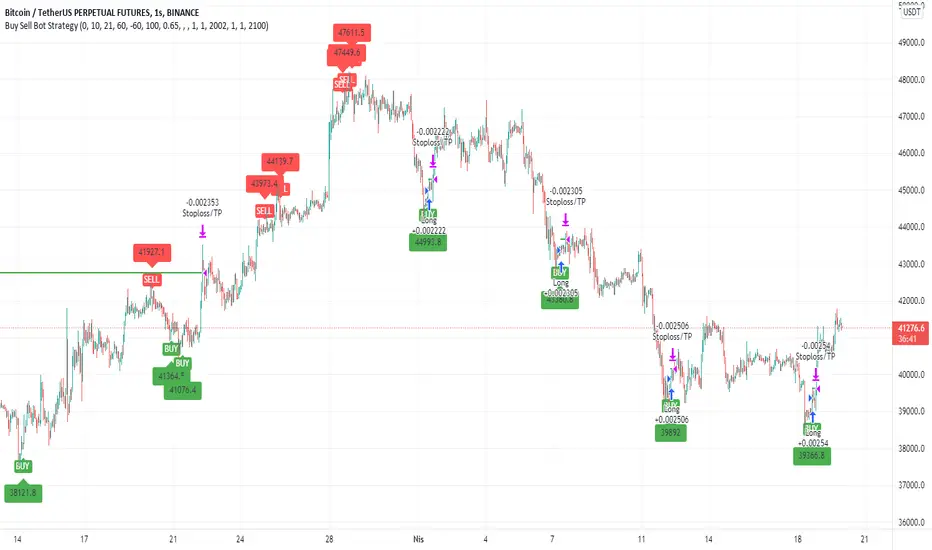
Buy Sell Bot StrategyHello Everyone,
In this strategy, I benefited from the values of RSI and wave trend indicators, which are the oldest and most used indicators in the market. I contributed to this bi-valued indicator myself with a bivariate formula. My variables are actually a simple intersection algorithm, the intersection of the wave trend indicator and the RSI indicators when they are oversold or overbought.
As you all know, we can send signals to bot sites via tradingview. You can use bot signals boxes in this strategy. You can analyze past transactions in the Date settings section. In the indicator settings section, you can change the settings of the overbought and oversold zones. Perhaps the most important feature here is the USE SELL SIGNALS section. I would like to emphasize this section in particular that when you mark the use sell signal section, the strategy will be processed in the buy section and will not be processed in the sell section. If you do not click on the USE SELL SIGNALS section, the strategy will be processed in the buy section, but this time it will be exited when the target in the take profit section is reached. THIS WAS IMPORTANT.
There is another important point here. Always in position and USE SELL SIGNALS sections do not work together. Run these two features one by one. It is a strategy that is constantly in operation through the name of the Always in position feature, I do not recommend it. The USE PERCENTAGE DECREASE feature, on the other hand, is the section where we want the share to drop as a percentage to enter the second trade after the first purchase is made in the settings section if you activate the pyramiding feature. You can use the tradingview help page for the pyramiding feature.
I found this strategy suitable to use in the 1-hour time frame in the crypto market and adjusted it that way. Of course, you can use it by changing the settings in stocks and in different time periods. big wins
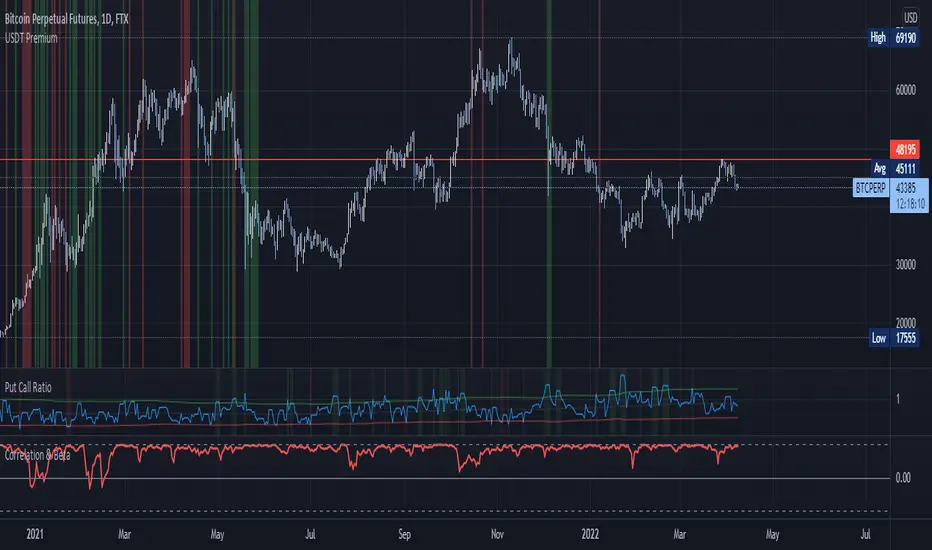
Premium IndexThis indicator shows the premium index data for the market (only crypto) you're currently looking at.
The premium index is the difference in price between the perpetual swap contract and the spot index price.
In plain and simple English: it shows whether the spot market for a specific coin is trading at a discount or at a premium.
This is official data from the exchange itself.
At the moment of publishing TradingView only has data for Binance.
So only use this indicator on Binance charts right now (USDT perps and BUSD perps).
Make sure you're looking at a perpetual swap contract, if you're looking at the spot market for example the indicator won't work.
Once TradingView adds more data like this I'll try to make sure that the logic of the code will also work for other markets.

4 EMA & 2 SMA Gen6Indicador hecho con mucho cariño para la comunidad de CRIPTO BUZZ.
Espero les sirva Mucho y puedan ahorrarse espacios de indicadores. Luis S. G6

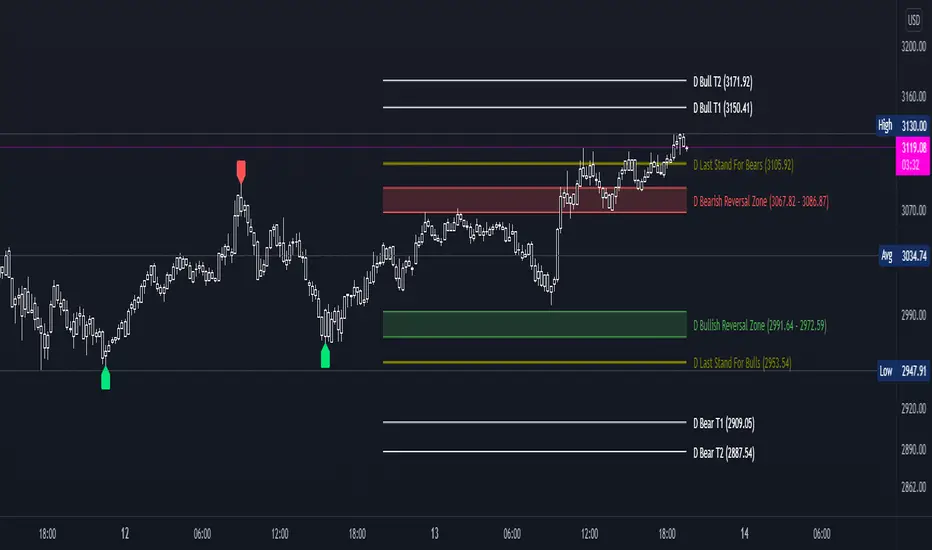
DDG PivotsDDG Pivots is an indicator that autonomously plots current reversal zones, areas of possible pivotal points for intraday trading, price targets, and true lows/highs.
This indicator will identify FINAL pivots (H/L) accurately, plotting either a green or red label to identify true lows/highs.
Once you are able to determine possible reversal areas and pivotal points, you will have a better idea on the current trend and whether these areas are respected/denied, after you can identify the correct trend, this indicator will then help by projecting predicted price targets on screen.
From entry to exit, this indicator helps ease your stress trading.
STOP STARING HOPELESSLY AT YOUR SCREEN, THIS INDICATOR HAS PUSH ALERTS FOR EACH OF THESE VITAL LEVLS.
*Turn on PUSH NOTIFICATIONS to alert you when these vital areas are touched*
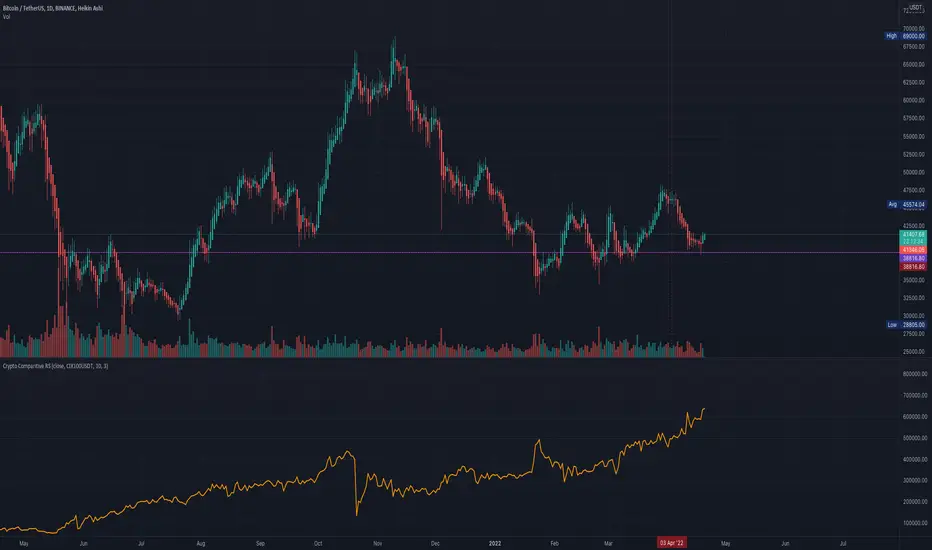
FieryTrading Long-Term Bitcoin Investor ToolDear community,
Today I want to present you one of my favorite scripts for long-term Bitcoin trading. I'm publishing this script because I think it will help traders to become more profitable in the long-term. Consequently, this script is targeted at long-term investors only, since it can take years before the price goes from the green area to the red area.
To use this script correctly you will need to use the BTCUSD index from Tradingview. Search "Bitcoin Index" in your symbol search bar, top result. Use daily candles on a logarithmic scale.
This scripts consists of two price bands, green and red. The green band has historically been a great area for the accumulation of BTC, whilst the red area has historically been a great area for exiting BTC. You could say that if the price is in (or below) the green bands BTC is undervalued, with the opposite being true for the red bands.
If you wish to add alerts to this script, simply click on the alert button > condition=Fierytrading BTC Tool. You can add alerts when the price enters the green area (Buy Area Cross) or red area (Sell Area Cross).
This simple script has historically proven to be very efficient at identifying bottoms (accumulation) and tops (distribution). Be aware that the usability of this script is not guaranteed in the future.

Trending Bollinger Bands by SiddWolfBollinger Bands are mostly used for trend reversal. I believe they should be used for Trend Continuation and Trend Confirmation.
In this Trending Bollinger Bands script you will see two bands drawn on chart. The Upper band is suggestive of Uptrend and Lower Band is suggestive of Downtrend Market. It just provides the guidance of where the market is now and where it is headed. It is not to be used as a standalone indicator. Use this to confirm your hypothesis of Uptrend or Downtrend.
Bollinger Bands Trend
When the price crosses the moving average it is interpreted as the price is gonna continue in that direction. But most of the time it is a fake breakout. With this script you get an additional confirmation so that you know it is not a fake breakout and the price have caught the trend.
Bollinger Bands Reversal:
This indicator can also work for reversal. For example when price closes outside the outer bands, it is most likely that the trend is gonna reverse. Don't just enter the trade wait for some other confirmation as reversal trading is more complicated.
Confluence:
Confluence is the key factor for profitable trading. Don't use this indicator as standalone indicator instead combine it with other indicators and price action. Like the divergence occurring when the price is outside the bands is suggestive of trend reversal. I have created a non-delay, non-repaint indicator for finding divergence. I'd soon publish that script. Stay tuned.
Settings is the Key:
Try to play around with the settings. It is a simple yet effective indicator. Change the moving average type or length. I've found moving average RMA or WMA works better than SMA. Find the best setting that works with your setup. Set the Band Source as High/Low to make the outer bands more extreme.
Conclusion:
This is my first script but it isn't my last. I've created quite a few gems that I'm gonna publish soon. If you have any questions or suggestions feel free to comment below. I'd love to connect with you. Thank you.

USDT/USD PremiumKraken + FTX USDT premium indicator.
Inspired by John J Brown, forked from IAmSatoshi (Migrated to V5 and few changes + more markets coming).
John J Brown: "
USDt premium/discount exist because of conversion fees.
It is a good market indicator:
If USDt>USD, then market is growing and in need of liquidity;
If USDt
RinarBottombuyRSI, VWMA, MA.
Altcon bottom signals.
buy
White background - bottom point
Yellow - Buy zone
White triangles - a signal to place orders
Sell
Red - sale
RU
RSI , VWMA , MA.
Сигналы дна альтконов.
Buy
Белый фон -точка дна
Желтый - Зона покупки
Белые треугольники - сигнал выставить ордера
Sell
Красный - продажа

SOPR Candles OscillatorThe Spent Output Profit Ratio (SOPR) is computed by dividing the realized value (in USD) divided by the value at creation (USD) of a spent output. Or simply: price sold / price paid. This metric was created by Renato Shirakashi.
The indicator provides insight into macro market sentiment, profitability and losses taken over a particular time-frame. It reflects the degree of realized profit for all coins moved on-chain.
SOPR is measured by taking the ratio between the fiat value at the time of UTXO creation, and the fiat value when the UTXO is spent.
In this indicator, I have essentially created an index that measures SOPR value on any given day. This is visually displayed as an oscillator.
SOPR values greater than 0 implies that the coins moved that day are, on average, selling at a profit (price sold is greater than the price paid).
SOPR value less than 0 implies that the coins moved that day are, on average, selling at a loss (price sold is less than the price paid).
You have the ability to see the SOPR of BTC , ETH and LTC. You can also smooth the SOPR using an EMA or SMA of your choice. I have added colored bars to the chart to make it easier to visualize SOPR and it's relation to price action.
Thank you to both TradingView and Glassnode for adding all the on-chain data.

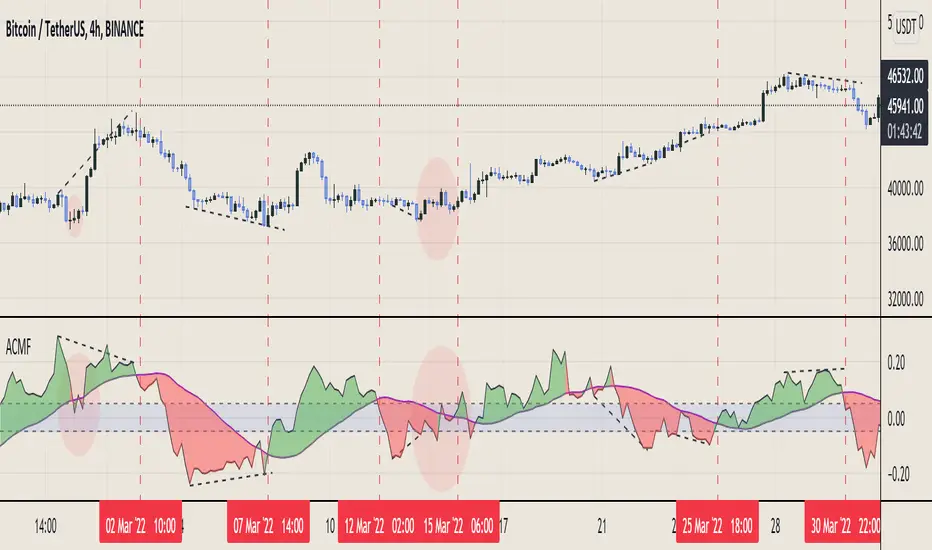
Aggregated Chaikin Money Flow - InFinitoModified Version of In-Built Chaikin Money Flow Indicator. Aggregated Volume is used for it's calculation + a couple of other features.
Aggregation code originally from Crypt0rus
***The indicator can be used for any coin/symbol to aggregate volume , but it has to be set up manually***
***The indicator can be used with specific symbol data only by disabling the aggregation option, which allows for it to be used on any symbol***
- Calculated based on Aggregated Volume instead of by symbol volume. Using aggregated data makes it more accurate and allows to compare volume flow between different kinds of markets (Spot, Futures , Perpetuals, Futures+Perpetuals and All Volume ).
- As well, in order to make the data as accurate as possible, the data from each exchange aggregated is normalized to report always in terms of 1 BTC. In case this indicator is used for another symbol, the calculations can be adjusted manually to make it always report data in terms of 1 contract/coin.
- Added Moving Average ( SMA , EMA , WMA , RMA, VWMA) that can be plotted to the CMF
- Changed 0 line to a small range which tends to be more relevant than the 0 line. This range can be manually modified
Things to look for:
- Divergences: Can be a very good reversal signal
- MA crossovers: Can be a very good confluent Buy/Sell signal
- Center range retests: CMF is normally defined as bullish above 0 and bearish below 0. In this case it is above or below the middle range. Even if the start of the move was missed. The retest of the middle range can give very good entries.
- Confluence of the latter
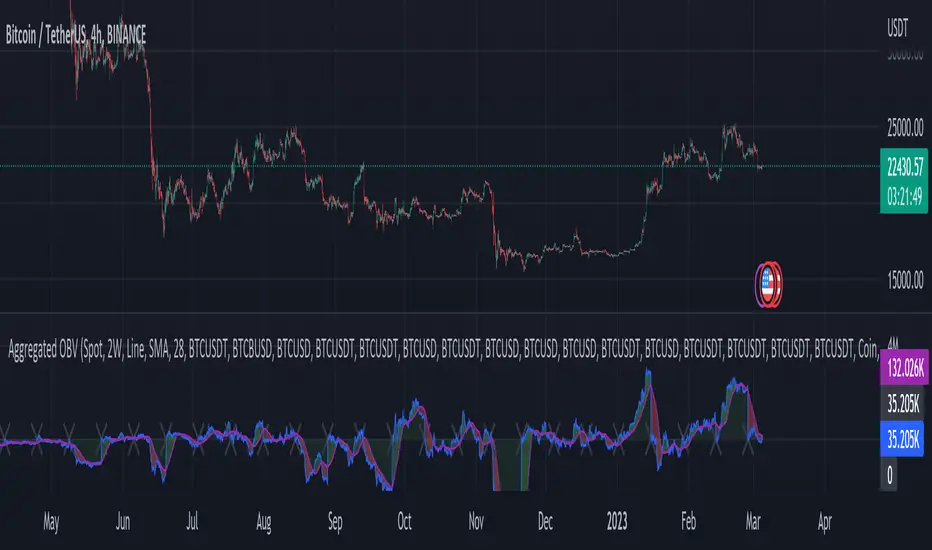
Aggregated On Balance Volume - InFinitoOn Balance Volume calculated with aggregated and normalized volume data and a few other features:
Aggregation code originally from Crypt0rus
Candle Plotting code from LonesomeTheBlue
***The indicator can be used for any coin/symbol to aggregate volume, but it has to be set up manually***
As normal OBV, this indicator can be used to find divergences and to have an idea of volume flow. Using aggregated data makes it more accurate and allows to compare volume flow between different kinds of markets (Spot, Futures, Perpetuals, Futures+Perpetuals and All Volume).
As well, in order to make the data as accurate as possible, the data from each exchange aggregated is normalized to report always in terms of 1 BTC. In case this indicator is used for another symbol, the calculations can be adjusted manually to make it always report data in terms of 1 contract/coin.
Extra features:
- Based off LonesomeTheBlue, OBV can be plotted as candles and as Heiken Aishi candles (which give wick information)
- A Moving Average (SMA, EMA, WMA, RMA, VWMA) can be plotted to the OBV. This can be used as a confluent signal to enter a trade on a crossover or to know the strength of the current move.
- The OBV basis can be reset to 0 periodically, making it more oscillator-like and allowing to focus only on a certain period of time.
Open InterestSimple indicator that shows the open interest of whatever crypto contract you're looking at in candlestick form.
If it doesn't show anything then Tradingview doesn't have the open interest data for that contract.
At the time of publishing there's data for Binance, Bitmex and Kraken.
You can change the colors in the settings.

Basic Binance Premium IndexA premium index indicator for Binance futures.
The premium index is based on the difference in price between the perpetual swap contract last price and the price of a volume weighted spot index.
Simply put: it shows you for each coin whether the spot market is trading higher than the Binance perpetual or not.
If future price is higher than spot in a rally, the rally isn't backed by real buys (spot) but by dumb perpetual longs which can indicate bearish PA. If spot price is higher than futures in a rally, the upside is backed by real money (spot) which can indicate bullish PA.
To calculate the premium, I simply took (futures_price/vwap(spot_price)-1)*100
This version includes
•BTC
•ETH
•LTC
•ICP
•BNB
•ADA
•DOGE.
You can display data as a smoothed moving average for improved readability.
This code is open source so feel free to use it in your scripts.

Bitcoin BanditIntroducing "Bitcoin Bandit".
The market beating trading algorithm for Bitcoin .
"Bitcoin Bandit" buys and sells based on three proprietary indicators:
• Futures contract data
• Accumulation areas and various moving averages.
• Bitcoin hash rate
The indicator is unique because it doesn't give significant weight to historical price to predict future price action; instead it uses BTC hash rate momentum and futures contract data from BTCUSDPERP (transformed through various internal processes) as proxies for sentiment to look for buy and sell zones, then uses accumulation of moving averages as supporting data for signal delivery.
The strategy was built on two years of Binance data and and backtested on five years of Bitcoin data (Coinbase: BTCUSD ).
Finally, the strategy was validated over multiple investment time frames (5 years, 2 years, 1 year) without prior parameter adjustment.
Strategy backtesting checks include:
• 0.60% trading commission fees (the highest possible).
• No Heiken-Ashi candles (to preserve accuracy)
• No Stop-Losses
• Market orders only
The results speak for themselves.
See the positive excess return from the “Bitcoin Bandit” strategy returns versus a simple Bitcoin “Buy-and-Hold” strategy. "Bitcoin Bandit" is designed to function only on the Daily time frame of the BTCUSD trading pair.
Does it Repaint?
• Our indicator does NOT repaint. Although while setting an alert it may pop up the repaint alert, please take into consideration that once a signal is fired on a "CLOSED BAR", the signals will never disappear, they do not repaint.
What Markets is it usable with?
• BTCUSD on the Daily timeframe .
• Bitcoin Bandit can be applied to any chart or altcoin, but results will be unpredictable as this indicator is designed specifically for Bitcoin trading.
How to use:
• Simply plug and play it to your chart. You can also connect TV alerts with a bot and let it run. Please be aware that SLIPPAGE time is important, If you run a bot on this indicator you HAVE to know that the buy/sell price will be on the bar AFTER the Candle close (For example: the BUY/SELL alert is on a candle, the buy/sell your bot or you will execute WILL be in the following candle depending on your trading system. Bitcoin Bandit only works on the Daily timeframe on the BTCUSD trading pair. Please contact us if you do not understand how to use it.
Disclaimer: Nothing stated is financial advice, and is purely for education purposes. We do not promise all trades are profitable, the use of this indicator is up to your own judgement and liability.

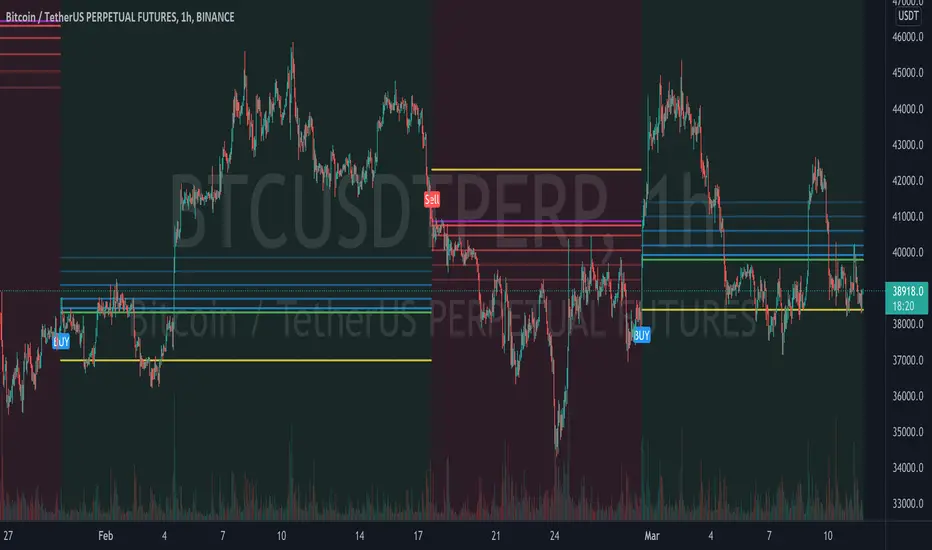
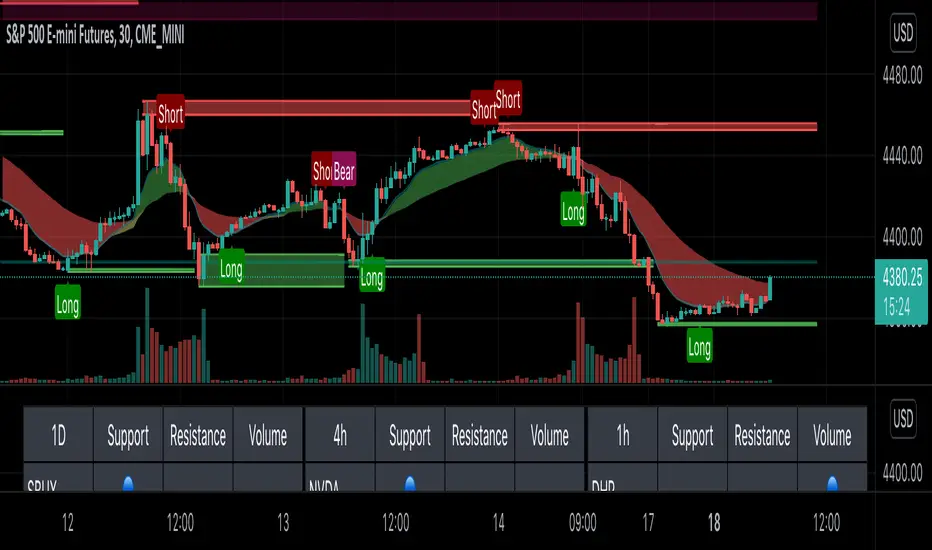
Clutch AlgoThe Clutch Algo provides reversal signals and trend signals. The indicator can be used for stocks, crypto and forex. It can also be used for day trading and swing trading.
Reversal signals were done by modifying the Bollinger Bands and MACD and combining them in a unique way to find explosive price actions. These have been modified to provide signals at the bottom or top of a trend to catch price reversals and to improve margin of safety on trades. These signals are labeled as “Long” and “Short”.
We also added automatic support and resistance zones to increase the accuracy of the “Long” and “Short” signals. This was done by using historical price action of highs and lows and periods of consolidation where price reversed.
The trend signals, which are labeled as “Bull” and “Bear” signals use a combination of exponential moving averages. These signals can be used as trend continuations.
We also added an exponential moving average cloud to help traders easily visualize trend. This can be used as a guide to help you stay in a trade to maximize profits. It can also be used as a guide to get out of a trade if price breaks out of the cloud. The third use of the cloud can be used as support resistance in between high/low support and resistance zones.
Tips:
- Only take long/short signals when there is a support or resistance zone formed at or near the long/short signal, preferably within 1-3 bars of the support or resistance zone. Signals too far from "Long" or "Short" signals reduces your margin of safety.
- When in a Long or Short position, use support or resistance zones as a stop loss level as price is likely to go against the position.
- When taking a Long/Short or Bull/Bear signal, wait for candles to be completed to get best entry possible.
- Previous support zones can be used as resistance zones and previous resistance zones can be used as support zones.
- The support and resistance (SR) period can be adjusted. Numbers in the SR settings are bars looking back. For example, a setting of 10, looks back 10 bars.
SuperTrend Multiple Risk Management SystemThis is an improved SuperTrend strategy that makes use of multiple types of risk management options.
We have for example :
1. Take profit and stop loss levels based on support and resistence created with RSI and Pivot Lines(dynamic)
For example, if we have an oversold level and a pivot low , we can take that low point for support.(or resistence for short)
If instead we have an overbought level and a pivot high, we can take that high point for resistence.(orsupport for short)
2. Take profit and stop loss levels based on swing low and swing high points calculated with highest high and lowest low function(dynamic)
For example we take the lowest point in the last 100 candles. We calculate the distance from the current point to that one, and we apply this value as a take profit point. Same for stop loss
3. Take profit and stop loss levels based on % movements(fixed)
For example we have a tp or sl of 10%. If either of them make a movement of 10% from the entry point, they will get triggered.
4. Break even stop loss once the asset moves certain % in our direction.
For example we have a long breakeven of 5%. If the asset moves 5% in our direction, we move the stop loss on the entry point so if the trade pullback and crosses with this point it will exit from the trade.
Notes:
All the exits from the strategy are happening at the end of the candle close, since we are checking if inside the current candle we cross with either high or low of the candles parts the set prices from any of the above options.
At the same time we can combine multiple of them into one, and we can either exit based on which one was hit first, or use a quantity reduction of the trade and exit multiple times when we hit any of the levels.
This tool is for educational purpose only.
Its main purpose is to show the difference between having a risk management or without.
For example on this scenario of BTC USD 4h, I found out that the drawdawn was reduced by more than half when using different type of risk management, compared to not use one at all, while at the same time increasing the profits by a huge margin.

WhaleCrew Crypto Open InterestUse Crypto Open Interest Data available on TradingView to your advantage.
Features
Auto-Detect Symbol (based on chart)
Preset Symbols (BTC, ETH, BNB, XRP, LUNA, ADA, SOL, AVAX and DOT)
Exchanges ( Binance and BitMex )
Inverse and USDT Pairs
Override Data Option to use any OI Data on TradingView
Customizable Candles

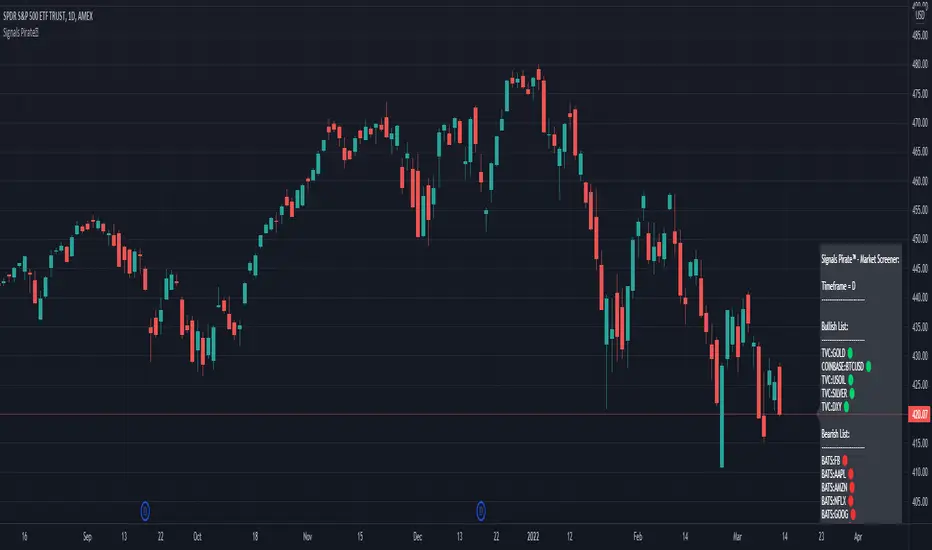
Signals Pirate™ Market ScreenerSignalsPirate™ Market Screener provides users with the ability to quickly and easily check the current trend of up to 40 different assets on any timeframe! With a simple ‘Bullish’ or ‘Bearish’ trend easily defined using accurate and reliable calculations, this tool could massively cut down the amount of time your TA takes!
The main Input options are 'Reactivity' and 'Depth', which allow for a dynamic trend following strategy that works on all time frames and assets. Using these values the strategy will print the bundles main ‘Buy’ and ‘Sell’ signals to try and identify the trend early and accurately. Their main functions are to dynamically calculate volatility and current trend direction – but we’ve gone more in-depth below!
Reactivity:
Reactivity controls how quickly the Algo reacts to changes in trend. This part of the bundle takes into account the Average True Range (ATR) to gauge current market volatility and direction of the trend. Lowering the reactivity value will generate quicker reaction times of the algorithm as it will lower the threshold of volatility required for a signal to be generated. Therefore, it’ll show trades more frequently.
Depth:
Depth controls the position of the signals according to the trend swing. Calculated using a variation of the Average Direction Index (ADX) to measure the changes in prices over a given period, when running parallel to the Reactivity volatility filter the trend can be identified quickly and accurately on any given time frame or asset. Higher Depth will allow for less frequent and slower entries. In contrast, lower Depth will give more frequent and earlier entries.
The default settings are the best settings we’ve found so far but you can change them to build your own unique trading strategy. We’d recommend experimenting with these values to find the best results for the asset you are trading, and your own personal trading and investing style.
Direction for use:
1. Use on any asset class and time frame and add the tickers of any asset you want included in the screener.
2. Fine tune the Reactivity (volatility) and Depth (trend sensitivity).
3. Consider longing assets that appear in the ‘Bullish List’ after candle close, and consider shorting assets that appear in the ‘Bearish List’ after candle close.
4. Exit positions once an asset has switched from one list to the other.
As mentioned previously, this Market Sceener uses a trend base system that dynamically operates to function with superior accuracy regardless of what you’re trading. But with the level of customisation available, this can easily be fine tuned to accommodate scalping, reversal trading, or even long term investing.
We hope you love this Screener, and it takes your trading and investing to the next level. Please let us know if you have any questions or queries regarding the logic behind the bundle, or if you have any suggestions for improvements etc. We love your feedback and are constantly striving to continuously improve!
Momentum CloudThis is a modified Ichimoku Cloud:
-The default Lookback-Length and Displacement settings have been modified to operate optimally on 24/7 markets - which is popular among Crypto analysts.
-The Lagging Span, Base Line, and Conversion Line have been removed - leaving just the bare cloud.
-Additionally, the Cloud's color will shift blue when it is compressed. (More specifically - when Leading Span A retreats to Leading Span B, the color changes.)
This allows the user to easily identify when the Cloud is "thinning", either to the upside, or the downside.
Being that the "spread" or "width" of an Ichimoku Cloud generally gauges it's efficacy as potential Support or Resistance, this tool is particularly useful for highlighting when momentum is weakening.
*This script will be updated in the future to allow the user to view the Momentum Cloud of alternate time-frames! (e.g, Viewing the 1D Momentum Cloud on the 1H timeframe)

customConfluenceSimplifiedThis indicator is intended to automatically search for confluence on a variety of indicators and conditions, highly customizable parameters, including Take profits, stop losses and classic indicator adjustments.
Best results in BTCUSDT 15m and 1H, but feel free to optimize it on any pair and timeframe. I don't recommend using it in non crypto assets.
Alerts are fully customizable too. You can put any alert() (buy/sell) to any pair.
I intended to maximize quality of signals over quantity. But anyway you can customize a lot of parameters to make it more frequent.
DM me for access.