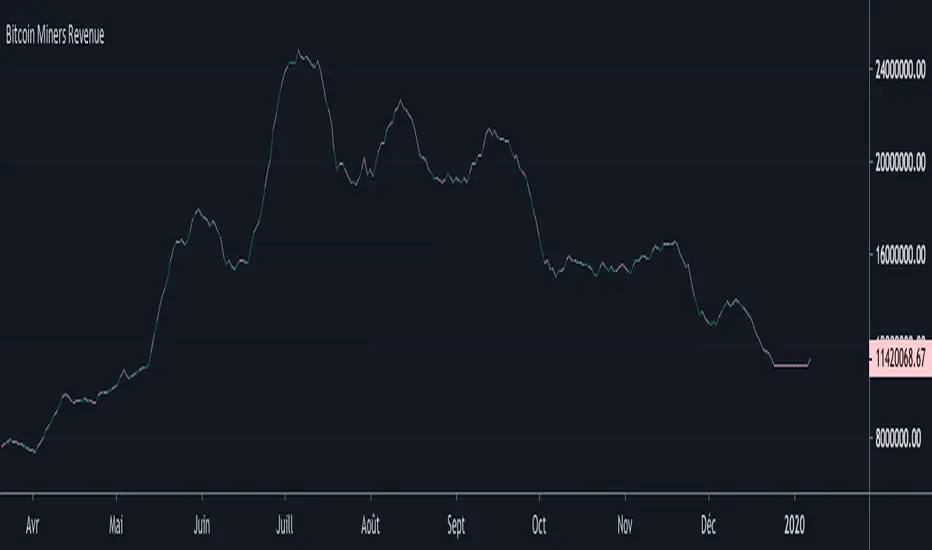
Bitcoin Miners RevenueHello everyone,
Bitcoin Miners Revenue Indicator :
Historical data showing (number of bitcoins mined per day + transaction fees) * market price.
Total value of coinbase block rewards and transaction fees paid to miner
Kripto
Bitcoin Cost Per TransactionHello,
An indicator for Bitcoin, to have the cost per transaction, on a 10 days average.

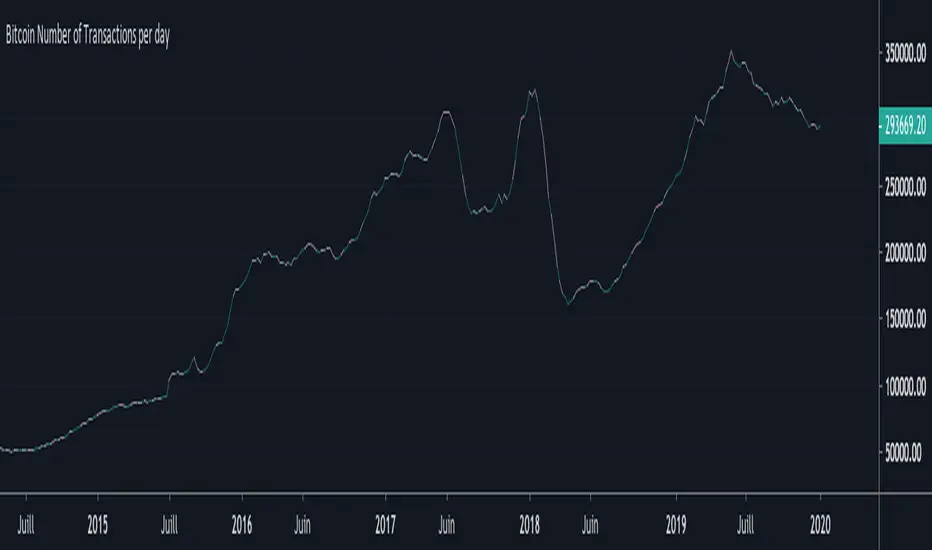
Bitcoin Number of Transactions per dayHello everyone,
Again an indicator for Bitcoin : the Number of Transactions / day.
Total number of unique bitcoin transactions per day
Precision : 10 DAYS AVERAGE
Bitcoin DifficultyHello everyone,
An other indicator for bitcoin : the difficulty
What is difficulty?
Difficulty is a measure of how difficult it is to find a hash below a given target.
The Bitcoin network has a global block difficulty. Valid blocks must have a hash below this target.
Mining pools also have a pool-specific share difficulty setting a lower limit for shares.

Bitcoin Hash RateHello everyone,
An interesting indicator for Bitcoin : the hash rate.
What is the Hash Rate ?
The estimated number of tera hashes per second (trillions of hashes per second) the Bitcoin network is performing.

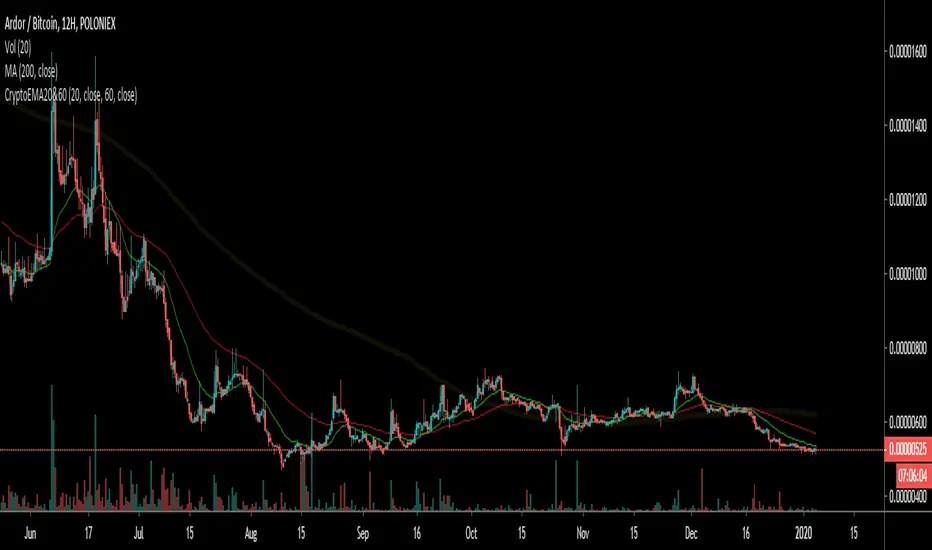
Crypto EMA 60/20Intended for use with Cryptocurrency Markets on the 12 hour time frame, the 60/20 exponential moving average frequency has proven successful for identifying trend bottom formations and for verifying head and shoulders top formations.
Combine the Crypto EMA 60/20 with classical RSI and MACD divergences to help verify impending reversals.
Useful for identifying trend changes in the frequency of four to six month price trends followed by a four to six week reversal, as historically found in cryptocurrency bull and bear markets.
This signal gets noisy if prices trend sideways for more than 30 days - consult daily views.
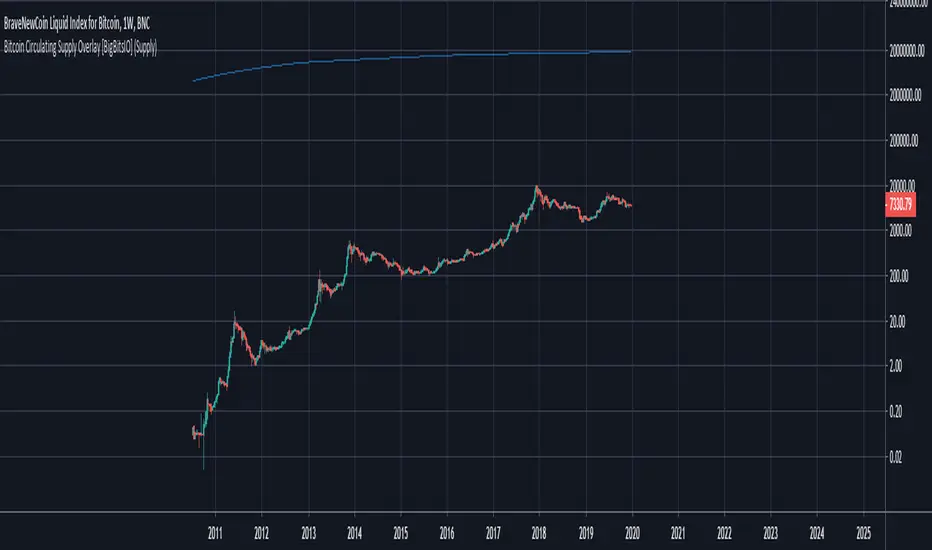
Bitcoin Circulating Supply Overlay [BigBitsIO]This script shows the estimated circulating supply of Bitcoin on any given day.
Features:
- Estimated Bitcoin circulating supply calculated daily
- Uses the Bitcoin reward schedule, past halving dates, and the next upcoming halving estimated date to calculate the current estimated supply.
- Optionally includes an option to use "Log Reduction" on the chart
*** DISCLAIMER: For educational and entertainment purposes only. Nothing in this content should be interpreted as financial advice or a recommendation to buy or sell any sort of security or investment including all types of crypto. DYOR, TYOB. ***
Bitfinex Spot vs Margin Volume - Multi-assetThe Bitfinex Spot vs Margin Volume - Multi-asset indicator was designed to help understanding how volume is composed between Spot and Margin transactions, considering all possible scenarios.
It provides valuable additional insight on how 'smarter money' is behaving in anticipation of possible upcoming moves, and can contribute to current analysis toolkits.
To request access, please send me a direct message.
Main features:
Spot vs. Margin insight for all margin-enabled Bitfinex pairs (dynamically detected from Chart).
Can be used on non-Bitfinex Charts which share same Ticker (eg. BTCUSD on Bitfinex or Bitstamp). Also dynamically detected.
Can be used in a separate pane (default) or added to main chart, as a standard volume indicator.
Shapes' meanings:
Colored bars represent scenario where maximum possible volume is attributed to Spot transactions (and its corresponding effect on Margin, if any).
Histograms (thin bars) represent scenario where maximum possible volume is attributed to Margin transactions (and its corresponding effect on Spot, if any).
When volume information leaves room for ambiguity, there will be a mismatch between maximums and minimums. Truth will be somewhere in the middle.
By default, Spot and Margin volumes are stacked up, as in traditional volume bar style.This can be disabled in Options - in which case Margin volumes are presented below zero line (this can facilitate some readings; see notes).
Standard volume for current chart's pair is presented in light gray, in the background. It helps seeing realtime volume and any surplus volume in relation to Bitfinex's.
Colors:
By default, Spot volume bars are colored in blue, but you can choose to use price closes to define them instead - as in traditional volume indicators.
You can also choose to invert Spot and Margin colors, so that Spot volumes are presented in higher contrast.
Margin volumes are, by default, colored based on whether Longs or Shorts were more relevant.
Direction attribution:
Default ratio threshold to define above-mentioned relevance is 1.1 (10%). (eg.: if Longs were greater than Shorts, Longs' volume must be at least 10% grater than Shorts' for direction of movement to be attributed to Longs). Direction then is defined based on winning side, plus whether openings or closings were dominant.
Threshold be configured from 1.01 to N. If ratio is below threshold, direction is considered neutral (yellow/orange colors).
Based on this assessment, label signals are presented at top area of chart, indicating whether opening(+) or closing(-) Longs or Shorts were the major responsibles for the move.
By default, to avoid much cluttering, labels are presented only for greater-than-average (ema 17) margin volumes. This can also be customized in Options.
Claim transactions:
Claim transactions are margin positions closed with traders' own existing assets being handed in to lenders. Thus, they do not impact order books -- and volume -- when executed.
Still, they are an additional, potentially valuable source of information, and the indicator is able to detect and report them.
Green triangle-like area shapes represent Longs closed with Claim transaction(s). Likewise, similar red shapes represent Shorts closed with Claim transactions.
This topic is explained in greater detail in this Bitfinex article .
Notes:
When using stacked up visualization, values in data window do not correspond to actual margin volumes. To see actual values, change to non-stacked up mode, and ignore negative sign.
The lower the time frame, the more precise it gets.
To request access, please send me a direct message.
For questions and feedbacks, please share them in comments section below.
Thank you, and best of success on your trades.

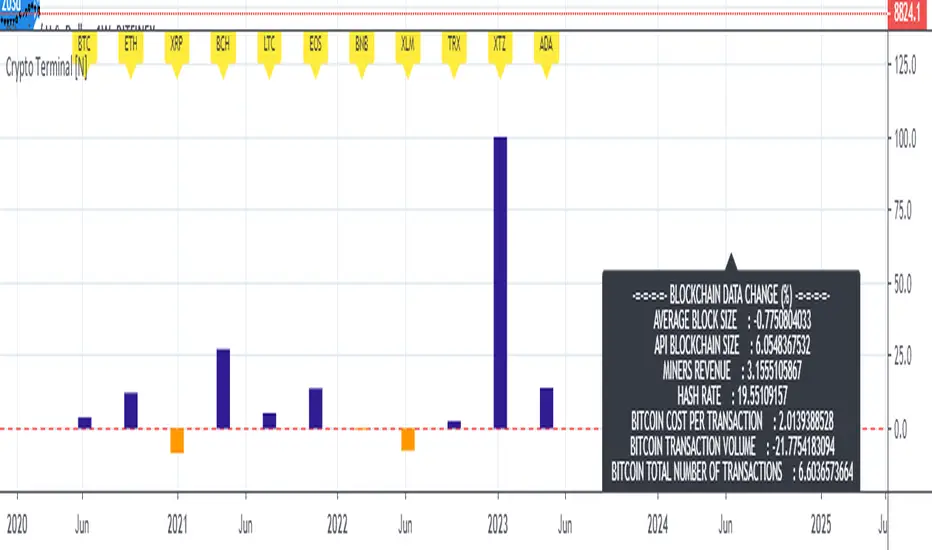
Live Mini Terminal 7 : Major Cryptocurrencies Change DataThis script displays relative data changes occurring in the adjustable period and/or adaptive automatic period in U.S Dollar based Major Cryptocurrencies.
This script was inspired by the data terminals used by commercial traders.
Period selection can be set in the menu.
This script uses the adaptive period algorithm used by Autonomous LSTM and Relativity scripts.
Or you can set the period manually from the menu.
For more information about adaptive period:
This script works only for 1 day (1D) and 1 week (1W) time frames.
Since usage of Blockchain Data, the most efficient time frame is 1 week (1W) .
Features
Value changes on a percentage basis (%)
The Info Panel contains percentage-based blockchain data changes.
CRYPTOCURRENCIES
BTC : Bitcoin
ETH : Ethereum
XRP : Ripple
BCH : Bitcoin Cash
LTC : Litecoin
EOS : EOS
BNB : Binance Coin
XLM : Stellar
TRX : Tron
XTZ : Tezos
ADA : Cardano
INFO PANEL
Average Blockchain Size change data
API Blockchain Size change data
Miners Revenue change data
Hash Rate change data
Bitcoin Cost Per Transaction change data
Bitcoin Transaction Volume change data
Bitcoin Total Number of Transactions change data
USAGE
The script can be used as an indicator by putting it under the chart as shown above.
It is necessary to enlarge to see clearly.
Since it is not often looked at,
such use is the best method for healthy interpretation.
Best regards.
Bitcoin Energy Value OscillatorBitcoin Energy Value as an oscillator against price.
Calculated as: (Bitcoin Price / Bitcoin Energy Value - 1) * 100


All Instrument Swing Trader with Pyramids, DCA and Leverage
Introduction
This is my most advanced Pine 4 script so far. It combines my range trader algorithms with my trend following pyramids all on a single interval. This script includes my beta tested DCA feature along with simulated leverage and buying power calculations. It has a twin study with several alerts. The features in this script allow you to experiment with different risk strategies and evaluate the approximate impact on your account capital. The script is flexible enough to run on instruments from different markets and at various bar intervals. This strategy can be run in three different modes: long, short and bidirectional. The bidirectional mode has two split modes (Ping Pong and BiDir). It also generates a summary report label with information not available in the TradingView Performance report such as Rate Of Return Standard Deviation and other Sharpe Ratio input values. Notable features include the following:
- Swing Trading Paradigm
- Uni or Bidirectional trading modes
- Calculation presets for Crypto, Stocks and Forex
- Conditional Minimum Profit
- Hard stop loss field
- Two types of DCA (Positive and Negative)
- Discretionary Pyramid levels with threshold adjustment and limiter
- Consecutive loss counter with preset and label
- Reentry loss limiter and trade entry caution fields
- Simulated Leverage and margin call warning label (approximation only)
- Buying power report labels (approximation only)
- Rate Of Return report with input values for Sharpe Ratio, Sortino and others
- Summary report label with real-time status indicators
- Trend follow bias modes (Its still range trading)
- Six anti-chop settings
- Single interval strategy to reduce repaint occurrence
This is a swing trading strategy so the behavior of this script is to buy on weakness and sell on strength. As such trade orders are placed in a counter direction to price pressure. What you will see on the chart is a short position on peaks and a long position on valleys. Just to be clear, the range as well as trends are merely illusions as the chart only receives prices. However, this script attempts to calculate pivot points from the price stream. Rising pivots are shorts and falling pivots are longs. I refer to pivots as a vertex in this script which adds structural components to the chart formation (point, sides and a base). When trading in “Ping Pong” mode long and short positions are intermingled continuously as long as there exists a detectable vertex. Unfortunately, this can work against your backtest profitability on long duration trends where prices continue in a single direction without pullback. I have designed various features in the script to compensate for this event. A well configured script should perform in a range bound market and minimize losses in a trend. For a range trader the trend is most certainly not your friend. I also have a trend following version of this script for those not interested in trading the range.
This script makes use of the TradingView pyramid feature accessible from the properties tab. Additional trades can be placed in the draw-down space increasing the position size and thereby increasing the profit or loss when the position finally closes. Each individual add on trade increases its order size as a multiple of its pyramid level. This makes it easy to comply with NFA FIFO Rule 2-43(b) if the trades are executed here in America. The inputs dialog box contains various settings to adjust where the add on trades show up, under what circumstances and how frequent if at all. Please be advised that pyramiding is an advanced feature and can wipe out your account capital if your not careful. You can use the “Performance Bond Leverage” feature to stress test your account capital with varying pyramid levels during the backtest. Use modest settings with realistic capital until you discover what you think you can handle. See the“Performance Bond Leverage” description for more information.
In addition to pyramiding this script employs DCA which enables users to experiment with loss recovery techniques. This is another advanced feature which can increase the order size on new trades in response to stopped out or winning streak trades. The script keeps track of debt incurred from losing trades. When the debt is recovered the order size returns to the base amount specified in the TV properties tab. The inputs for this feature include a limiter to prevent your account from depleting capital during runaway markets. The main difference between DCA and pyramids is that this implementation of DCA applies to new trades while pyramids affect open positions. DCA is a popular feature in crypto trading but can leave you with large “bags” if your not careful. In other markets, especially margin trading, you’ll need a well funded account and much experience.
To be sure pyramiding and dollar cost averaging is as close to gambling as you can get in respectable trading exchanges. However, if you are looking to compete in a Forex contest or want to add excitement to your trading life style those features could find a place in your strategies. Although your backtest may show spectacular gains don’t expect your live trading account to do the same. Every backtest has some measure to data mining bias. Please remember that.
This script is equipped with a consecutive loss counter. A limit field is provided in the report section of the input dialog box. This is a whole number value that, when specified, will generate a label on the chart when consecutive losses exceed the threshold. Every stop hit beyond this limit will be reported on a version 4 label above the bar where the stop is hit. Use the location of the labels along with the summary report tally to improve the adaptability of system. Don’t simply fit the chart. A good trading system should adapt to ever changing market conditions. On the study version the consecutive loss limit can be used to halt live trading on the broker side (managed manually).
This script can simulate leverage applied to your account capital. Basically, you want to know if the account capital you specified in the properties tab is sufficient to trade this script with the order size, pyramid and DCA parameters needed. TradingView does not halt trading when the account capital is depleted nor do you receive notification of such an event. Input the leverage you intend to trade with and simulate the stress on your account capital. When the check box labeled “Report Margin Call” is enabled a marker will plot on the chart at the location where the threshold was breached. Additionally, the Summary Report will indicated such a breach has occurred during the backtest. Please note that the margin calculation uses a performance bond contract model which is the same type of leverage applied to Forex accounts. This is not the same leverage as stock margin accounts since shares are not actually borrowed. It is also not applicable to futures contracts since we do not calculate maintenance margin. Also note that the account margin and buying power are calculated using the U.S. Dollar as a funding currency. Margin rules across the globe vary considerably so use this feature as an approximation. The “Report Margin Call” plot only appears on negative buying power which is well beyond the NFA enforced margin closeout price. Vary the order size and account capital and activate the buying power plot to get as close as you can to the desired margin call threshold. Also keep in mind that rollover fees, commissions, spreads, etc affect the margin call in actual live trading. This feature does not include any of those costs.
Inputs
The script input dialog box is divided into five sections. The last section, Section 5, contains all of the script reporting options. Notable reporting options are the inputs which provide support for calculating actual Sharpe Ratios and other risk / performance metrics. The TradingView performance report does not produce a scalable Sharpe Ratio which is unfortunate considering the limited data supplied to the backtest. Three report fields made available in this section are intended to enable users to measure the performance of this script using various industry standard risk metrics. In particular, The Sharpe Ratio, Sortino Ratio, Alpha Calculation, Beta Calculation, R-Squared and Monthly Standard Deviation. The following fields are dedicated to this effort:
– ROR Sample Period - Integer number which specifies the rate of return period. This number is a component of the Sharpe Ratio and determines the number of sample periods divisible in the chart data. The number specified here is the length of the period measured in bar intervals. Since the quantity of TradingView historical data is limited this number should reflect the scalar value applied to your Sharpe calculation. When the checkbox “Report Period ROR” is enabled red boxes plot on the dates corresponding to the ROR sample period. The red boxes display information useful in calculating various risk and performance models. Ongoing buying power is included in the period report which is especially useful in assessing the DCA stress on account capital. Important: When the “ROR Sample Period” is specified the script computes the ROR mean value and displays the result in the summary report label on the live end of the chart. Use this number to calculate the historical standard deviation of period returns.
– Return Mean Value - This is the ROR mean value which is displayed in the summary report field “ROR Mean”. Enter the value shown in the summary report here in order to calculate the standard deviation of returns. Once calculated the result is displayed in the summary report field “Standard Dev”. Please note that ROR and standard deviation are calculated on the quote currency of the chart and not the account currency. If you intend to calculate risk metrics based on other denominated returns use the period calculations in a spreadsheet. Important: Do not change the account denomination on the properties tab simply to force a dollar calculation. It will alter the backtest itself since the minimum profit, stop-loss and other variables are always measured in the quote currency of the chart.
– Report Period ROR - This checkbox is used to display the ROR period report which plots a red label above the bars corresponding to the ROR sample period. The sample period is defined by the value entered into the “ROR Sample Period” field. This checkbox only determines if the period labels plot on the chart. It does not enable or disable the ROR calculation itself. Please see input description“ROR Sample Period” for a detailed description of this feature.
Design
This script uses twelve indicators on a single time frame. The original trading algorithms are a port from a much larger program on another trading platform. I’ve converted some of the statistical functions to use standard indicators available on TradingView. The setups make heavy use of the Hull Moving Average in conjunction with EMAs that form the Bill Williams Alligator as described in his book “New Trading Dimensions” Chapter 3. Lag between the Hull and the EMAs form the basis of the entry and exit points. The vertices are calculated using one of five featured indicators. Each indicator is actually a composite of calculations which produce a distinct mean. This mathematical distinction enables the script to be useful on various instruments which belong to entirely different markets. In other words, at least one of these indicators should be able generate pivots on an arbitrarily selected instrument. Try each one to find the best fit.
The entire script is around 2200 lines of Pine code which pushes the limits of what can be created on this platform given the TradingView maximums for: local scopes, run-time duration and compile time. This script incorporates code from both my range trader and trend following published programs. Both have been in development for nearly two years and have been in beta test for the last several months. During the beta test of the range trading script it was discovered that by widening the stop and delaying the entry, add on trading opportunities appeared on the chart. I determined that by sacrificing a few minor features code space could be made available for pyramiding capability in the range trader. The module has been through several refactoring passes and makes extensive use of ternary statements. As such, It takes a full three minutes to compile after adding it to a chart. Please wait for the hovering dots to disappear before attempting to bring up the input dialog box. For the most part the same configuration settings for the range script can be applied to this script.
Inputs to the script use cone centric measurements in effort to avoid exposing adjustments to the various internal indicators. The goal was to keep the inputs relevant to the actual trade entry and exit locations as opposed to a series of MA input values and the like. As a result the strategy exposes over 70 inputs grouped into long or short sections. Inputs are available for the usual minimum profit and stop-loss as well as safeguards, trade frequency, pyramids, DCA, modes, presets, reports and lots of calibrations. The inputs are numerous, I know. Unfortunately, at this time, TradingView does not offer any other method to get data in the script. The usual initialization files such as cnf, cfg, ini, json and xml files are currently unsupported.
I have several example configuration settings that I use for my own trading. They include cryptocurrencies and forex instruments on various time frames.
Indicator Repainting and Anomalies
Indicator repainting is an industry wide problem which mainly occurs when you mix backtest data with real-time data. It doesn't matter which platform you use some form of this condition will manifest itself on your chart over time. The critical aspect being whether live trades on your broker’s account continue to match your TradingView study.
Based on my experience with Pine, most of the problems stem from TradingView’s implementation of multiple interval access. Whereas most platforms provide a separate bar series for each interval requested, the Pine language interleaves higher time frames with the primary chart interval. The problem is exacerbated by allowing a look-ahead parameter to the Security function. The goal of my repaint prevention is simply to ensure that my signal trading bias remains consistent between the strategy, study and broker. That being said this is what I’ve done address this issue in this script:
1. This script uses only 1 time frame. The chart interval.
2. Every entry and exit condition is evaluated on closed bars only.
3. No security functions are called to avoid a look-ahead possibility.
4. Every contributing factor specified in the TradingView wiki regarding this issue has been addressed.
5. Entry and exit setups are not reliant on crossover conditions.
6. I’ve run a 10 minute chart live for a week and compared it to the same chart periodically reloaded. The two charts were highly correlated with no instances of completely opposite real-time signals. I do have to say that there were differences in the location of some trades between the backtest and the study. But, I think mostly those differences are attributable to trading off closed bars in the study and the use of strategy functions in the backtest.
The study does indeed bring up the TV warning dialog. The only reason for this is because the script uses an EMA indicator which according to TradingView is due to “peculiarities of the algorithm”. I use the EMA for the Bill Williams Alligator so there is no way to remove it.
One issue that comes up when comparing the strategy with the study is that the strategy trades show on the chart one bar later than the study. This problem is due to the fact that “strategy.entry()” and “strategy_exit()” do not execute on the same bar called. The study, on the other hand, has no such limitation since there are no position routines.
Please be aware that the data source matters. Cryptocurrency has no central tick repository so each exchange supplies TradingView its feed. Even though it is the same symbol the quality of the data and subsequently the bars that are supplied to the chart varies with the exchange. This script will absolutely produce different results on different data feeds of the same symbol. Be sure to backtest this script on the same data you intend to receive alerts for. Any example settings I share with you will always have the exchange name used to generate the test results.
Usage
The following steps provide a very brief set of instructions that will get you started but will most certainly not produce the best backtest. A trading system that you are willing to risk your hard earned capital will require a well crafted configuration that involves time, expertise and clearly defined goals. As previously mentioned, I have several example configs that I use for my own trading that I can share with you. To get hands on experience in setting up your own symbol from scratch please follow the steps below.
The input dialog box contains over 70 inputs separated into five sections. Each section is identified as such with a makeshift separator input. There are three main areas that must to be configured: long side, short side and settings that apply to both. The rest of the inputs apply to pyramids, DCA, reporting and calibrations. The following steps address these three main areas only. You will need to get your backtest in the black before moving on to the more advanced features.
Step 1. Setup the Base currency and order size in the properties tab.
Step 2. Select the calculation presets in the Instrument Type field.
Step 3. Select “No Trade” in the Trading Mode field.
Step 4. Select the Histogram indicator from Section 2. You will be experimenting with different ones so it doesn’t matter which one you try first.
Step 5. Turn on Show Markers in Section 2.
Step 6. Go to the chart and checkout where the markers show up. Blue is up and red is down. Long trades show up along the red markers and short trades on the blue.
Step 7. Make adjustments to “Base To Vertex” and “Vertex To Base” net change and roc in Section 3. Use these fields to move the markers to where you want trades to be.
Step 8. Try a different indicator from Section 2 and repeat Step 7 until you find the best match for this instrument on this interval. This step is complete when the Vertex settings and indicator combination produce the most favorable results.
Step 9. Go to Section 3 and enable “Apply Red Base To Base Margin”.
Step 10. Go to Section 4 and enable “Apply Blue Base To Base Margin”.
Step 11. Go to Section 2 and adjust “Minimum Base To Base Blue” and “Minimum Base To Base Red”. Observe the chart and note where the markers move relative to each other. Markers further apart will produce less trades but will reduce cutoffs in “Ping Pong” mode.
Step 12. Return to Section 3 and 4 and turn off “Base To Base Margin” which was enabled in steps 9 and 10.
Step 13. Turn off Show Markers in Section 2.
Step 14. Put in your Minimum Profit and Stop Loss in the first section. This is in pips or currency basis points (chart right side scale). Percentage is not currently supported. This is a fixed value minimum profit and stop loss. Also note that the profit is taken as a conditional exit on a market order not a fixed limit. The actual profit taken will almost always be greater than the amount specified (due to the exit condition). The stop loss, on the other hand, is indeed a hard number which is executed by the TradingView broker simulator when the threshold is breached. On the study version, the stop is executed at the close of the bar.
Step 15. Return to step 3 and select a Trading Mode (Long, Short, BiDir, Ping Pong). If you are planning to trade bidirectionally its best to configure long first then short. Combine them with “BiDir” or “Ping Pong” after setting up both sides of the trade individually. The difference between “BiDir” and “Ping Pong” is that “Ping Pong” uses position reversal and can cut off opposing trades less than the specified minimum profit. As a result “Ping Pong” mode produces the greatest number of trades.
Step 16. Take a look at the chart. Trades should be showing along the markers plotted earlier.
Step 17. Make adjustments to the Vertex fields in Section 2 until the TradingView performance report is showing a profit. This includes the “Minimum Base To Base” fields. If a profit cannot be achieved move on to Step 18. Other adjustments may make a crucial difference.
Step 18. Improve the backtest profitability by adjusting the “Entry Net Change” and “Entry ROC” in Section 3 and 4.
Step 19. Enable the “Mandatory Snap” checkbox in Section 3 and 4 and adjust the “Snap Candle Delta” and “Snap Fractal Delta” in Section 2. This should reduce some chop producing unprofitable reversals.
Step 20. Increase the distance between opposing trades by adding an “Interleave Delta” in Sections 3 and 4. This is a floating point value which starts at 0.01 and typically does not exceed 2.0.
Step 21. Increase the distance between opposing trades even further by adding a “Decay Minimum Span” in Sections 3 and 4. This is an absolute value specified in the symbol’s quote currency (right side scale of the chart). This value is similar to the minimum profit and stop loss fields in Section 1.
Step 22. Improve the backtest profitability by adjusting the “Sparse Delta” in Section 3 and 4.
Step 23. Improve the backtest profitability by adjusting the “Chase Delta” in Section 3 and 4.
Step 24. Improve the backtest profitability by adjusting the “Adherence Delta” in Section 3 and 4. This field requires the “Adhere to Rising Trend” checkbox to be enabled.
Step 25. Try each checkbox in Section 3 and 4. See if it improves the backtest profitability. The “Caution Lackluster” checkbox only works when “Caution Mode” is enabled.
Step 26. Enable the reporting conditions in Section 5. Look for long runs of consecutive losses or high debt sequences. These are indications that your trading system cannot withstand sudden changes in market sentiment.
Step 27. Examine the chart and see that trades are being placed in accordance with your desired trading goals. This is an important step. If your desired model requires multiple trades per day then you should be seeing hundreds of trades on the chart. Alternatively, you may be looking to trade fewer steep peaks and deep valleys in which case you should see trades at major turning points. Don’t simply settle for what the backtest serves you. Work your configuration until the system aligns with your desired model. Try changing indicators and even intervals if you cannot reach your simulation goals. Generally speaking, the histogram and Candle indicators produce the most trades. The Macro indicator captures the tallest peaks and valleys.
Step 28. Apply the backtest settings to the study version and perform forward testing.
This script is open for beta testing. After successful beta test it will become a commercial application available by subscription only. I’ve invested quite a lot of time and effort into making this the best possible signal generator for all of the instruments I intend to trade. I certainly welcome any suggestions for improvements. Thank you all in advance.
One final note. I'm not a fan of having the Performance Overview (blue wedge) automatically show up at the end of the publish page since it could be misleading. On the EUR/USD backtest showing here I used a minimum profit of 65 pips, a stop of 120 pips, the candle indicator and a 5 pyramid max value. Also Mark Pyramid Levels (blue triangles) are enabled along with a 720 ROR Sample Period (red labels).

Squeeze Momentum Strategy based on Indicator [LazyBear][Bitduke]I improved Squeeze Momentum Indicator by LazyBear (momentum filter, changed data source to ohlc4) and transformed it into a strategy, adding a risk management system + ability to customize time frames for backtest.
Shortly about Squeeze Momentum Indicator:
This is a derivative of John Carter's "TTM Squeeze" volatility indicator, as discussed in his book "Mastering the Trade" (chapter 11).
Backtested on XBTUSD, ETHUSD (Bitmex). As you may notice it shows good results on 1h - 4h timeframes on these timeframes among these pairs. Relatively low drawdown ~ 12% (to date).

Bitcoin CoP - Overlay V1A good estimate of what it would cost in electricity to mine 1 whole bitcoin with your preferred mining equipment. The cost of production overlay allows to change a few ASIC related variables like hash rate, device wattage, and electrical cost by KW/h. Defaults are set for the Antminer S17 Pro, which hashes at 53 Th/s and consumes 2.1 KW at 7.5 cents a KW/h. The overlay also considers halvings and plots CoP in those events.
This overlay can include other business related costs via "Other Costs" as a percentage of electrical cost USD/KW.h. Keep that value to 0 if you don't want to include it in your overlay.
The bubbles in the chart example is when mining devices came online. Pretty interesting to see difficulty adjust as new hashrate is added to the network.

TRENDSPOTTERHi Guys,
So TrendSpotter uses multiple indicators to catch trend moves as they happen. All you have to do it follow the entries when 2 green or red arrows appear, you enter the move.
Basically it has a few rules.
1.I trade the 1 min time-frame
2.The background turns Red ( Short ) or Green ( Long ) when the stock is going that direction.
3. Wait until the Psar is under for Long and over for Short.
4. Wait until the second Green for Long or Red for Short Arrow to appear. You are getting in on the end of the first one.
Here's my profile on Tradingview.com with all the explanations of how to use it. It can be used for FOREX and CRYPTO also.
www.tradingview.com
Check out my videos to see it's not that complicated.
If you have any questions please contact me.
Thanks,
Enda

ZoneBand (@Mido_yuiya)Bollinger band is converted to EMA , and support and resistance bands are made into regions

BEST Mayer MultipleHello traders
I'm not a HODLer by any means. I know when to sell (or I think I know....) when an asset starts going against me too much.
Even if it's a "long-term" investment.
My mentor used to telling me this: "If a short-term trade becomes a long-term investment, then you're in for a hell of a ride".
I have no clue if Bitcoin/BTC will go back up or not - I don't even care because I'm an intraday trader.
What if BTC was actually a way to accumulate more fiat? Satoshi fooled us
I coded this Mayer Multiple according to the specifications below. By the way, I'm a big fan of Willy Woo. I've been monitoring all his work since I learned about crypto (10 minutes ago.... it's a joke come on)
charts.woobull.com
Scaling
To respect the Mayer's multiple model, I recommend to select the Logarithmic scaling as shown below
imgur.com
What Mayer's model says
Using the reference below, the model says we're in the oversold zone. But, we can be in that zone for months/years...
When a model says an asset could bounce in a 1000-7000 USD range... well... I don't know how I would be able to perform optimally with that insight. This is very subjective and not a recommendation.
Mayer's Multiple model reference
All the BEST
Dave

(13) Twists Swing/Day VS-478TWISTS adds a simple, but very effective twist to utilizing a multiple moving average crossover systems, enabling the effective and profitable trading of any stock, crypto or commodity. This enables trend, swing and day traders to dramatically improve their results over a similar, short-term simple, smoothed, exponential or weighted moving average crossover system.
Four distinct Laguerre filters are applied to the price, one fast, one medium one long and one very long. The default Laguerre settings are: Short = 0; Medium = 0.33, Long = 0.55 XLong = 0.77. The correlation between the length of time and the Laguerre output is adjustable in the format > inputs pane for this indicator and are referred to as gamma. The first three lengths produce two major bands or ribbons. During up trends the top band is filled with green and during down trends this top band will be filled with red. Obviously these bands or ribbons are twisting or flipping positions when the direction of the price trends change. Trading indicator dots are produced during both phases. Green dots for uptrends and red dots during down trends. During consolidation phases it is possible that there will be no dots produced because of the rule set applied to these Entry/hold and Exit/short indicator dots.
TWISTS is a triple moving average trading system using an advanced smoothing filter developed by John Ehlers. You can read about this dramatic advancement in moving averages in the following article: Time Warp -- Without Space Travel. You can find the link to this article on our site.
Access this Genie indicator for your Tradingview account, through our web site. (Links Below) This will provide you with additional educational information and reference articles, videos, input and setting options and trading strategies this indicator excels in.

Ultimate Gemstone‘’Ultimate Gemstone = best indicator to accurately predict price movement based on momentum’’
This indicator is combination of multiple indicators (RSI, Stoch, GM, Moving averages & CCI) works on all the trading assets and time frames. Accurately predicts top and bottoms ( tested on all major crypto's, stocks and forex).
Comes with 6 different presets with different calculations giving additional flexibility to the user.
"Instructions How To Use"
This indicator is based on four different moving lines depicting momentum; first line (Aqua) is a fast trend line, which reacts rapidly to existing price action, second line (Purple) is slower and takes more price action into account, while third line (Yellow) is the slowest and depicts overall trend. Additionally, CCI/EMA moving line with changing color's (red/green) acts as a another trend confirmation tool.
The three moving lines acts as support and resistance depending on there location to each other. Non-moving parts include fibonacci support and resistance (68.2 & 38.2) areas of the oscillator. Different caution (Red, Green dots & background flashes) settings based on GM indicator to help identify perfect buying and selling opportunities. Additionally, the oscillator has oversold, overbought, bullish and bearish control zones similar to RSI/Stoch oscillators. Similar to RSI/Stoch divergences and trendlines do also work on this oscillator. Other ways to use is Aqua line crossovers with the Purple line, giving hard buy/sell signals and Aqua(fast) line turning (angle change) indicating momentum is reversing.
Example 1: When faster moving line gets pulled into the medium and slower line (especially in the overbought territory of the oscillator) gives you indication to be prepared as most likely the price will go down. Perfectly called Bitcoin top in 2017.
Example 2: BTC bottom in dec2018 and start of new trend in feb2019
Example 3 BTC Top in june2019
Example 4 works across all time frames, Recent BTC price action from 6500 to 7700.
Example 5 LINKBTC daily

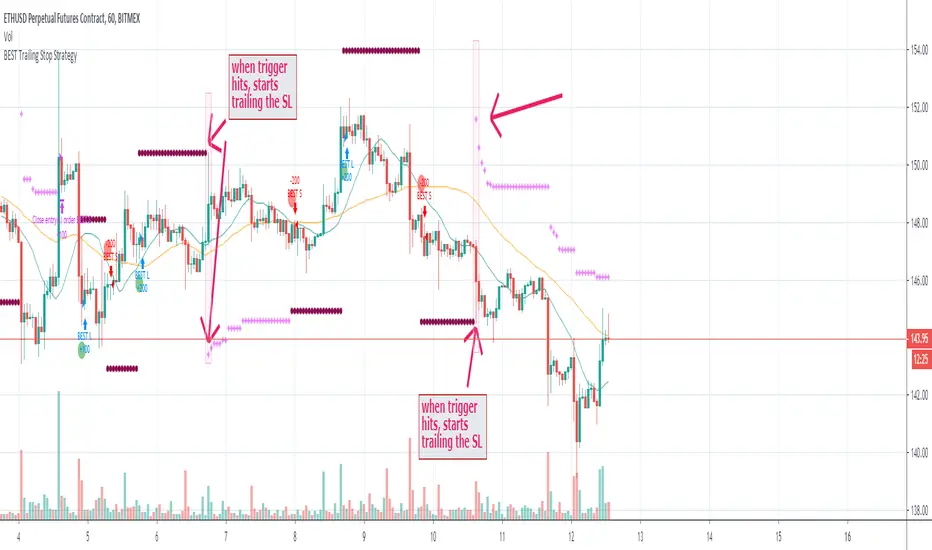
BEST Trailing Stop StrategyHello traders
Here we go again.... with the second strategy snippet.
Reminder: the first snipper was a Trailing Profit strategy script
What's on the menu?
A trailing stop is designed to protect gains by enabling a trade to remain open and continue to profit as long as the price is moving in the investor's favor.
The order closes the trade if the price changes direction by a specified percentage or dollar amount.
Trigger me I'm famous
I developed many trading strategies in my career and often I've been asked to trigger a trailing-stop once a certain % move has been made.
On the screenshot below, the SL trigger is plotted in maroon.
Once the price goes past that level for the first time, I'll start trailing the trailing stop level.
In other words, when we see a price makes an interesting move in percentage value - we decide to trail the stop for at least not losing any more
All the BEST
Dave
Crypto Daily-Weekly Range + KZsWeekly OHL + Daily OHL + Intraday Killzones
For markets that open the daily candle at 12AM UTC

Bitcoin Power Law CorridorOpen-source live tracker of Harold Burger's Bitcoin "Power Law Corridor".
Added optional chart fill and labels to show the percentage delta to the regression center-line, support and resistance.

BEST Cloud ALL MAHello traders
Hope you're all doing well
This script is a generic cloud generator using a pre-selected set of moving averages (I probably forgot a lot but listed all the ones I used at least once).
A cloud is a visual representation of the gap between two moving averages - it shows right away how big in that gap (=how far they are from each other)
The challenge is to find a cloud such as the price often stay stuck between those 2 MA - and when it's getting finally out (up or down), it would be strong enough to signal a beginning of a trend.
This is a cool intellectual challenge for all aspiring traders
For that script, I defined a trend according to how the 2 MAs are located relative to each other (MA1 > MA2 or MA1 < MA2) and if the price gets out of the cloud.
You'll get :
- the option to color the candles based on a trend
- cool triangles entry signals
- and alerts on those triangles
All the BEST
Dave
