Companion::InsurgentCompanion::Insurgent is a combined indicators strategy. Performances are pretty good on 1D, 4H and 1H timeframes and it can be used on Bitcoin and Altcoin markets.
Mainly, it is a trategy based on Ehlers formulas.
Used indicators:
- Ehlers Instantaneous Trend: trendline analysis;
- Ehlers Super Bandpass Filter: momentum detection;
- EMA: Long/Short time selector.
What the script does:
- determines trendlines combining mulitple indicators;
- automaticlally calculates Take profit and Stop Loss levels;
- permits automation generating Autoview signals (create an alert with {{strategy.order.alert_message}} in message text field to trap Autoview commands;
- supports for margin trading. Spot trading will be added in the future.
BACKTESTING
Backtest is not leveraged. Defaults are set as follow:
Capital: 10000
Percent of equity used for trades: 10%
Commission: 0.18% this is Bitfinex commission on orders
Change them accordingly on how you trade to get a more realistic backtest results.
Kripto

NYCOB Kill Zone StrategyI have now turned the NYCOB Kill zone into a stand alone strategy!
Fully customizable in regards to time of entry and levels of entry but the standard settings are the best all around.
Original NYCOB Kill Zone text below
This script plots the H and L of the first 2 hours of the NYC session and shades the space between in which i deem the NYC Order Block
It also maps out the First two hours on the chart as well so you can understand when the OB has formed
Over the past 3 years of trading cryptocurrency i have noticed a phenomena that has occurred nearly every day
The H or L will 90% of the time will be posted in the first two hours of this session
knowing this means you understand if you just wait til this time you can better your odds at not getting stop hunted due to poor entry
A few things to take from this study are these.
1. after the OB is formed
2. whichever side gets taken out first (H/L) will 90% define the bias for the day. I have found that using the m13-m15 TF will add some more confirmation with 1-2 closes outside of range H/L/
3. After general bias has formed 2 things can happen
A) PA just takes off and there is really nothing you can do about it unless you had other studies that told you that will happen
B) PA will dip back INTO the OB and create the OTE which is any retracement below the .5 Fibonacci of the shaded OB
4. Typically OTE happens after the session has ended
5. If you used OTE off of the past days NYCOB then you can use the new (forming or just formed) NYCOB to CONFIRM your initial bias presented from the previous days OTE and bias.
6. When PA cannot close outside the NYCOB it presents a range to range play where PA will visit the opposite side of the range to chase liquidity,
7. When the NYCOB is TIGHT then deviation is more likely to result in price expansion, when the NYCOB is WIDE then deviation tends to present more range to range plays.
8. After bias is formed and OTE has been made your stops should always be outside the NYCOB. I use the m30 or H1 ATR to get a slight cushion from the OB to ensure i dont get stop hunted.
Standard TP are all set at the same level but you can adjust them accordingly
Shout out to Elevate-Trading family member Boederzeng for helping me with the code!

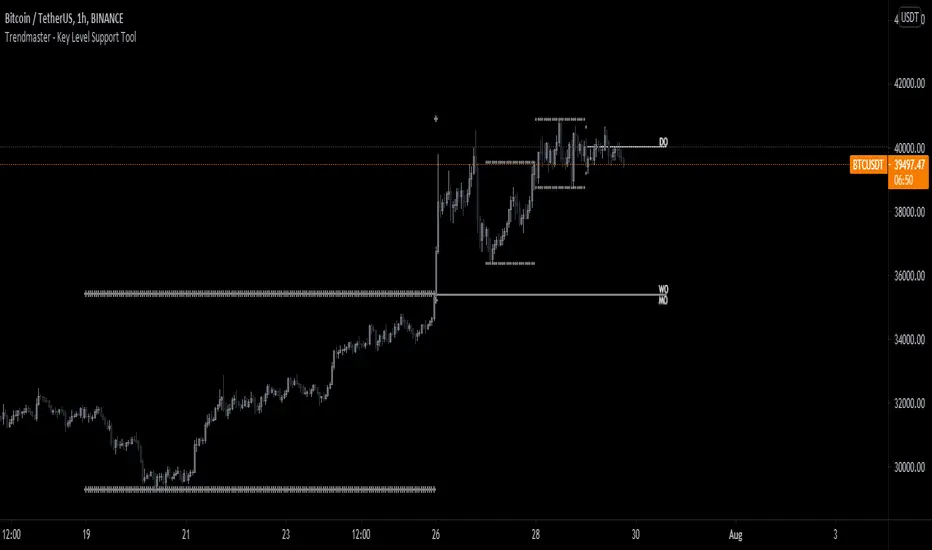
RSI, Range, and Key Level Support Tool v2.1This indicator is actually 3 different indicators combined to be able to watch key levels such as daily/weekly/monthly opens, previous days and week range highs and lows, as well as see Oversold and Overbought conditions relating to the Relative Strength Index (RSI).
- RSI DOTS SYSTEM
The first part is a custom Relative Strength Index indicator that shows RSI dots above in Red and Below in Green of the bars.
As the RSI Dots go from dark and barely visible to bright and Red For Oversold or Green for Overbought it gives a direct representation above the bar chart of Overbought or Oversold conditions. The brighter the color, the closer to 100 (Overbought and Red) or 0 (Oversold and Green) the current RSI is.
As the Overbought and Oversold conditions reverse this will show a bright Yellow Dot over the bar if it crosses a value from Overbought conditions to not Overbought conditions and the same if it crosses from Oversold conditions to not oversold conditions. To put it simply, it shows RSI reversal.
- KEY LEVELS OPENS - Daily, Weekly, Monthly Opens
This is a simple line indicator that shows 3 key levels: Daily Open, Weekly Open, and Monthly Open.
These higher time frame key levels show precisely at what price that time frame opened based on 0 UTC.
- PREVIOUS HIGHS/LOWS
This part of the indicator will show the previous day and even week highs and lows. This will help the user establish a functional range of the previous days and weeks.
The highs and lows for the daily are rows of circles above and below the high and low for that specific day and the previous weekly range are rows of crosses above and below the high and low for the past week.
How to Best use the indicator:
The RSI dots will help the user find the tops and bottoms where the Key Levels Opens and Previous Highs and Lows will help the user establish the range.
Knowing where the local top/bottom is in correlation to the potential range tops and bottoms allows the user to effectively time trend reversals and potential tops/bottoms.
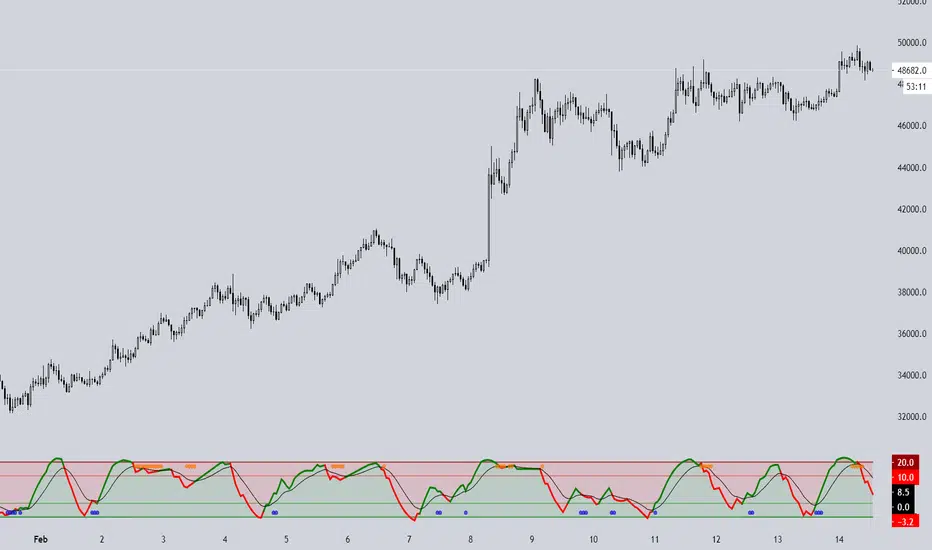
Cryptos Relative Strength Oscillator
This is an oscillator made of biggest 40 cryptocurrency/USDT pairs.
* It shows relative strength and change of crypto market during certain time on given interval.
* The tool has a bunch of data put together into one oscillator:
* top and bottom lines are made of 3 strongest and 3 weakest crypto pairs (out of 40)
* has visible names of that pairs for several candles back (it cannot show more due to TV's Pine limitations)
* in settings you can set up 2 methods of calculations:
1) % change from SMA of price, default is SMA 5
2) % changes from x-candles back, to see that change from the last candle please turn of 'Moving Average' and set up 'Bars Back' to 1
* you can change source to close/hl2/ohlc2/etc
Notice 1:
- to have nicer visibility of whole oscillator make it bigger part of whole screen then you normally use for other oscillators
Notice 2:
- scroll your mouse to widen the horizontal axis, so names of certain crypto pairs will be more readable
Notice 3:
- script has 40 Pine security functions (to gather all the data from all pairs) so it can load up to several seconds
- also every change in settings will possibly result in longer loading time
ps. This script is invite-only for the members of our trading group (info in signature, group is free of charge).

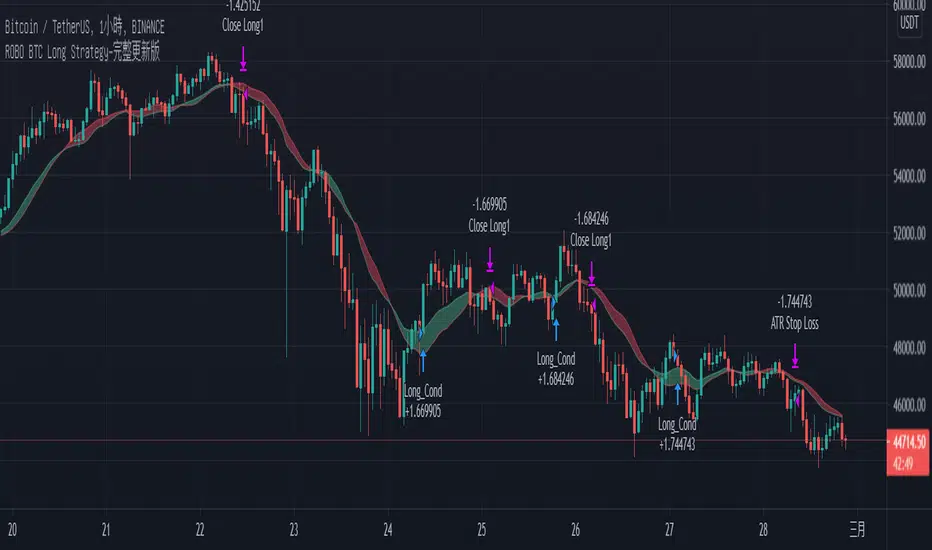
BTC/1H Long Strategy1) At present, six indicators are used for trend combination, including ATR / RSI / ROC / EMA / SMA / MACD .
2) Trend strategy is usually not very good, but any band can be stable profit.
3) BTC / usdt for any exchange, 1 hour time zone.
4) It is expected that the actual measurement will start in February. Please look forward to it.
1)目前使用了六種指標做了趨勢組合,其中包ATR/ RSI / ROC / EMA / SMA /MACD。
2)趨勢策略通常勝率都不太好,但是任何波段都能穩定獲利。
3)適於任何交易所的BTC/USDT,1小時時區。
4)預計3月開始能開始實測,屆時敬請期待。
ATR Without OutliersIt is an ATR indicator which filters out outliers.
Outliers are values which are higher than the standard deviation of the true range.
It may be better than normal ATR for stop loss, because it does not keep large values after pump or dump.
It is very useful for high volatile markets like crypto markets.

Arbitrage Sniper (POC)Good Morning Traders!
Today I want to share with you the proof-of-concept of how you would be able to do arbitrage with crypto pairs.
THE INDICATOR MUST BE PLACED ON THE TRADING PAIR OF THE TWO CURRENCIES (i.e. ETH/BTC, EOS/ETH etc.)
This arbitrage method is based on the transitional decorrelation between the crypto treding pair and the price ratio of the involved currencies, of course computing commissions as well.
Whenever the non-arbitrage condition is not respected, there is an arbitrage oportunity.
This indicator won't consider the chance of shorting, so if the arbitrage oportunity occurs the indicator will suggest you just the chance of buying the relative-undervalued currency (but inside the code you will know how to do the alternative method as well, by shorting the relative-overvalued currency)
Let's take the trading pair ETH/BTC (as in the graph) → if we assume commissions for the 0.075% of the order, the non-arbitrage condition will be presented like this
This arbitrage method will need three orders, so n=3
So let's assume that P(ETH)/(P(BTC)*P(ETH/BTC))>(1-0.075)^(-3) → it means that the price of Ethereum is currently overreated enough (relatively to the trading pair) for doing arbitrage.
We have two alternatives:
• Buy BTC, change it into ETH (by "buying" ETH in the trading pair ETH/BTC) and then sell ETH
• Sell ETH, buy BTC, change it into ETH (by "buying" ETH in the trading pair ETH/BTC)
On the other hand, if P(ETH)/(P(BTC)*P(ETH/BTC))<(1-0.075)^(-3) → it means that the price of Ethereum is currently underrared enough (relatively to the trading pair) for doing arbitrage.
We have two alternatives:
• Buy ETH, change it into BTC (by "selling" ETH in the trading pair ETH/BTC) and then sell BTC
• Sell BTC, buy ETH, change it into BTC (by "selling" ETH in the trading pair ETH/BTC)
I'm saying that is nothing more than a proof-of-concept since:
- Arbitrage Oportunities will emerge frequently just nearly zero commissions
- Data of prices are retrieved using security() function and there can be some delay (so the arbitrage oportunity will be already extinguished by the time the signal is retrieved)
- In order to have the freshest data, repiainting will occurr

DBT MoMo Divergence FinderThis Indicator is an experimental Divergence Finder using the DBT MoMo formula. See DBT MoMo v.4 for details on the main script.
It uses a slower version of the DBT MoMo Price Line to smooth out the trend and color codes the Price Line based on its trend.
Bullish Divergence is denoted by Blue Labels below the Price Line.
Bearish Divergence is denoted by Orange Labels above the Price Line.
Alerts can be setup in Tradingview for both Bullish and Bearish Divergence Signals.
This indicator is brand new and experimental, make sure to double check the Divergence Alerts before blindly trading them. There can be a mathematical divergence without there being a visual divergence, this will trigger a false alert.
Everyone with access to the DBT MoMo will have access to this indicator as well.
hamster-bot HD preset_2presets for users
// DESCRIPTION OF STRATEGY ver. 2
HiDeep Strategy
Author foresterufa
This is a counter-trend strategy that is gradually gaining a position against the trend at the best price.
A prerequisite for completing a position is the price exit from the internal channel on the chart and the appearance of the HiDeep indicator.
The condition for closing the position is touching the opposite side of the internal channel.
A condition for facilitating closure along the middle line of the channel, with high price volatility , is that the price touches the border of the external channel.
Input signals are generated by HiDeep indicators. Closing a position by moving averages.

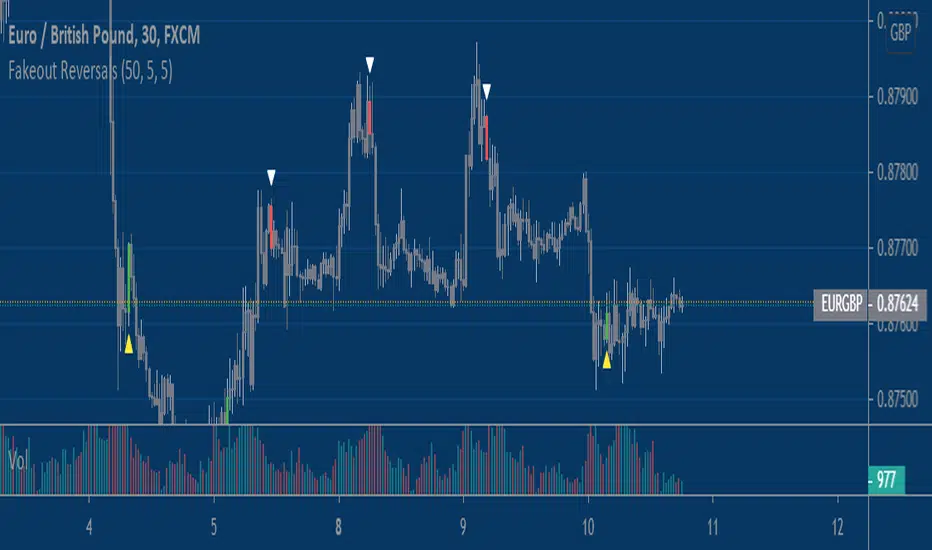
Fake-out ReversalsThis script combines two simple concepts, stop running and short term momentum, into a simple visual signal that can be applied to any market and any timeframe with some adjustment. It looks for price to violate a prior extreme within a certain lookback window, followed by price triggering a momentum filter that helps put the proverbial 'wind at your back' for the user. Users have the ability to customize three inputs; 1) Bars used to calculate price extremes 2)Bars since price violated that extreme 3)The sensitivity of the momentum filter.
You will find that these signals work best in choppy and rangebound price action, less so in trending/grinding markets. For entertainment/educational purposes only.
Enjoy!
Mayfair Crypto Strength IndexWorking on the basis of a currency strength index - expresses the index value of a currency. For economists, it is often calculated as purchasing power. while for financial traders, it can be described as an indicator, reflecting many factors related to the currency; for example, fundamental data, overall economic performance or in Crypto terms the strength of the company/asset itself.
In the base version;
BTC is the thicker Orange level.
ETH - the Green
XRP - Blue
The concept then is similar to a stochastic indicator or RSI - 20% oversold regio & 80% overbought. The zero line can be used as Bullush or Bearish.
We wanted to create something that shows the correlation between the top cryptocurrencies as we are often asked about breaking down one or the other.
This is not a buy me now or sell me then indicator - just there to assist and compare assets easily.
Please feel free to like and follow.
Disclaimer
This idea does not constitute as financial advice. It is for educational purposes only, our principle trader has over 20 years’ experience in stocks, ETF’s, and Forex. Hence each trade setup might have different hold times, entry or exit conditions, and will vary from the post/idea shared here. You can use the information from this post to make your own trading plan for the instrument discussed. Trading carries a risk; a high percentage of retail traders lose money. Please keep this in mind when entering any trade. Stay safe.

Rate ConverterThis is a simple rate converter that can convert almost anything into almost anything else. It supports cryptocurrencies, currencies and most commodities.
On the chart we see the following:
USD (US Dollar) into EUR (Euro) as a candle stick chart
WTICO (West Texas Intermediate Crude Oil) into ISK (Icelandic Krona) as a bar chart
ADA (Cardano) into JMD (Jamaican Dollar) as a line chart
XPT (Platinum) into XAG (Silver) as a scatter plot
It supports plotting the rates as japanese candlesticks, bars, lines, or as a scatter plot.

Ark Crypto HeatlineThis is the 'on chart' indicator. See also "Ark Crypto Heatband" indicator for a side-by-side BTC view, without a re-scaled line.
The crypto landscape is largely dominated by BTC and characterised by cyclical stages with varying degrees of mean reversion.
To understand what stage of the cycle we are currently experiencing, it is useful to examine to what degree the current price has extended beyond the long term average that BTC has established. This is true even when analysing other crypto assets as BTC is the dominant force in the crypto asset class.
This indicator uses the 1400 period daily SMA , which is broadly the 200 period weekly SMA. This can be configured, but historically has represented a baseline to which BTC commonly returns.
The graph plots current price in terms of multiples of this long term average. Traditionally, at multiples beyond 10, BTC is considered overextended with a higher likelihood of trending towards the mean thereafter. Colors indicate the extent of price extension.
Where the indicator is applied to non BTCUSD pairs, a smoothed conversion is applied, seeking to superimpose the BTC long period SMA onto the current chart.
The indicator specifically references BTC by default on all charts, as it is designed to use BTC as general purpose indication of where crypto as a whole currently sits. Accordingly the indicator is only to be used on crypto charts.
For best results on BTC, using BNC:BLX will give the longest historical view.

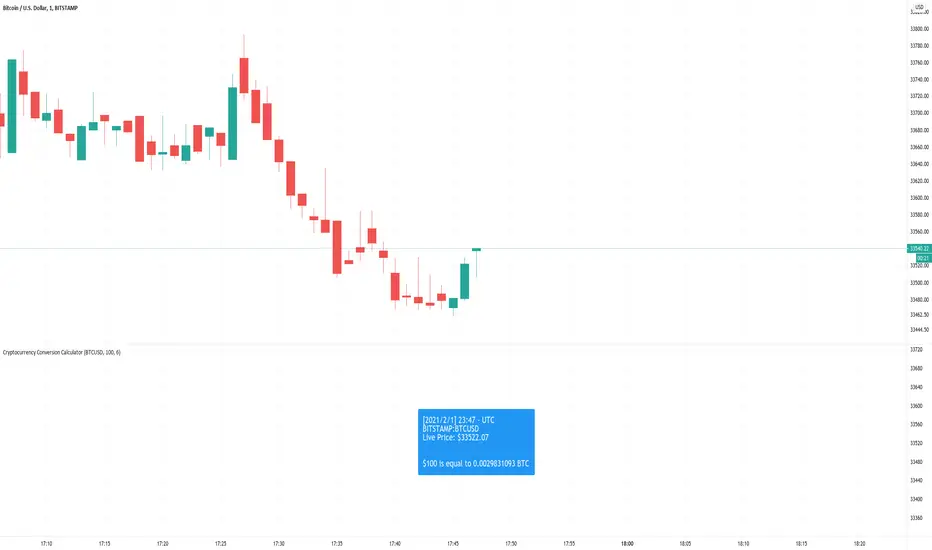
Cryptocurrency Conversion CalculatorA calculator that gives you the amount of a coin that is equal to the inputted value.
Options to configure are the ticker, amount in USD that will be converted, and how many digits you would want to be shown after the decimal point.
Currently, this only supports USD quote currencies. Ideally in the future, the code will be rewritten. Maybe.
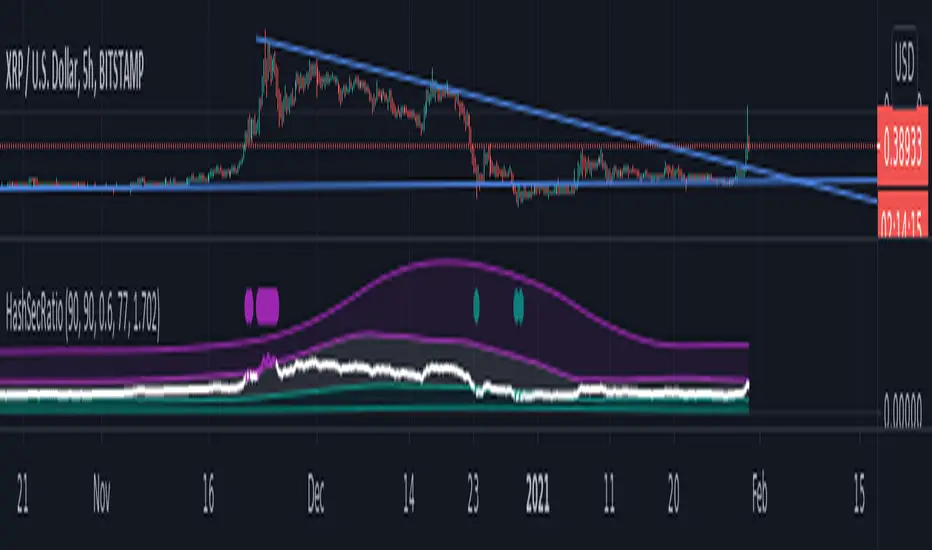
Hashrate to Securities RatioTMcV
HashSecRatio Original
January,30,2021
The Hashrate to securities ratio is a study to get a view on data flowing through the blockchain and can be applied to any asset available in Tradingview.
This indicator illustrates asset performance vs the moving average of BTC hash rate and accurately highlights price trend tops and bottoms allowing for excellent entry points in long and short trades highlighting overbought and oversold conditions in custom timeframes.
I will allow protected access for a short period of time to gather public opinion after that access will be limited to paid only.
For now if you would like to use this script please leave a comment and add to your favorite scripts.
Ark Crypto HeatbandThe crypto landscape is largely dominated by BTC and characterised by cyclical stages with varying degrees of mean reversion.
To understand what stage of the cycle we are currently experiencing, it is useful to examine to what degree the current BTC price has extended beyond a long term average. This is true even when analysing other crypto assets and helpful to view side by side.
This indicator uses the 1400 period daily SMA, which is broadly the 200 period weekly SMA. This can be configured, but historically has represented a baseline to which BTC commonly returns.
The graph plots current price in terms of multiples of this long term average. Traditionally, at multiples beyond 10, BTC is considered overextended with a higher likelihood of trending towards the mean thereafter. Colors indicate the extend of price extension.
The indicator specifically references BTC by default on all charts as it is designed to use BTC as general purpose indication of where crypto as a whole currently sits. Accordingly the indicator is only to be used on crypto charts.

Total Volume BTC - Dollar [Sobhm]
Do you want an indicator that shows the total volume in Bitcoin vs Dollar?!
The BTCUSD - BTCUSDT - BTCUSDC total volume is covered by the "Total Volume BTC - Dollar " indicator.
You can see the differences between simple volume and the collected volume using "Total Volume BTC - Dollar ".
The volume of the following pairs are collected:
'BITMEX:XBTUSD'
'BINANCE:BTCUSDT'
'BINANCE:BTCUSDTPERP'
'BITSTAMP:BTCUSD'
'COINBASE:BTCUSD'
'BITFINEX:BTCUSD'
'BYBIT:BTCUSD'
'GEMINI:BTCUSD'
'OANDA:BTCUSD'
'FTX:BTCUSD'
'FX:BTCUSD'
'HUOBI:BTCUSDT'
'BYBIT:BTCUSDT'
'COINBASE:BTCUSDC'
'BITSTAMP:BTCUSDC'
'POLONIEX:BTCUSDC'
'KUCOIN:BTCUSDC'
'HITBTC:BTCUSDC'
The timeframe is adjustable based on minutes.

trendOne [Strategy]BITSTAMP:BTCUSD
trendOne
(strategy-tester)
It is not recommended to use this script for generating alerts. Use "trendOne Alerts" instead.
This script combines all our previous trend-based scripts (Bows, Autopilot, Trend Indicator, Price Deviation, etc) in only one script .
To calculate the trend we use:
Volume Weight
Average True Range
Bows calculations
Trends smoothed with alma() function.
For more accuracy on the signals and to filter unwanted signals we layered slower time-frames in the background and added breaking support & resistance rules.
Inputs
Sensitivity
Integer input. Sets the sensitivity for signals generated up and down. Higher values will generate less signals on chart, and vice-versa.
Enjoy!
Disclaimer:
Back-tests do not guarantee performance on the future. Even if a trading setup is profitable in historical data, it could be unprofitable in the future.
To get access to this and other scripts check links below.

trendOne [Alerts]BITSTAMP:BTCUSD
trendOne
(alerts)
This script combines all our previous trend-based scripts (Bows, Autopilot, Trend Indicator, Price Deviation, etc) in only one script .
To calculate the trend we use:
Volume Weight
Average True Range
Bows calculations
Trends smoothed with alma() function.
For more accuracy on the signals and to filter unwanted signals we layered slower time-frames in the background and added breaking support & resistance rules.
Inputs
Sensitivity
Integer input. Sets the sensitivity for signals generated up and down. Higher values will generate less signals on chart, and vice-versa.
Enjoy!
To get access to this and other scripts check links below.

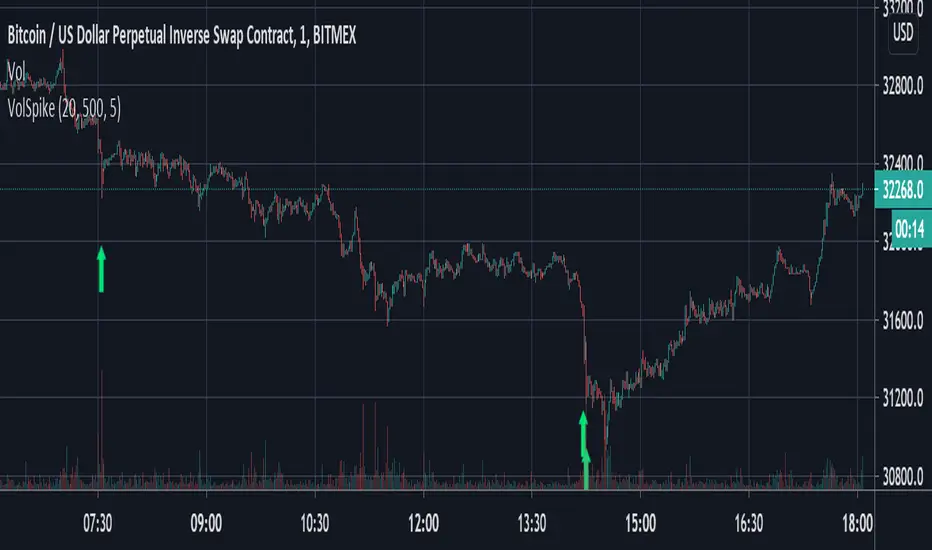
Volume Spike Strategy This is a Pine Script implementation of “Capitalize AI: Volume Spike Strategy" by Bitcoin Trading Challenge (copied with permission).
Original Capital AI formula :
If BTC/USD 1 minute volume > BTC/USD average volume in 20-1m bar by at least 500% and if BTC/USD is below the MA (5,1m,close) of BTC/USD then buy 10,000 USD WORTH of BTC/USD
Tested on XBTUSD 1 minute.
Original strategy is buy-only. Option for sells was added (enable in settings).
First published script -- comments/feedback appreciated
Ehler Fisher applied on distance EMAThis is an improved version of Fisher, which use as a source the distance from EMA , compared to the initial source which was on the close of a candle.
It can be used in any market, any time frame .
For conditions we have multiple conditions for the logic, in this case initially if our fisher is above 0 is a long direction ,if its belowe 0 its a short direction.
Also we can improve this condition even further, in this case if we cross up our previous line its a buy signal, and if we cross down its a sell signal.
For best usage combine the cross together with the position of fisher respecting the 0.
If you have any other questions, let me know with a private message.

Crypto Derivatives Sentiment HeatmapWhat?
This is a heatmap that shows derivatives sentiment for some of the most prominent coins in crypto.
Content
Coins included:
BTC
ETH
LTC
DOT
LINK
YFI
The indicator takes the Binance USDT perpetual swaps of these coins and compares them to their respective spot indices.
Binance is the exchange of choice because their perps have the highest volume in the market.
For the spot indices I've used the indices created by Bitmex.
These are very intricate and weighted indices with compositions of the most important and trustworthy spot markets.
For more information check the Bitmex website.
The heatmap shows red coloring if the perp is trading above spot (bearish).
It shows green coloring if the perp is trading below spot (bullish).
The lighter the color the less wide the gap is between perps & spot.
The darker (brighter) the coloring the more extreme the difference.
Trading
It's quite simple.
When you see a lot of green, preferably dark green, you should have a bullish bias because it means that perps are oversold or that spot is bidding hard.
Vice versa a lot of red should give a bearish bias.
It's very practical for a quick sentiment check.
This indicator is free so you can just add it to your favorites.
Shout-out to zzzcrypto123 for inspiring me.

OH2B Take Profit IndicatorOH2B Trading Indicator
The Take-Profit Indicator gives you exit points for taking profits based on the Average Directional Index and Relative Strength Index.
It also gives you possible swing-high and swing-low in a trend .
The OH2B Trading Indicator is an indicator that gives you entry points for BUY and SELL based on Trend Channel and Ema-Crossover.
Both indicators work better in tandem with the best result.
Trading with Both Indicators
Orange Zone : Wait for the next signal from OH2B Trading Indicator.
The OH2B Trading Indicator gives you entry points for BUY or SELL .
When the ema1 crosses above ema2, the trend channel will be painted GREEN in color, and a BUY signal will appear. = BUY
When the ema1 crosses below ema2, the trend channel will be painted RED in color, and a SELL signal will appear. = SELL
When a BUY or SELL signal appears on the chart, don't rush into any trade.
Please allow a few hours for confirmation of signals .
To take profit, please follow the Take-Profit Indicator at the bottom.
RED dots are the Take-Profit targets for the BUY (long) signal
GREEN dots are the Take-Profit targets for the SELL (short) signal
*After taking profit, please set a Stoploss to at least break-even level to protect your profits.
When the price enters the Orange Zone again, you may close your trade and wait for the next signal.
If you like to keep your positions at Orange Zone, please remember to set a stop-loss alert when an opposite signal pops up on the chart.
Often the price goes to the Trendline after the signal, so keep some funds to increase the position or even open all position near the Trendline , or use it for re-enter with SL after you closed position on TPs.
