Bar RatioBar Ratio is an indicator tool that provides real-time likelihood of the current bar closing up or down (green or red).
Technical status, volatility and time are key elements in this indicator.
From the open of a bar, a ratio of 50% is assumed before changes from factors are considered.
The factors that change the likelihood of a bar closing up or down and their relative weight are listed below.
Micro-Trend observed over the last 20 bars - up to 2.5%
Macro-Trend observed over the last 70 bars - up to 2.5%
Current bar price against beginning of Micro-Trend - up to 2.5%
Combination of significant change above average volatility and move against direction of Micro-Trend - up to 2.5%
Combination of significant change above average volatility and move against direction of Macro-Trend - up to 2.5%
Previous bar direction up to 10 consecutive bars - up to 3.75%
Current status of bar (higher or lower) - up to 3.75%
Significance of change against average volatility - up to 5%
Time until bar close - up to 25%
Total: 100%
If all factors are synchronised, the likelihood of the bar closing up or down can be indicated at a probability of 100%.
While the practical ability for this to be used for trading is limited, the tool can be useful for choosing when it is safe to open a trade.
Time is a key element as the likelihood of the bar remaining at current status by the close of the bar is constantly increasing.
The accuracy of this tool is incredible and should be noted as it's primary trait.
You can find and use this indicator on any time-stamp or security such as Cryptocurrency, Forex, Stocks or Indices.
The Bar Ratio can be located by searching in your public indicator library at the top of your chart and adding it to your screen.
Kripto

Directional Momentum Flux StrategyDirectional Momentum Flux (DMF) is a compound indicator designed to surface signals of projected change in directional momentum. The primary goal is to identify possible momentum inflection points and signal them before they happen, which is reached by applying a set of well-known high-level indicators (e.g. DEMA, RSIs, CCIs and VWAP), lower-level indicators (e.g. BOP, PPO and RMOMO), and some special sauce brewed in-house by yours truly.
This strategy is invite-only. Invitations are offered for a one-time fee of $250 payable in several cryptocurrencies (ETH, BTC, DASH, XMR or ZEC). Once you've got an invitation, you will automatically receive updates forever*.
DMF was designed to work across multiple asset classes. Extensive backtesting has been performed over multiple sample series (not just during the bull runs, for example) and against a randomized pool of assets. But don't take my word for it, I've included some time-based backtesting support tools to make it easy-peasy for you to validate the results yourself!
Under the hood, DMF is powered by numerous indicators, including:
✓ Double EMA & Composite SMA;
✓ Double RSI (fast & slow, variable);
✓ Composite StochRSI & VWAP (StochRSI+, two series);
✓ Composite Commodity Channel Index (CCI+, two series);
✓ Volume-Weighted Balance of Power (BOP itself was adapted from BOP_LB, kudos to LazyBear);
✓ Percentage Price Oscillator (PPO, split, two series);
✓ Range-adjusted Momentum Oscillator (RMOMO, my fancy MOM variant);
It crunches all that data and generates signals which are issued in two ways:
✓ Vertical Bands (or VBs) - Entry/Exit windows as vertical bands that remain "lit" (e.g. the background of a series of candles is semi-opaque white) while the top-level signals are showing sufficiently strong BUY signals. These windows are the primary entry/exit targets and can be relied upon with sufficient risk mitigation (e.g. a reasonable stop-loss or other scale-out exit mechanism). A VB followed immediately by an egg is as good as gold.
✓ Eggs - Entry/Exit validation signals that confirm the condition indicated by VBs. A lit VB without an egg in the same or next candle session is considered to be valid , but not safe (see above warning). Waiting for an egg can improve performance at the risk of missing the best possible entry point. Consider your risk tolerance and act accordingly.
Basic Instructions:
✓ Configure The Settings! The defaults are pretty good, but don't be scared to try variations. For example, by default SHORT positions are disabled. You might want to enable them if your risk tolerance allows them. (IMO there's gold on both ends of the rainbow. 🌈)
✓ Pay attention to the VBs. If you see a lit band being placed in an otherwise dark area, it's a projected inflection point. This is expected to be validated and confirmed in the same or immediately following period with an egg. You can enter a LONG position at this time.
✓ Pay attention to the eggs. If you see an egg, it's a confirmation that the VB changes in the same or immediately preceding candle period is valid. If you did not enter or exit your position at the point of the VB shift, now is the time to do so.
✓ Watch for the end of a VB period and be prepared to exit your position quickly as the next egg may be accompanied by a large directional momentum inflection.
Things to Note:
📉 - DMF is designed for day trading with aggressive position TTLs (15m was the upper bound during development and strategy testing). It appears to issue valid signals for other intervals, but it was not designed for >15m and YMMV. Don't go manually opening a LONG with no exit strategy and go to sleep... it probably won't work out to your benefit. You should be prepared to exit positions at any time. (Pro tip: automation is your friend!)
💸 - DMF indicator is not free from risk. As with all investment strategies, it is crucial to exercise caution and only trade with funds you are comfortable losing. DMF does not offer any form of guarantee or warranty, implied or otherwise. If you lose money, your house, your 401K... that's on you. (Pro tip: don't risk anything you're not ready to lose, because losses are part of the game and you WILL have them.)
🤔 - By using this indicator, you understand that any and all risks are the sole and complete responsibility of the end user (yeah, that's you). Don't use it if you're not 100% clear that you know exactly what you're doing. (Pro tip: always ask questions if you're feeling confused.)
⏱ - * Forever in this context means that, where room for improvement exists, I will improve it over time and you'll get all updates until I stop making them. (Pro tip: nobody lives forever.)

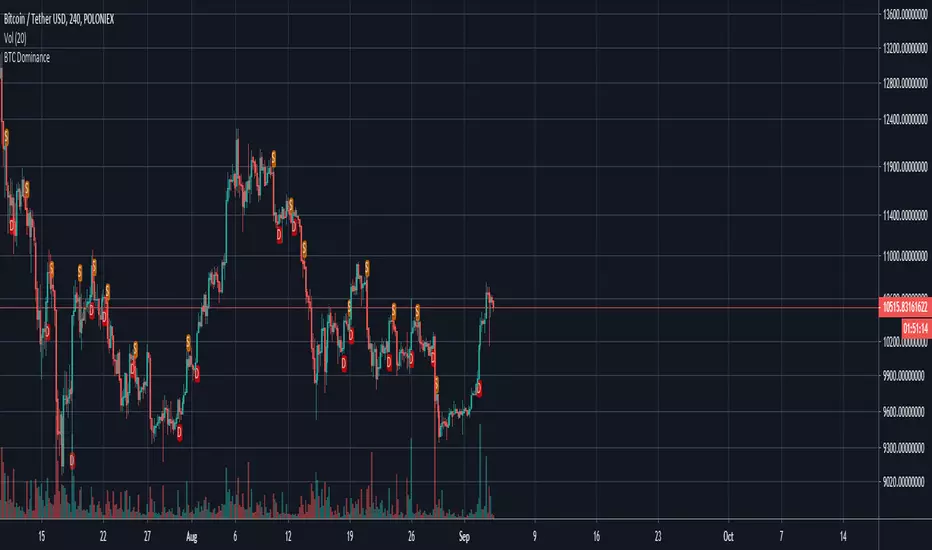
BTC Dominance IndicatorThis script calculates the BTC dominance and adds markers as overlays on top of your crypto chart.
A red "D" means "BTC dominating" and an orange "S" means "BTC submissive". In both cases further price actions are imminent.
You can use this script for any crypto asset to see how it performs while btc is dominating.
If you are for example trading a BTC paired asset, then this can give you a warning if BTC starts to dominate (BTC paired assets tend to dump if BTC dominates).
On the other hand, you can use this as signal on USD paired cryptos if BTC dominates as USD paired cryptos tend to go with BTC.
It is recommended to use additional indicators with this as it is not meant as buy/sell signalling tool.
MaverickWelcome to the Maverick.
How to use: Apply to any chart, on any time frame. You will see BULL and BEAR signals on the chart. A BULL signal represents an entry/buy in, and a BEAR represents an exit/ sell.
You can use the Maverick to scalp on low time frames such as the 5m, 15m, 30m etc. Or use the Maverick on higher time frames such as the 1hr, 2hr, 4hr.
You can use regular candles but Heikin Ashi are recommended for better accuracy.
When using Heikin Ashi, I have included a real price line which shows the actual price of the asset/chart at the close of each candle.
Settings alerts: You can easily set buy/sell alerts by selecting Maverick in the set alerts tab and selecting Bull for buy alerts and BEAR for sell alerts.
To gain access to this INVITE ONLY script, please join the discord for a free trial: discord.gg

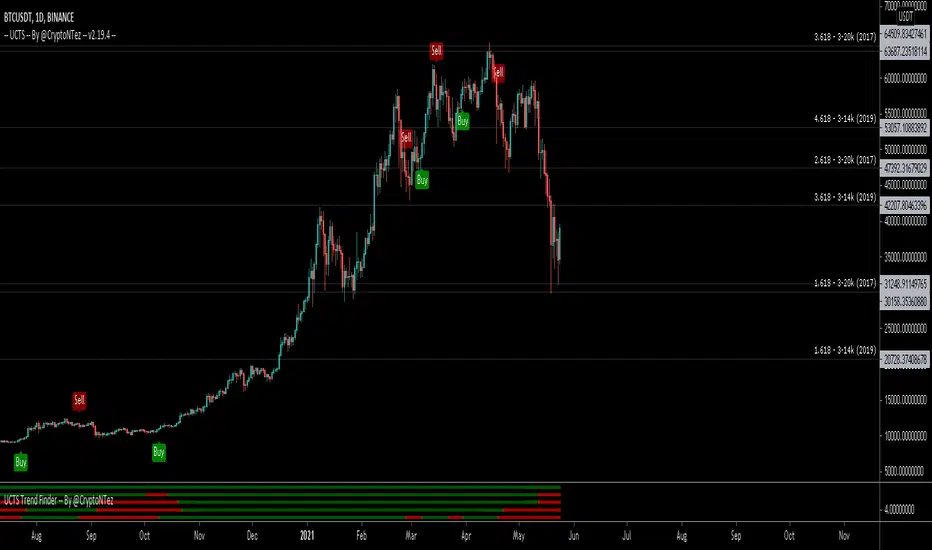
UCTS Trend Finder -- By @CryptoNTezUCTS Trend Finder is an additional feature of the well known UCTS Indicator
Easy and profitable strategy optimized for Crypto.
This script will plot green or red colors based on the UCTS Signals on different timeframes.
The script is optimized to catch trend movements as soon as possible and maximize profitability.
If you want access send me a PM on Tradingview or a DM in twitter @CryptoNTez.
Best regards and happy trading.
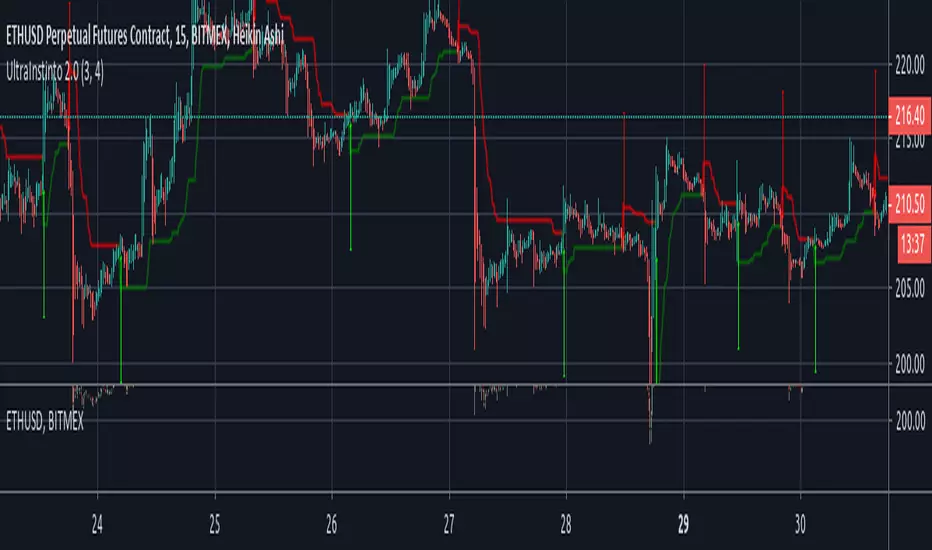
UltraInstinto 2.0BITMEX:ETHUSD
UltraInstinto 2.0 is a trend hunter tool, based on the latest artificial inteligence algorithms it can take decisions on real time, on any frametime, buy when the green arrow appears, and sell when the red arrow appears, easier than play fortnite, and returns you a lot of money
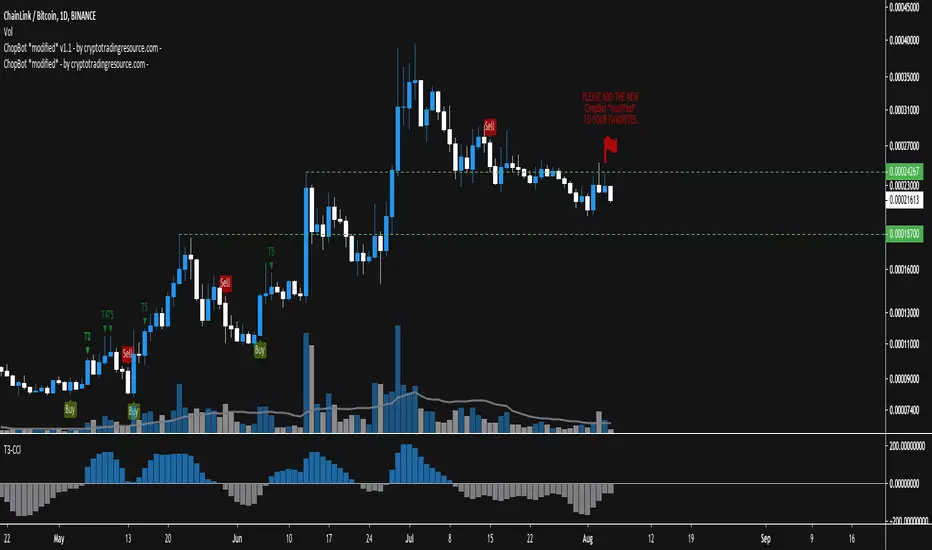
ChopBot *modified* v1.0 - by cryptotradingresource.com -This is my modified version of the original strategy by @yerb
It has just a little tweak in it, but this already works out that you'll receive less signals. There is for sure more room to perfection but it looks accurate.
Try it out on different timeframes, find the best on for your asset and enjoy trading!
For now included
Buy and Sell plots
Alerts for plots
Some examples:
BTCUSD 1D
BNBBTC 1H
THETABTC 6H
RVNBTC 2D
Happy trading
+++ use this tool on your own risk. i'm not responsible for your loses +++
____________________________________________________________________________
BTC: 1GVRDK3HHr9CKM5SF2CGpCNXFuavB3L4j9
ETH: 0x7b825fa752b9926D3E8397cDb1d9E5473D074646
XMR: 41zL2SQS7zyZmwXKng2TeUWsMi5vMmkgSdDCjULUTvM6ichwm1E2ZDEYGt56zk9ghoM9bekhjycSwa8amtTcB2JiUet5jtg
NEO: AXja5xPDhczfm2ujHyBfpkQAAnMsXsazmb
ZEC: zcZzFkRx95cp7MtuW8wLhC5zz5RYF9QkT2uPPmhZZHc6ppXepHGgCSeAS1rtD6WFdqsM5p1gZm2gfirnrnviucsdP4aCpqU
XLM: GAXUQJSW55C7MAC4GI26NZUGIKSHFDVFRFKZCXPLMPY4HCADSDT55XK6
WAVES: 3PCMkNpMHxSraTCkwV1ENcBKa9sXbVCGjQX
BCH: qz57n04ud6mn42u00aymqkku8tfh0lk4jv9c28mjvv
____________________________________________________________________________
++++ cryptotradingresource.com ++++
____________________________________________________________________________
Crypto Fund indicatorThis indicator is just a slight modified version of the godmode indicator developed by xSilas.
It helps to spot and extreme building selling or buying pressure.
I use it mainly for BTC on the 1h chart but can do the job on other crypto-assets and timeframes such as 5min, 30min etc.

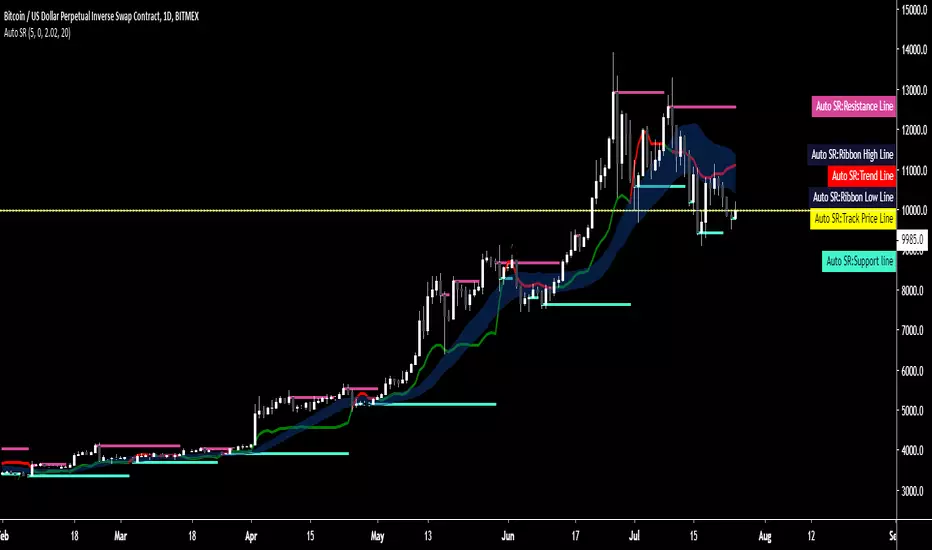
Auto SR - Automatic Support & ResistanceAuto SR is an indicator for TradingView™ which automatically searches and prints key support and resistance levels.
Its strength lies within its ability to provide visualization in real-time to aid in your trading.
It's a versatile indicator suitable for both short or long time frames and has a precision of 8 decimal points, therefore making it suitable for any market type.
A trend line shows a shift in major trends while a ribbon shows you shifts in smaller trends and indications are given for break and re-entry of both support and resistance levels.
All conditions are coupled with their own alerts, giving you the option to integrate it into your trading system or receive alerts on-the-fly.
Tried, true and tested for over one year, Auto SR has already become a trusted staple of those who've experienced it.
As a standalone system or an addition to your existing strategy, Auto SR has what it takes to elevate your trading to the next level.
Key Features:
- Automatic charting of support and resistance lines charted in real-time, no repainting.
- Major and minor trend detection
- Full alerts for support and resistance forming, price exiting or re-entering lines, trend shifts and more.
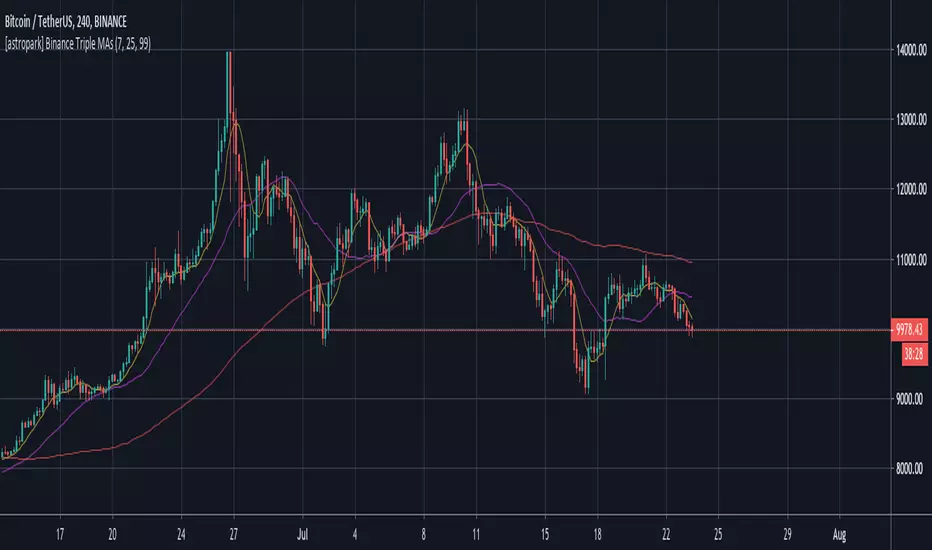
[astropark] Binance Triple MAsDo you miss Binance basic MAs series on your trading view chart?
Enjoy!
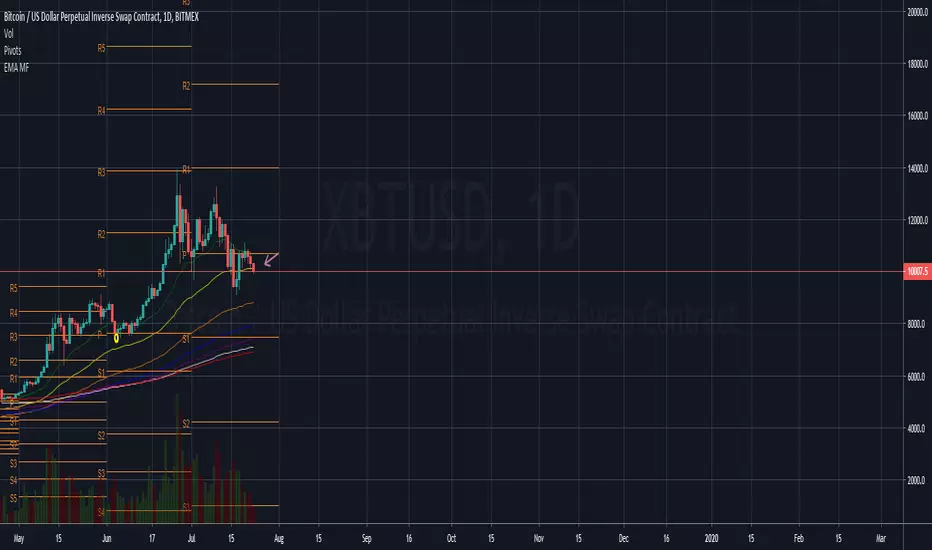
EMA MF - EMA (21,50,100,200,250,300)Hey guys
a simple script for some EMA's at one indicator
For signals news TA and more join BitcoinMF
Links are at the TV profile
--
This is not financial advice
DYOR
Trade Safe and Good Luck
FARIDA STRATEGY BY LAWRENCE @Gann450published only for testing, still in its initial versions and under development.
Pump|Dump Tickerthis is just a study to investigate the pumps and dumps that have been happened in a crypto market and it should not be used as an indicator. this is also my very first Pine Script that I've written and I am sure it is not perfect. actually I am curious to know when (I mean the exact time of the day) most pumps and dumps happen as a self investigation. the method that is used to define pumps and dumps is not good (and I know that) but I will modify it for better result in next version.
to use this study, you should define whether you want to display pumps or dumps or both and also you should define percent of change (threshold).

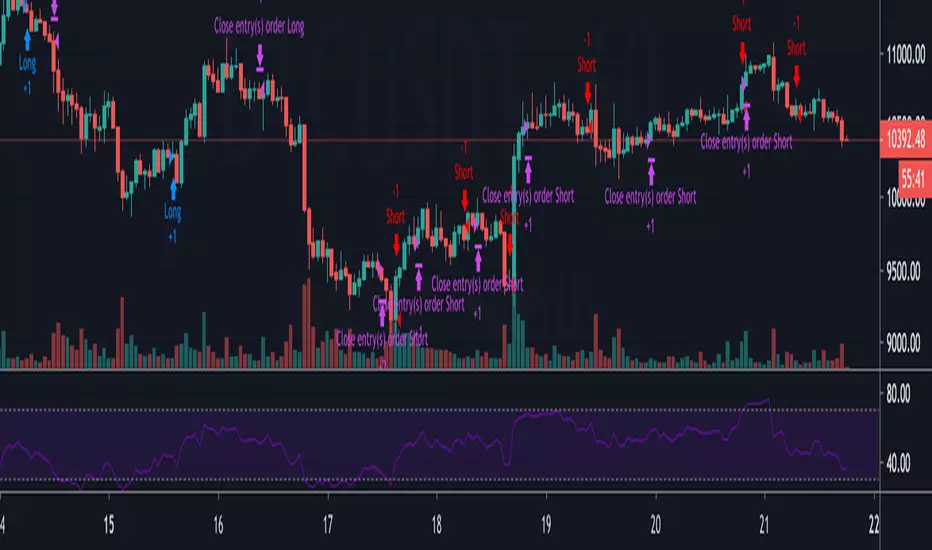
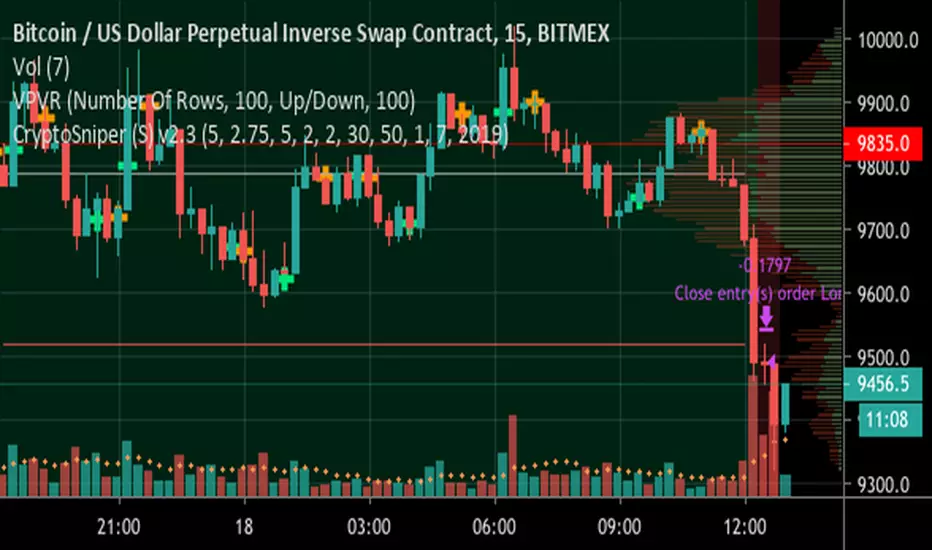
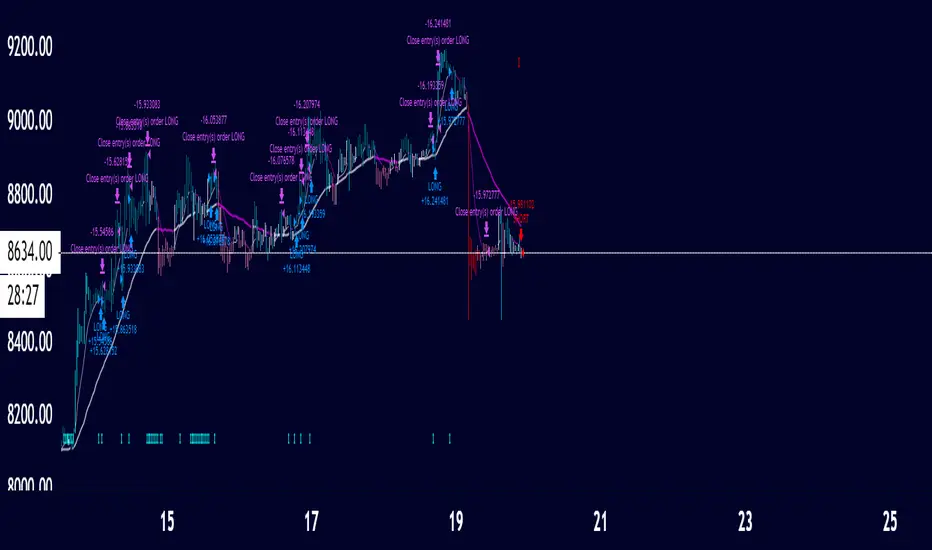
ck - CryptoSniper (Strategy) v2.1This strategy is radically different to the v1 script previously released.
It has ***NO REPAINTING*** - as such the algorithm had to change to remove it’s reliance on HMAs from future timeframes to establish trend, this is now accomplished with EMAs.
It is completely written in Pinescript v4.
It has integrated Stoploss and you can plot this & with the recommended Entry on the chart.
WARNING - This strategy has to be “tuned” to the instrument you are trading, for example, Bitcoin. The default settings work well for BTC/USD, XBT/USD on 15m chart timeframe but not for ETH/USD - it is possible the default settings will work with other crypto’s but I haven’t had time to test - if you find good settings PLEASE share them!
How to use:
1) Load up your favourite chart/instrument and select your favourite timeframe
2) Adjust the “signal” EMA and “baseline” EMA settings until you get the majority of uptrending moves highlighted with a green background and the majority of downtrending moves with a red background. The signal has to be faster (that is a lower number) than the baseline.
3) Adjust the “Sensitivity” - this will plot more green & orange Trigger points on the chart.
The strategy waits until in a trend, for example, a Long (green background) then waits for first green cross before opening a deal. It will Trigger a sell if the background turns red (downtrend) and a orange cross is printed.
4) Fine tuning:
A) Increase your profits by changing the Stoploss value - getting this right protects you from bad trades but also resets the indicator to provide another alert faster
B) You can increase the delay positions are opened or closed with the “Bar(s) offset to open position” and “Bar(s) offset to close position” settings. When you adjust these, 0 will buy/sell immediately when a Trigger cross is printed, 2 will wait until 2 bars/candles AFTER the Trigger cross prints to strat/close a position.
TIP: When adjusting indicator settings, load your chart and timeframe first.
Add the indicator/strategy (if you haven’t already).
Click the Strategy Tester tab at the bottom of the chart window so it is visible.
Open the strategy/indicator settings so you can see this wind AND the Strategy Tester display
Change a setting and click into a different setting input box, this will update the test results WITHOUT closing the settings window! This will save you a lot of time!
Write down any OK settings you find, you can come back later to fine tune them!
Please provide any feedback & let’s share the best settings for different crypto’s!
Crypto Investidor EMA e MA Crypto Investidor EMA e MA consiste em um conjunto de 4 EMAs de 21 / 50 / 100 / 200 períodos e também 4 MAs de 21 / 50 / 100 / 200, criado para facilitar o entendimento dos nossos seguidores, a ponto de poder verificar no gráfico tanto as Medias Móveis Exponenciais, quanto as Medias Móveis Simples. Um excelente indicador para quem utiliza o tradingview free.


Stochastic Rsi based trading strategyThis strategy checks if the stochastic rsi is oversold, then checks if %K and %D are less than 10. If all these conditions happens, we have a buy signal.
After this, we will receive a sell signal when the stochastic rsi crosses under.

BB - Study - CryptoFoudid.comHi everyone,
A new script transformed on a study from QuantNomad.
Based on the Bollinger Bands to catch the range market.
I filtered the consecutive signals to avoid a "funding" issue.
You can configure it as you want based on inputs.
The best way for crypto is to have about 45 to 55 length and 2 to 3.5 in multiplier but it's your choice :)
ENJOY !

BTC crypto bot indicator 3 MIN - PhilMEXBTC Crypto bot indicator
Can be used on all BTC USD / XBT USD
Must be used on 3 minutes timeframe only
Signals are pretty accurate and this code has no repaint.
Hope this help for your trading and Bitmex.
Some updates may come soon.

Cyatophilum Scalping Bot V2 [BACKTEST]Improved version of Cyatophilum Scalping Bot
Default settings for BITMEX:XBTUSD
2% stop loss
2% trailing take profit

Bitmex Dollar Value CalculatorWith this indicator you can easily calculate either the bitcoin value of a certain amount of dollars or the dollar value of your bitcoin (particularly helpful when trading on bitmex)
Tipjar : 38uGQJDDZDL6wX48x4gYTccPeQ3ZHVYmY4 (btc)

TrendaidTrendaid
is exactly what the name says
an Aid to Trend
Use this strategy to understand when the trend may shift and then use it to stay in the trends longer
simple strat
Buy when it says BULL in BLUE
Short when it says BEAR in RED
you may close your orders when it says to in PURPLE but unneeded if you want
You can adjust the stop which affects the scripts performance
You may also change from a Long to a Short line but the standard has proven to be the best overall
Let Trendaid guide you to riches
this was primarily designed for #forex but can be used in any market including #crypto
get access by joining the #CCV trading family by visiting the link below
- Cheers
SatoshiHeavy Market analyst for CCV Trading
www.cryptocurrentlyvip.com
Fully Adjustable BTC Longs/ShortsThis indicator shows you Bitfinex Longs&Shorts charts in one handy indicator. It's fully adjustable to your own prefference.
Tipjar : 38uGQJDDZDL6wX48x4gYTccPeQ3ZHVYmY4 (btc)
