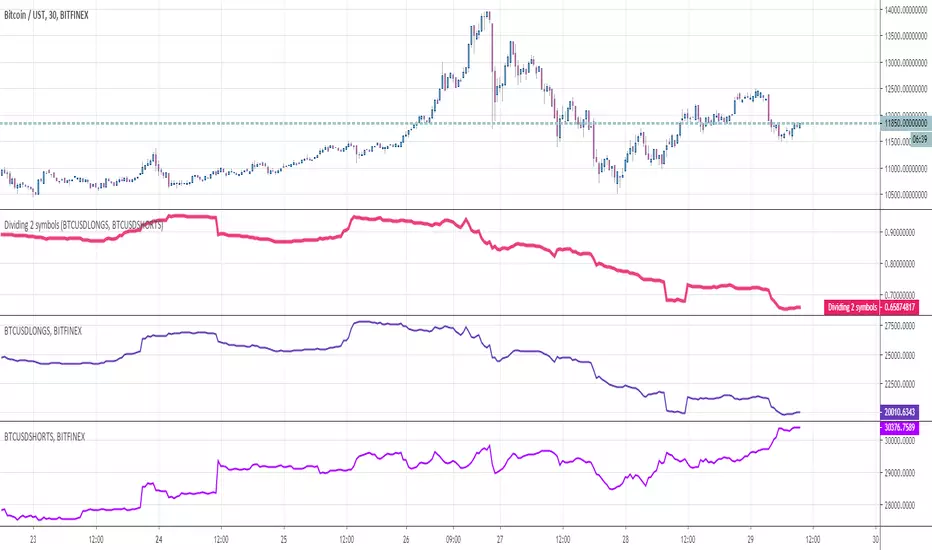
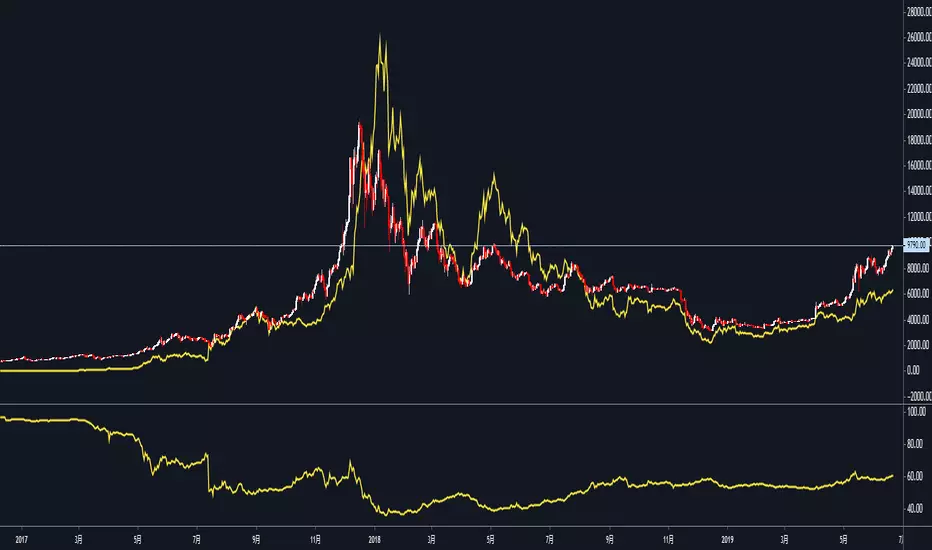
Dividing 2 symbolsHello Traders
This indicator is used to divide two assets between them. Why you would ask ?
For instance, in crypto trading, traders often look at the ratio Longs/Shorts or Shorts/Longs to figure out which side is leading the market and use this information as a powerful hedge for their next trade
Enjoy
Dave
Kripto
TTPro CryptocurrencyImpulse v12// TTPro CryptocurrencyImpulse is a crypto strength meter that shows us which currencies are
// strong or weak on any chosen timeframe. Buying into strength and selling into weakness is the key.
// We have an advantage with this indicator in seeing strength and weakness at a glance and also
// in being able to spot reversal opportunities when the lines cross over.

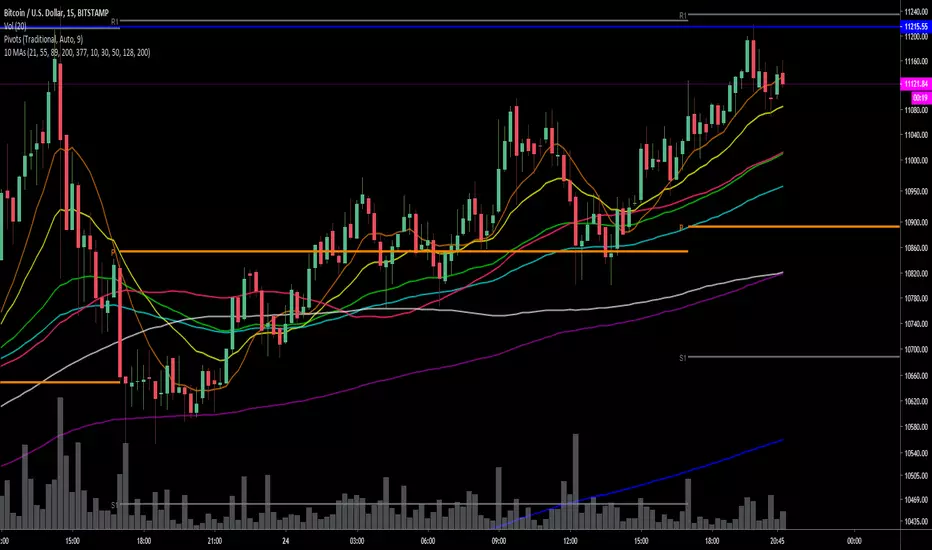
Krowns 10 PACK Combo (5 EMAs, 5 SMAs) - v2Version 2 - Krowns Crypto 10 pack moving average set - written by "Kick Back Time" also known as Mr.Scrogers Neighborhood
...after receiving a lot of likes from the first version I thought I would go ahead and put out the updated version that I've been using
There's a few things I've changed to make it easier to adapt to.
This set is very similar to what Krown uses - I rarely look at the 100 SMA, but I do like the 128 SMA, so I made it default over the 100...
It's all adjustable in values, colors, line thicknesses, etc... it's all good
Tweeks/Improvements:
1) now has a shorter overlay title so it takes up less space on the chart and is less distractive
2) the 30, 50 and 128 SMA's are now default pink which stand out well and are easier to associate as SMA's
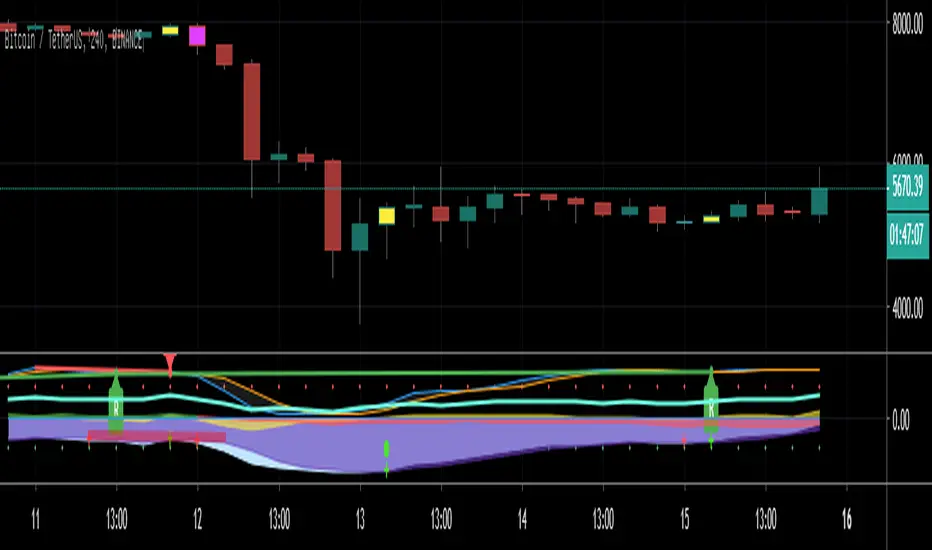
LOTUS BTC TRADERWelcome to the LOTUS BTC TRADER.
How to use:
This indicator only works on the BTC/USD or BTC/USDT 4 hour timeframe! Binance is recommended ( You don't have to trade on the binance chart but it it works best with this indicator).
Bull means the trend is moving up and Bear means the trend is moving down!
Alerts script is separate.

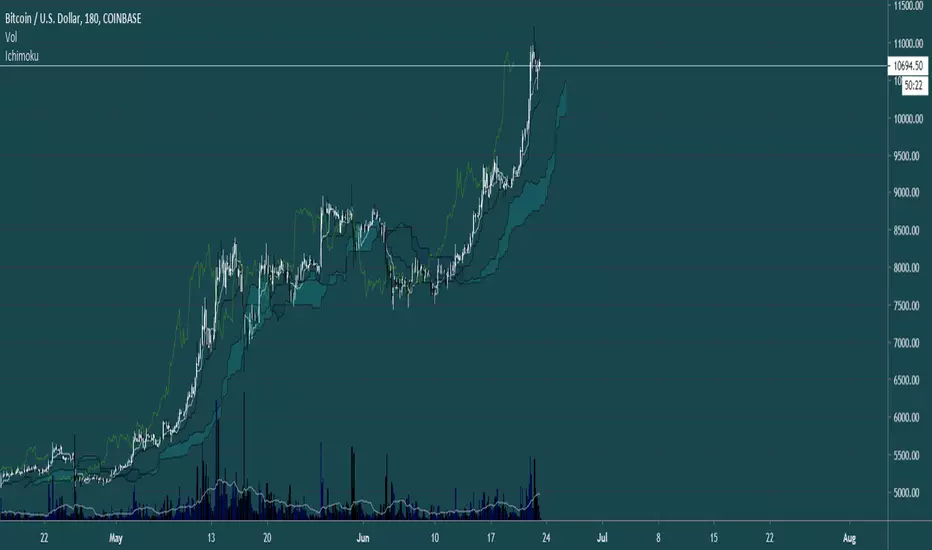
HTF IchimokuThis Indicator makes trading with ichimoku on different timeframes alot easier and more intuitive. It colors bars according to ichimoku trend and plots Kumo Breakouts and tk crosses.
tips are always welcome at: 38uGQJDDZDL6wX48x4gYTccPeQ3ZHVYmY4 ( btc )
Happy tradings :)
Ema BacktesterA simple, but useful script for backtesting purposes. Find the optimal Settings for your strategy.
tips are always welcome at: 38uGQJDDZDL6wX48x4gYTccPeQ3ZHVYmY4 (btc)
I hope you enjoy the script :)

HTF Heikin AshiThis script colors standard candles or bars according to the Heikin Ashi trend at that time. (Timeframe is adjustable)
tips are always welcome at: 38uGQJDDZDL6wX48x4gYTccPeQ3ZHVYmY4 (btc)
I hope you enjoy the script :)

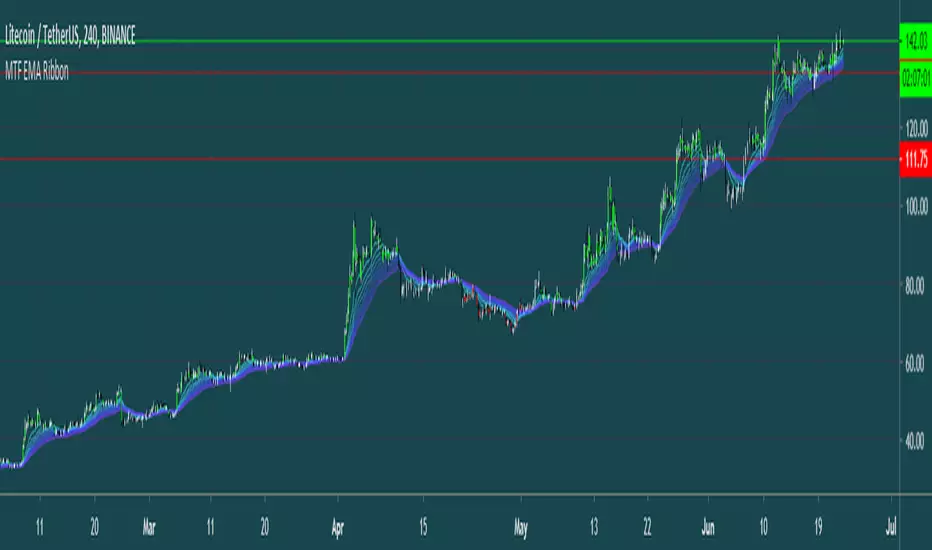
MTF EMA RibbonThis Script analyses trends using an EMA Ribbon (Can be adjusted to any timeframe).
tips are always welcome at: 38uGQJDDZDL6wX48x4gYTccPeQ3ZHVYmY4 (btc)
I hope you enjoy the script :)

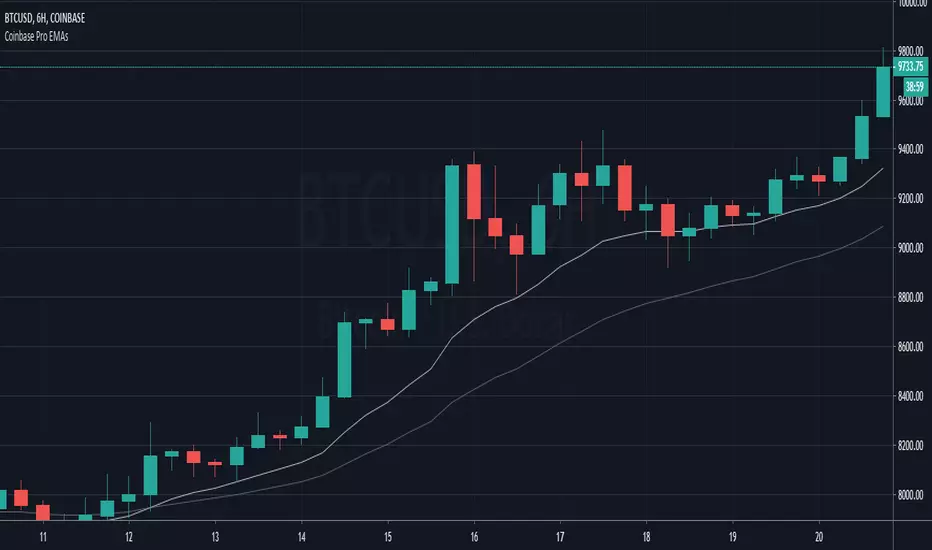
Coinbase Pro EMAsAn indicator to match the only overlays available on Coinbase Pro charts, the EMA12 and EMA26.
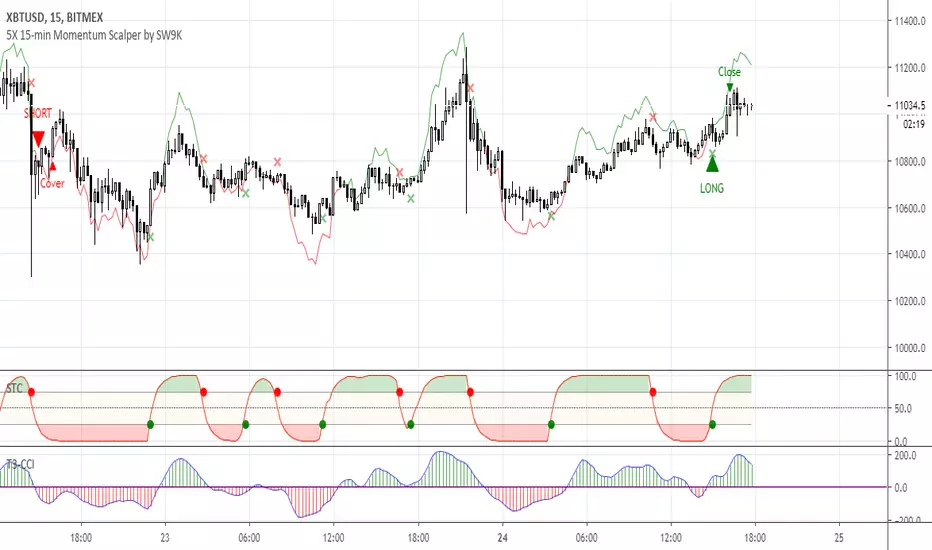
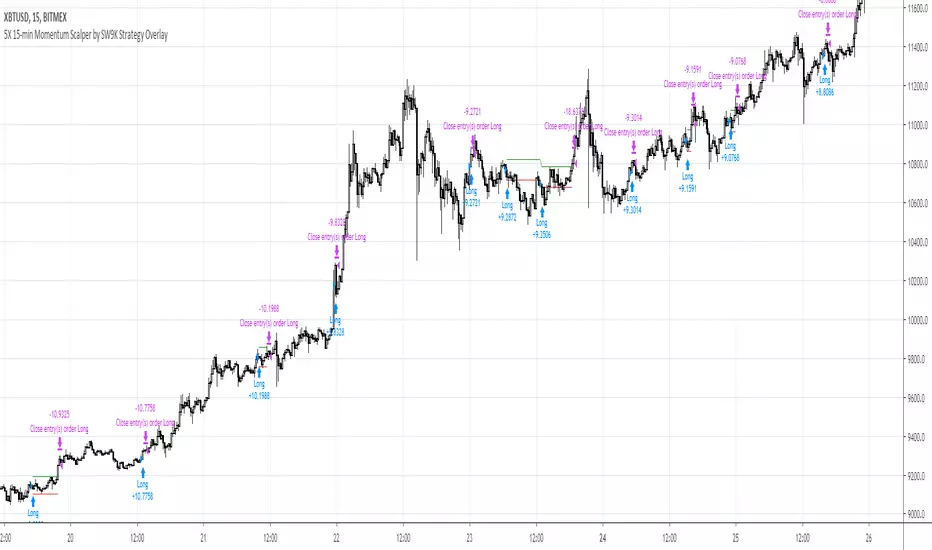
5X 15-min Momentum Scalper by SW9KThis is the alpha release-candidate study script with indicator alerts included. It is currently open for select individuals to test.
The core of this momentum scalper is primarily based on a modified Schaff Trend (which in itself is based on Stochastic elements and MACD) and a modified T3-CCI oscillator, specifically calibrated for 15-minute type movements -- do not apply to any other timeframes. Although it will take small scalps, it is designed to recognize when to ride out underwater positions so use maximum leverage or 5X or you may risk liquidation. Also, there is a stop loss setting feature, but it may reduce profits and win rate.
You can verify the highly accurate 75% win rate performance statistics with 100,000 XBTUSD contracts simulated at .
Features:
40% 3-month net profit, 74.48% win rate, 2.988 profit factor, 3.13% max drawdown, adjusted Sharpe ratio of ~3
Optimized for 15 minute timeframe scalping
Attempts to recognize when to keep position open and ride them out into profitable or breakeven
Profitable even with full Bitmex taker fees (0.075%)
Pyramiding Setting (default 3)
Aggressive Mode to increase entries and potential profits at higher risk
Easy-to-set binary Alerts
Follow SW9K at www.twitter.com
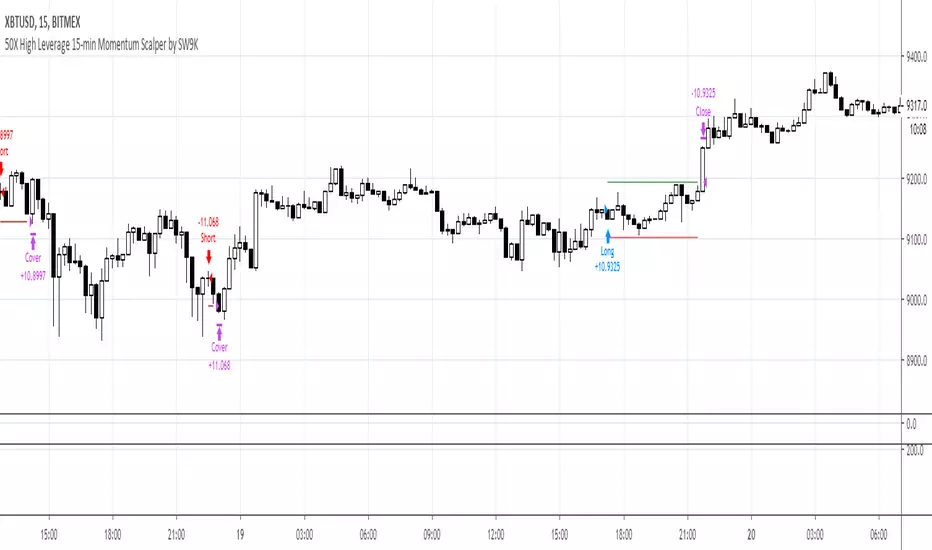
15MEX Momentum Scalper (5X)Working prototype to accurately scalp on the 15 min chart for $XBTUSD pair on BitMex. Designed to let winners run a bit, without any pre-set stop loss. Model is optimized to allow 5X leveraged underwater positions to recover into profitability. Do NOT overleverage with this strategy or you will be liquidated.
Simulated with trades since March 1, 2019, with 100k contract size entries.
Bitcoin Golden Ratio Multiplier FibonacciA Script based on the wonderful article by Philip Swift (@PositiveCrypto) "The Golden Ratio Multiplier - Unlocking the mathematically organic nature of Bitcoin adoption"
Please read article for understanding use.
Best used on Daily

15MEX Momentum ScalperAlpha product project in development. Uses a combination of MACD and T3-CCI with tweaked settings to catch directional momentum and scalp a small move. Strategy is quantity of trades over quality of trades to build profits.
Use this strategy for 15-min Bitmex scalping on XBT contracts only. Recommend 100k contract size or less; backtested with 100k contracts.
Market enter, then use post-only limit exits and stop losses.
Setting is pre-optimized for 0.5% tp target and 0.5% sl of entry price. Recommend default 3 bars as basis for confirming recent MACD crossover as well as default 0.618 Fibonacci ratio as the T3-CCI basis.
Default risk level setting is approximately 2-3 trades a day. You can double the amount to 4-5 trades a day by enabling Aggressive mode. This may lead to larger profits and more entries, but with more frequent stop losses.
Future version will include trailing TPs/stops. Still undergoing optimization and refinement.
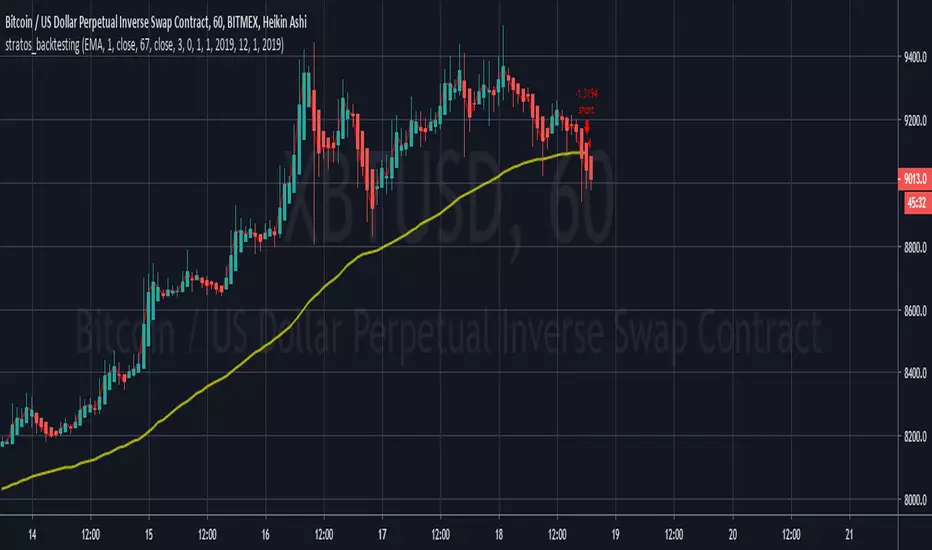
Stratos - Backtesting - Final Version - CryptoFoudid.comHi all,
Here you have the backtesting script based on Moving Average.
We trade automatically for our customers on the bitmex platform. For more information, contact me directly.
Cheers
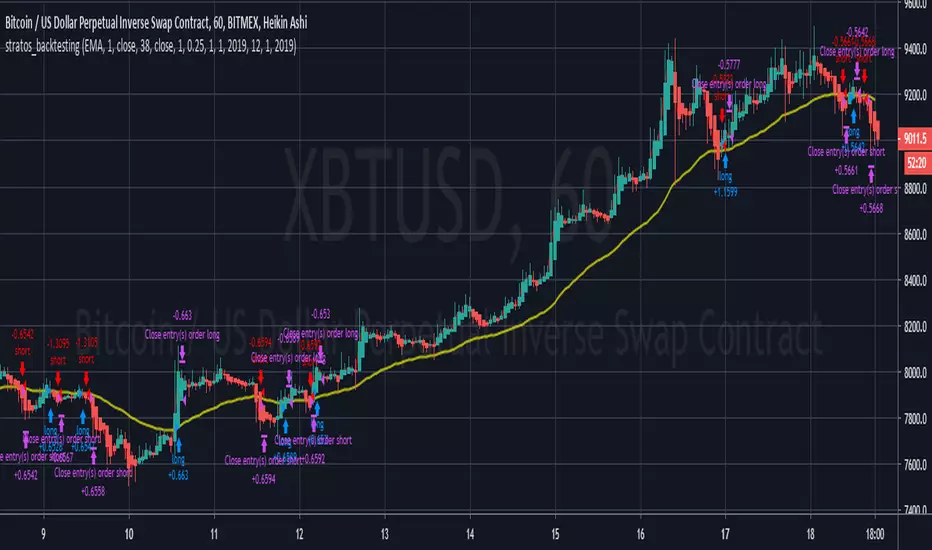
Stratos - Backtesting - Final Version - CryptoFoudid.comHi all !
Here a script based on moving averages with take profit and Stop loss configuration.
You can backtest on every timeframe and choose from when you want to backtest.
We work with our customers with automatic trading on bitmex platfform.
If you want to subscribe, you can dm me directly or on comments below
Helios - by @cryptomrdavis -
Helios is a simple to use oscillator.
It represent the state of different indicators at the moment. If you see a small green column, that means that only one or few indicators are getting into the positiv area, wait for higher bars to get into a trade. Same thing on the red bars side.
Calculation is based on few indicators like RSI , MACD , EMA , SMA and some more.
Happy trading
+++ use this tool on your own risk. i'm not responsible for your loses +++
Show some ❤
____________________________________________________________________________
BTC: 1GVRDK3HHr9CKM5SF2CGpCNXFuavB3L4j9
ETH: 0x7b825fa752b9926D3E8397cDb1d9E5473D074646
XMR: 41zL2SQS7zyZmwXKng2TeUWsMi5vMmkgSdDCjULUTvM6ichwm1E2ZDEYGt56zk9ghoM9bekhjycSwa8amtTcB2JiUet5jtg
NEO: AXja5xPDhczfm2ujHyBfpkQAAnMsXsazmb
ZEC: zcZzFkRx95cp7MtuW8wLhC5zz5RYF9QkT2uPPmhZZHc6ppXepHGgCSeAS1rtD6WFdqsM5p1gZm2gfirnrnviucsdP4aCpqU
XLM: GAXUQJSW55C7MAC4GI26NZUGIKSHFDVFRFKZCXPLMPY4HCADSDT55XK6
WAVES: 3PCMkNpMHxSraTCkwV1ENcBKa9sXbVCGjQX
BCH: qz57n04ud6mn42u00aymqkku8tfh0lk4jv9c28mjvv
____________________________________________________________________________
++++ cryptotradingresource.com ++++
____________________________________________________________________________

Gravity Swing Oscillator V1 - optimized for CryptoGravity Swing Oscillator V1 - optimized for Crypto
- Top & Bottoms
- Buy / Sell Signals on colorchanging LED Dots
- can show danger Price Dop Zones on Bars
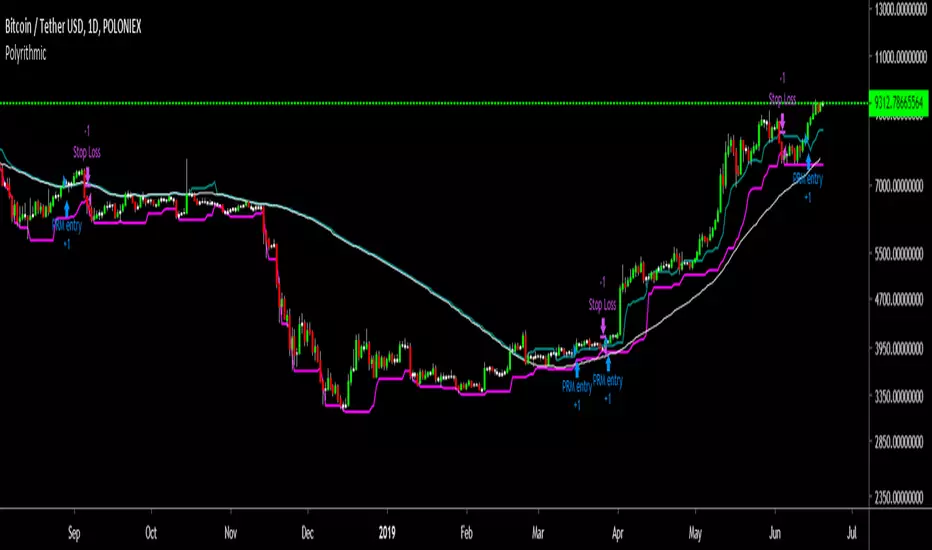
Polyrithmic Trend 2This script is designed to work on cryptocurrency.
This idea is to capture large amounts of the trend but to be able to get out when the support begins to break.
To use this script:
Buy signal:
- When the price is above the white moving average
- When the price goes over the buy line (higher / blue)
- When trading view says buy
Sell signal
- Move a stop up with the pink line and wait to be stopped out
Cyatophilum Altcoins Trader [ALERTSETUP]A generic Indicator built on Parabolic Stop And Reverse
Optimised for trading altcoins. Up to 8 automated alerts.
> > > READ HOW TO USE < < <
Get access to the Cyatophilum Indicators !

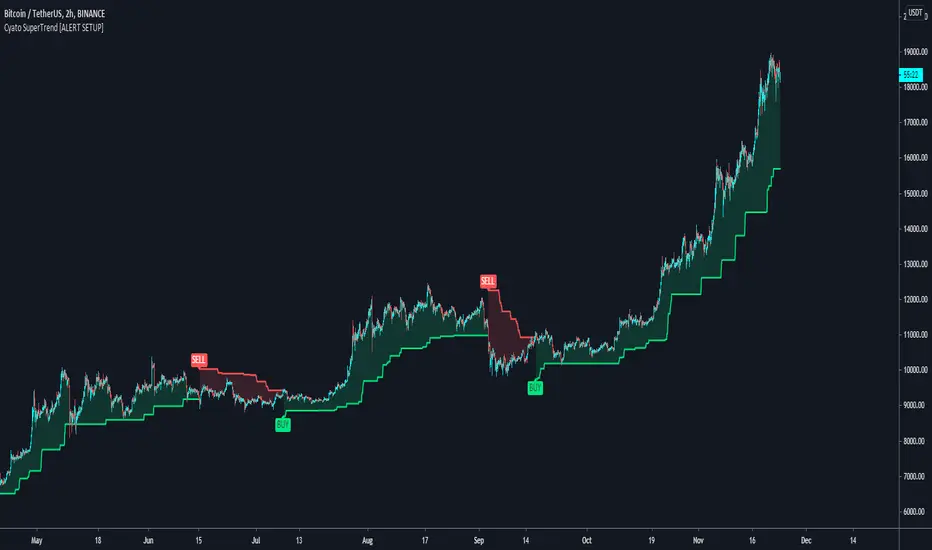
Cyatophilum SuperTrend [ALERT SETUP]Cyatophilum SuperTrend V1
A multi-timeframe indicator with Buy and Sell Alerts, built on ATR. (Averate True Range).
The SuperTrend line can be used as support when green, and resistance when red.
Reversals are strong buy/sell signals but perform badly in range markets.