SUPER RSI [Gabbo]RSI revolutionizes the classic RSI by allowing you to modify its behavior based on different chart types and dynamic multi-source calculations.
It’s designed for traders who want greater precision and adaptability in momentum analysis across various market conditions.
Whether you want to apply the RSI on alternative candles like Heikin Ashi, Renko, or even combine multiple data sources, this tool provides maximum flexibility.
🔷 Key Features
🟩Customizable Chart Inputs
Apply RSI calculations not only on traditional candles but also on alternative bar types like Heikin Ashi, Kagi, Line Break, Point & Figure, and Renko for a deeper understanding of trend strength.
🟩Multi-Source Aggregation
Blend multiple sources together to create a more stable and refined RSI signal. Combine 2, 3, 4, or even 5 different sources into a single input.
🟩Dynamic RSI and Bands
Unlock advanced options to dynamically adjust the RSI itself and its surrounding bands based on real-time price action.
🔷 Technical Details and Customizable Inputs
1️⃣ Bar Type Selection:
Choose the type of chart structure used for RSI calculation:
Candles (classic)
Heikin Ashi
Kagi
Line Break
Point & Figure
Renko
2️⃣ Use Different Source???
Activate multi-source RSI by combining multiple elements:
2 sources : (Source 1 + Source 2) ÷ 2
3 sources : (Source 1 + Source 2 + Source 3) ÷ 3
4 sources : (Source 1 + Source 2 + Source 3 + Source 4) ÷ 4
5 sources : (Source 1 + Source 2 + Source 3 + Source 4 + Source 5) ÷ 5
3️⃣ Use Dynamic RSI???
Enable a dynamic RSI calculation that adjusts in real-time to market behavior for greater responsiveness.
4️⃣ Use Dynamic Band???
Enable dynamic bands that adapt to price action rather than relying on fixed static thresholds.
🔍 How to Use Dynamic RSI Source Pro
📈 Choose Your Candle Type
Select the bar format that best matches your strategy needs—classic candles, Heikin Ashi, Renko, and more.
🧩 Customize Your Data Source
Activate multi-source input to create smoother, more reliable RSI signals.
⚡ Unlock Dynamic Adaptation
Enable dynamic RSI and bands to adjust automatically to live price movements and enhance signal accuracy.
☄️ With Dynamic RSI Source Pro, you can elevate your RSI analysis by applying it dynamically across multiple candle types and sources, giving you a new level of control and precision.
Relative Strength Index (RSI)

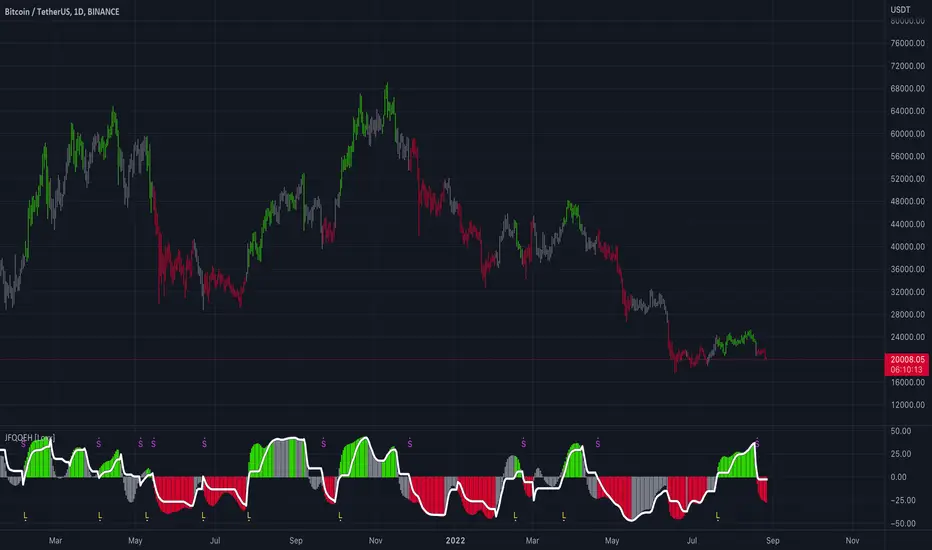
Koncorde PlusKONCORDE IS ONLY INTENDED TO BE APPLIED TO ASSETS WHERE VOLUME DATA IS PROVIDED.
This indicator is made up of 6 indicators: 4 trend (RSI, MFI, BB, Stochastic) and 2 volume. The 2's for volume are the PVI (positive volume index) and the NVI (negative volume index). These two indicators are the interesting ones as they are programmed to proportionally attribute the volume traded between the strong hands (sharks) and the weak hands (minnows).
As for what time period to use, the bigger the better, since after all what we are doing is data analysis and therefore the more data, the better.
When strong hands (blue histogram) are below zero, they are said to be selling while when they are above zero, they are said to be buying. The same goes for weak hands (green histogram).
Meaning of each zone:
Blue histogram: strong hand (sharks). If it is positive it indicates accumulation and if it is negative distribution.
Green histogram: weak hand (minnows). If it is positive it indicates buy and if it is negative it indicates sale.
Brown histogram: Indicates the trend and depends on previous values of weak hands and trend indicators (RSI, MFI, BB, Stochastic).
Red line: It is an average that smoothes the trend indicated by the brown histogram (default is the EMA).
Crossing Pattern
The pattern gives us a bullish entry signal when the trend (brown histogram) crosses above the average (red line) and is positioned bearish when the trend crosses below the average.
Zero Pattern
When the price trend (brown histogram) tends to zero, it means that there will be a change in its trend. This pattern is for trading in a bullish position.
Spring Pattern
When a cross between the average (red line) and the trend (brown histogram) has already occurred, and in addition the weak hands are above the price trend, that "spring on the mountain" is formed that gives us to understand that the upward trend will be more than evident.
Mirror Pattern
This pattern occurs when there is panic in the market and weak hands are selling (below zero). If at that moment the strong hands are buyers, the price tends to level off to begin the rise later.
This pattern is compatible with the Crossover Pattern, having more guarantees of success. If just after finishing the mirror pattern, the Crossover Pattern plus the Spring Pattern appears, then we have a good chance of winning.
Bear Hug Pattern
This pattern is for bearish positions only. It is the opposite figure to the mirror pattern. That is, we have strong hands clearly selling and weak hands clearly buying and above the price trend (brown histogram). It is the figure where you can see that the strong hands are distributing the assets to the weak hands.
Harpoon Pattern
If when the mirror pattern occurs, the red line crosses the blue histogram, a very strong bullish entry signal is produced.
Add an exit signal which occurs when we are in a spring pattern but the big hands start selling, mostly coinciding with the start of the bear hug pattern.
General rules for operating the Mirror Pattern:
a) Wait for the green histogram to start recovery, rise to positive values; if possible, until it crosses from bottom to top the brown line (brown histogram) and/or red average .
b) The blue histogram should be consistently positive. If it turns and goes towards negative values it can indicate a failed pattern at that same point.
c) Locate the low of the lower candle within the pattern and place the Stop Loss just below it for reference.
d) If we are not sure (we almost never will be) that there will be a turn or if it could finally be a bearish continuation we can use the SL to go short .
Additional:
A panel with performance statistics of the analyzed asset was added.
Added an indicator that shows the cumulative delta volume in the form of triangles at the top of the chart.
Added of user @DonovanWall
PS: Unofficial version, I was guided by the description of the BLAI5 author's website www.blai5.net
DISCLAIMER: For educational and entertainment purposes only. Nothing in this content should be interpreted as financial advice or a recommendation to buy or sell any sort of security or investment including all types of cryptos. DYOR, TYOB.

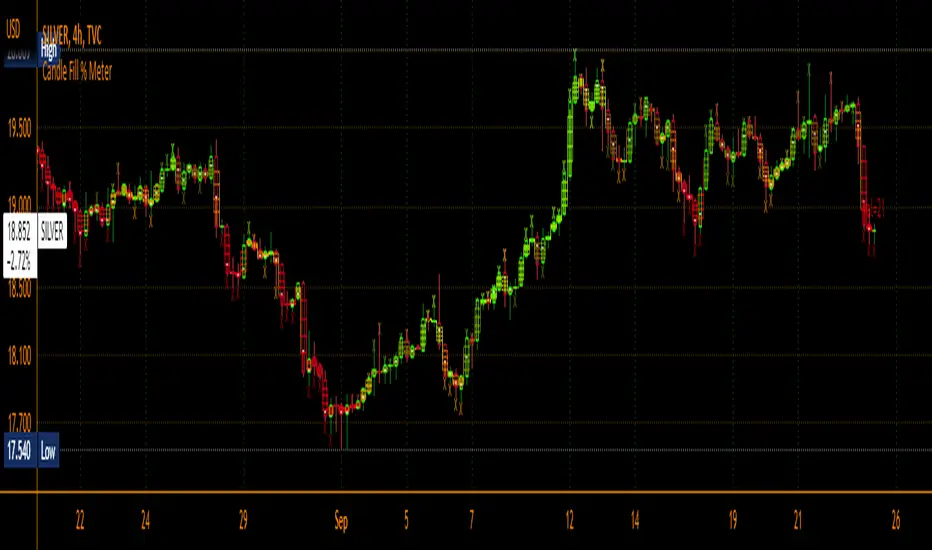
Candle Fill % MeterFor use with Hollow Candles
Fills Candles based on either the value of the RSI or coppock scaled to fit properly between the open and close. Makes for a compact visual with lot's of information given. Toggle bells and whistles in settings such as arrows to indicate the direction of the value being measured, dividing levels, fill from candle open all the time instead of the bottom up and more.
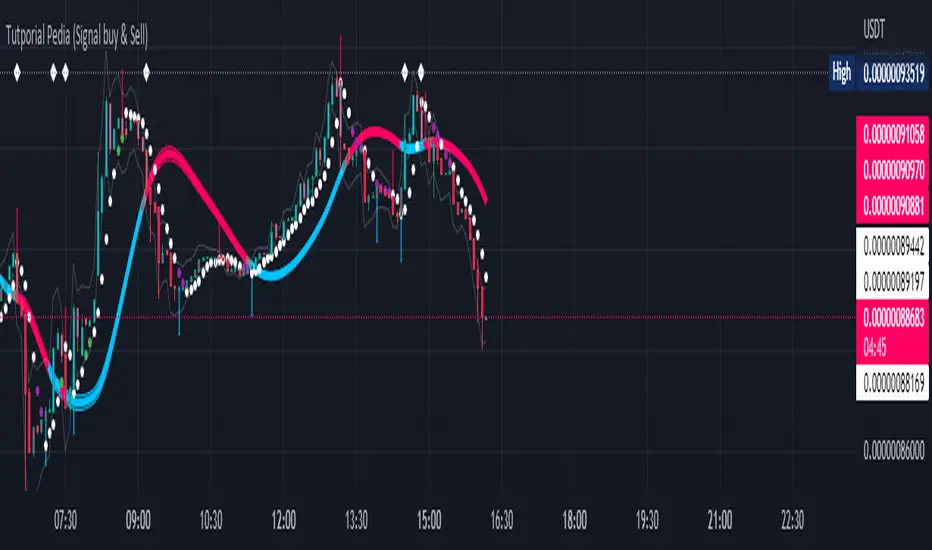
Tutporial Pedia (Signal buy & Sell)Untuk mempermudah kita dalam bermain dan memahami Signal Trade View Rate 98 %
RSI+ by Wilson (alt)Extension of the excellent RSI+ script by Wilsonlibero. I tweaked the parameters to better fit crypto markets, and I added a few more visuals, such as midline, overbought/oversold threshold lines and areas, background coloration depending on RSI trend above or below midline, and a few other tweaks especially colors (fixed the transp parameter deprecation for example). The color theme is by default more optimized for dark mode charts, but all colors can be configured, and all drawings can be enabled/disabled/tweaked in the parameters.
I'm just giving back to the community since I could modify this script only because it was open-source. If you like this script, please don't give me any credit, but please show some love to the original author Wilsonlibero:

TDI w/ Variety RSI, Averages, & Source Types [Loxx]This hybrid indicator is developed to assist traders in their ability to decipher and monitor market conditions related to trend direction, market strength, and market volatility. Even though comprehensive, the Traders Dynamic Index (TDI) is easy to read and use. This version of TDI has 7 different types of RSI, 38 different types of Moving Averages, 33 source types, and 5 types of signals as well as alerts and coloring. Default RSI type is set to Jurik's RSX. This indicator can be used on any timeframe.
Green/Red line = RSI Price line
White line = Trade Signal line
Dark Green/Red lines = Volatility Band
Yellow line = Market Base Line
Gray dashed lines = Horizontal boundary lines, oversold/overbought
5 Signal Types w/ Alerts
Signal Crosses = Green/Red line crosses over or under White line
Floating Boundary Crosses = Green/Red line crosses over or under upper Dark Green/ lower Red lines
Horizontal Boundary Crosses = Green/Red line crosses over or under Gray dashed upper/lower lines
Floating Middle Crosses = Green/Red line crosses over or under Yellow line
Horizontal Middle Crosses = Green/Red line crosses over or under Gray dashed middle line
Manual Signal Types (no alerts included, this requires manual analysis)
Volatility Band Signals (Dark Green/Red lines) = When the Dark Green/Red lines are expanding, the market is strong and trending. When Dark Green/Red lines are constricting, the market is weak and in a range. When the Dark Green/Red lines are extremely tight in a narrow range, expect an economic announcement or other market condition to spike the market
Beyond these simple signal rules, there are various other signals or methods that can be used to derive long/short/exit signals from TDI included slope of the Green/Red line and bounces off the Yellow line.
Included
Loxx's Expanded Source Types
Loxx's Variety RSI
Loxx's Moving Averages
Signals
Alerts
Bar coloring
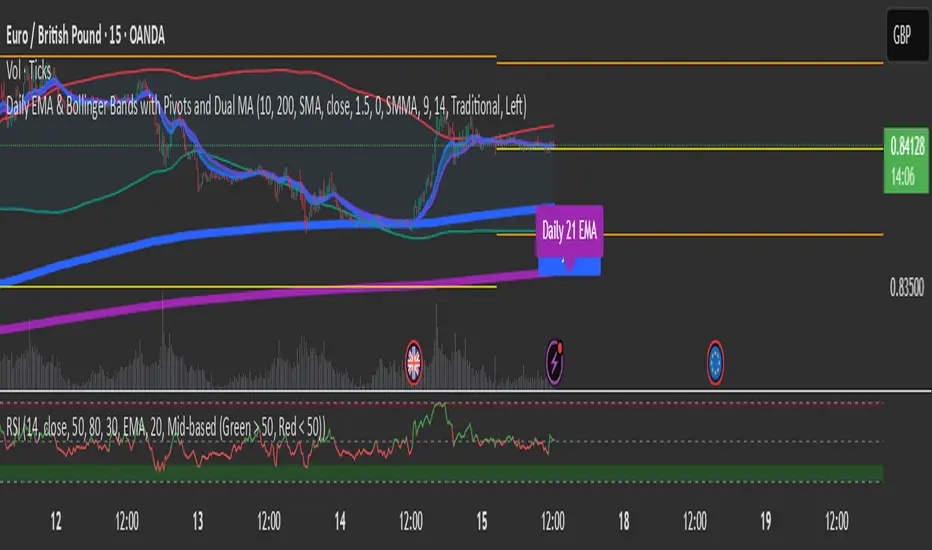
RSI mid partition color changeWhen RSI is above 50 our default bias is on buy side and when below 50 our bias is on sell side.
Therefore created 2 zones for easy identification.
Price Action in action
What?
Price Action in Action is an indicator to help Price Action learners and practitioners to get everything related for Price Action in one place.
Price Action is:
Price + Volume = Action
In this indicator, we have the following features available:
Support/Resistance
Using the RSI with different periods in a multiple of 7 (7, 14, 21, 28), we first determine the overbought (above 70, customizable) and oversold (below 30, customizable) regions. Then we pick up the highest point and lowest point in the RSI values in the overbought and oversold regions, respectively. These are the point, historically supply/demand emerged for surety to push down/up the RSI indicator and the corresponding price. So, these are the most accurate way, we believe, to draw support/resistance (or demand/supply) in the chart. By default, the Support is green color and Resistance is red color. To give a visual representation, we differentiate the different shades of green and red. For example, for Level-1 (i.e. 7 by default) we use the darkest shade (0 transparency) and Level-4 (i.e. 28 by default) we use lighter shade (60 transparency). Note please: you can customize the color of support and resistance lines (say if you want resistance as green and support as red). The respective shades (transparency) will be automatically adjusted accordingly. But those shade (transparency) levels are not customizable, they are fixed (please bear with it for version-1 at least).
Strength of Support/Resistance
In the chart above/below the Resistance / Support lines you can see the tiny labels with some numbers like 1, 2.
We found out how many times a particular support/resistance is appearing across multiple RSI periods. E.g. if price P1 appears 2 times among 4 different RSI periods, the number will be 2 for that calculation, and so on.
There can be multiple presence of these numbers in a support/resistance line (i.e. multiple tiny labels). Something like: 1, 1, 2 (into different candles). This means the same support/resistance is tested so many times in different occasion (means there is a RSI max/min coincides in this level over multiple occasions) at different candles.
This will help you to intuitionally gauge the “strength” of a support/resistance line.
The more the marrier, unworthy to mention.
Candle Stick Patterns
Well: we don’t need to tell anything about the Candlestick. All of you know it better than us. And it’s a time proven, zero-lag mechanism to judge the Price-Action is unfolding in the market. We do not know if there is anything better possible than this time tested patterns to judge the prevailing sentiments of market.
Price-Action does not complete without finding out the Candlestick Patterns correctly.
And in this indicator your will get all of these: Single Candle such as Doji (default off), Marubozu, Spinner, hammers, inverted-hammer etc. ; 2 candles like Tweezer, Inside Candle, Engulfing; 3 candles like morning star/evening star.
In the multi candle patterns (2/3 candles), we are grouping the candles with a dotted rectangle such that it is clear which 2/3 candles are part of the pattern. E.g. Morning Star: 3 candles are grouped in a dotted rectangle and the Morning Star label will come to the latest candle (3rd most – as the pattern is detected reliably only on the completion of the 3rd final candle).
Of course, any program can not eliminate your trained eyes and brain to capture the patterns. But we have provided sufficient knobs to adjust various parameters to tweak the candle-pattern detection. Such as Strict Inside Candle(Harami) Boolean knob where the whole current candle including wicks will be inside the body part of the previous big candle. For non-strict mode, the current candle just inside the previous candle, possibly by wicks.
To make it better usable, for every such knobs (which are not obvious) we have added user-friendly tooltip (just mouse hover the question mark (?) besides the control/switch). There are plenty of it.
Volume
Here we have a rudimentary (yet effective) way to judge the volumes.
We find out the Volume Weighted Moving Average (VMWA) of the 20-period (default, but customizable) and the latest volume. If the latest volume is more than the 20 period vwma, we just add a grey diamond on the top of the candle to denote it’s attracting volumes. Of course, we provide a Weight coefficient (default is set to 1). So if the current bar’s volume on bar’s completion is more than the 20 period volume vmwa times the weigh-cofficient, we mark it with a tiny grey diamond.
Points to be noted:
In all places we mark the indication only on the completion of the bar (technically speaking we have checks, as far as possible, with barstate.isconfirmed). However, if you wish, you can turn it off for Candlestick (as some experts may want to check candlestick on the real time, even before the closing of bars).
In case if you see the chart looks cluttered (because of many information, specially in smaller timeframes like 5 min), there are controls given in the settings to toggle each and every features.
By default, we turn off Doji candles (all 3 types of Doji’s – normal, Gravestone & Dragonfly) as they are mainly indecision. However, you can toggle it to turn it on.
It does not give you any Buy/Sell call. The interpretation it does not have.
Why?
What’s unique in it?
As we already mentioned our intention is to include Price (in forms of Support / Resistance), Volume and Action (sentiments in terms of Candlestick patterns) into a single place. And so far, to the best of our knowledge, we could not come across a single indicator provides all of these.
There were works available to determine the RSI based support / resistance zones. Those are great piece works at that time (lets say 3 years back when PineScript was in earlier versions). To the best of our knowledge those does not cover up finding out the lowest / highest point of RSI and the corresponding price to get the simplistic and distinct support/resistance lines.
We have the intuitive support/resistance strength included which we could not found out in current set of available indicators.
To the best of our knowledge, there seems no indicator can detect 3-candle patterns which are extremely popular to detect trend reversals (such as Morning Star or Evening Star). Moreover for the multi-candle patterns we are grouping the candles part of the pattens (2-candles or 3-candles) using a dotted rectangle such that it’s visually clearly (and a well educative material for Price-Action learners also).
Mentions:
There are many works which inspire us along the way. Honestly: we sometimes forgot which all indicators we experimented with. We are sincerely apologetic in case we forgot to mention. A few note-worthy:
There is an indicator from user “repo32” named as “Candlestick Patterns Identified (updated 3/11/15)”. (We could not be able to contact “repo32”). We are inspired from his work that it’s feasible to detect Candlestick patterns.
There is an awesome work done by “RSI Based Automatic Demand and Supply” by user “shtcoinr”. The idea of consulting multiple RSI levels to find out the demand/supply zone we inspired from him. (We did contact “shtcoinr” and got his kind permission to use the concept.)
We are greatly thankful to these abovementioned wizards for their pioneering a-prior work in this front.
And of course, this TradingView platform to provide this abstraction, facilitates and felicitates collaborative contributions.
Ultimately, what’s for you?
That’s the main question. What’s for you?
Price-action comprises of following 3 tasks (at least):
Draw support/resistance lines in the chart.
Once price reaches at the support/resistance line, you fervently look out the candles’ formation to mentally map to the candle patterns. Your aim is divine: You want to judge if the price-action will continue or take a rejection/reversal.
Then you double-confirm with the volume (in a non-overlaid chart below).
Finally take a trade.
For a price-action newbie or seasoned, expert practitioner, you must be doing all the above tasks regularly and manually, in a mechanical, mundane way. There come the humanly subjectivity & the inevitable emotions . This indicator, being a piece of program/code in PineScript latest version v5 , eliminates (or at least, reduces to a great extend) that subjectivity & emotions out of the way of decision making . Thus resulting better yield.
Of course, you can argue that you draw slanted trend lines also. We recommend an already existing indicator by user LuxAlgo named as “Trendlines with Breaks ”, if you wish so.
Disclaimer:
This piece of software does not come up with any warrantee or any rights of not changing it over the future course of time.
We are not responsible for any trading/investment decision you are taking out of the outcome of this indicator.
Happy trading.

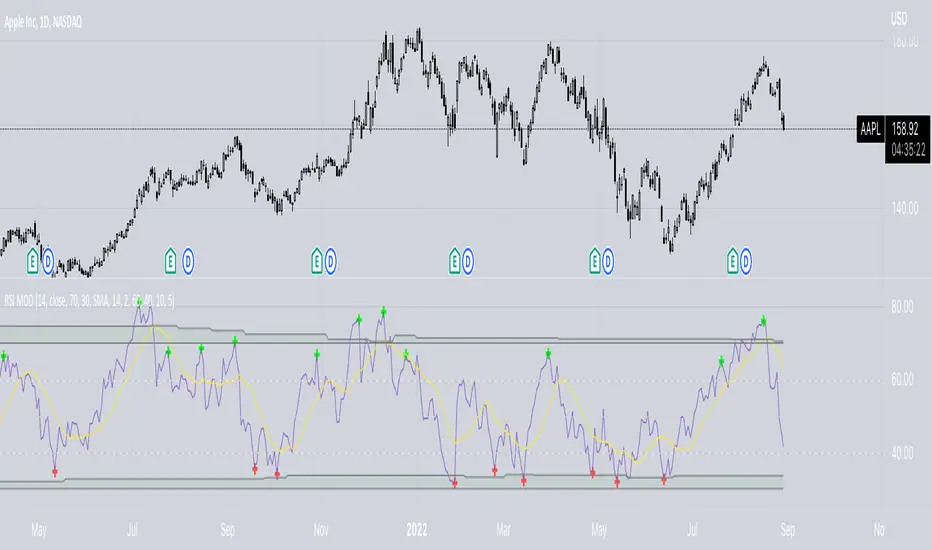
RSI ModifiedThe RSI is an excellent indicator for determining when equities are overbought/oversold. Though I believe there is a shortcoming in using the 70/30 levels since they are static and do not adjust for when an equity is trending. It stands to reason that in a downtrend, the overbought might be less than 70 and the oversold less than 30—Vice versa for a bull trend. Using the built-in function of pivots, I have attempted to create overbought/oversold lines that adjust with the trend. Leaving the 70/30 lines on the indicator also helps visualize the equity trend. All pivot settings are adjustable in the input menu. The pivot limits serve as a filter for recording pivot points. For example, with an upper pivot limit of 60, only pivots greater than 60 will be recorded into the array used to determine overbought. The crosses represent which values are used to determine overbought/oversold and do not provide timely indications.
Visual RSI {bebaps}Visual RSI
This script provides a visual way to view RSI data. Sometimes it may be useful to view RSI data on the price chart instead of in a separate pane. This script enables the following configurable options:
Plot shapes on the chart during key RSI events such as: crossing above or below the overbought or oversold level
Color bars based upon the current value of the RSI, such as: RSI currently oversold, or RSI currently between overbought and 50
All options are configurable. This is not meant to serve as a replacement for having the RSI on your chart, but it will make it easier to highlight key data points in real time.

smoothed_rsi
Description:
A well-known and vastly used momentum indicator, a Relative Strength Index (RSI) by J. Welles Wilder Jr., aims to evaluate the current price to its oversold/overbought area while giving an overview of bearish/bullish momentum. In this indicator, simply adding the super-smoother function (John F. Ehlers) was applied to the RSI line to create a more smoothed line and reduce its noise.
RSI:
RSI = 100 - 100/(1+RS)
RS = AvgUp/AvgDown
super_smoother(rsi)
Notes:
RSI > 70 indicates overbought
RSI < 30 indicates oversold
direction of the RSI line
Juirk-Filtered QQE Histogram [Loxx]Juirk-Filtered QQE Histogram is a QQE indicator with 7 different RSI types, Jurik-Filtering with the option of double filtering. 2 types of signals, and Loxx's Expanded Source types. These additions are useful to filter out noise.
What is Qualitative Quantitative Estimation (QQE)?
The Qualitative Quantitative Estimation (QQE) indicator works like a smoother version of the popular Relative Strength Index ( RSI ) indicator. QQE expands on RSI by adding two volatility based trailing stop lines. These trailing stop lines are composed of a fast and a slow moving Average True Range (ATR).
There are many indicators for many purposes. Some of them are complex and some are comparatively easy to handle. The QQE indicator is a really useful analytical tool and one of the most accurate indicators. It offers numerous strategies for using the buy and sell signals. Essentially, it can help detect trend reversal and enter the trade at the most optimal positions.
What is Jurik Volty used in the Juirk Filter?
One of the lesser known qualities of Juirk smoothing is that the Jurik smoothing process is adaptive. "Jurik Volty" (a sort of market volatility ) is what makes Jurik smoothing adaptive. The Jurik Volty calculation can be used as both a standalone indicator and to smooth other indicators that you wish to make adaptive.
What is the Jurik Moving Average?
Have you noticed how moving averages add some lag (delay) to your signals? ... especially when price gaps up or down in a big move, and you are waiting for your moving average to catch up? Wait no more! JMA eliminates this problem forever and gives you the best of both worlds: low lag and smooth lines.
Ideally, you would like a filtered signal to be both smooth and lag-free. Lag causes delays in your trades, and increasing lag in your indicators typically result in lower profits. In other words, late comers get what's left on the table after the feast has already begun.
Included:
Loxx's Expanded Source Types
Alerts
Signals
Bar coloring
Included Libraries
Loxx's Variety RSI
Loxx's Jurik Tools
Loxx's Expanded Source Types
Related indicators:
Natural Market Mirror (NMM) and NMAs w/ Dynamic Zones
RSI/RSX QQE Histogram w/ Discontinued Signal Line
Jurik CFB Adaptive QQE
Adaptive Qualitative Quantitative Estimation (QQE)
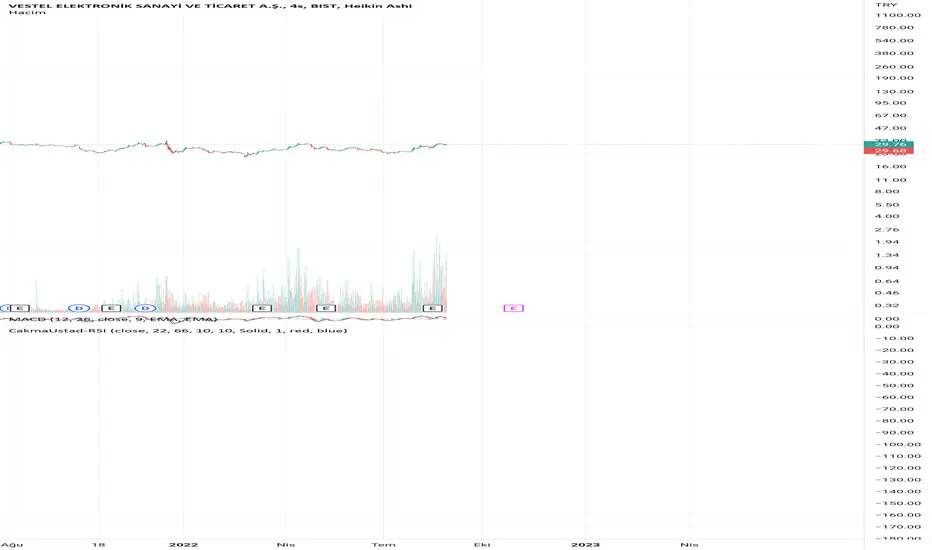
Crypto Force IndexIntroduction
The Crypto Force Index (CFI) indicator helps us understand the current strength and weakness of the price. It is very useful when used on high timeframes for investment purposes and not for short term trading.
To determine the strength and weakness of the price, a level grid based on the RSI indicator is used.
Based on the RSI value, red circles (oversold condition) and green circles (overbought condition) appear under the price candles. The more intense the color of the circles, the more that the current price is in an overbought or oversold condition.
The signal levels are all configurable to adapt the indicator across multiple instruments and markets.
The default configuration have been designed to obtain more accurate signals on Ethereum and Bitcoin, using the weekly timeframe.
Why Crypto Force Index?
The Crypto Force Index (CFI) is the consequence of my study of investments based on the accumulation plan. I wanted to demonstrate that I am improving the returns of the classic DCA ( dollar cost averaging ) and VA ( value averaging ).
After finding my own model of an accumulation plan, I decided to create the Crypto Force Index to help me visually enter the market.
The formulas of the indicator are very simple, but my studies confirm the power of this tool.
How are the signals to be interpreted?
The Crypto Force Index helps us to highlight the overbought and oversold areas, with the use of circles under the price of candles and with a thermometer inserted at the base of the graph, where all the phases of strength and weakness are highlighted.
As soon as the red circles start to appear on the chart, that may be a good time to enter LONG to the market and start accumulating. If the circles are green, we can consider decreasing the current exposure by selling part of your portfolio, or decide to stay flat.
I personally use these signals on the weekly timeframe, to decide to feed my accumulation plan at the beginning of each month.
I hope it can be of help to you! Please help me improve the Crypto Force Index! :)

RSI based support resistance levelsThis indicator draws support line and resistance lines in the price chart.
How ?
For drawing the support/resistance line we need to first determine the demand and supply.
We are using too-familiar indicator RSI to determine when the script is oversold and overbought.
Now oversold (in RSI) is not a point, it’s a zone. The RSI indicator comes below 30, stays there and goes up above 30. Similarly for overbought.
Now if you carefully look at the oversold region – the lowest point of the oversold region is the place where the demand came (for surety) and push the indicator (and price) up.
Similarly: the highest point of overbought is the place where (for surety) the supply came and push the indicator (and price) down.
So that’ the supply / demand line (for surety).
In this indicator, based on the RSI we are just drawing support and resistance lines in the chat. That’s all.
What is unique ?
Trendline concept is not new. RSI is not new. RSI overbought/oversold is not new.
There are indicators exist to draw trendlines. Some of them works beautifully.
However, none of these, we are aware of, uses RSI to determine it. And, we believe, the most logical way to determine support/resistance is RSI.
Note: We are not responsible for any trading/investment decision you are taking out of the outcome of this indicator.

Simple Buy Sell SignalsIt is a simple indicator that provides buy or sell signals based on the intersection of two EMAs and a simple moving average (SMA). once the Relative Strength Index has confirmed it. For greater accuracy, add additional indicators like stochastic RSI, MACD, etc. Use only for intraday trading, Not for Positional Trading

RSI OS/OS Levels MTFThis plots the overbought and oversold (70 and 30) levels from RSI on price, there are often levels where a market will bounce or retrace/reverse.
By default it shows 15 min, 60 min and 4 hour levels but I intend to make these configurable along with some other stuff. For now it works how I use it, nice and simple

RSI TrendRSI Hull Trend is a hybrid indicator with RSI of HULL Signal. The Hull MA is combined with RSI to see if the Hull MA Buy/Sell Signal is in overbought or oversold condition. Buy Sell Signals are plotted based on settings of OB/OS or RSI. This indicator is very useful to see if the Trend is in Exhaustion or Beginning of a Trend. Entry and Exit conditions can be more precise based on OB/OS condition of price action. In addition normal RSI trend is plotted with trend color from Hull MA. Best Performance with Heiken Ashi Candles.
OB/OS Settings provided
Hull Buy/Sell Signals plotted
Double RSI FAST and DEFAULT signal with crossover
Bar Color applied based on Hull RSI Trend
Hull Trend + RSI + Price Action

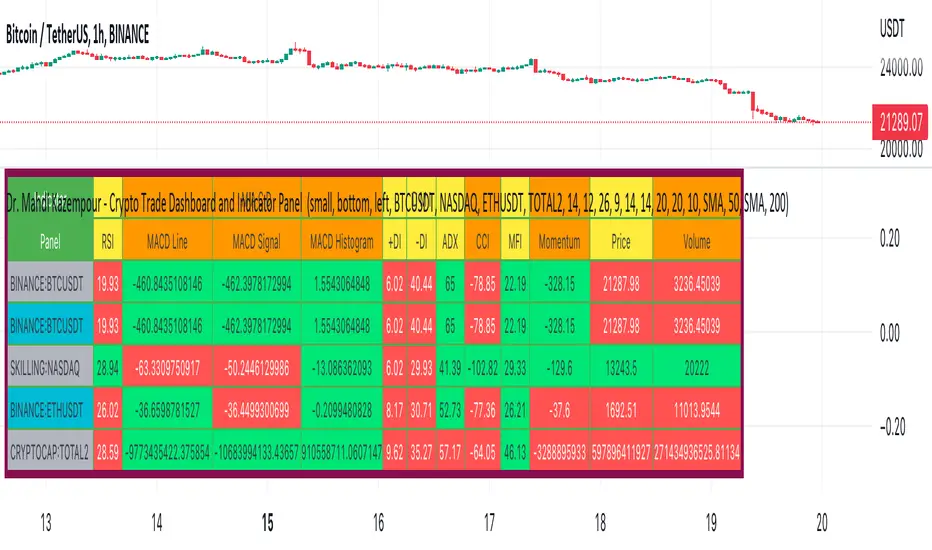
Dr. Mahdi Kazempour - Crypto Trade Dashboard and Indicator PanelA great panel for crypto traders all in one table:
Price, Volume, RSI, MACD, ADI, MOM
1) current symbol
2) BTCUSDT
3) NASDAQ
4) ETHUSDT
5) TOTAL2
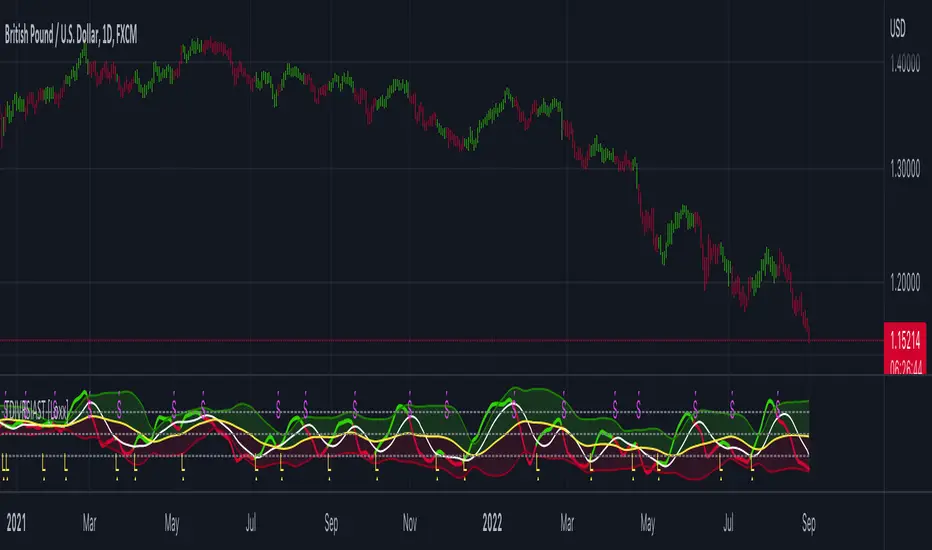
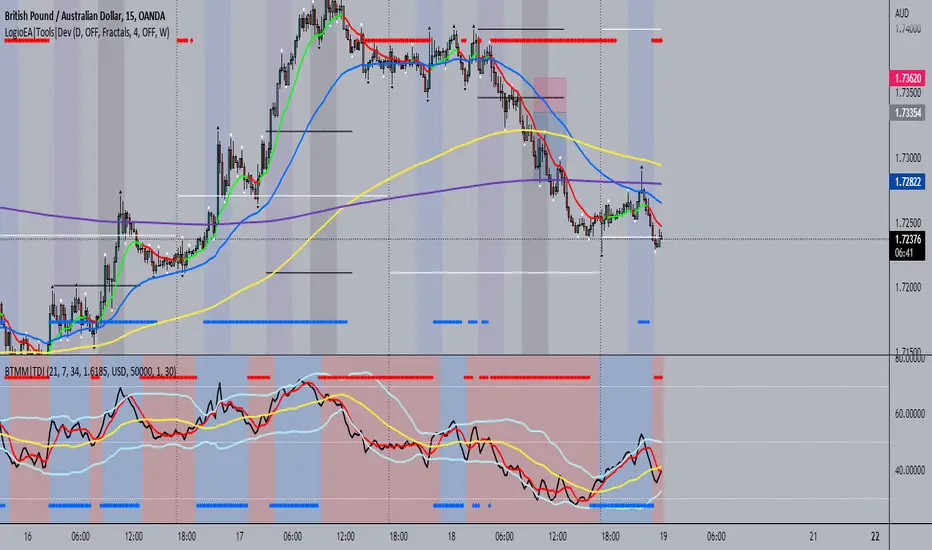
BTMM|TDIThis is the trader's dynamic index inspired by Steve Mauro's BTMM strategy.
In addition to the RSI, Trendline, Baseline, Volatility Bands I have also included additional trend biases that are painted in the background to provide more confluence when the markets break out in either direction.
For convenience, a position size calculator is included for all users to quickly calculate lot sizes on forex pairs with difference account balance currencies. The calculator works accurately on forex pairs. DO NOT USE for crypto or indices as some brokers have unique contract sizes that could not be fully incorporated into the tool.
There is also data table that displays historical values of the RSI, Trendline, Baseline, and an EMA vs Price scoring procedure that covers the current candle (t0) and up to 3 candles back. The table is meant to provide a snapshot view of either bullish or bearish dominance that can be deciphered with a quick glance.
Rsi/W%R/Stoch/Mfi: HTF overlay mini-plotsOverlay mini-plots for various indicators. Shows current timeframe; and option to plot 2x higher timeframes (i.e. 15min and 60min on the 5min chart above).
The idea is to de-clutter chart when you just want real-time snippets for an indicator.
Useful for gauging overbought/oversold, across timeframes, at a glance.
~~Indicators~~
~RSI: Relative strength index
~W%R: Williams percent range
~Stochastic
~MFI: Money flow index
~~Inputs~~
~indicator length (NB default is set to 12, NOT the standard 14)
~choose 2x HTFs, show/hide HTF plots
~choose number of bars to show (current timeframe only; HTF plots show only 6 bars)
~horizontal position: offset (bars); shift plots right or left. Can be negative
~vertical position: top/middle/bottom
~other formatting options (color, line thickness, show/hide labels, 70/30 lines, 80/20 lines)
~~tips~~
~should be relatively easy to add further indicators, so long as they are 0-100 based; by editing lines 9 and 11
~change the vertical compression of the plots by playing around with the numbers (+100, -400, etc) in lines 24 and 25

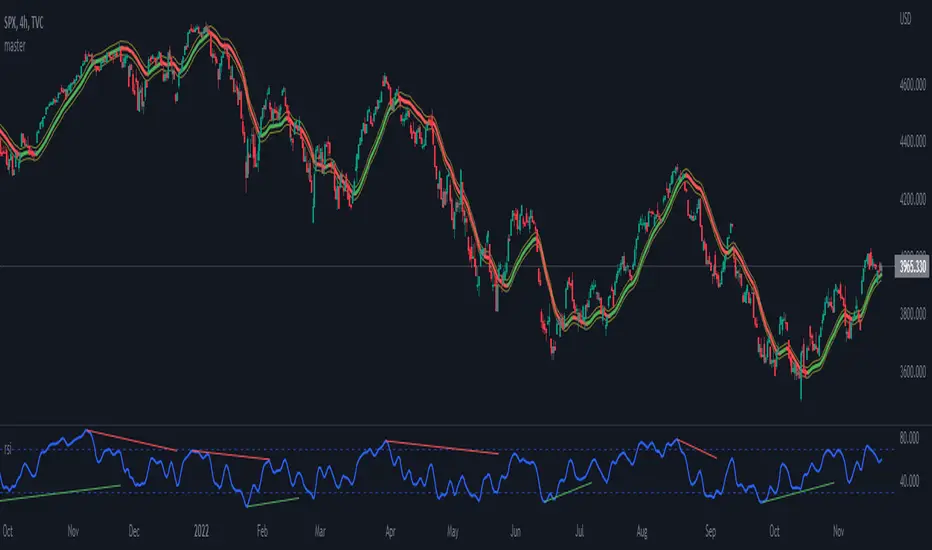
Normalized MACD with RSI [bkeevil]This indicator normalizes the MACD and RSI indicators to a range between -1.0 and 1.0 so they can be displayed together on the same chart to save screen real-estate.
While the MACD is a good indicator to detect trend changes, in some circumstances (such as a sideways range market) it can give false signals. The MACD is more likely to give a false signal when the RSI indicator is close to the centerline than if the RSI is signaling an overbought or oversold condition. Thus the RSI indicator and MACD indicator are commonly used together.
I have included a few features found in other MACD indicators that I have found helpful:
MACD line changes color if it is rising or falling
Dots at the MACD line to signal crossovers
The MACD signal line is hidden it by default as the information it contains is redundant. Hiding the signal line makes the indicator less busy.
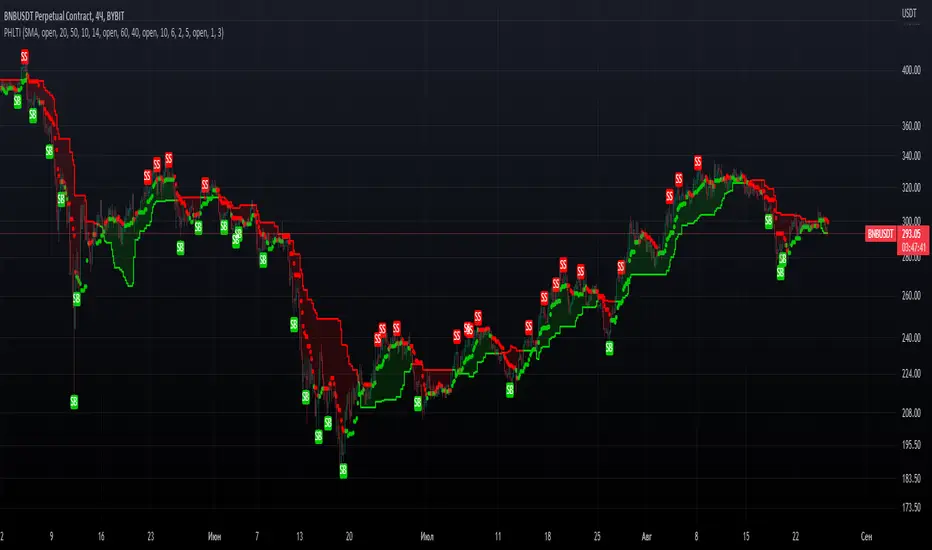
PrevHighLow Trend IndicatorPrevHighLow Trend Indicator which is calculated by using prev lowest and highest of p1 -period and p2 -period for two MAs.
First MA is made of prev highest of p1-period / prev lowest of p1-period.
Second MA is faster, made up of p2(<p1)- period(same formula).
Can be used in the next way: slower MA(straight line) shows main trend, faster shows temporary trend.
BUY, when first MA and second MA are green; Exit: second MA changes from green to red.
SELL, when first MA and second MA are red; Exit: second MA changes from red to green.
RSI Assistant basically filtres signals in the way, when signals from RSI and Faster MA are similar? it signals about it with labels: BUY for long, SELL for short. You can either enable or disable it. Also customizable so you can find your setup. RSI Assistant, depending on you customize it, can help you either follow trend or show reversals. Just find your own setup and watch things happen!
Feel free to leave valuable feedback and your setups which you consider to be good.
Hope you PHLTI usefull. Good luck!