ATR-Adaptive, Smoothed Laguerre RSI [Loxx]ATR-Adaptive, Smoothed Laguerre RSI is an adaptive Laguerre RSI indicator with smoothing to reduce noise
What is Laguerre RSI?
The Laguerre RSI indicator created by John F. Ehlers is described in his book "Cybernetic Analysis for Stocks and Futures".
This version:
Instead of using fixed periods for Laguerre RSI calculation, this indicator uses an ATR (average True Range) adapting method to adjust the calculation period. This makes the RSI more responsive in some periods (periods of high volatility), and smoother in order periods (periods of low volatility). Also this indicator adds an option to have smoothed source input including Loxx's Expanded Source Types.
Included
-Loxx's Expanded Source Types
-Bar coloring
Relative Strength Index (RSI)

RAS.V2 Strength Index OscillatorHeavily modified version of my previous "Relative Aggregate Strength Oscillator" -Added high/low lines, alma curves,, lrc bands, changed candle calculations + other small things. Replaces the standard RSI indicator with something a bit more insightful.
Credits to @wolneyyy - 'Mean Deviation Detector - Throw Out All Other Indicators ' And @algomojo - 'Responsive Coppock Curve'
And the default Relative Strength Index
The candles are the average of the MFI ,CCI ,MOM and RSI candles, they seemed similar enough in style to me so I created candles out of each and the took the sum of all the candle's OHLC values and divided by 4 to get an average, same as v1 but with some tweaks. Previous Peaks and Potholes visible with the blue horizontal lines which adjust when a new boundary is established. Toggle alma waves or smalrc curves or both to your liking. This indicator is great for calling out peaks and troughs in realtime, although is best when combined with other trusted indicators to get a consensus.

RSI Trend Heatmap in Multi TimeframesRSI Trend Heatmap in Multi Timeframes
Description
Sometimes you want to look at the RSI Trend across multiple time frames.
You have to waste time browsing through them.
So we've put together every time frame you want to see in one indicator.
We have 10 layers of RSI Trend heatmap available for you.
You can set the timeframe as you want on the Settings page.
Description of Parameter RSI Setting ** You can change it by setting.
RSI Trend Length : (Default 50)
Source : (Default close)
RSI Sideways Length : (Default 2 = RSI between 48 .. 52)
Description of Parameter RSI Timeframe ** You can change it by setting.
""=None,
"M"=1Month, "2W"=2Weeks, "W"=1Week,
"3D"=3Days, "2D"=2Days, "D"=1Day,
"720"=12Hours, "480"=4Hours, "240"=4Hours, "180"=3Hours, "120"=2Hours,
"60"=60Minutes, "30"=30Minutes, "15"=15Minutes, "5"=5Minutes, "1"=1Minute
Default Configurate of RSI Timeframe (for a time frame of 1 hour to 1 day)
"W"= Timeframe 1 month shown in line 90-100 --> Represent Long Trend of RSI
---------------------------------------
"D2"= Timeframe 2 days shown in line 70-80 --> Represent Trend of RSI
"D"= Timeframe 1 day shown in line 60-70 --> Represent Trend of RSI
---------------------------------------
"240"= Timeframe 3 hours shown in line 40-50 --> Represent Signal Up/Signal Down/Divergence of RSI
"120"= Timeframe 2 hours shown in line 30-40 --> Represent Signal Up/Signal Down/Divergence of RSI
"60"= Timeframe 1 hour shown in line 20-30 --> Represent Signal Up/Signal Down/Divergence of RSI
"30"= Timeframe 30 minutes shown in line 10-20 --> Represent Signal Up/Signal Down/Divergence of RSI
"15"= Timeframe 15 minutes shown in line 00-10 --> Represent Signal Up/Signal Down/Divergence of RSI
Description of Colors
Dark Bule = Extreme Uptrend / Overbought / Bull Market (RSI > 67)
Light Bule = Uptrend (RSI between 50-52 .. 67)
Yellow = Sideways Trend / Trend Reversal (RSI between 48 .. 52) ** You can change it by setting.
Light Red = Downtrend (RSI between 33 .. 48-50)
Dark Red = Extreme Downtrend / Oversold / Bear Market (RSI < 33)
How to use
1. You must first know what the main trend of the RSI is (look at the 60-80 line). If it is red, it is a downtrend. and if it's blue shows that it is an uptrend
2. Throughout the period of the main trend There will always be a reversal of the sub-trend. (Can see from the 0-50 line), but eventually will return to follow the main trend.
3. Unless the sub trend persists for a long time until the main trend changes.

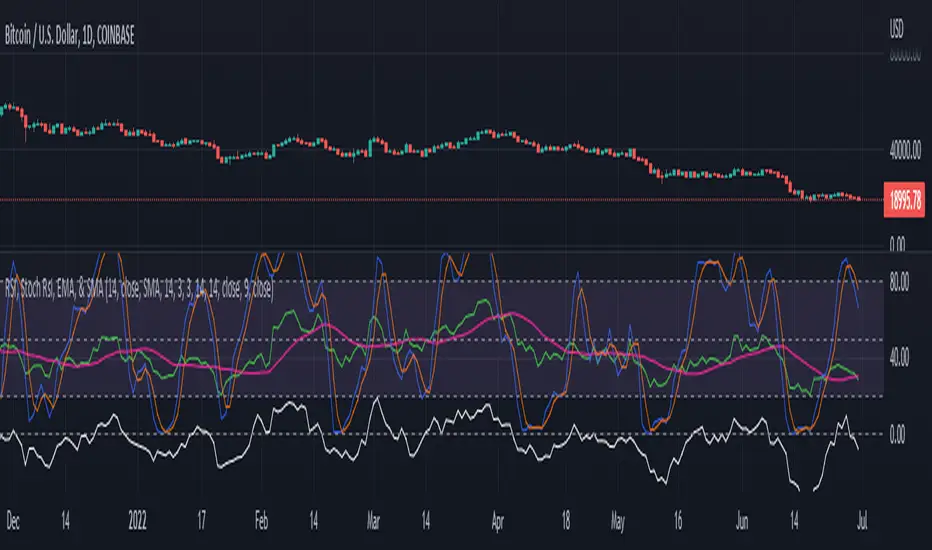
RSI, Stoch Rsi, EMA, SMA, & ROCThis indicator is simply an enhanced version of the RSI followed up by a few extra indicators that pair strongly with the RSI. This indicator allows the user to interact with various inputs based off the indicators provided. All indicators include moving average, relative strength index, stochastic relative strength index, simple moving average, exponential moving average, and rate of change. This program is unique as it is very versatile allowing the user to use as little or as many indicators as needed interchangeably.
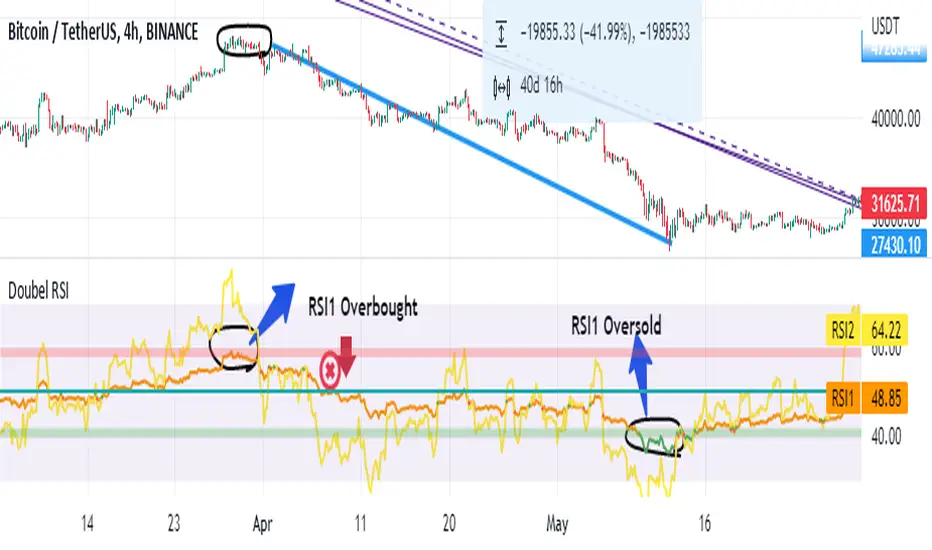
Dragon Double RSIMost important thing is feeling inspired and relaxed. Forcing your way into anything under stress and pressure will only end up in disaster
This indicator consists of three RSIs.
RSI: RSI is common and its length is 14.
RSI 1: The slowest RSI. The length is 100.
RSI 2: Faster than RSI 1. The length is 50.
Volume Risk Avoidance IndicatorPrice Pattern Analysis is the core of trading. But price patterns often fails.
VRAI (Volume Risk Avoidance Indicator) shows Volume Pressure, so that you can avoid volume-based risks.
For example, never short when you see green (buying pressure). Never long when you see red (selling pressure).
You still need to pick good price patterns, because the crossover of volume pressure is not reliable.
Enjoy!

RSI Divergence Scanner by zdmreDivergence is when the price of an asset is moving in the opposite direction of a technical indicator, such as an oscillator, or is moving contrary to other data. Divergence warns that the current price trend may be weakening, and in some cases may lead to the price changing direction.
If the stock is rising and making new highs, ideally the RSI is reaching new highs as well. If the stock is making new highs, but the RSI starts making lower highs, this warns the price uptrend may be weakening. This is negative divergence.
Positive divergence is the opposite situation. Imagine the price of a stock is making new lows while the RSI makes higher lows with each swing in the stock price. Investors may conclude that the lower lows in the stock price are losing their downward momentum and a trend reversal may soon follow.
Divergence is one of the common uses of many technical indicators, primarily the oscillators.
Use it at your own risk

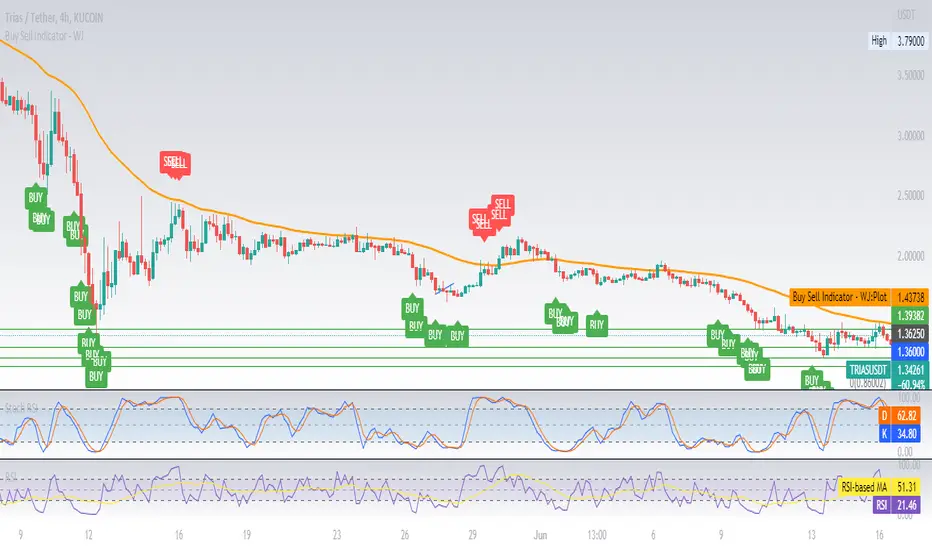
Buy Sell Indicator - WJThis is a simple Buy Sell indicator using the 3 indicators namely EMA50, RSI3 and ADX5. This is just for illustration feel free to test it and make improvements.
RSI OverlayThis is the stock RSI index using the Price as the midline.
It can be useful to view information normally displayed in a second pane overlaid on the price chart. As far as I know, this has not been done for one of the most widely used indicators, the Relative Strength Index.
This can be overlaid anywhere on the chart and every parameter is variable. If you'd like to change the position, the RSI, midline, upper line, and lower line are scaled with a factor "*close/x"
To change the position on the chart, simply change the "X" until you are pleased with the location.
The RSI MA was distracting so I removed it. I also published this indicator including the MA, titled "RSI Overlay with MA."

RSI/RSX QQE Histogram w/ Discontinued Signal Line [Loxx]QQE Histogram w/ Discontinued Signal Line is a run-of-the-mill Qualitative Quantitative Estimation (QQE) calculation but with a signal line to better filter and identify trends. The thicker white line is the QSL and appears as a simple EMA. The two thin white lines are the fast and slow trends. The histogram changes color based on the DSL levels. This version of QQE also includes two different versions of RSI: Wilders and Jurik's RSX.
What is Qualitative Quantitative Estimation (QQE)?
The Qualitative Quantitative Estimation (QQE) indicator works like a smoother version of the popular Relative Strength Index ( RSI ) indicator. QQE expands on RSI by adding two volatility based trailing stop lines. These trailing stop lines are composed of a fast and a slow moving Average True Range (ATR).
What is Wilders' RSI?
The Relative Strength Index (RSI) is a well versed momentum based oscillator which is used to measure the speed (velocity) as well as the change (magnitude) of directional price movements. Essentially RSI , when graphed, provides a visual mean to monitor both the current, as well as historical, strength and weakness of a particular market. The strength or weakness is based on closing prices over the duration of a specified trading period creating a reliable metric of price and momentum changes. Given the popularity of cash settled instruments (stock indexes) and leveraged financial products (the entire field of derivatives); RSI has proven to be a viable indicator of price movements.
What is RSX?
RSI is a very popular technical indicator, because it takes into consideration market speed, direction and trend uniformity. However, the its widely criticized drawback is its noisy (jittery) appearance. The Jurk RSX retains all the useful features of RSI , but with one important exception: the noise is gone with no added lag.
There are many indicators for many purposes. Some of them are complex and some are comparatively easy to handle. The QQE indicator is a really useful analytical tool and one of the most accurate indicators. It offers numerous strategies for using the buy and sell signals. Essentially, it can help detect trend reversal and enter the trade at the most optimal positions.
Included:
-Toggle on/off bar coloring

MOD RSI [KPM]Using this indicator you can easily view Divergence, and Market Tend in Mutitimeframe
NOTE: This is stranded RSI I only added colours for easy cath the market trend.
I'm not regarding anything with this indicator. All risk is yours
Thank you

Jurik CFB Adaptive QQE [Loxx]Jurik CFB Adaptive QQE is a Double Jurik-Filtered, Composite Fractal Behavior (CFB) adaptive, Qualitative Quantitative Estimation indicator. This indicator includes both fixed and the CFB adaptive calculations as well as three different types of RSI calculations including Jurik's RSX.
What is Qualitative Quantitative Estimation (QQE)?
The Qualitative Quantitative Estimation (QQE) indicator works like a smoother version of the popular Relative Strength Index ( RSI ) indicator. QQE expands on RSI by adding two volatility based trailing stop lines. These trailing stop lines are composed of a fast and a slow moving Average True Range (ATR).
There are many indicators for many purposes. Some of them are complex and some are comparatively easy to handle. The QQE indicator is a really useful analytical tool and one of the most accurate indicators. It offers numerous strategies for using the buy and sell signals. Essentially, it can help detect trend reversal and enter the trade at the most optimal positions.
What is Wilders' RSI?
The Relative Strength Index ( RSI ) is a well versed momentum based oscillator which is used to measure the speed (velocity) as well as the change (magnitude) of directional price movements. Essentially RSI , when graphed, provides a visual mean to monitor both the current, as well as historical, strength and weakness of a particular market. The strength or weakness is based on closing prices over the duration of a specified trading period creating a reliable metric of price and momentum changes. Given the popularity of cash settled instruments (stock indexes) and leveraged financial products (the entire field of derivatives); RSI has proven to be a viable indicator of price movements.
What is RSX RSI?
RSI is a very popular technical indicator, because it takes into consideration market speed, direction and trend uniformity. However, the its widely criticized drawback is its noisy (jittery) appearance. The Jurk RSX retains all the useful features of RSI , but with one important exception: the noise is gone with no added lag.
What is Rapid RSI?
Rapid RSI Indicator, from Ian Copsey's article in the October 2006 issue of Stocks & Commodities magazine.
RapidRSI resembles Wilder's RSI , but uses a SMA instead of a WilderMA for internal smoothing of price change accumulators.
What is Composite Fractal Behavior (CFB)?
All around you mechanisms adjust themselves to their environment. From simple thermostats that react to air temperature to computer chips in modern cars that respond to changes in engine temperature, r.p.m.'s, torque, and throttle position. It was only a matter of time before fast desktop computers applied the mathematics of self-adjustment to systems that trade the financial markets.
Unlike basic systems with fixed formulas, an adaptive system adjusts its own equations. For example, start with a basic channel breakout system that uses the highest closing price of the last N bars as a threshold for detecting breakouts on the up side. An adaptive and improved version of this system would adjust N according to market conditions, such as momentum, price volatility or acceleration.
Since many systems are based directly or indirectly on cycles, another useful measure of market condition is the periodic length of a price chart's dominant cycle, (DC), that cycle with the greatest influence on price action.
The utility of this new DC measure was noted by author Murray Ruggiero in the January '96 issue of Futures Magazine. In it. Mr. Ruggiero used it to adaptive adjust the value of N in a channel breakout system. He then simulated trading 15 years of D-Mark futures in order to compare its performance to a similar system that had a fixed optimal value of N. The adaptive version produced 20% more profit!
This DC index utilized the popular MESA algorithm (a formulation by John Ehlers adapted from Burg's maximum entropy algorithm, MEM). Unfortunately, the DC approach is problematic when the market has no real dominant cycle momentum, because the mathematics will produce a value whether or not one actually exists! Therefore, we developed a proprietary indicator that does not presuppose the presence of market cycles. It's called CFB (Composite Fractal Behavior) and it works well whether or not the market is cyclic.
CFB examines price action for a particular fractal pattern, categorizes them by size, and then outputs a composite fractal size index. This index is smooth, timely and accurate
Essentially, CFB reveals the length of the market's trending action time frame. Long trending activity produces a large CFB index and short choppy action produces a small index value. Investors have found many applications for CFB which involve scaling other existing technical indicators adaptively, on a bar-to-bar basis.
What is Jurik Volty used in the Juirk Filter?
One of the lesser known qualities of Juirk smoothing is that the Jurik smoothing process is adaptive. "Jurik Volty" (a sort of market volatility ) is what makes Jurik smoothing adaptive. The Jurik Volty calculation can be used as both a standalone indicator and to smooth other indicators that you wish to make adaptive.
What is the Jurik Moving Average?
Have you noticed how moving averages add some lag (delay) to your signals? ... especially when price gaps up or down in a big move, and you are waiting for your moving average to catch up? Wait no more! JMA eliminates this problem forever and gives you the best of both worlds: low lag and smooth lines.
Ideally, you would like a filtered signal to be both smooth and lag-free. Lag causes delays in your trades, and increasing lag in your indicators typically result in lower profits. In other words, late comers get what's left on the table after the feast has already begun.
Included
-Toggle bar color on/off

Waddah Attar RSI Levels [Loxx]Waddah Attar RSI levels is an indicator created Ahmad Waddah Attar that draws a daily RSI over onto the current lower timeframe chart.
Wilders' RSI:
The Relative Strength Index ( RSI ) is a well versed momentum based oscillator which is used to measure the speed (velocity) as well as the change (magnitude) of directional price movements. Essentially RSI , when graphed, provides a visual mean to monitor both the current, as well as historical, strength and weakness of a particular market. The strength or weakness is based on closing prices over the duration of a specified trading period creating a reliable metric of price and momentum changes. Given the popularity of cash settled instruments (stock indexes) and leveraged financial products (the entire field of derivatives); RSI has proven to be a viable indicator of price movements.
Rapid RSI:
Rapid RSI Indicator, from Ian Copsey's article in the October 2006 issue of Stocks & Commodities magazine. RapidRSI resembles Wilder's RSI , but uses a SMA instead of a WilderMA for internal smoothing of price change accumulators.
Details
-Used for intraday trading, restricted to timeframes 1 hour and below
-Best Time Frames 15, 30, 60 minutes

(JS) Checklist SignalsWhat if I told you that you could use over 10 indicators at once without having a single one of them on you chart? Enter the Checklist Signals. This is probably the most complex yet simple indicator I've ever done.
What you get is 6 rows (if you want them all) of labels that hover at the top of your screen with a ton of extremely useful information. I will go down the list of options in the indicator settings and explain how it all works.
So the label placement is based on ATR. You choose your X Axis and Y Axis starting point then adjust the lookback period. Default lookback is 600 bars. What that means is, the indicator finds the highest high in the last 600 bars, then begins to place the labels above that zone based on the ATR of the chart. Different timeframes require very different combinations so it's all customizable. Sometimes if labels overlap you need to adjust the X Axis starting point, or the spread on either axis.
The next set of options allows you to decide what you'd prefer to be set on or off. Let's start with ATR and VWAP. I have added bands for both of these. When price is below the mean (which is the 21 ema by default), then the labels show you the next 5 standard deviations of ATR going down. When under one of these levels the label turns red. The opposite is true when above the mean and in those instances the labels will be green. It is the same with the VWAP, though instead of using the mean we use the daily VWAP as the starting point. If you choose to have levels switched on then you can see the actual values of each standard deviation level. Down lower in the options you can change the resolution and source used for VWAP.
The next option is "Trending". This creates a moving average using the length of the Trending Lookback Period (default is 5) and then tells you using arrows in the label which direction the trend of the indicator is going.
The next area let's you specify the information you receive in the Squeeze labels. By default all options are one - and this tells you if there's a Squeeze, what type of Squeeze there is, and how many bars the Squeeze has been building up or since it fired. These labels are color coded to correspond with the Squeeze type as well.
Then we get to another one of my indicators, the Ballista. One of the main signals is the "Inverted Squeeze" where the short term momentum inverts against the long term momentum. Here I have the distance between the two oscillators in the first label, and then the second label tells you if there's an Inverted Squeeze signal, if there's potential entry, confirmed entry, or how many bars its been since the last entry signal.
The next feature is off by default, but it will add arrows to your chart based on a simple lower highs and higher lows signals. Turning arrows on will place them right on your chart above or below each bar.
The rest of it is customizable settings of all the other indicators that are shown. Now looking at the labels themselves, starting in the top left corner:
First Row-
ADX + DMI: These labels show the ADX, DI+, & DI- values in each label. Whenever the DI+ or DI- is above the other then their respective label will light up. Also, when the ADX is above 20 (confirming the trend) it lights up in the same color as well.
Squeeze: I described how this worked above, the labels tell you if there's a Squeeze, how long there's been one, and how long since it fired, all while also changing to color of the associated Squeeze type.
Second Row -
Stacked EMAs: The top label looks at the EMA values using the numbers of the Fibonacci sequence. It looks at the EMA 8, 21, 34, 55, 89, & 233 and tells you if they're all stacked in the same direction (Stacked Bear meaning they're all crossed down in order, Stacked Bull meaning they're all crossed up in order). If the EMAs are all stacked but 1 or 2 it will say Stacked -1 or Stacked -2. When they're all over the place it will say they aren't stacked at all.
BB%: This tells you the value of the Bollinger Band %. If this is negative then you know that price is currently below the lower Bollinger Band, and if it is above 100% it is above the upper Bollinger Band.
RSI: This tells you the value of the RSI and the label changes colors based on the value.
Stoch: This tells you the Stochastic value and changes colors based on the value, same as the RSI.
Third Row -
The Mean: This tells you the numerical value of whatever you have the mean set as (21 ema by default). The label changes colors based on price being above or below the mean.
One ATR: This was something I added for those looking to plan their trades out. This tells you the value of one ATR so you can have a better idea of how to plan your trades based on this distance.
VIX: This tells you the current value of the VIX, and color changes based on being green or red on the day.
Ballista: I explained this above, it tells you the distance between the two oscillators and changes colors based on the trend being above or below 0. When there's an Inverted Squeeze this label is gray.
Inverted Squeeze: This label tells you if there's an inverted squeeze as well as if it is showing an entry or how many bars since the last entry signal. This label turns fuchsia on a bear signal and lime on a bull signal.
Fourth Row -
ATR Bands: As I explained above, this plots each standard deviation using ATR and changes colors based on price's relationship to each one.
Fifth Row -
VWAP: The three labels here show the daily, weekly, and monthly VWAP values, and color changes based on price's relationship to each one.
Sixth Row -
VWAP Bands: These are the standard deviation levels of the VWAP resolution of your choosing (as explained above), and just as the others, colors change based on price's relationship to each one.
I thought this was a really cool indicator that could be used for people like me who like knowing the right information, but HATE having their charts clustered with a ton of stuff. Hope you all like it, enjoy!

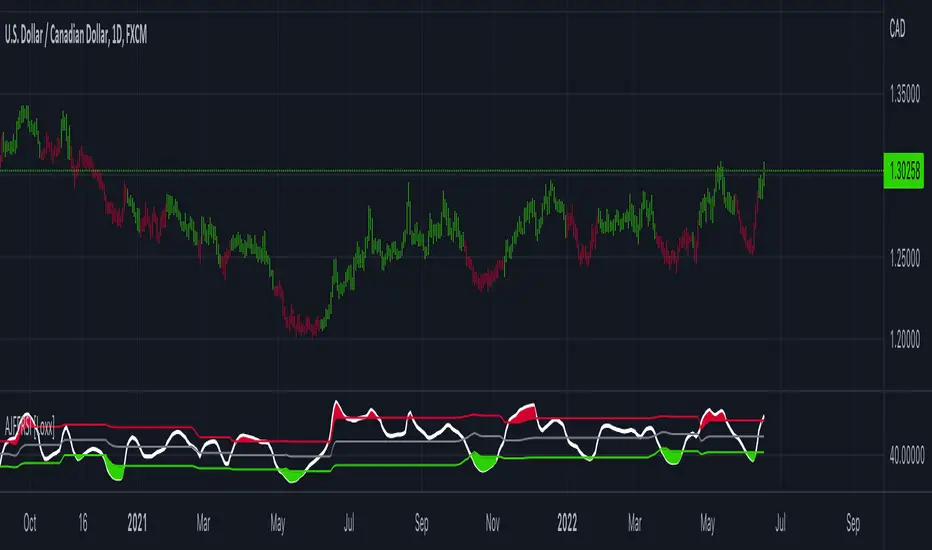
Adaptive, Jurik-Filtered, Floating RSI [Loxx]Adaptive, Jurik-Filtered, Floating RSI is an adaptive RSI indicator that smooths the RSI signal with a Jurik Filter.
This indicator contains three different types of RSI. They are following.
Wilders' RSI:
The Relative Strength Index ( RSI ) is a well versed momentum based oscillator which is used to measure the speed (velocity) as well as the change (magnitude) of directional price movements. Essentially RSI , when graphed, provides a visual mean to monitor both the current, as well as historical, strength and weakness of a particular market. The strength or weakness is based on closing prices over the duration of a specified trading period creating a reliable metric of price and momentum changes. Given the popularity of cash settled instruments (stock indexes) and leveraged financial products (the entire field of derivatives); RSI has proven to be a viable indicator of price movements.
RSX RSI:
RSI is a very popular technical indicator, because it takes into consideration market speed, direction and trend uniformity. However, the its widely criticized drawback is its noisy (jittery) appearance. The Jurk RSX retains all the useful features of RSI , but with one important exception: the noise is gone with no added lag.
Rapid RSI:
Rapid RSI Indicator, from Ian Copsey's article in the October 2006 issue of Stocks & Commodities magazine.
RapidRSI resembles Wilder's RSI , but uses a SMA instead of a WilderMA for internal smoothing of price change accumulators.
This indicator also uses adaptive cycles to calculate input lengths
What is an adaptive cycle, and what is Ehlers Autocorrelation Periodogram Algorithm?
From his Ehlers' book Cycle Analytics for Traders Advanced Technical Trading Concepts by John F. Ehlers , 2013, page 135:
"Adaptive filters can have several different meanings. For example, Perry Kaufman’s adaptive moving average ( KAMA ) and Tushar Chande’s variable index dynamic average ( VIDYA ) adapt to changes in volatility . By definition, these filters are reactive to price changes, and therefore they close the barn door after the horse is gone.The adaptive filters discussed in this chapter are the familiar Stochastic , relative strength index ( RSI ), commodity channel index ( CCI ), and band-pass filter.The key parameter in each case is the look-back period used to calculate the indicator. This look-back period is commonly a fixed value. However, since the measured cycle period is changing, it makes sense to adapt these indicators to the measured cycle period. When tradable market cycles are observed, they tend to persist for a short while.Therefore, by tuning the indicators to the measure cycle period they are optimized for current conditions and can even have predictive characteristics.
The dominant cycle period is measured using the Autocorrelation Periodogram Algorithm. That dominant cycle dynamically sets the look-back period for the indicators. I employ my own streamlined computation for the indicators that provide smoother and easier to interpret outputs than traditional methods. Further, the indicator codes have been modified to remove the effects of spectral dilation.This basically creates a whole new set of indicators for your trading arsenal."
Lastly, RSI is filtered and smoothed using a Jurik Filter
What is Jurik Volty?
One of the lesser known qualities of Juirk smoothing is that the Jurik smoothing process is adaptive. "Jurik Volty" (a sort of market volatility ) is what makes Jurik smoothing adaptive. The Jurik Volty calculation can be used as both a standalone indicator and to smooth other indicators that you wish to make adaptive.
What is the Jurik Moving Average?
Have you noticed how moving averages add some lag (delay) to your signals? ... especially when price gaps up or down in a big move, and you are waiting for your moving average to catch up? Wait no more! JMA eliminates this problem forever and gives you the best of both worlds: low lag and smooth lines.
Ideally, you would like a filtered signal to be both smooth and lag-free. Lag causes delays in your trades, and increasing lag in your indicators typically result in lower profits. In other words, late comers get what's left on the table after the feast has already begun.
Usage
-Red fill color when RSI is in overbought zone means a possible bear trend is incoming
-Green fill color when RSI is in overbought zone means a possible bear trend is incoming
Included
-Bar coloring

Relative Aggregate Strength OscillatorCredits to
@wolneyyy - "Mean Deviation Detector - Throw Out All Other Indicators"
And
@algomojo - "Responsive Coppock Curve"
And the default Relative Strength Index
The candles are the average of the MFI ,CCI ,MOM and RSI values presented as candles, they seemed similar enough in style to me so I created candles out of each and the took the sum of all the candle's OHLC values and divided by 4 to get an average.
In the Background we have @wolneyyy's - "Mean Deviation Detector - Throw Out All Other Indicators" in blue
along with @algomojo's - "Responsive Coppock Curve" in red and green.

Ehlers Adaptive Relative Strength Index (RSI) [Loxx]Ehlers Adaptive Relative Strength Index (RSI) is an implementation of RSI using Ehlers Autocorrelation Periodogram Algorithm to derive the length input for RSI. Other implementations of Ehers Adaptive RSI rely on the inferior Hilbert Transformer derive the dominant cycle.
In his book "Cycle Analytics for Traders Advanced Technical Trading Concepts", John F. Ehlers describes an implementation for Adaptive Relative Strength Index in order to solve for varying length inputs into the classic RSI equation.
What is an adaptive cycle, and what is the Autocorrelation Periodogram Algorithm?
From his Ehlers' book mentioned above, page 135:
"Adaptive filters can have several different meanings. For example, Perry Kaufman’s adaptive moving average (KAMA) and Tushar Chande’s variable index dynamic average (VIDYA) adapt to changes in volatility. By definition, these filters are reactive to price changes, and therefore they close the barn door after the horse is gone.The adaptive filters discussed in this chapter are the familiar Stochastic, relative strength index (RSI), commodity channel index (CCI), and band-pass filter.The key parameter in each case is the look-back period used to calculate the indicator.This look-back period is commonly a fixed value. However, since the measured cycle period is changing, as we have seen in previous chapters, it makes sense to adapt these indicators to the measured cycle period. When tradable market cycles are observed, they tend to persist for a short while.Therefore, by tuning the indicators to the measure cycle period they are optimized for current conditions and can even have predictive characteristics.
The dominant cycle period is measured using the autocorrelation periodogram algorithm. That dominant cycle dynamically sets the look-back period for the indicators. I employ my own streamlined computation for the indicators that provide smoother and easier to interpret outputs than traditional methods. Further, the indicator codes have been modified to remove the effects of spectral dilation.This basically creates a whole new set of indicators for your trading arsenal."
What is Adaptive RSI?
From his Ehlers' book mentioned above, page 137:
"The adaptive RSI starts with the computation of the dominant cycle using the autocorrelation periodogram approach. Since the objective is to use only those frequency components passed by the roofing filter, the variable "filt" is used as a data input rather than closing prices. Rather than independently taking the averages of the numerator and denominator, I chose to perform smoothing on the ratio using the SuperSmoother filter. The coefficients for the SuperSmoother filters have previously been computed in the dominant cycle measurement part of the code."
Happy trading!

Adaptive, Relative Strength EMA (RSEMA) [Loxx]TASC's May 2022 edition Traders' Tipsl includes the "Relative Strength Moving Averages" article authored by Vitali Apirine. This is the code implementing the Relative Strength Exponential Moving Average (RS EMA) indicator introduced in this publication.
This indicator adds onto Vitali Apirine's work by including three different types of momentum used to calculate RSEMA as well as fixed and adaptive cycle calculations to be used as dynamic inputs to calculate momentum. The purpose of these additional calculation methods is to attempt to filter out noice and track trends by using different methods and inputs to calculation momentum.
Momentum methods
-Wilder relative strength
-Chande momentum
-Momentum component of Jurik's RSX RSI
Cycle calculation methods
-Fixed
-Vertical horizontal filter
-Ehlers' Autocorrelation Dominant Cycle
What is Wilder relative strength?
The Relative Strength Index (RSI), developed by J. Welles Wilder, is a momentum oscillator that measures the speed and change of price movements. The RSI oscillates between zero and 100. Traditionally the RSI is considered overbought when above 70 and oversold when below 30.
What is Chande momentum?
Chande Momentum was designed specifically to track the movement and momentum of a security. It calculates the difference between the sum of both recent gains and recent losses, then dividing the result by the sum of all price movement over the same period.
What is the momentum component of Jurik's RSX RSI?
RSI is a very popular technical indicator, because it takes into consideration market speed, direction and trend uniformity. However, the its widely criticized drawback is its noisy (jittery) appearance. The Jurk RSX retains all the useful features of RSI , but with one important exception: the noise is gone with no added lag. For our purposes here, we derive momentum minus the lag.
Vertical horizontal filter?
Vertical Horizontal Filter (VHF) was created by Adam White to identify trending and ranging markets. VHF measures the level of trend activity, similar to ADX in the Directional Movement System. Trend indicators can then be employed in trending markets and momentum indicators in ranging markets.
What is autocorrelation?
Ehlers Autocorrelation is used in the calculation of dominant cycle length to be injected into standard technical analysis tools to improve TA accuracy. Its main purpose is to eliminate noise from the price data, reduce effects of the “spectral dilation” phenomenon, and reveal dominant cycle periods.
As the first step, Autocorrelation uses Mr. Ehlers’s previous installment, Ehlers Roofing Filter, in order to enhance the signal-to-noise ratio and neutralize the spectral dilation. This filter is based on aerospace analog filters and when applied to market data, it attempts to only pass spectral components whose periods are between 10 and 48 bars.
Autocorrelation is then applied to the filtered data: as its name implies, this function correlates the data with itself a certain period back. As with other correlation techniques, the value of +1 would signify the perfect correlation and -1, the perfect anti-correlation.
Happy trading!

mystochrsirsi + stochrsi
Indicator where rsi and stoch rsi are both together. Please adjust the color etc settings from the style tab.
Jurik RSX on JMA [Loxx]Jurik RSX on JMA is identical to indicator RSI RSX, except that price data is pre-smoothed by JMA. Doing so extends the range of RSX and produces fewer micro reversals. That lends itself to advanced analysis. Output Range: -100 to +100.
What is RSX?
RSI is a very popular technical indicator, because it takes into consideration market speed, direction and trend uniformity. However, the its widely criticized drawback is its noisy (jittery) appearance. The Jurk RSX retains all the useful features of RSI , but with one important exception: the noise is gone with no added lag.
What is JMA?
Have you noticed how moving averages add some lag (delay) to your signals? ... especially when price gaps up or down in a big move, and you are waiting for your moving average to catch up? Wait no more! JMA eliminates this problem forever and gives you the best of both worlds: low lag and smooth lines.
Ideally, you would like a filtered signal to be both smooth and lag-free. Lag causes delays in your trades, and increasing lag in your indicators typically result in lower profits. In other words, late comers get what's left on the table after the feast has already begun.
That's why investors, banks and institutions worldwide ask for the Jurik Research Moving Average (JMA). You may apply it just as you would any other popular moving average. However, JMA's improved timing and smoothness will astound you.
Included
-Color bars
-Customize inputs
RSX of Double MACD [Loxx]RSX of Double MACD is a specialized version of the classic MACD. Normally the MACD calculation ends with the difference between fast/slow EMAs, this version of MACD takes the calculation one step further by passing the MACD signal into an RSX RSI function to derive a smoother MACD bound from 0 to 100.
What is MACD?
Moving average convergence divergence ( MACD ) is a trend-following momentum indicator that shows the relationship between two moving averages of a security’s price. The MACD is calculated by subtracting the 26-period exponential moving average ( EMA ) from the 12-period EMA.
What is RSX?
RSI is a very popular technical indicator, because it takes into consideration market speed, direction and trend uniformity. However, the its widely criticized drawback is its noisy (jittery) appearance. The Jurk RSX retains all the useful features of RSI , but with one important exception: the noise is gone with no added lag.
Included
-Customizable inputs and boundaries
Adaptive Qualitative Quantitative Estimation (QQE) [Loxx]Adaptive QQE is a fixed and cycle adaptive version of the popular Qualitative Quantitative Estimation (QQE) used by forex traders. This indicator includes varoius types of RSI caculations and adaptive cycle measurements to find tune your signal.
Qualitative Quantitative Estimation (QQE):
The Qualitative Quantitative Estimation (QQE) indicator works like a smoother version of the popular Relative Strength Index (RSI) indicator. QQE expands on RSI by adding two volatility based trailing stop lines. These trailing stop lines are composed of a fast and a slow moving Average True Range (ATR).
There are many indicators for many purposes. Some of them are complex and some are comparatively easy to handle. The QQE indicator is a really useful analytical tool and one of the most accurate indicators. It offers numerous strategies for using the buy and sell signals. Essentially, it can help detect trend reversal and enter the trade at the most optimal positions.
Wilders' RSI:
The Relative Strength Index ( RSI ) is a well versed momentum based oscillator which is used to measure the speed (velocity) as well as the change (magnitude) of directional price movements. Essentially RSI , when graphed, provides a visual mean to monitor both the current, as well as historical, strength and weakness of a particular market. The strength or weakness is based on closing prices over the duration of a specified trading period creating a reliable metric of price and momentum changes. Given the popularity of cash settled instruments (stock indexes) and leveraged financial products (the entire field of derivatives); RSI has proven to be a viable indicator of price movements.
RSX RSI:
RSI is a very popular technical indicator, because it takes into consideration market speed, direction and trend uniformity. However, the its widely criticized drawback is its noisy (jittery) appearance. The Jurk RSX retains all the useful features of RSI , but with one important exception: the noise is gone with no added lag.
Rapid RSI:
Rapid RSI Indicator, from Ian Copsey's article in the October 2006 issue of Stocks & Commodities magazine.
RapidRSI resembles Wilder's RSI , but uses a SMA instead of a WilderMA for internal smoothing of price change accumulators.
VHF Adaptive Cycle:
Vertical Horizontal Filter (VHF) was created by Adam White to identify trending and ranging markets. VHF measures the level of trend activity, similar to ADX DI. Vertical Horizontal Filter does not, itself, generate trading signals, but determines whether signals are taken from trend or momentum indicators. Using this trend information, one is then able to derive an average cycle length.
Band-pass Adaptive Cycle:
Even the most casual chart reader will be able to spot times when the market is cycling and other times when longer-term trends are in play. Cycling markets are ideal for swing trading however attempting to “trade the swing” in a trending market can be a recipe for disaster. Similarly, applying trend trading techniques during a cycling market can equally wreak havoc in your account. Cycle or trend modes can readily be identified in hindsight. But it would be useful to have an objective scientific approach to guide you as to the current market mode.
There are a number of tools already available to differentiate between cycle and trend modes. For example, measuring the trend slope over the cycle period to the amplitude of the cyclic swing is one possibility.
We begin by thinking of cycle mode in terms of frequency or its inverse, periodicity. Since the markets are fractal ; daily, weekly, and intraday charts are pretty much indistinguishable when time scales are removed. Thus it is useful to think of the cycle period in terms of its bar count. For example, a 20 bar cycle using daily data corresponds to a cycle period of approximately one month.
When viewed as a waveform, slow-varying price trends constitute the waveform's low frequency components and day-to-day fluctuations (noise) constitute the high frequency components. The objective in cycle mode is to filter out the unwanted components--both low frequency trends and the high frequency noise--and retain only the range of frequencies over the desired swing period. A filter for doing this is called a bandpass filter and the range of frequencies passed is the filter's bandwidth.
Included:
-Toggle on/off bar coloring
-Customize RSI signal using fixed, VHF Adaptive, and Band-pass Adaptive calculations
-Choose from three different RSI types
Visuals:
-Red/Green line is the moving average of RSI
-Thin white line is the fast trend
-Dotted yellow line is the slow trend
Happy trading!
