Hotch DMI+OBV+RSI ConfluenceThis Indicator uses the Relative Strength Index, On Balance Volume, and ADX to identify viable trading trends.
A quick description of what is on display:
1.) Green Triangle = OBV crossing over OBV MA
2.)Red Triangle = OBV Crossing under OBV SMA
3.) The background coloring between the RSI Oversold and Overbought Values has multiple conditions.
----It is green when the DI+ > DI-
----It is purple when the DI+ < DI-
----the brightness represents the ADX value. Darker areas(or more transparent) show a weak ADX value(4). Brighter (or less transparent) show a stronger ADX value(3)
5.) RSI and RSI moving average, including a divergence indicator.
6.) A histogram representing the normalized value of OBV-OBVMA to show changes in value while remaining readably in range on the chart with other indicators.
In the included chart screen shot is an example of an applicable strategy. This example is no guaranteed success and is also not the only strategy applicable to the indicator.
Relative Strength Index (RSI)

RSI Swing Trading Setup (2-Period)A simple script that adjusts the RSI visibly in order to better accommodate swing trading and certain swing trading setups/strategies.
--------------------------------------------------------------------------------------------------------------------------------------------------------
Best used in conjunction with "Linear Regression Channel by LonesomeTheBlue" with 2.2σ (std.dev) and Show Fib Levels.
^Click image for a redirect to that script.
--------------------------------------------------------------------------------------------------------------------------------------------------------
In certain price action patterns:
A bearish reversal from a previously bullish move can indicate tops of a rally if the RSI moves from 0-40 to 60 (1)
A bullish reversal from a previously bearish move can indicate bottoms of a pullback if the RSI moves from 60-100 to 40 (2)
(USE THE LINEAR REGRESSION CHANNEL TO VALIDIFY THE RETRACEMENTS)
--------------------------------------------------------------------------------------------------------------------------------------------------------
(1)
--------------------------------------------------------------------------------------------------------------------------------------------------------
(2)
--------------------------------------------------------------------------------------------------------------------------------------------------------

RinarBottombuyRSI, VWMA, MA.
Altcon bottom signals.
buy
White background - bottom point
Yellow - Buy zone
White triangles - a signal to place orders
Sell
Red - sale
RU
RSI , VWMA , MA.
Сигналы дна альтконов.
Buy
Белый фон -точка дна
Желтый - Зона покупки
Белые треугольники - сигнал выставить ордера
Sell
Красный - продажа

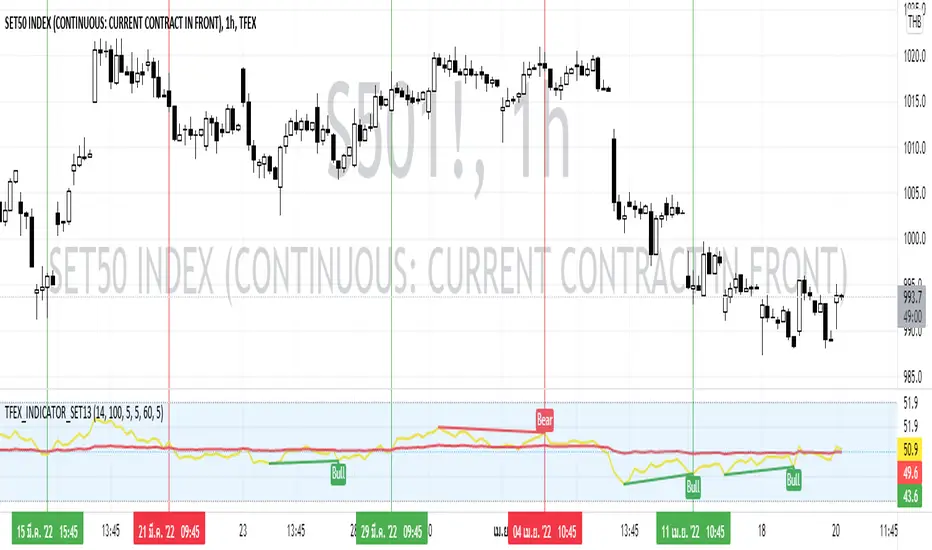
TFEX_INDICATOR_SET13This Indicator use the calculated RSI of the top 13 stocks that have the highest market capitalization in SET:SET50 where suitable for TFEX trading( TFEX:S501! ) .
Conducted with 2 RSI period as follow:
RSI Main (14)
RSI Average (100)
How to use:
1) Use this Indicator by Crossover
If the RSI Main Cross UP the RSI Average can assume as BUY SIGNAL
If the RSI Main Cross DOWN the RSI Average can assume as SELL SIGNAL
2) Use this Indicator by Divergence of RSI Main
If the RSI Main got any Regular Bullish or Hidden Bullish can assume as BUY SIGNAL
If the RSI Main got any Regular Bearish or Hidden Bearish can assume as SELL SIGNAL
3) The combination of Divergence and Crossover
If the RSI Main got any Regular Bullish or Hidden Bullish then pending for the RSI Main Cross UP the RSI Average which can assume as BUY SIGNAL
If the RSI Main got any Regular Bearish or Hidden Bearish then pending for the RSI Main Cross DOWN the RSI Average which can assume as SELL SIGNAL
Preferred Timeframe
4H
2H
1H
Bogdan Ciocoiu - CoordinatorDescription
The Coordinator is an indicator developed on the back of the RSI algorithm, modified substantially to form a cloud. In addition, the Coordinator uses EMA/SMA to compare the location of the RSI cloud with the chosen moving averages (EMA vs SMA).
This indicator is helpful as it confirms when a trader should enter a position or exit based on the proximity of the RSI cloud to the relevant MA.
Uniqueness
The Coordinator provides unique benefits, including:
It shows the strength of the RSI in the shape of the RSI cloud, using two sets of dimensions (one more long term and one more short-term oriented).
It indicates the positioning of the RSI cloud in conjunction with the relevant moving averages to help traders remain in positions for longer.
It shows the RSI 14 (useful when spotting divergences aligned with the price action).
Open-source
The Coordinator uses the following open-source scripts:
www.tradingview.com

Indicator Direction Table With Bullish & Bearish LabelsINDICATOR DIRECTION TABLE WITH BULLISH AND BEARISH LABELS
This is a table that shows the bullish, bearish or neutral trend for nine different popular indicators. Each indicator label will change color in real time to make you aware of each change in direction. This way you don’t have to read and analyze a bunch of different indicators constantly and you can focus on price action instead.
Look for the entire table to turn green or red before taking positions.
You can also set alerts for when the entire table of indicators is bullish or bearish.
The indicator settings allow customization of indicator lengths & values, table position and turning the indicator table on or off.
The length and other values for each indicator can be customized to suit your preferences, but by default all of them are set to the normal default settings that Tradingview supplies the indicators with. Typically 14 as the length.
The indicators used in this table are as follows:
MACD - Moving Average Convergence Divergence
Stochastic RSI - Stochastic Relative Strength Index
Vortex - Vortex Indicator
Momentum - Momentum Indicator
RSI - Relative Strength Index
PSAR - Parabolic Stop & Reverse
DMI - Directional Movement Index
MFI - Money Flow Index
Fisher - Fisher Transform Price Action
***MARKETS***
This indicator can be used as a signal on all markets, including stocks, crypto, futures and forex.
***TIMEFRAMES***
This indicator table can be used on all timeframes.
***TIPS***
Try using numerous indicators of ours on your chart so you can instantly see the bullish or bearish trend of multiple indicators in real time without having to analyze the data. Some of our favorites are our Auto Fibonacci, Directional Movement Index + Fisher Price Action, Volume Profile With Buy & Sell Pressure, Auto Support And Resistance and Money Flow Index in combination with this indicator direction table. They all have unique features to help you make better and faster trading decisions.

Relative Strength Index (OSC)Hello everyone, I'm sorry that the previous open-source version was hidden due to the house rules, I've re-edited the description and re-posted it
(1) Indicator introduction
This is RSI indicator with original divergence algorithm
This indicator is plotted on the RSI and can display the divergence locations and corresponding divergence intensity
The tolerance of N Klines at the top or bottom positions for price and indicator is supported, which is set by the "Tolerant Kline Number"
Support the display of divergence intensity, that is, the REG/HID value displayed on the label, which is less than 0. The smaller the intensity value, the more obvious divergence
Support the filtering of divergence intensity, which is set by "Cov Threshold". The divergence that REG/HID divergence intensity greater than this value will be ignored
In the label, REG indicates regular top/bottom divergence while HID indicates hidden top/bottom divergence
In the label, SRC(x-y) indicates a divergence occurred from the x-th kline to the y-th kline
In the label, OSC(x-y) indicates a divergence occurred from the indicator corresponding to the x-th kline to the y-th kline
(2) Parameter introduction
- RSI Settings
Source: The source to calculate RSI, close by default
RSI Length: The length of RSI, 14 by default
- RSI Divergence
Pivot Lookback Right: Number of K-line bars recalling the pivot top/bottom point to the right
Pivot Lookback Left: Number of K-line bars recalling the pivot top/bottom point to the left
Max of Lookback Range: Maximum number of retracing K-line bars to find the pivot top/bottom point
Min of Lookback Range: Minimum number of retracing K-line bars to find the pivot top/bottom point
Tolerant Kline Number: Maximum tolerance in indexing top/bottom points of Klines and indicators
Cov Threshold: Divergence intensity, which is less than 0. The smaller the intensity value, the more obvious divergence
Plot Bullish: Whether to draw regular bullish divergence label
Plot Hidden Bullish: Whether to draw hidden bullish divergence label
Plot Bearish: Whether to draw regular bearish divergence label
Plot Hidden Bearish: Whether to draw hidden bearish divergence label
Happy trading and enjoy your life!
————————————————————————————————————————
各位朋友大家好,很抱歉之前的开源版本因为规则原因被隐藏,我已经重新编辑了说明并重新发布
(1) 指标说明
该指标绘制于 RSI 上,并在对应位置显示背离点以及背离程度
支持顶底位置 N 根K线的容差,由 Tolerant Kline Number 参数设置
支持背离强度的显示,即标签上显示的 REG/HID 值,该值小于 0,且越小说明背离程度越大
支持背离强度的过滤,由 Cov Threshold 参数设置, REG/HID 值大于这个值的背离会被忽略
标签中,REG 表示常规顶/低背离,而 HID 表示隐藏顶/底背离
标签中,SRC(x-y) 表示从当前第 x 根 bar 开始到第 y 跟 bar 出现背离
标签中,OSC(x-y) 表示从当前第 x 根 bar 所对应的指标开始到第 y 跟 bar 所对应的指标出现背离
(2) 参数说明
- RSI Settings
Source: 计算 RSI 指标的 source,默认为 close
RSI Length: 计算 RSI 指标的长度,默认为 14
- RSI Divergence
Pivot Lookback Right: 枢纽顶/底点往右回顾的 K线 bar 数量
Pivot Lookback Left: 枢纽顶/底点往左回顾的 K线 bar 数量
Max of Lookback Range: 回寻找枢纽顶/底点的最大回溯 K线 bar 数量
Min of Lookback Range: 回寻找枢纽顶/底点的最小回溯 K线 bar 数量
Tolerant Kline Number: K线和指标的顶/底点索引的最大误差
Cov Threshold: 背离程度,该值小于 0,且越小说明背离程度越大
Plot Bullish: 是否绘制常规底背离提示
Plot Hidden Bullish: 是否绘制隐藏底背离提示
Plot Bearish: 是否绘制常规顶背离提示
Plot Hidden Bearish: 是否绘制隐藏顶背离提示
祝大家交易愉快

Relative Strength Index (SRC)Hello everyone, I'm sorry that the previous open-source version was hidden due to the house rules, I've re-edited the description and re-posted it
(1) Indicator introduction
This is RSI indicator with original divergence algorithm
This indicator is plotted on the klines and can display the divergence locations and corresponding divergence intensity
The tolerance of N Klines at the top or bottom positions for price and indicator is supported, which is set by the "Tolerant Kline Number"
Support the display of divergence intensity, that is, the REG/HID value displayed on the label, which is less than 0. The smaller the intensity value, the more obvious divergence
Support the filtering of divergence intensity, which is set by "Cov Threshold". The divergence that REG/HID divergence intensity greater than this value will be ignored
In the label, REG indicates regular top/bottom divergence while HID indicates hidden top/bottom divergence
In the label, SRC(x-y) indicates a divergence occurred from the x-th kline to the y-th kline
In the label, OSC(x-y) indicates a divergence occurred from the indicator corresponding to the x-th kline to the y-th kline
(2) Parameter introduction
- RSI Settings
Source: The source to calculate RSI, close by default
RSI Length: The length of RSI, 14 by default
- RSI Divergence
Pivot Lookback Right: Number of K-line bars recalling the pivot top/bottom point to the right
Pivot Lookback Left: Number of K-line bars recalling the pivot top/bottom point to the left
Max of Lookback Range: Maximum number of retracing K-line bars to find the pivot top/bottom point
Min of Lookback Range: Minimum number of retracing K-line bars to find the pivot top/bottom point
Tolerant Kline Number: Maximum tolerance in indexing top/bottom points of Klines and indicators
Cov Threshold: Divergence intensity, which is less than 0. The smaller the intensity value, the more obvious divergence
Plot Bullish: Whether to draw regular bullish divergence label
Plot Hidden Bullish: Whether to draw hidden bullish divergence label
Plot Bearish: Whether to draw regular bearish divergence label
Plot Hidden Bearish: Whether to draw hidden bearish divergence label
Happy trading and enjoy your life!
————————————————————————————————————————
各位朋友大家好,很抱歉之前的开源版本因为规则原因被隐藏,我已经重新编辑了说明并重新发布
(1) 指标说明
该指标绘制于 K线 上,并在对应位置显示背离点以及背离程度
支持顶底位置 N 根K线的容差,由 Tolerant Kline Number 参数设置
支持背离强度的显示,即标签上显示的 REG/HID 值,该值小于 0,且越小说明背离程度越大
支持背离强度的过滤,由 Cov Threshold 参数设置, REG/HID 值大于这个值的背离会被忽略
标签中,REG 表示常规顶/低背离,而 HID 表示隐藏顶/底背离
标签中,SRC(x-y) 表示从当前第 x 根 bar 开始到第 y 跟 bar 出现背离
标签中,OSC(x-y) 表示从当前第 x 根 bar 所对应的指标开始到第 y 跟 bar 所对应的指标出现背离
(2) 参数说明
- RSI Settings
Source: 计算 RSI 指标的 source,默认为 close
RSI Length: 计算 RSI 指标的长度,默认为 14
- RSI Divergence
Pivot Lookback Right: 枢纽顶/底点往右回顾的 K线 bar 数量
Pivot Lookback Left: 枢纽顶/底点往左回顾的 K线 bar 数量
Max of Lookback Range: 回寻找枢纽顶/底点的最大回溯 K线 bar 数量
Min of Lookback Range: 回寻找枢纽顶/底点的最小回溯 K线 bar 数量
Tolerant Kline Number: K线和指标的顶/底点索引的最大误差
Cov Threshold: 背离程度,该值小于 0,且越小说明背离程度越大
Plot Bullish: 是否绘制常规底背离提示
Plot Hidden Bullish: 是否绘制隐藏底背离提示
Plot Bearish: 是否绘制常规顶背离提示
Plot Hidden Bearish: 是否绘制隐藏顶背离提示
祝大家交易愉快

ALMA cross signal by hk4jerry<< ALMA CROSS signal >>
*NONE REPAINT STRATEGY*
--As a result of testing for a month, using alma does not result in repainting--
--ALMA 크로스 결과는 한달간의 테스트 결과, 리페인팅되지 않습니다--
(ENGLISH description O)
==NOTE==
1. MA 크로스 지표는 잘못된 신호들이 자주 등장합니다. 정확성을 더 높일수 있는 방법은 없을까 고민을 해봤습니다. 더 낮은 가격에 매수하고, 더 높은 가격에서 매도하는 것이 중요했습니다. 우리가 흔히 저점, 고점을 알아내기 위한 지표이자, 선행지표인 RSI를 추가하는 방법을 연구했습니다.
2. 예를 들어, MA 크로스 매수 신호가 발생했을때, rsi값이 50이면 가격이 더 떨어질 가능성이 큽니다. 하지만, rsi값이 30이하인 경우에만 매수 신호가 발생한다면, 그 가격이 저점일 확률이 매우 높아지는 원리 입니다.
3. 신호는 확률입니다. 트레이딩에 100%는 없습니다. 그 확률을 높이는 것은 리스크 관리 입니다. 분할 매수 관점으로 포지션을 잡으시거나, 단기 매매로 가져가시는걸 추천드립니다.
==rsi ma source 설정==
1. 'rsi ma' 값의 소스입니다.
2. 'rsi 길이' 는 값이 클수록 더욱 정확한 시그널이 발생합니다.
3. EMA 길이가 짧을수록 더 많은 시그널이 발생합니다. 그러나, 정확도는 떨어집니다.
==rsi ma 설정==
1. rsi를 source로한 EMA입니다.
2. rsi와 유사한 성격을 가집니다.
3. 'rsi ma' 값이 30이하이면 과매도, 70이상이면 과매수 입니다.
4. ' rsi ma long value' 이 30이면 매수 신호가 rsi ma 값이 30 이하인 경우에만 발생함을 의미 합니다.
5. "rsi ma short value' 가 70이면 매도 신호가 rsi ma 값이 70 이상인 경우에만 발생함을 의미 합니다.
==rsi 설정==
1. 실제 rsi(14,close) 값을 의미합니다.
2. rsi ma value와 비슷한 기능입니다.
3. rsi 길이가 14이므로, 값은 40~50 사이가 적당합니다.
4. 30 또는 70으로 설정할 시, 신호가 거의 발생하지 않습니다.
(ENG)
==NOTE==
1. MA cross indicator often shows false signals. I was wondering if there is a way to increase the accuracy further. It was important to buy at a lower price and sell at a higher price. We studied how to add RSI, which is a leading indicator and an indicator to find lows and highs, often.
2. For example, when a buy MA cross signal occurs, if the rsi value is 50, the price is more likely to fall. However, if a buy signal occurs only when the rsi value is below 30, the probability that the price is at the bottom is very high.
3. A signal is a probability. There is no 100% in trading. Increasing that probability is risk management. It is recommended to hold a position from the perspective of a split buy or take it as a short-term trade.
==rsi ma source option==
1. The source of the 'rsi ma' value.
2. The larger the 'rsi length' value, the more accurate the signal is generated.
3. Shorter EMA lengths produce more signals. However, the accuracy is reduced.
==rsi ma options==
1. EMA with rsi as the source.
2. It has similar characteristics to rsi.
3. If the 'rsi ma' value is below 30, it is oversold, and if it is above 70, it is overbought.
4. If 'rsi ma long value' is 30, it means that a buy signal will only occur when the rsi ma value is less than or equal to 30.
5. If "rsi ma short value' is 70, it means that a sell signal will only occur when the rsi ma value is above 70.
==rsi option==
1. It means the actual rsi(14,close) value.
2. This function is similar to rsi ma value.
3. Since the rsi length is 14, a value between 40 and 50 is appropriate.
4. When set to 30 or 70, almost no signal is generated.

Screener for 40+ instrumentsAs you probably know in TradingView there is a limit of 40 instruments in one custom screener.
I created a script that will allow you to scan more symbols.
The idea of it is pretty simple. You have to add a screener a few times on your screen with a different set of symbols. Then select column width (as % of your chart width) and # of the screener right to left.
Script will plot #1 screener next to the right border. For #2 and all next tables, the script will compute the needed offset and will draw it on the left. This way it will look like one table and not a few separate indicators.
I created a script with an RSI screener, but you can create more complicated examples with it.
Off course, that's not a silver bullet solution but might work for some of you.
Disclaimer
Please remember that past performance may not be indicative of future results.
Due to various factors, including changing market conditions, the strategy may no longer perform as well as in historical backtesting.
This post and the script don’t provide any financial advice.


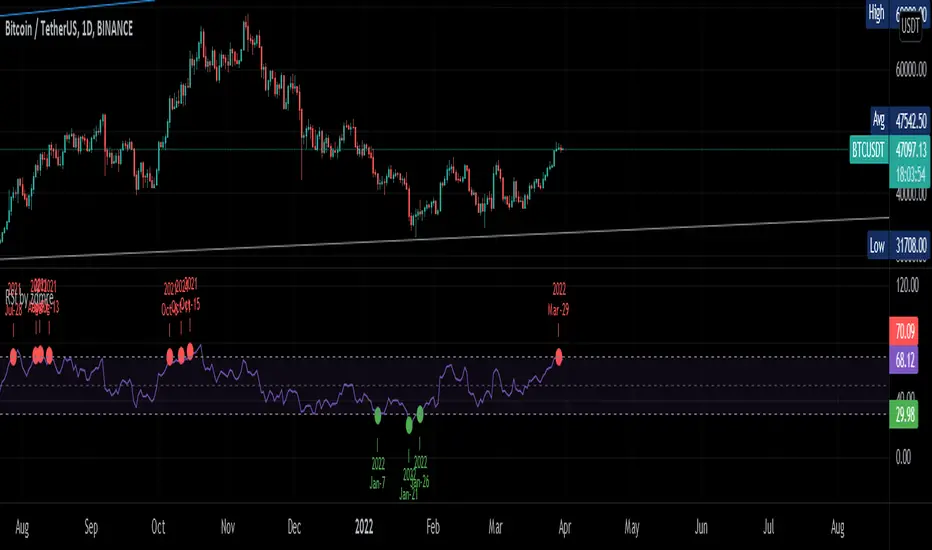
RSI by zdmreTraditional interpretations and usage of the RSI dictate that values of 70 or above suggest that a security becomes overbought or overvalued and may be primed for a trend reversal or corrective price pullback. An RSI reading of 30 or below indicates an oversold or undervalued condition.
30 = Oversold
70 = Overbought
Thanks @DieGobelMonte for your suggestion.
Market Sector Scanner/Screener With MOM + RSI + MFI + DMI + MACDMARKET SECTOR SCANNER/SCREENER MOM + RSI + MFI + DMI + MACD FOR STOCKS CRYPTO & FOREX
This script scans 9 markets constantly and returns the values of 5 different popular indicators.
This indicator helps you see when one of your favorite stocks is bullish or bearish when you are not watching that chart so you can always catch the big moves as they happen.
***HOW TO USE***
A great way to use this market screener is to set up separate chart layouts for each sector you like to trade. Such as the top 9 stocks in the S & P 500, top 9 stocks in the XLF etf, etc. Make sure to set up separate chart layouts in Tradingview so you don’t have to change the symbols constantly. This will give you a good idea in real time if that entire sector is bullish, bearish or mixed. When the entire grid goes red or green, those are very strong signs of market direction across that entire sector, so trades in the corresponding direction are quite safe.
This can be done for crypto as well, using the top 9 cryptocurrencies by market cap. Watch the grid and wait for the entire lot to turn green or red and then take a position in that direction.
You can also use this with a variety of your favorite tickers so you can see when specific markets are looking strong in either direction, instead of constantly changing charts or missing good opportunities because you weren’t watching that specific chart.
This grid can also be used to determine how long to hold a position as well. If the entire grid is still green or red, according to your trade direction, you can usually expect price to continue in that direction until you see some conflicting colors start to pop up on the grid. As it starts to give mixed signals, you can expect the market to be indecisive or reverse which is a good time to get out.
If you have your scanner setup to show similar markets in one sector, be careful taking trades when the grid is very mixed in color. This shows signs of indecision and will likely have choppy price action until the market decides a direction so make sure to use caution when the grid is mixed. It is best to wait for the entire grid to turn green or red and then take position.
***COLOR MEANINGS***
When each indicator value is in bullish territory, the background of that value will turn green.
When each indicator value is in bearish territory, the background of that value will turn red.
When each indicator value is in neutral territory, the background of that value will turn blue.
When all 5 indicators for a ticker are bullish, the ticker background will turn green.
When all 5 indicators for a ticker are bearish, the ticker background will turn red.
When there is a mixture of bullish and bearish values, the ticker background will turn blue.
***CUSTOMIZATION***
You can customize which tickers are in your scanner including stocks, crypto, futures and forex, the source of the indicators, the length of the indicator settings and the smoothing parameters.
***INDICATORS USED***
The indicators used for each ticker are as follows:
Momentum(MOM) - Default length is 14. Bullish is above zero, bearish is below zero.
Relative Strength Index(RSI) - Default length is 14. Bullish is above 50, bearish is below 50.
Money Flow Index(MFI) - Default length is 14. Bullish is above 50, bearish is below 50.
Directional Movement Index(DMI) - Default length is 14 and smoothing is 14. Calculated by subtracting di minus from di plus. If the value is positive, it is bullish. If the value is negative, it is bearish.
Moving Average Convergence & Divergence(MACD) - Default settings are 12, 26, 9. If the short line is greater than the long line, then it is bullish. If the short line is less than the long line, it is bearish.
***MARKETS***
This market scanner can be used as a signal on all markets, including stocks, crypto, futures and forex.
***TIMEFRAMES***
This scanner can be used on all timeframes and pulls data from other tickers using the same timeframe as what your current chart is set to.
***TIPS***
Try using numerous indicators of ours on your chart so you can instantly see the bullish or bearish trend of multiple indicators in real time without having to analyze the data. Some of our favorites are Trend Friend Scalp & Swing Signals, Auto Fibonacci, Directional Movement Index, Volume Profile With Buy/Sell Pressure, Auto Support And Resistance and Money Flow Index in combination with this Scanner. They all have real time Bullish and Bearish labels as well so you can immediately understand each indicator's trend.

MFI + RSI + MOM With Bull & Bear Trend LabelMOMENTUM + MONEY FLOW INDEX + RELATIVE STRENGTH INDEX WITH BULL & BEAR LABELS
This is a combination of 3 popular indicators. Momentum(MOM), Money Flow Index(MFI) and Relative Strength Index(RSI) along with color changing labels that tell you each indicator's current trend.
The middle white line shows the level that each indicator needs to stay above to be bullish and below for bearish. Watch for all three indicators to cross and hold above or below the mid line for big moves.
It is important to note that these indicators do not need to be going up to be bullish or down to be bearish. They just need to hold above or below the mid line to understand the overall trend.
The momentum indicator is the most relevant in my opinion. If it is holding above the mid line steadily, usually the overall trend will continue upwards so look to buy the dips if the momentum cloud is staying above the white line and vice versa.
It is also important to note that the default settings for this indicator are the 100 period as I find it to be super relevant across most charts but these numbers can be changed in the indicator settings.
Since momentum swings wildly past the normal 0-100 range, it is important to note that the momentum line has been “normalized” to stay within this same range as the rsi and mfi. So if you look at a normal momentum indicator side by side with this indicator it will not look the same however, I find it to be a very good indicator of overall direction so I know the current market sentiment even when price is diverging from the indicator directions.
All of the colors, sources and lengths can be easily customized in the indicator settings input tab.
***HOW TO USE***
When Momentum is above the mid line, it is bullish. When Momentum is below the mid line, it is bearish.
A label on the right side will update in real time to tell you if momentum is Bullish or Bearish for faster recognition of the trend.
When RSI is above the mid line, it is bullish. When Momentum is below the mid line it is bearish.
A label on the right side will update in real time to tell you if RSI is Bullish or Bearish for faster recognition of the trend.
When MFI is above the mid line, it is bullish. When MFI is below the mid line it is bearish.
A label on the right side will update in real time to tell you if MFI is Bullish or Bearish for faster recognition of the trend.
This indicator was built to help you quickly identify the Bullish or Bearish nature of the current trend with a live color changing label so you can glance at the label and understand it's direction without analyzing the indicator data.
***MARKETS***
This indicator can be used as a signal on all markets, including stocks, crypto, futures and forex.
***TIMEFRAMES***
This mom + mfi + rsi indicator can be used on all timeframes.
***TIPS***
Try using numerous indicators of ours on your chart so you can instantly see the bullish or bearish trend of multiple indicators in real time without having to analyze the data. Some of our favorites are our Auto Fibonacci, Directional Movement Index, Volume Profile, Auto Support And Resistance and Money Flow Index in combination with this indicator. They all have real time Bullish and Bearish labels as well so you can immediately understand each indicator's trend.

KINSKI Multi Trend OscillatorThe Multi Trend Oscillator is a tool that combines the ratings of several indicators to facilitate the search for profitable trades. I was inspired by the excellent indicator "Technical Ratings" from Team TradingView to create an alternative with a technically new approach. Therefore, it is not a modified copy of the original, but newly conceived and implemented.
The recommendations of the indicator are based on the calculated ratings from the different indicators included in it. The special thing here is that all settings for the individual indicators can be changed according to your own needs and displayed as a histogram and MA line. This provides an excellent visual control of your own settings. Alarms are also triggered.
Criteria for determining the rating
Relative Strength Index (RSI)
Buy - Crossover oversold level and indicator < oversold level and rising
Sell - Crossunder oversold level and indicator >= oversold level and falling
Neutral - neither Buy nor Sell
Relative Strength Index (RSI) Laguerre
Buy - Crossover Oversold Level and Indicator < Oversold Level and rising
Sell - Crossunder oversold level and indicator >= oversold level and falling
Neutral - neither Buy nor Sell
Noise free Relative Strength Index (RSX)
Buy - Crossover Oversold Level and Indicator < Oversold Level and rising
Sell - Crossunder oversold level and indicator >= oversold level and falling
Neutral - neither Buy nor Sell
Money Flow Index (MFI)
Buy - Crossover Oversold Level and Indicator < Oversold Level and rising
Sell - Crossunder oversold level and indicator >= oversold level and falling
Neutral - neither Buy nor Sell
Commodity Channel Index (CCI)
Buy - Crossover Oversold Level and Indicator < Oversold Level and rising
Sell - Crossunder oversold level and indicator >= oversold level and falling
Neutral - neither Buy nor Sell
Moving Average Convergence/Divergence (MACD)
Buy - values of the main line > values of the signal line and rising
Sell - values of the main line < values of the signal line and falling
Neutral - neither Buy nor Sell
Klinger
Buy - indicator >= 0 and rising
Sell - indicator < 0 and falling
Neutral - neither Buy nor Sell
Average Directional Index (ADX)
Buy - indicator > 20 and +DI line crosses over the -DI line and rising
Sell - indicator > 20 and +DI line crosses below the -DI line and falling
Neutral - neither Buy nor Sell
Awesome Oscillator
Buy - Crossover 0 and values are greater than 0, or exceed the zero line
Sell - Crossunder 0 and values are lower than 0, or fall below the zero line
Neutral - neither Buy nor Sell
Ultimate Oscillator
Buy - Crossover oversold level and indicator < oversold level and rising
Sell - Crossunder oversold level and indicator >= oversold level and falling
Neutral - neither Buy nor Sell
Williams Percent Range
Buy - Crossover Oversold Level and Indicator < Oversold Level and rising
Sell - Crossunder Oversold Level and Indicator >= Oversold Level and falling
Neutral - neither Buy nor Sell
Momentum
Buy - Crossover 0 and indicator levels rising
Sell - Crossunder 0 and indicator values falling
Neutral - neither Buy nor Sell
Total Ratings
The numerical value of the rating "Sell" is 0, "Neutral" is 0 and "Buy" is 1. The total rating is calculated as the average of the ratings of the individual indicators and are determined according to the following criteria:
MaxCount = 12 (depending on whether other oscillators are added).
CompareSellStrong = MaxCount * 0.3
CompareMid = MaxCount * 0.5
CompareBuyStrong = MaxCount * 0.7
value <= CompareSellStrong - Strong Sell
value < CompareMid and value > CompareSellStrong - Sell
value == 6 - Neutral
value > CompareMid and value < CompareBuyStrong - Buy
value >= CompareBuyStrong - Strong Buy
Understanding the results
The Multi Trend Oscillator is designed so that its values fluctuate between 0 and currently 12 (maximum number of integrated indicators). Its values are displayed as a histogram with green, red and gray bars. The bars are gray when the value of the indicator is at half of the number of indicators used, currently 12. Increasingly saturated green bars indicate increasing values above 6, and increasingly saturated red bars indicate increasingly decreasing values below 6.
The table at the end of the histogram shows details (can be activated in the settings) about the overall rating and the individual indicators. Its color is determined by the rating value: gray for neutral, green for buy or strong buy, red for sell or strong sell.
The following alarms are triggered:
Multi Trend Oscillator: Sell
Multi Trend Oscillator: Strong Sell
Multi Trend Oscillator: Buy
Multi Trend Oscillator: Strong Buy

Adaptive Oscillator constructor [lastguru]Adaptive Oscillators use the same principle as Adaptive Moving Averages. This is an experiment to separate length generation from oscillators, offering multiple alternatives to be combined. Some of the combinations are widely known, some are not. Note that all Oscillators here are normalized to -1..1 range. This indicator is based on my previously published public libraries and also serve as a usage demonstration for them. I will try to expand the collection (suggestions are welcome), however it is not meant as an encyclopaedic resource , so you are encouraged to experiment yourself: by looking on the source code of this indicator, I am sure you will see how trivial it is to use the provided libraries and expand them with your own ideas and combinations. I give no recommendation on what settings to use, but if you find some useful setting, combination or application ideas (or bugs in my code), I would be happy to read about them in the comments section.
The indicator works in three stages: Prefiltering, Length Adaptation and Oscillators.
Prefiltering is a fast smoothing to get rid of high-frequency (2, 3 or 4 bar) noise.
Adaptation algorithms are roughly subdivided in two categories: classic Length Adaptations and Cycle Estimators (they are also implemented in separate libraries), all are selected in Adaptation dropdown. Length Adaptation used in the Adaptive Moving Averages and the Adaptive Oscillators try to follow price movements and accelerate/decelerate accordingly (usually quite rapidly with a huge range). Cycle Estimators, on the other hand, try to measure the cycle period of the current market, which does not reflect price movement or the rate of change (the rate of change may also differ depending on the cycle phase, but the cycle period itself usually changes slowly).
Chande (Price) - based on Chande's Dynamic Momentum Index (CDMI or DYMOI), which is dynamic RSI with this length
Chande (Volume) - a variant of Chande's algorithm, where volume is used instead of price
VIDYA - based on VIDYA algorithm. The period oscillates from the Lower Bound up (slow)
VIDYA-RS - based on Vitali Apirine's modification of VIDYA algorithm (he calls it Relative Strength Moving Average). The period oscillates from the Upper Bound down (fast)
Kaufman Efficiency Scaling - based on Efficiency Ratio calculation originally used in KAMA
Deviation Scaling - based on DSSS by John F. Ehlers
Median Average - based on Median Average Adaptive Filter by John F. Ehlers
Fractal Adaptation - based on FRAMA by John F. Ehlers
MESA MAMA Alpha - based on MESA Adaptive Moving Average by John F. Ehlers
MESA MAMA Cycle - based on MESA Adaptive Moving Average by John F. Ehlers , but unlike Alpha calculation, this adaptation estimates cycle period
Pearson Autocorrelation* - based on Pearson Autocorrelation Periodogram by John F. Ehlers
DFT Cycle* - based on Discrete Fourier Transform Spectrum estimator by John F. Ehlers
Phase Accumulation* - based on Dominant Cycle from Phase Accumulation by John F. Ehlers
Length Adaptation usually take two parameters: Bound From (lower bound) and To (upper bound). These are the limits for Adaptation values. Note that the Cycle Estimators marked with asterisks(*) are very computationally intensive, so the bounds should not be set much higher than 50, otherwise you may receive a timeout error (also, it does not seem to be a useful thing to do, but you may correct me if I'm wrong).
The Cycle Estimators marked with asterisks(*) also have 3 checkboxes: HP (Highpass Filter), SS (Super Smoother) and HW (Hann Window). These enable or disable their internal prefilters, which are recommended by their author - John F. Ehlers . I do not know, which combination works best, so you can experiment.
Chande's Adaptations also have 3 additional parameters: SD Length (lookback length of Standard deviation), Smooth (smoothing length of Standard deviation) and Power ( exponent of the length adaptation - lower is smaller variation). These are internal tweaks for the calculation.
Oscillators section offer you a choice of Oscillator algorithms:
Stochastic - Stochastic
Super Smooth Stochastic - Super Smooth Stochastic (part of MESA Stochastic) by John F. Ehlers
CMO - Chande Momentum Oscillator
RSI - Relative Strength Index
Volume-scaled RSI - my own version of RSI. It scales price movements by the proportion of RMS of volume
Momentum RSI - RSI of price momentum
Rocket RSI - inspired by RocketRSI by John F. Ehlers (not an exact implementation)
MFI - Money Flow Index
LRSI - Laguerre RSI by John F. Ehlers
LRSI with Fractal Energy - a combo oscillator that uses Fractal Energy to tune LRSI gamma
Fractal Energy - Fractal Energy or Choppiness Index by E. W. Dreiss
Efficiency ratio - based on Kaufman Adaptive Moving Average calculation
DMI - Directional Movement Index (only ADX is drawn)
Fast DMI - same as DMI, but without secondary smoothing
If no Adaptation is selected (None option), you can set Length directly. If an Adaptation is selected, then Cycle multiplier can be set.
Before an Oscillator, a High Pass filter may be executed to remove cyclic components longer than the provided Highpass Length (no High Pass filter, if Highpass Length = 0). Both before and after the Oscillator a Moving Average can be applied. The following Moving Averages are included: SMA, RMA, EMA, HMA , VWMA, 2-pole Super Smoother, 3-pole Super Smoother, Filt11, Triangle Window, Hamming Window, Hann Window, Lowpass, DSSS. For more details on these Moving Averages, you can check my other Adaptive Constructor indicator:
The Oscillator output may be renormalized and postprocessed with the following Normalization algorithms:
Stochastic - Stochastic
Super Smooth Stochastic - Super Smooth Stochastic (part of MESA Stochastic) by John F. Ehlers
Inverse Fisher Transform - Inverse Fisher Transform
Noise Elimination Technology - a simplified Kendall correlation algorithm "Noise Elimination Technology" by John F. Ehlers
Except for Inverse Fisher Transform, all Normalization algorithms can have Length parameter. If it is not specified (set to 0), then the calculated Oscillator length is used.
More information on the algorithms is given in the code for the libraries used. I am also very grateful to other TradingView community members (they are also mentioned in the library code) without whom this script would not have been possible.
