On-Chart QQE of RSI on Variety MA [Loxx]On-Chart QQE of RSI on Variety MA (Quantitative Qualitative Estimation) is usually calculated using RSI. This version is uses an RSI of a Moving Average instead. The results are completely different than the original QQE. Also, this version is drawn directly on chart. There are four types of signals.
What is QQE?
Quantitative Qualitative Estimation (QQE) is a technical analysis indicator used to identify trends and trading opportunities in financial markets. It is based on a combination of two popular technical analysis indicators - the Relative Strength Index (RSI) and Moving Averages (MA).
The QQE indicator uses a smoothed RSI to determine the trend direction, and a moving average of the smoothed RSI to identify potential trend changes. The indicator then plots a series of bands above and below the moving average to indicate overbought and oversold conditions in the market.
The QQE indicator is designed to provide traders with a reliable signal that confirms the strength of a trend or indicates a possible trend reversal. It is particularly useful for traders who are looking to trade in markets that are trending strongly, but also want to identify when a trend is losing momentum or reversing.
Traders can use QQE in a number of different ways, including as a confirmation tool for other indicators or as a standalone indicator. For example, when used in conjunction with other technical analysis tools like support and resistance levels, the QQE indicator can help traders identify key entry and exit points for their trades.
One of the main advantages of the QQE indicator is that it is designed to be more reliable than other indicators that can generate false signals. By smoothing out the price action, the QQE indicator can provide traders with more accurate and reliable signals, which can help them make more profitable trading decisions.
In conclusion, QQE is a popular technical analysis indicator that traders use to identify trends and trading opportunities in financial markets. It combines the RSI and moving average indicators and is designed to provide traders with reliable signals that confirm the strength of a trend or indicate a possible trend reversal.
What is RSI?
RSI stands for Relative Strength Index . It is a technical indicator used to measure the strength or weakness of a financial instrument's price action.
The RSI is calculated based on the price movement of an asset over a specified period of time, typically 14 days, and is expressed on a scale of 0 to 100. The RSI is considered overbought when it is above 70 and oversold when it is below 30.
Traders and investors use the RSI to identify potential buy and sell signals. When the RSI indicates that an asset is oversold, it may be considered a buying opportunity, while an overbought RSI may signal that it is time to sell or take profits.
It's important to note that the RSI should not be used in isolation and should be used in conjunction with other technical and fundamental analysis tools to make informed trading decisions.
This indicator makes use of the following libraries:
Loxx's Moving Averages
Loxx's Expanded Source Types
Extras
Alerts
Signals
Signal Types
Change on Levels
Change on Slope
Change on Zero
Change on Original
Relative Strength Index (RSI)

Volume DockThis oscillator has two different modes:
The first one called RSIs is a comparison between the Relative strength index of the Accumulation/Distribution (and the On Balance Volume) and the normal price, to analyze the differences in momentum between the price with volume and without.
The second one, called Dock, is similar except for the fact that the lines are smoothed using the hull moving average formula, this mode is great to signal entries and for reversal analyzing.

CoffeeShopCrypto 3pl MAThe CoffeeShopCrypto 3pl MA indicator is a technical analysis tool that uses three different moving averages to identify trends in the price of an asset. The three moving averages have lengths of 12, 26, and 50. If these numbers sound familiar its because they are based off the standard of the MACD indicator, and can be either simple moving averages (SMA) or exponential moving averages (EMA), depending on user preference.
The following is plotted on the chart
The fast EMA/SMA (based on the 12-period length) in yellow.
The mid EMA/SMA (based on the 26-period length) in gray.
The slow EMA/SMA (based on the 50-period length) in either green or red, depending on whether the current close price is above or below the Overall Trend MA.
In addition to the moving averages, the indicator also calculates the MACD (Moving Average Convergence Divergence), and uses it to color the bars based on the momentum of the asset.
The MACD is calculated using two user-defined lengths (fast and slow), as well as a user-defined smoothing length for the signal line. The oscillator and signal line can be either SMA or EMA, and the colors of the MACD bars are based on whether the histogram is growing or falling, and whether it is above or below the zero line.
Overall, this indicator provides traders with a comprehensive tool for understanding the trend of an asset, as well as the momentum behind that trend. The moving averages provide a clear visual representation of the trend, while the MACD bars give insight into the strength of that trend and potential shifts in momentum.
---------------LONG ENTRY----------------
MA1 above MA2 and Overall trend = Green
IF RSI is above its midline you are confirmed for a long entry
-----------Short Entry--------------
MA1 below MA2 and Overall trend = Red
IF RSI is below its midline you are confirmed for a short entry

RSI with Keltner Channel (+EMA Ribbon)Note that the EMA Ribbon is not embedded into the custom RSI with KC. In the future I plan to embed it. The EMA Ribbon I use is the following:
This is my very first attempt at modifying an indicator. I basically attempted to add a Keltner Channel around RSI.
This was used as an alternative channel to the standard Bollinger Band. KC goes hand-in-hand with the EMA Ribbon. KC also helps to better pinpoint relative-overbought/oversold conditions.
In my belief, the 20-80 levels don't behave as overbought/oversold levels. An exponential chart would always be overbought. So a Keltner Channel could in theory (and in practice) give us greater understanding on chart analysis.
This custom indicator is a bodge . It has lots of extra calculations that can be removed. I post this rough indicator for the community to give feedback on how I can improve it, or perhaps give an idea to some of you. Please don't judge me, I wouldn't post it but lately some have asked me about it.
In the future I would like to embed an EMA ribbon in this RSI indicator, just like I did in the following idea.
During this period, I don't really have the time to fix this indicator to my standards. So I will leave it as is for the foreseeable future.
If you have the will and knowledge however, feel free to built upon this indicator and share it!
Tread lightly, for this is hallowed ground.
-Father Grigori
PS. In this indicator, I would replace all the moving averages with an EMA Ribbon "average".

Triple RSI Indicator with ToggleThis script combines three relative strength index (RSI) indicators with different periods, and allows the user to toggle between them to generate overbought and oversold signals. The indicator is named "Triple RSI Indicator with Toggle" and has the short title "TRSI-T."
The input parameters for the RSI periods are set by the user and include a short RSI with a period of 5, a main RSI with a period of 14, and a long RSI with a period of 28. The overbought and oversold levels for each RSI can also be set by the user.
The script plots the three RSI lines on the chart and calculates a bar color based on the enabled RSI values. If all three RSI values are overbought, the bar color is set to fuchsia, if all three RSI values are oversold, the bar color is set to aqua, and if neither of these conditions is met, the bar color is set to not available.
The script also includes a fast RSI and an RSI exponential moving average (EMA) with adjustable periods. The RSI fast line is plotted along with the RSI EMA line, and a cloud fill is generated between the two lines. The fill color is based on whether the fast RSI line is above or below the RSI EMA line, with a blue color used for long signals and a pink color used for short signals.
This indicator can be used as part of a trading strategy in a number of ways. Here are a few examples:
Overbought and Oversold Signals: When the bar color of the indicator is fuchsia, it indicates that all three RSIs are overbought, and when the bar color is aqua, it indicates that all three RSIs are oversold. These signals can be used to enter a trade in the opposite direction, anticipating a reversal in price.
RSI Divergence: Traders can also look for divergences between the price and the RSI values. For example, if the price is making higher highs but the RSI values are making lower highs, it could indicate that the price trend is weakening and a reversal may be imminent. Conversely, if the price is making lower lows but the RSI values are making higher lows, it could indicate that the price trend is about to reverse.
RSI Cloud Signals: The cloud fill generated between the fast RSI and RSI EMA lines can be used to generate trading signals. When the fast RSI line is above the RSI EMA line and the fill color is blue, it can be a signal to go long. When the fast RSI line is below the RSI EMA line and the fill color is pink, it can be a signal to go short.
If anybody has some interesting thoughts on how to improve it, let me know!!
Rainbow Collection - BlueSlopes are an increasingly key concept in Technical Analysis. The most basic type is to calculate them on the prices, but also on technical indicators such as moving averages and the RSI.
In technical analysis, you generally use the RSI to detect imminent reversal moves within a range. In the case of the Blue indicator, we are calculating the slope of the market price and then calculating the RSI of that slope in order to detect instances of reversal.
The Blue indicator is therefore used as follows:
* A bullish signal is generated whenever the 21-period RSI of the 21-period market slope surpasses 30 after having been below it but remains below 35.
*A bearish signal is generated whenever the 21-period RSI of the 21-period market slope breaks 70 after having been above it but remains above 65.
The aim of the Blue indicator is to capture reversals as early as possible through a combination of slopes and entry techniques.

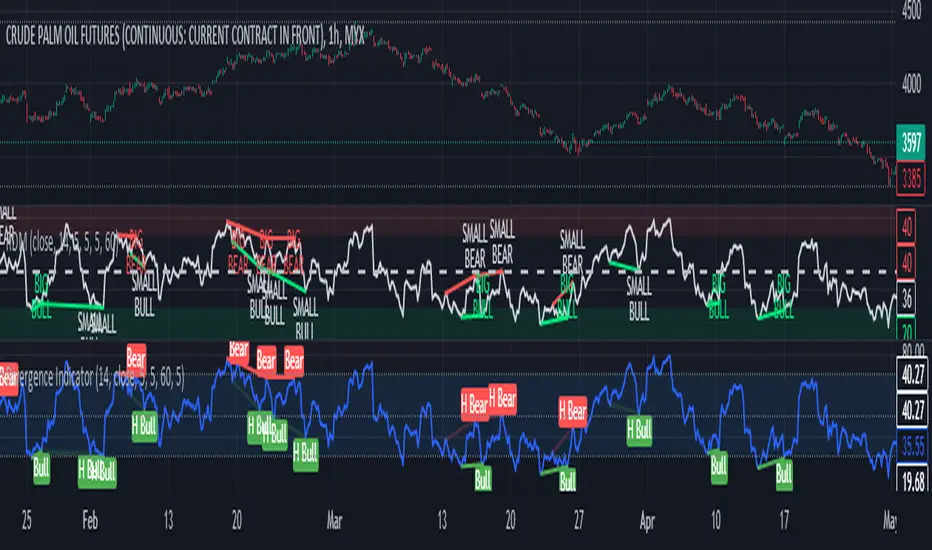
RSI Divergence Method█ OVERVIEW
This is a divergence indicator based on Relative Strength Index (RSI).
My attempt to make this indicator updated based on latest pine script features such as type, object and method.
█ FEATURES
1. Color of plot and label is based on contrast color of chart background. Able to customize color from style menu.
2. Big divergence (Regular Divergence) is based on lime / red color.
3. Small divergence (Hidden Divergence) is based on contrast color of chart background.
█ EXAMPLES / USAGES
Momentum PlayTraders always need a confirmation of momentum in price action to ride the swings.
Momentum Play Indicator consists of the below:
Bullish Conditions :
1)EMA 8 above EMA 34 and rising
2)Candle close above 5 candle high
3) RSI above 60
4) Volume above 5 candles avg. volume
5) ADX above 20
Bearish Conditions :
1)EMA 8 below EMA 34 and falling
2)Candle close below 5 candle low
3) RSI below 40
4) Volume above 5 candles avg. volume
5) ADX above 20
Traders can change the inputs as per their liking to adjust as per their comfortable timeframe.
Credits: Special Thanks to Mr. DTBHAT for sharing the above conditions.

Cloud Bunching [5ema]Reused some functions from (i believe made by):
©paaax: The table position function.
@QuantNomad: The function calculated value and array screener for 40+ instruments .
How it uses:
Gives signal when the cloud is bunching with ratio smaller than the set ratio and the close price breaking out the cloud.
Track 40 different symbols, on any timeframe to follow and alert.
When a symbol has a signal, it will display on the chart and send an alert.
How it works:
The cloud created by 5 EMA (20, 50, 200, 460, 610). Upper Cloud is max EMA , Lower Cloud is min EMA . Center line is averange (5 EMA )
If the ratio upper / lower < input bunching (%) -> change color of cloud.
Get the signal if: the close price break out cloud (with bar is shooting, or hammer ,...) and high volume (or not).
With another symbols (max 40 ) also use that function with any time frame. By request.security() and array function.
How it setting:
Change the bunching rate (%) of the clouds for any symbols.
Change the percentage (%) of the close price that breaks out of the bunching cloud.
Choose volume condition.
Show or turn off the cloud, table.
Select the symbol to follow.
Choose a timeframe to follow other symbols.
----
This indicator is for reference only, you need your own method and strategy.
If you have any questions, please let me know in the comments.

RSI Screener and Divergence [5ema]
Displayed on the RSI chart according to a custom timeframe.
Displays the RSI tracking table of various timeframes.
Identify normal divergence, hidden divergence on RSI chat.
Show buy and sell signals (strong, weak) on the board.
Send notifications when RSI has a buy or sell signal.
-----
I reused some functions, made by (i believe that):
©paaax : The table position function.
@everget : The RSI divergence function.
@QuantNomad : The function calculated value and array to show on table for input symbols.
I have commented in my code. Thanks so much!
-----
How it works:
1. Input :
input.int length of RSI => calculate RSI.
input.int upper/lower => checking RSI overbought/oversold.
input.int right bars / left bars => returns price of the pivot low & high point => checking divergence.
input.int range upper / lower bars => compare the low & high point => checking divergence.
input.timeframe => request.security another time frame.
input.string table position => display screener table.
2. Input bool:
plot RSI on chart.
Plot Regular Bullish divergence .
Regular Bearish divergence.
Hidden Bullish divergence .
Hidden Bearish divergence.
3. Basic calculated:
Make function for RSI , pivot low & high point of RSI and price.
Request.security that function for earch time frame.
Result RSI, Divergence.
4. Condition of signal:
Buy condition:
RSI oversold (1)
Bullish divergence (2).
=> Buy if (1) and (2), review buy (1) or (2).
Sell condition:
RSI overbought (3).
Bearish divergence (4).
=> Sell if (3) and (4), review sell (3) or (4).
5. Table screener:
Time frame.
RSI (green - oversold, red - overbought)
Divergence (⬈⬈ - regular bullish , ⬊⬊ regular bearish , ⬊ - hidden bullish , ⬈ - hidden bearish ).
Signal (🟢 - Buy, 🔴 - sell, green 〇 - review buy, red 〇 - review sell)
----
This indicator is for reference only, you need your own method and strategy.
If you have any questions, please let me know in the comments.

SumIndTarget:
The SumInd indicator combines Heiking Ashi, Sar Parabolic, Koncord, RSI, DMI, MACD and Bollinger Bands to give buy or sell signals or trends. This are called base indicators.
The goal is to have a clear and quick buy or sell suggestion and to avoid evaluating all or some of the named indicators, especially if they give contradictory signals among them. This speed and simplicity helps the trader to see several tickers in less time. It is intended for all markets and time periods where the above-mentioned indicators can be used.
How it works:
SumInd already has the importance or "weight" of each indicator named above configured, but they can be modified. You can set 0% for no use, or any other value based on the weight you want to give it, between 1% and 200% where 100% is the normal use, and increases or decreases based on importance.
Each base indicator can give signals to buy, sell or just "wait and see".
Each base indicator is checked for a buy signal, in which case its weight is added to the positive or green line, and if there is a sell signal, its weight is subtracted from the sell or red line. in case of indeterminacy or 'wait and see', nothing is added to any signal.
The yellow or total line is the sum of the buy or green signal plus the sell or red signal.
If the yellow or total line rises above the buy level, the background changes to green and an up arrow appears at the bottom of the chart indicating the buy suggestion, because most of the indicators you are interested in gave a buy signal.
If the yellow line or total falls below the sell level, the background changes to red and a downward arrow appears in the upper area of the chart indicating the sell suggestion, because most of the indicators you are interested in gave a sell signal.
The Buy and Sell level can be changed according to the security of the suggestion you need.
Areas without arrows or marks are considered "wait and see" areas, the previous trend in principle continues. They can be marked with the default background if desired from the SumInd settings.
Details and criterials:
Each of the following indicators can be turned on or off and assigned different weights of importances, by whether or not it shares the following criteria:
Heikin Ashi candles: add or subtract half an assigned weight if there is a buy or sell candle and the other half weight if there are two consecutive candles with the same signal.
RSI: Adds or subtracts the assigned weight if the ema is below or above the signal.
Parabolic Sar: Adds half a weight in transition to buy or sell and another half weight if there are two consecutive signals of the same trend.
Koncord: Add or subtract the weight if the current trend (mountain) grows or decreases respectively from the 4th previous time signal, and also the value (red line) is less than 35 or exceeds 65 respectively.
DMI: Adds or subtracts a quarter of the weight assigned by the DMI signal multiplied by the value of DMI, if the positive or negative signal exceeds the other negative or positive signal by 15% respectively.
Bollinger Bands: Add or subtract the weight if the previous third signal touches or falls out of the zone and keeps growing or decreasing respectively.
MACd: Add or subtract one third of the weight if the last 3 time signals are rising or falling, Add or subtract another third if the fast signal is above or below the slow signal, and Add or subtract the last third of the weight if it is rising with the negative fast signal, or falling with the positive fast signal.

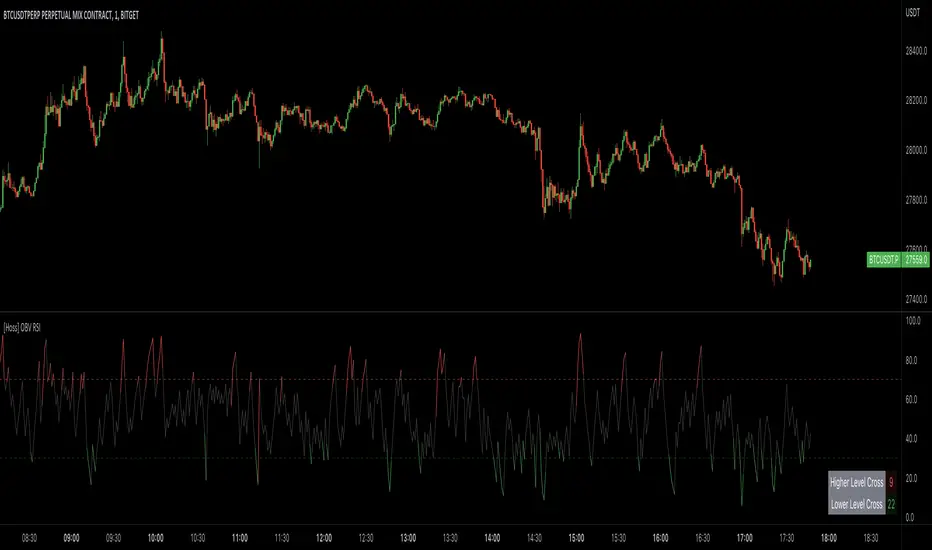
[Hoss] OBV RSIThe OBV ( On Balance Volume ) RSI ( Relative Strength Index ) indicator is an innovative tool that combines the power of OBV and RSI to provide traders with a comprehensive view of the market's momentum and volume dynamics. This combination enables users to make better-informed trading decisions by analyzing the relationship between price, volume , and relative strength .
The script starts by calculating the On Balance Volume , which is a cumulative volume-based indicator that measures buying and selling pressure. The OBV increases when the closing price is higher than the previous closing price and decreases when the closing price is lower than the previous closing price. This helps traders identify potential price trend reversals based on volume accumulation or distribution.
Next, the script computes the Relative Strength Index ( RSI ) based on the OBV values, offering a unique perspective on the market's momentum through the lens of volume . The RSI is a popular momentum indicator that ranges from 0 to 100 and helps traders identify overbought and oversold conditions. In this script, the user can define the RSI length and the higher and lower levels (default values are 70 and 30, respectively).
A distinctive feature of this OBV RSI indicator is the addition of a monitor that counts the number of times the RSI crosses above the higher level and below the lower level within a user-defined lookback period. This monitor is displayed as a table in the bottom right corner of the chart and can be enabled or disabled through an input option.
The cross count monitor provides valuable insights into the historical frequency of RSI crossings, helping traders to identify potential trading opportunities based on historical price behavior around these levels.
Supertrend ANY INDICATOR (RSI, MFI, CCI, etc.) + Range FilterThis indicator will generate a supertrend of your chosen configuration on any of the following indicators:
RSI
MFI
Accum/Dist
Momentum
On Balance Volume
CCI
There is also a RANGE FILTER built into the scripts so that you can smooth the indicators for the supertrend. This is an optional configuration in the settings. Also, you can change the oversold/overbought bounds in the settings (they are removed entirely for indicators without bounds).
If you find this indicator useful, please boost it and follow! I am open to suggestions for adding new indicators to this script, it's very simple to add new ones, just suggest them in the comments.

RSI is in Normal Distribution?Does RSI Follow a Normal Distribution?
The value of RSI was converted to a value between 0~2, 2~4, ..., 98~100, and the number of samples was graphed.
The Z values are expressed so that the values corresponding to 30 and 70 of the RSI can be compared with the standard normal distribution.
Additionally, when using the RSI period correction function of the 'RSI Candle Advanced V2' indicator that I made before, it shows no change in standard deviation.
RSI는 정규분포를 따를까요
RSI의 값을 0~2, 2~4, ..., 98~100 사이 값으로 변환하고 그 표본 갯수를 그래프로 표현하였습니다.
Z 값은 RSI의 30, 70에 해당하는 값을 표준정규분포와 비교할 수 있도록 표현하였습니다.
추가적으로 제가 예전에 만들었던 'RSI Candle Advanced V2' 지표의 RSI 기간 보정 함수를 사용할 경우 표준편차의 변화가 없음을 보입니다.

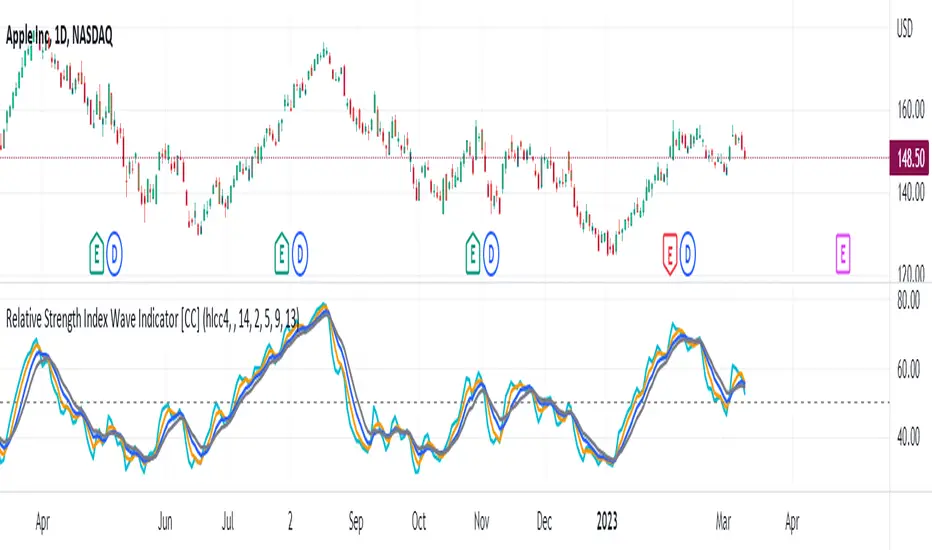
Relative Strength Index Wave Indicator [CC]The Relative Strength Index Wave Indicator was created by Constance Brown (Technical Analysis for the Trading Professional), and this is a unique indicator that uses the weighted close formula, but instead of using the typical price values, it uses the RSI calculated from the various prices. It then creates a rainbow by smoothing the weighted RSI with four different lengths. As far as the buy or sell signals with this indicator go, I did change things from the original source, so feel free to experiment and let me know if anything works better for you. I decided to do a variation of the original source and create buy and sell signals based on crossovers, but my version only uses the first and second smoothed RSI lines. You could also average all of the lines and buy when the average is rising and sell when it starts to fall. I have used my typical buy and sell signals to use darker colors for strong signals and lighter colors for normal signals. Because of the rainbow effect from the wave, the color changes will only appear for the bar itself when you enable that setting.
Let me know if there is any other script you would like to see me publish! I will have plenty more RSI scripts to publish in the next week. Let me know if you like this indicator series.
Reverse Double Smoothed Relative Strength Index Bands[CC]The Reverse Double Smoothed Relative Strength Index Bands is a custom script of mine that is another part of my RSI indicator series, which I will be publishing over the next week or so. This takes my Double Smoothed Relative Strength Index script and applies the Reverse RSI formula to create a new Bollinger Bands type indicator. This concept can work for almost any oscillator with some slight tweaking. I have a reverse RSI being calculated for each major RSI level to give you an approximation of what the price would look like if that RSI level was hit. Feel free to tweak the RSI levels of course. I will publish more Reverse indicators since that doesn't seem to be a topic that is touched on very frequently. I have color coded the indicator to show darker colors when it is a strong signal and lighter colors for normal signals. Buy when the lines turn green and sell when they turn red.
This was a custom request from @kerpiciwuasile so let me know if you want to see me publish another custom script!

Reverse Relative Strength Indicator [CC]The Reverse Relative Strength Index was created by Giorgos Siligardos (Stocks & Commodities V. 21:6 (18-30)). It is a handy indicator that reverse engineers the RSI price calculation to show what the price would have to be for the RSI value to match our chosen input. You can select your chosen RSI level using the RSI Level input for this indicator. For example if you wanted to see what the price would be for the RSI value to match the oversold level then you would set the RSI Level for 30 and it will plot that price on the chart. This uses some simple math to extrapolate the price with some basic algebra from the typical RSI calculation. This, of course, is a very similar concept to my previous Reverse Moving Average Convergence Divergence script. This indicator formula can be used for any oscillator with some slight tweaking and could also be customized to show the price for overbought and oversold levels, which I will probably do in the near future. This indicator is useful in many ways such as a trend indicator as my example shows or for a price projection tool. For example, if you had a current RSI level of 66 and it was going up and you want to see what the price would be if it reached the overbought level then you could do that. Let me know what works well for you and if you have any suggestions for how to further improve upon this script. I have included darker colors to show stronger signals and lighter colors to show normal signals. Buy when the line turns green and sell when it turns red.
I have a bunch of backlogged scripts that I'm trying to publish, so I figured I would focus on my RSI scripts since I have a bunch, so be prepared to see a bunch of those over the next week or so. Let me know if there are any other scripts you would like to see me publish!

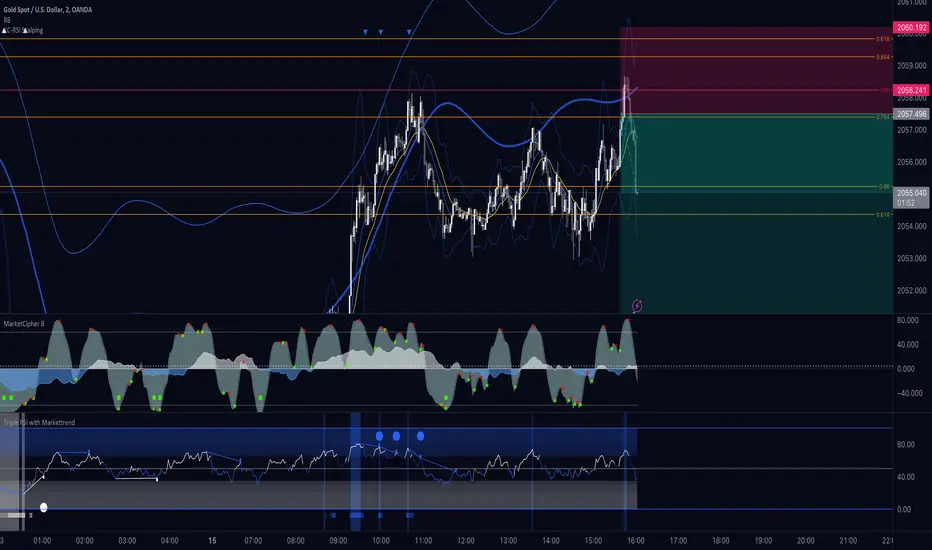
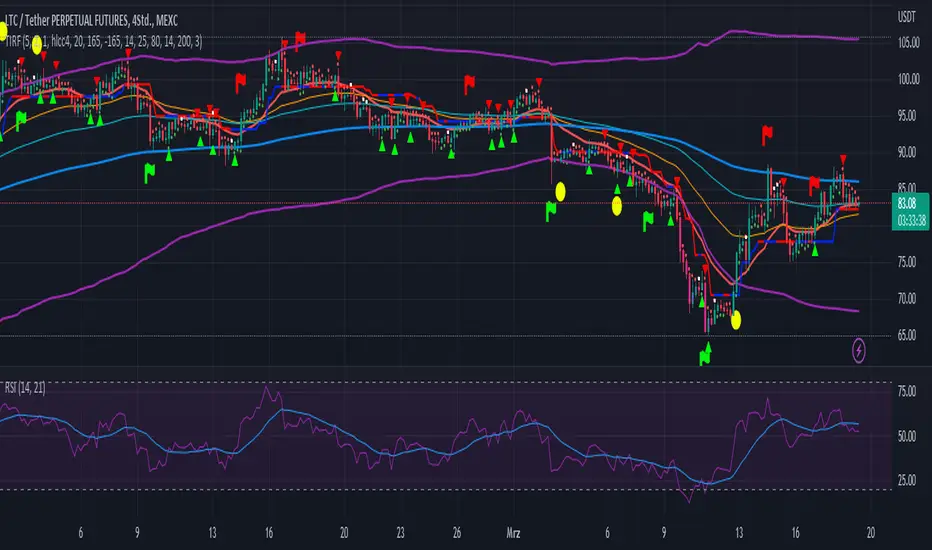
Trend Indicator with RSI and Fibbonacci Band 0.702 crossingsToday we have a new Indicator set, which I created using inspiration from the Trend Magic Indicator from KivancOzbilgic and adding several new aspects to it and a slightly modified calculation of the trend indicator itself.
You can change the inputs by changing the pre set values in the settings, but I found the current settings quite accurate. Feel free to experiment to fine tune the indicators.
Here are the details of the script:
Trend indicated within candles and as a line
- bullish and bearish trends are now also indicated within the candle based on the CCI calculation.
- Bullish is indicated by a green circle below the candle or as one may call it a "dot"
- bearish trend is indicated by a red circle above the candle
Entry Signal based on RSI crossing its EMA
- my motivation was to have a clearer entry signal besides highlighting a trend, which can not really be used to identify a good entry but to give confidence or when loosing trend to give an exit signal.
- after studiying the RSI and how it works together with its EMA it looks quite interesting as an entry or exit signal. But be cautios if the EMA and RSI values are moving in a narrow area we get a lot of crosses and therefore signals which should rather be ignored rather to be act on. So the the range where the cross happens is also quite important. But this aspect is not yet reflected as a rule/ logic.
But I am thinking of adding something.. or alternativly best to switch to another timeframe to get some better data
RSI overbought and oversold as Diamonds
- I also added key indications of oversold or overbought as Blue and Pink diamonds, can be considered as additional information to maybe identify a short term top or bottom.. but its not very accurate.
Entry signal based on crossing Fibbonachi Band 0.702
- So far the 0.702 seems to be quite an interesting retracement level which seems to be met a lot of times
- based on the assumption the price will evantually hit the 0.702 either direction I wanted to get a signal when this happens
- BUT! a big but, unfortunalty the Fibbonachi bands tend to bloat up in case of high volatility so it is not easy to find the crossing on higher timeframes
Here are the standard value which I found quite accurate for the assets I use this indicator set:
CCI Period = 5
ATR Multiplier = 1
ATR Period = 1
Source = High Low Close (hlc3 average value of the candle
Here the inputs used for the RSI Crossing signal (here you should play around a little to see which entry would have been best..)
RSI Length = 14
RSI Oversold = 25 (to be used for the "golden" entry signal based on the FBB crossing)
RSI Overbought = 80 (to be used for the "golden" entry signal based on the FBB crossing)
RSI Moving Average Length
In future versions I will add options to activate or deactive some of the plotting and espacially this golden dot when the fibbonachi band is being crossed needs some fine tuning..
And lets see if there is a way to fix the bloating of those bands..
TASC 2023.03 Every Little Bit Helps - Special EditionMy first Published contribution.
Gracious thank you to all Pine Coders,
this has subtle features that have multiple shifts based on inputs.
with some experimentation, one might try pushing other sources
at the hue dials and see more dynamic indication.
for John Ehlers article
TASC Magazine This Month.
- Special Edition.
MACD & RSI Overlay (Expo)█ Overview
The MACD & RSI Overlay (Expo) trading indicator is a technical analysis tool that combines two popular indicators, the Relative Strength Index (RSI ) and the Moving Average Convergence Divergence (MACD ), and overlays them onto the price chart. The indicator oscillates relative to price, so it plots the RSI and MACD around price while still displaying the same insights as the regular MACD and RSI indicators. This feature gives traders a unique perspective, allowing them to see the relationship between price, momentum, and trend in a single chart.
This indicator is a valuable addition to any trader's technical analysis toolkit, whether they are a beginner or an experienced trader.
█ MACD
█ RSI
The RSI comes with overbought and oversold areas, which can be set by the trader.
█ MACD & RSI
█ Trend Feature
What sets the MACD & RSI Overlay indicator apart is its ability to factor in the underlying trend. This feature makes the indicator more useful than ever before, as traders can use it to filter trades in the direction of the trend. By considering the underlying trend, traders can gain valuable insights into market trends.
█ Benefits
One of the primary benefits of having the MACD and RSI plotted directly on the price chart is that it provides a more intuitive understanding of the relationship between price, momentum, and trend. Traders can quickly identify the direction of the trend by observing the price movement relative to the MACD and RSI lines. In addition, by having these indicators plotted on the chart, traders can quickly identify potential buy and sell signals and develop new trading strategies.
█ How to use
One of the most popular strategies is to use the MACD & RSI Overlay indicator to look for crossings. A crossing occurs when the MACD and RSI lines cross over each other or when they cross over the signal line. These crossings can signal potential trend reversals and momentum shifts. For example, if the MACD line crosses over the signal line from below, it could indicate a bullish signal, while a cross from above could indicate a bearish signal.
-----------------
Disclaimer
The information contained in my Scripts/Indicators/Ideas/Algos/Systems does not constitute financial advice or a solicitation to buy or sell any securities of any type. I will not accept liability for any loss or damage, including without limitation any loss of profit, which may arise directly or indirectly from the use of or reliance on such information.
All investments involve risk, and the past performance of a security, industry, sector, market, financial product, trading strategy, backtest, or individual's trading does not guarantee future results or returns. Investors are fully responsible for any investment decisions they make. Such decisions should be based solely on an evaluation of their financial circumstances, investment objectives, risk tolerance, and liquidity needs.
My Scripts/Indicators/Ideas/Algos/Systems are only for educational purposes!
RSI Trendlines with BreakoutsA pivot-based breakout indicator that attempts to provide traders with a visual aid for finding breakouts on the RSI. Similar to how we use trendlines on our charts, using them on the Relative Strength Index can also give us a sense of direction in the markets.
This script uses its own pivot-based system that checks for real-time swing levels and triggers a new pivot event after every dip and nth bars. The breakout alerts that are given were not designed to be taken as signals since their purpose is to provide an extra bit of confluence. Because of this, I added no other conditions that try to make the alerts "perfect", but instead, print every breakout that is detected. Despite stating this, I did happen to add a condition that checks the difference in RSI and the breakout value, but that's as far as it'll go.
There are alerts built-in to the script, along with adjustable repainting options.
🔳 Settings
Lookback Range: Lookback period to trigger a new pivot point when conditions are met.
RSI Difference: The difference between the current RSI value and the breakout value. How much higher in value should the current RSI be compared to the breakout value in order to detect a breakout?
RSI Settings
Styling Options
🔳 Repaint Options
On: Allows repainting
Off - Bar Confirmation: Prevents repainting and generates alerts when the bar closes. (1 candle later)
🔳 How it Works
Before a trendline is drawn, the script retrieves the slope between the previous pivot point and the current. Then it adds or subtracts the slope x amount of times (based on the lookback range) from the current pivot value until the current x-axis is reached. By doing this we can get a trendline that will detect a breakout accurately.
The result
When using the RSI Difference condition, the script will print breakouts whenever the condition is true, because of this dotted lines were added to track where the alert was triggered.
🔳 Alerts

Super 6x: RSI, MACD, Stoch, Loxxer, CCI, & Velocity [Loxx]Super 6x: RSI , MACD , Stoch , Loxxer, CCI , & Velocity is a combination of 6 indicators into one histogram. This includes the option to allow repainting.
What is MACD?
Moving average convergence divergence ( MACD ) is a trend-following momentum indicator that shows the relationship between two moving averages of a security’s price. The MACD is calculated by subtracting the 26-period exponential moving average ( EMA ) from the 12-period EMA .
What is CCI?
The Commodity Channel Index ( CCI ) measures the current price level relative to an average price level over a given period of time. CCI is relatively high when prices are far above their average. CCI is relatively low when prices are far below their average. Using this method, CCI can be used to identify overbought and oversold levels.
What is RSI?
The relative strength index is a technical indicator used in the analysis of financial markets. It is intended to chart the current and historical strength or weakness of a stock or market based on the closing prices of a recent trading period. The indicator should not be confused with relative strength .
What is Stochastic?
The stochastic oscillator, also known as stochastic indicator, is a popular trading indicator that is useful for predicting trend reversals. It also focuses on price momentum and can be used to identify overbought and oversold levels in shares, indices, currencies and many other investment assets.
What is Loxxer?
The Loxxer indicator is a technical analysis tool that compares the most recent maximum and minimum prices to the previous period's equivalent price to measure the demand of the underlying asset.
What is Velocity?
In simple words, velocity is the speed at which something moves in a particular direction. For example as the speed of a car travelling north on a highway, or the speed a rocket travels after launching.
How to use
Long signal: All 4 indicators turn green
Short signal: All 4 indicators turn red
Included
Bar coloring
Alerts

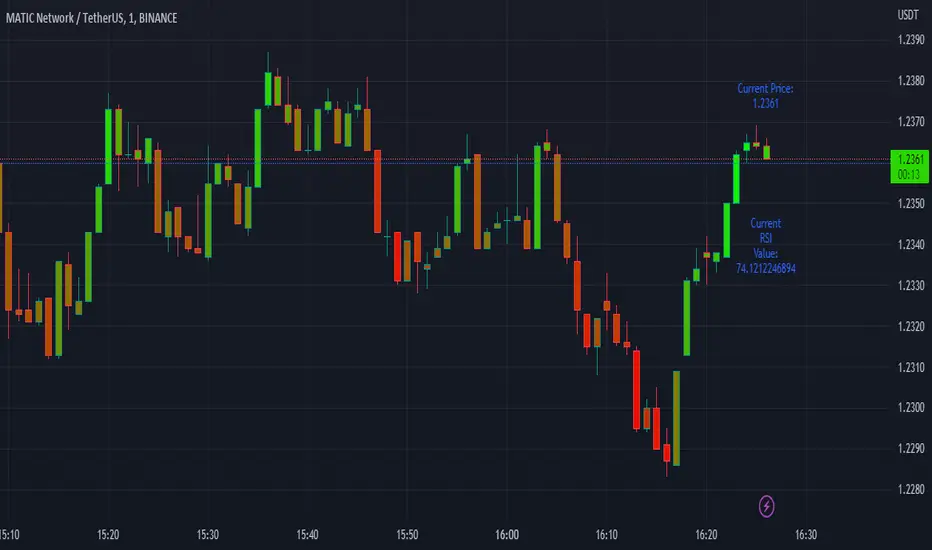
Easy RSI by nnamWhat Does this Indicator Do?
The Easy RSI Indicator color codes candles based on their RSI Value vs. Open / Close (Red / Green). It plots the current price and current RSI value on the chart in real-time. Additionally, when the RSI Value is in an oversold or overbought condition, it plots that signal on the chart in real-time.
The initial candle color is the standard Red / Green Tradingview color, but a Gradient is added to the color which either darkens or lightens the color based on the RSI Value.
As seen in the screenshot below, the higher the RSI Value, the brighter the Green Color is. The lower the RSI Value, the brighter the Red Color is.
The current Price and current RSI Value are both plotted on the chart by default, but can be optionally switched off by the trader.
As seen in the screenshot below, the prices and RSI Values are easily seen while visually tracking the price in real-time.
RSI Overbought Values are plotted when the Overbought condition is triggered. The Default is RED for Overbought and GREEN for Oversold.
As seen in the screenshot below, with all three labels turned on under the input settings (these are ON by default) you can see the overbought condition, the current RSI Value, and current price all in one centralized area. Oversold Values are also plotted when turned on under the input settings.
As shown in the screenshot below, the candle is GREEN (as evident by the green candle outline) but the RSI Value is low and shows lower than average relative strength. This turns the bar color ORANGE vs, GREEN showing that the relative strength of the move is subpar.
As shown on the screenshot below, if the trader has the standard Tradingview Price label switched on (in the Tradingview Chart Settings), the color of the bar is also translated to the price are for an easy to recognize RSI Value just by looking at the price. Even if the current candle is RED, when the RSI is higher than lower, the color will be green / greenish and even if the current candle is GREEN, when the RSI Value is lower than higher, the color will be red-ish / orange in color giving the user a quick view of RSI Value.
If you have any questions or feature requests for this Indicator please do not hesitate to reach out and ask.
GOOD LUCK trading!!
~nnamdert