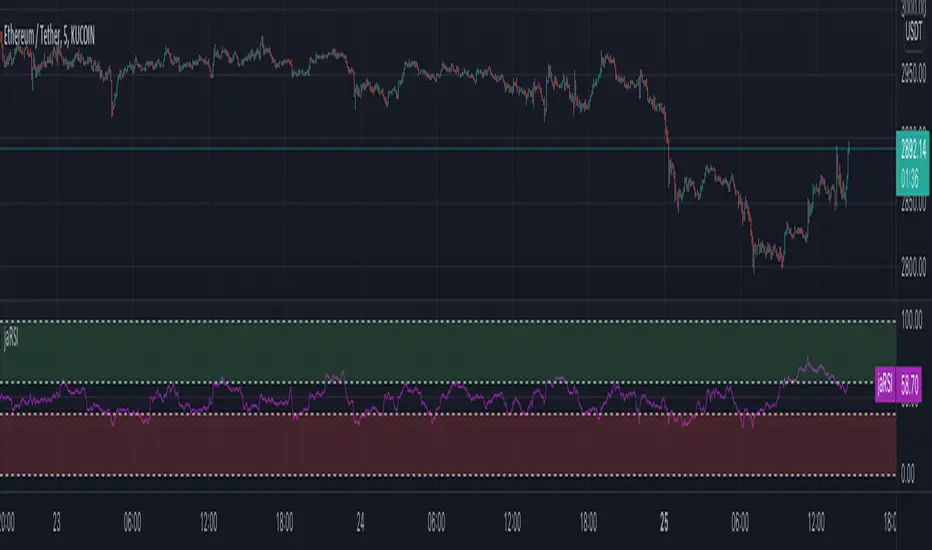
RSI BGCOLOR indicatorHi
This is a standard RSI indicator.
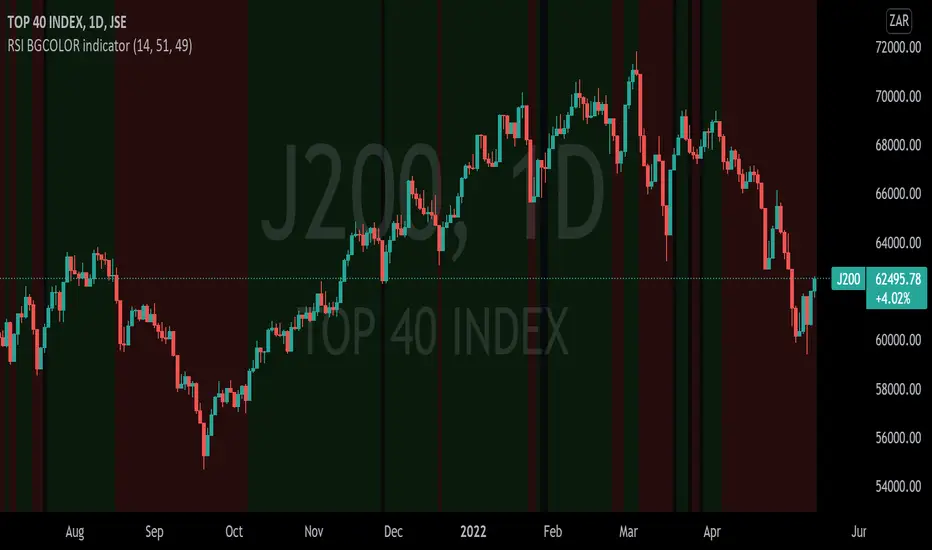
It changes the background color to green if the RSI reading is greater than the RSI bullish value and it changes to red if the RSI is below the RSI bearish value.
It will turn black for values between RSI bullish value and RSI bearish value.
You can tweak it to your liking, for example if you'd like to detect long only trades that are above 30 then you set RSI bearish value to 0 and RSI bullish value to 30 and it will only get long signals.
P.S More confirmation indicators will be necessary
Relative Strength Index (RSI)
RSI5+RSI9+RSI14 EMA [MTF - Multi Time Frame] Zero54This indicator has a fast RSI (RSI 5). Slower RSI (RSI 9) and a smoothened RSI14 EMA. When both RSI5 and RSI9 are above the RSI14 EMA, then the trend is bullish. When both RSI5 and RSI9 are below the RSI14 EMA, then the trend is bearish. This indicator also shows you the trend in upto 6 time frames! This MTF analysis gives you the conviction to take or skip the trade. Inspired by the concept taught by @AsitPati
The numbers you see in the MTF grid is the RS14 EMA for the respective time frame.
Hope you find this useful. Comments and feedback welcome. Like this if you find this useful.
NSE:HINDUNILVR

Vix FIX / Stochastic Weights StrategyThis script is based off of Chris Moody's Vix Fix Indicator modified by OskarGallard and BigBitsIO's Stochastic Weights.
This script is a compilation of several different stochastic indicators (and RSI ) where the K value of each indicator is equally weighted. The purpose of the indicator is to combine many indicators together in a fashion that weights them easier. By default, the Stochastic and Stochastic RSI are both enabled - the idea is to speed up the relatively slower Stochastic and to slow down the relatively fast Stochastic RSI . BigBitsIO's Stochastics are also available that can also be added to the weighted calculation. Only the K value is weighted, as the D value is just a moving average of the weighted K.
- Why is this modifed stochastic useful?
- To weight multiple indicators together so that you can attempt to find optimal values shared amongst the indicators. Ex: If Stochastic RSI is 100 and Stochastic is 50, K would be 75 and not particularly high. If you add in a 50 RSI , the K would be 67 in this example. If we weight indicators together that all have a high value they could potentially help find elements that align together to produce a stronger signal.
In this script we have the red "S" triangles which are Exits (overbought stochastic crosses).
Added alerts for stochastic exit signals. Alerts are Pre-Set to only Alert on Bar Close.
The "Williams Vix Fix" is one of the most reliable indicators in history for finding market bottoms. The Vix Fix is simply a code from Larry Williams creating almost identical results for creating the same ability the Vix has to all assets.
The VIX has always been much better at signaling bottoms than tops. Simple reason is when market falls retail traders panic and increase volatility , and professionals come in and capitalize on the situation. At market tops there is no one panicking... just liquidity drying up.
The FE green triangles are "Filtered Entries".
The AE green triangles are "Aggressive Filtered Entries".
Added Alerts to Williams Vix Fix (Aggressive Entry and Filtered Entry). Alerts are Pre-Set to only Alert on Bar Close.
Added "Ehlrers StochCCI" indicator of user @glaz
The Ehlrers StochCCI is a variation of Ehlers Stochastic RSI replaced with CCI.
The John Ehlers' article in August, 2006, "Modeling The Market = Building Trading Strategies," describes a process for extracting trend and cyclic elements from market data, then recombining them for trading purposes. He used the Stochastic RSI denoted the cyclic elements.
Added ability to show Dots when StochCCI Crosses.
Sell: fuchsia dots.
Buy: green dots.
Added alerts for (Buy / Sell) StochCCI. Alerts are Pre-Set to only Alert on Bar Close.
DISCLAIMER: For educational and entertainment purposes only. Nothing in this content should be interpreted as financial advice or a recommendation to buy or sell any sort of security or investment including all types of crypto. DYOR, TYOB.

Z-Score DeltaHeavily modified from Z Score by jwammo12
Compares the z-score of two assets, the onscreen one and the reference one configured. If you're familiar, you can think of it as Bollinger Band Percent of Onscreen Asset minus the Bollinger Band Percent of Reference Asset.
It's compared off a simple moving average, due to how standard deviation is calculated.
I view this a more literal meaning of relative strength.
Has the ability to offset or delay in time one to another.
TODO: add MAD and MAD/STD.DEV views
Not my greatest work, but it's functional.

RSI Cor Bias [Moto]Hello traders,
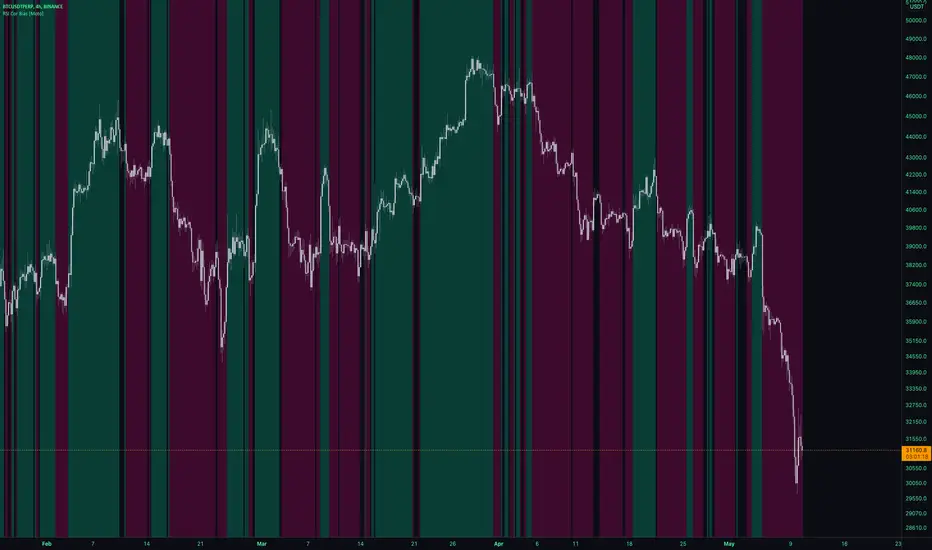
This is a pretty simple script. It gives a background directional bias color respective to RSI levels from input thresholds in the settings. Users can choose the upper and lower thresholds and the symbol that the RSI is from.
For example, by default, the upper threshold is 52 and the lower 48. If Bitcoins RSi is above 52, the background color will be green, below 48 it's pink, between and no color will be applied.
Generally, buying should be occurring in pink to green transition or in green, and conversely selling should be occurring in green to pink transition or in pink.
Thanks,
Moto
BB-RSI-ADX Entry PointsThis is a combination of indicators used to find oversold and overbought entry points for possible reversion.
A Green arrow will appear when all condition are met for an ENTER LONG position.
A Red arow will appear when all condition are met for an ENTER SHORT position.
You can modify all of these condition parameters from the indicator's settings.
How does the indicator work
The signals are using Bollinger Bands , BB %B , RSI and ADX indicators to try and find points of reversal
Enter LONG Conditions
Current candle low is below BB lower band.
The BB %B is more than 0.
RSI > 30
ADX > 25
Enter SHORT Conditions
Current candle high is above BB upper band.
The BB %B is less than 1.
RSI < 70
ADX > 25
Those are the default settings that seem to work for me but you can customize all of these from the indicator settings.
I find this strategy to best work on a 3 minute timeframe
Note: The bb %B is calculated for stDev - 1. This will help you see a change happening faster.

LOKEN (v4) BULLISH SMART MONEYThis indicator is based on Smart Money MCDX
(Pine editor @v4)
Indicator built for cryptocurrencies.
Best for day trading.
The coin seems overbought but still pump? Check this indicator
This indicator help you see when institutional buyer enter/exit trade and is a good combination with RSI + Stochastic RSI .
This indicator focus on buying activity by big players and is built for LONG or SPOT, shorter can still use it to determine when to exit short (if smart money appear on a significant TF you may not enter/stay in a short).
Banker plot show strong buyer activities (appear generally when RSI already overbought but still increasing).
It appear as a Histogram with a color code to better see the fading strength of the institutional activity :
Light Blue Bar = Institutional presence ( bullish )
Green Bar = Pump candle (very bullish ), (Banker > Banker MA)
Orange Bar = Retest candle = natural decline after a growth (Banker < Banker MA)
Black Bar = Down candle = progressive exit of institutional leads to this candle, you must have TP before.
Red Bar = Dump candle = steep decline, the institutional take profit hard. You better be out before that one.
Hot-Money plot show momentum and react fast to price action.
It appear as a filled zone (red or green) depending on the plot position compared to its average.
In a downtrend you may only see this one.
Key-Signals:
"Bullish signal 𓃓" = open a long
"Sell signal 💲" = close the long
I recommend you don't keep all the signals enabled at first.
(feel free to ask me the use of the other signals)
It seemed to me that SMART MONEY MCDX was counter-intuitive and archaic,
So i made this one for personal use,
I'm happy if this indicator helps you,
Have a good trade

Sharktank - RSI ExtendedA fully fledged RSI indicator.
Features:
- An EMA on the RSI
- 2 Different range settings for the background
- 2 Different color schemes
- Markers for hidden and normal divergence
- Lines for hidden and normal divergence
Enjoy!

ENVELOPE RSI - Buy Sell SignalsThis indicator is mainly based on Overbought and Oversold . Indicator for short-term trading. This way you can get small but acceptable signals.
The main basis of the indicator is as follows:
To buy, the indicator is waiting for the instrument to be oversold from the RSI point of view. Then, if the chart crosses the bottom line of the Envelope indicator from the bottom to the top, a buy signal is issued.
For sell, the indicator waits for the instrument to be overbought from the RSI perspective. Then, if the chart crosses the top line of the Envelope indicator from top to bottom, a sell signal is issued.
The general basis is the consonance of the price and the RSI indicator .
The best settings I came up with myself:
Time frame: 15 minutes
Overbought: 80
Oversell: 25
RSI Length: 8
It can be done on different instruments. But always set your profit and loss limits.
(Profit to loss ratio in this indicator can be 1: 1.)
Disclaimer : This information and trading indicators and tools provided neither is, nor should be construed, as an offer, or a solicitation of an offer, to buy or sell securities. You shall be fully responsible for any investment decision you make, and such decisions will be based solely on your evaluation of your financial circumstances, investment objectives, risk tolerance, and liquidity needs.
I am not liable for any profit, financial improvement, losses or damages, monetary or other that may result from the application of information contained within this indicator. Individual traders must use their own due diligence in analyzing featured trading indicators, other trading tools, webinars and other educational materials to determine if they represent suitable and useable features and capabilities for the individual trader.

Options Volume Indicator
Volume Indicator for Option Trading, it is a simple indicator based on Relative Strength Index. There are two horizontal lines are mention 10 and -10, if bar crossed above the (Line 10) then go for buy and when Bar cross under (Line -10) go for sell side.
If Bar Color changed to Respective color of the previous bar i.e. color gets darker then you can exit/ trail SL there because it overbought / Oversold position and vice versa for Sell Side.
this volume indicator works on any Script.
The Black Floating Line indicates the Average volume

RSI Divergence Fast by RSUAdvantages:
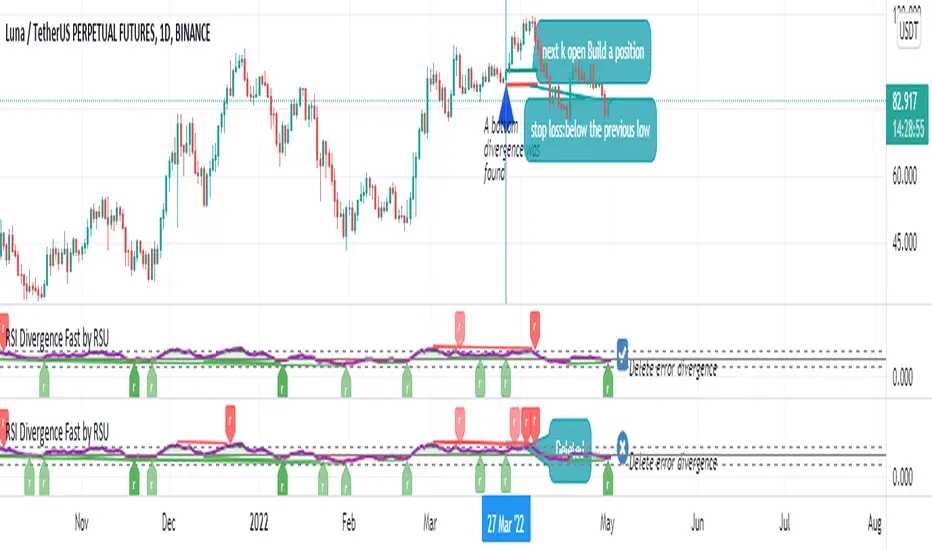
1. When rsi is at a high point, once it falls by 1 k line, it will detect the divergence from the previous high point. This can quickly find the divergence that has taken effect and help you quickly capture the trend before a sharp decline or rise.
The difference between other RSI divergence indicators: the official divergence indicator is to detect the 5 and the k line, which may lead to a large amount of decline.
2. This indicator detects the previous high and the previous low of 5, 10, 20 lengths at the same time, instead of only detecting a fixed length, so that more deviations can be found.
Notice:
Because it is a quick divergence detection, it is recommended to confirm that the divergence takes effect after the current k is completely closed first. I have identified this state in the indicator as "k not end"
Disadvantages and Risks
Since it is a quick discovery, there will be error identification. I listed the difference between the two indicators when deleting errors. The indicator turns off the "delete error" option by default.
Please do not:
Don't go short in the uptrend, don't go long in the downtrend.
Top divergences that occur because of a strong uptrend are usually only temporary pullbacks. Bottom divergences in persistent declines are also temporary rallies. Do not attempt to trade such low-return trades.
It is recommended to use the divergence indicator when the stock price has made a new high and retraced, and once again made a new high, because this often leads to the end of the trend.
Divergence how to use:
1. After the previous K line was completely closed, a bottom divergence was found.
2. Open an long order at the beginning of the second bar, or as close to the bottom as possible (because the stop loss will be smaller).
3. Break the stop loss price below the previous low where the divergence occurred, which already means that the divergence is wrong.
RSI usage:
1. RSI is above the 50 line, in an uptrend, below 50 in a downtrend.
2. Above 70 is overbought, falling below the oversold zone may mean the end of the uptrend.
Below 30 is oversold, above the oversold zone may mean the end of the downtrend.
JaeRSI+What is JaeRSI++
🥇 It is an indicator that detects and displays the RSI of the upper frame one step at a time
- It is no different from normal RSI but, u can see the RSI of the upper frame together
- Works based on 5m 15m 1h 4h 1d 1w
🥇Also, if the RSI is (over 70↗️) or (less than 30↘️), changes the background color
- If the background color is continuous, it is recommended to check the frame one step higher
🥇 Meaning of table (table)
- "🌈", RSI, Main, Danger in order
- RSI: It is divided into 5, 15, 60, 240 and indicates the current RSI of each frame (the background color is different from RSI : 33.0 below / 67.0 above)
- Main: Estimate the mainframe
If the previous 14 candles have entered the Danger zone (RSI : below 33.0 / above 67.0) or oversold/number, the corresponding frame is marked as the main frame.
- Danger: If abnormal RSI motion is detected (beam shape) due to sudden surge/fall in a frame, it warns that the frame may be the main frame.
==================================================================================
JaeRSI++란?
🥇 상위 프레임의 RSI를 추가로 표시해 주는 RSI 지표입니다
- 일반 RSI와 알고리즘의 차이가 없으나 상위 프레임의 RSI를 함께 볼 수 있습니다 (빨간 선으로 표시)
- 5m 15m 1h 4h 1d 1w 기준으로 작동합니다
🥇또한 RSI가 (70 이상↗️) 또는 (30↘️)인 경우 배경색을 변경합니다
- 배경색이 연속적인 경우 프레임을 한 단계 높게 확인하는 것이 좋습니다
🥇표(테이블)의 의미
- 순서대로 시간프레임 , RSI , 메인 , 위험
- RSI : 5, 15, 60, 240으로 나뉘어져 각각 프레임의 현재 RSI를 나타낸다 (33.0 아래 / 67.0 위 부터 배경색이 달라짐)
- 메인 : 메인프레임을 추정한다
이전 14개 캔들안에 꺵판존(33.0 아래 / 67.0 위) or 과매도/수에 들어간 적이 있다면 해당 프레임을 메인프레임으로 표시한다
- 위험 : 어떤 프레임에서 급등/급락하여 비 정상적인 RSI의 움직임이 감지된다면(빔 형태) 해당 프레임이 메인 프레임일 수 있다고 경고한다

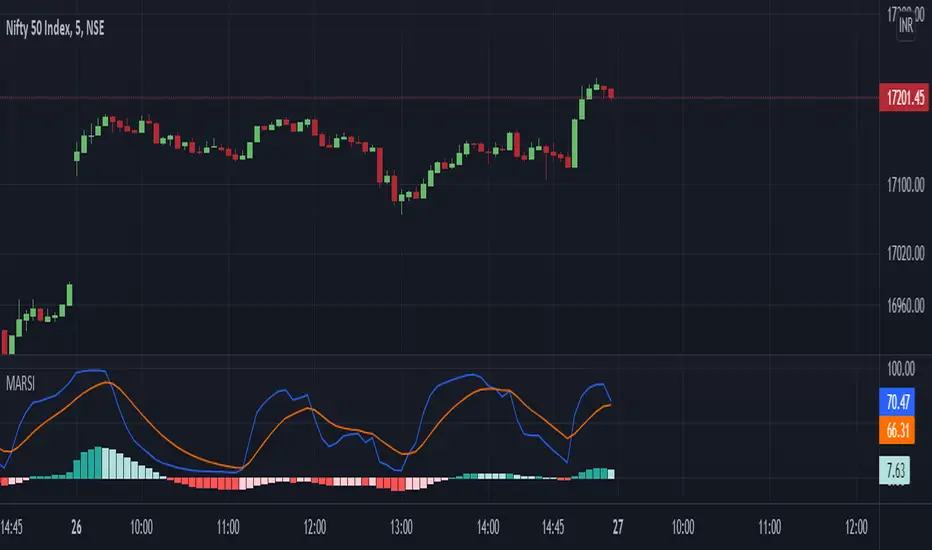
MARSIAn advanced version of MACD and RSI combined, where moving averages gives quality early signals along with the strength of Histogram. This Version of MACD helps traders to understand strength in the Histogram and possibilities of a reversal. Indicator also gives Early Indications of trend shift.
MACD input options Given to User
The Indicator draws MACD and MACD Histogram
Based on histogram Value RSI is Plotted and RSI Based EMA is Plotted as MARSI line and Signal Line
Calculations :
MACD Line: (12-day EMA - 26-day EMA)
Signal Line: 9-day EMA of MACD Line
MACD Histogram: MACD Line - Signal Line
MARSI Line : RSI Value of MACD Histogram
Signal Line : 9-day EMA of Marsi Line
Just Another RSIThis is slightly different implementation of RSI using arrays. But, it also comes with a twist.
Formula for standard RSI can be found here: www.investopedia.com
If there is green candle, gain for the candle is equal to price movement from previous bar and loss for that candle is 0. Similarly in case of red candle, loss is considered to be movement from previous candle whereas gain is 0. Also, as mentioned in step2, on each bar, average of previous bar gains/losses are merged with present candle gain/loss.
New Process
Gain is considered only on green candles. Hence, there is no zero gain candles
Loss is considered only on red candles. Hence, there is no zero loss candles
Average or median of last N gains and losses are considered. Hence, the movement mainly tell us the strength between bullish and bearish candles.
Let us forget about seeing it as overbought and oversold area and look at it as bullish and bearish region.
How it is different
Since, gain and loss are only considered if there are gain and loss, this index represents the strength between bullish and bearish candles without looking at price movement. Hence, the index has capability to go in opposite direction of the price representing price movement is not supported by strength.
Another advantage of this implementation is it allows using variable length for the method. In case of RSI, length has to be constant. It cannot be variable which can change every bar. But, we do not have that constraint in this implementation due to use of arrays.
At present, this is purely experimental. I will look forward to study this more with respect to divergence and for use in trend following methods.
RSI MTF Ob+OsHello Traders,
This indicator use the same concept as my previous indicator "CCI MTF Ob+Os".
It is a simple "Relative Strength Index" ( RSI ) indicator with multi-timeframe (MTF) overbought and oversold level.
It can detect overbought and oversold level up to 5 timeframes, which help traders spot potential reversal point more easily.
There are options to select 1-5 timeframes to detect overbought and oversold.
Aqua Background is "Oversold" , looking for "Long".
Orange Background is "Overbought" , looking for "Short".
Have fun :)

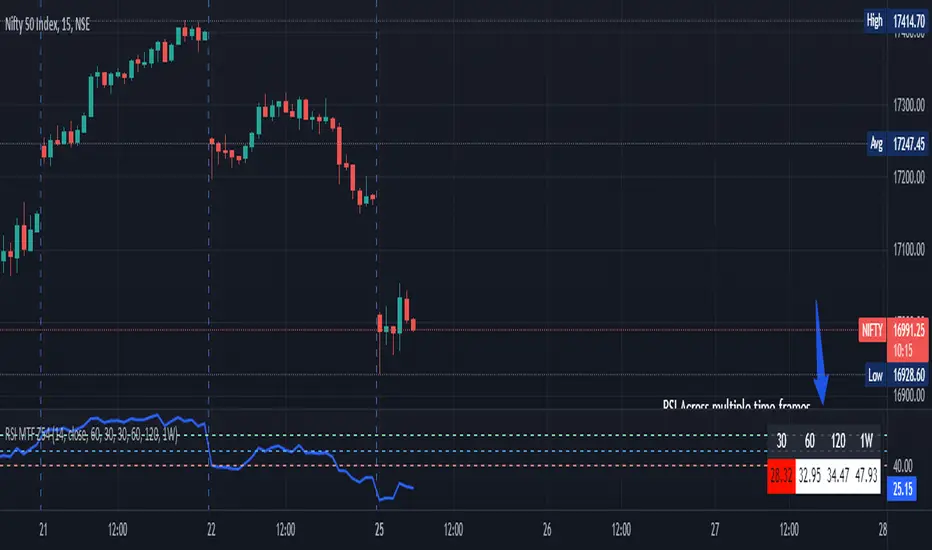
RSI Multi Time Frame (MTF). Fully customizable. [Zero54]NSE:NIFTY
An easy to read Multi Time Frame RSI that does not take too much space. All parameters and colors are customizable. Please feel free to give your suggestions. Feel free to modify the code as per your liking. Like this if you find this useful.
TMA-LegacyThis is a script based on the original TMA- RSI Divergence indicator by PhoenixBinary.
The Phoenix Binary community and the TMA community built this version to be public code for the community for further use and revision after the reported passing of Phoenix Binary (The community extends our condolences to Phoenix's family.
The intended uses are the same as the original but some calculations are different and may not act or signal the same as the original.
Description of the indicator from original posting.
This indicator was inspired by Arty and Christy .
█ COMPONENTS
Here is a brief overview of the indicator from the original posting:
1 — RSI Divergence
Arty uses the RSI divergence as a tool to find entry points and possible reversals. He doesn't use the traditional overbought/oversold. He uses a 50 line. This indicator includes a 50 line and a floating 50 line.
The floating 50 line is a multi-timeframe smoothed moving average . Price is not linear, therefore, your 50 line shouldn't be either.
The RSI line is using a dynamic color algo that shows current control of the market as well as possible turning points in the market.
2 — Smoothed RSI Divergence
The Smoothed RSI Divergence is a slower RSI with different calculations to smooth out the RSI line. This gives a different perspective of price action and more of a long term perspective of the trend. When crosses of the floating 50 line up with the traditional RSI crossing floating 50.
3 — Momentum Divergence
This one will take a little bit of time to master. But, once you master this, and combined with the other two, damn these entries get downright lethal!

Stochastic RSI HeatmapStochastic RSI presented as a heatmap starting from the oversold (20) / overbought (80) levels respectively. The more oversold / overbought the price, the more intense the color (blue / fuchsia).

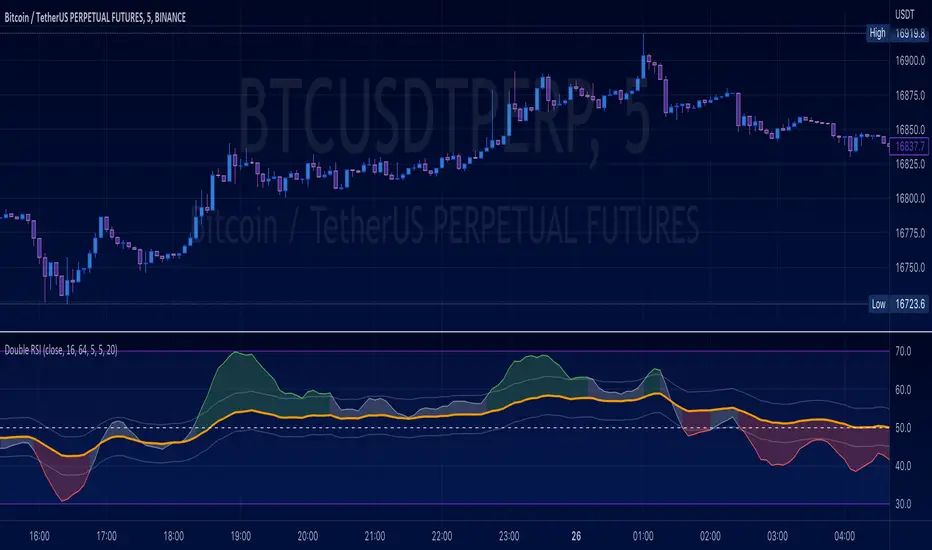
Double RSI Fast & Slow
Double RSI, fast & Slow.
This indicator is intended to track trends based on RSI with a threshold for proximity.
Oversold, overbought channel.
Threshold for proximity.
Color coded line values.
RSI Local TrendA simple indicator using two RSIs.
Conditions for buy:
RSI(slow) < RSI(fast) and RSI(slow) < long_trigger
Conditions for sell:
RSI(slow) > RSI(fast) and RSI(slow) > short_trigger
It is recommended to use in small timeframes for scalping.
Recommended settings:
slow = 3
fast = 14
long_trigger = 30
short_trigger = 70
In markets where there is very high volatility, it is recommended to change the trigger parameters:
long_trigger = 20
short_trigger = 80

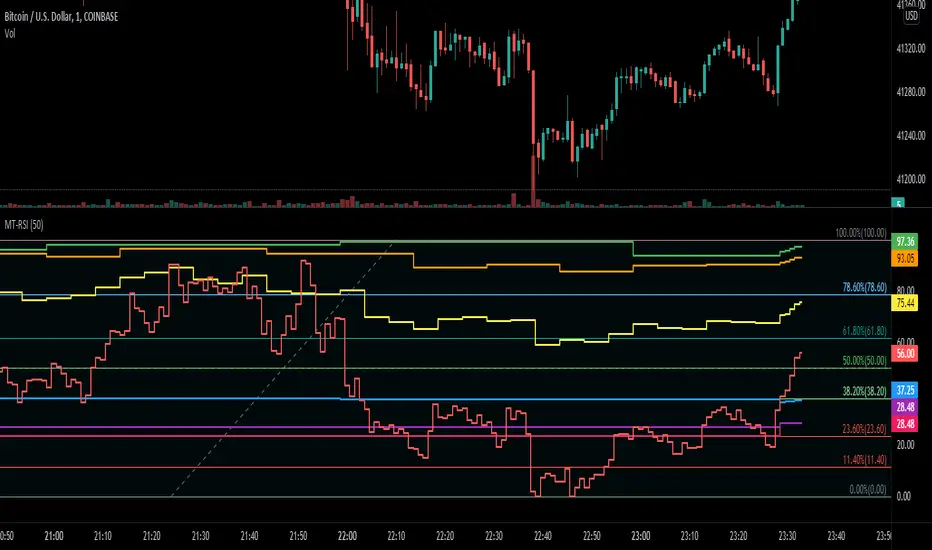
MT-RSIThis script shows a "Multi Timeframe RSI" for a range. You could use this script to quickly detect if the RSI of the higher and lower timeframes are overbought or oversold.
RSI is relative to a lower timeframe. So 1H is relative to the 4H and the 4H relative to the 1D chart etc...
In this example you can see that the 1H timeframe (green line) is performing well but is in overbought territory, but the 4H timeframe (blue line) dit not perform that great relative to the 1H timeframe.
TotalCap RSI and Pressure CandleCandles and areas where force is applied.
Special to see divergences and possible Order Blocks
The RSI is applied on the TOTALCAP to be able to visualize when the entire market is in turning conditions

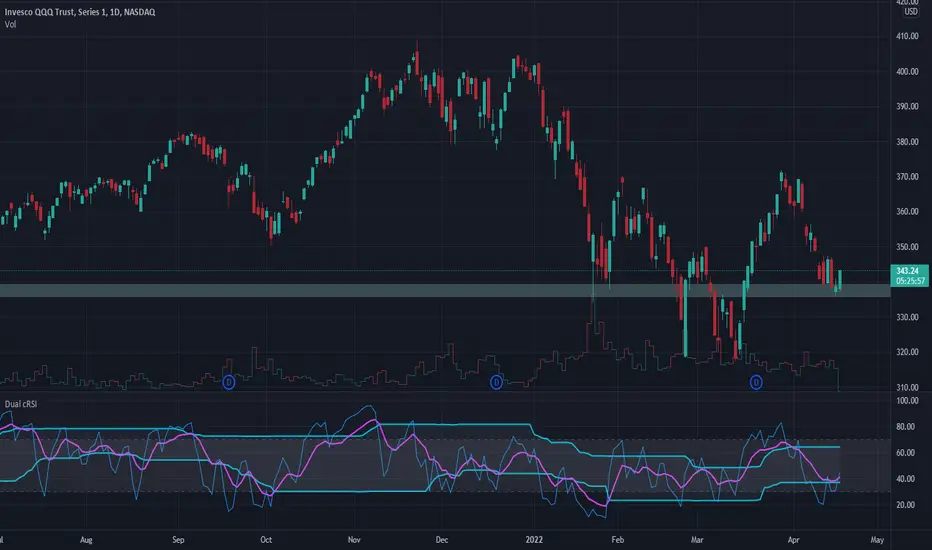
Dual RSI cyclic smoothedThis script is an updated version of the cRSI.
It add a short cycle (5 period) RSI to the mix, so see the violent move.