Relative Strength Index_ShRelative Strength Index updated to keep upper level at 60 while lower at 40
Relative Strength Index (RSI)

Momentum Volume Analyzer [CHE] Momentum Volume Analyzer — Adaptive momentum with volume-gated signals and expressive visual cues
Summary
This indicator combines a normalized momentum oscillator with a volume Z-score gate and adaptive gradient visuals. The oscillator centers around a midline and scales between a lower and an upper bound. Intensity is derived from the distance to the midline and is normalized inside a rolling window, which helps keep contrast consistent across regimes. Volume pressure is compressed to a discrete level between one and ten and is used to qualify momentum flips and extremes. Layered “burst” markers and optional background gradients provide immediate visual emphasis without adding new data sources. Pine version is v6. The script runs in a separate pane.
Motivation: Why this design?
Common oscillators flip rapidly during noisy conditions or flatten during calm periods, which obscures actionable shifts. A rolling normalization keeps the visual intensity stable across different regimes, and a volume gate reduces reactions when participation is weak. The goal is clearer momentum shifts that are supported by measurable activity rather than cosmetic smoothing alone.
What’s different vs. standard approaches?
Baseline reference: Classical RSI-style oscillators or simple filtered momentum without volume gating.
Architecture differences:
Local window normalization with gamma control for contrast.
Volume converted to a Z-score and compressed into a discrete level between one and ten with a configurable cap.
Directional color gradients that intensify with distance from the midline.
Layered glow markers with optional trail and an internal label budget to avoid UI overload.
Practical effect: Signals are visually stronger only when both momentum and volume align; background and line colors convey regime strength at a glance.
How it works (technical)
Momentum core: A high-pass path with automatic gain control produces a bounded oscillator centered around a midline. A simple moving average smooths the result over a short window.
Normalization and contrast: The absolute distance from the midline is scaled inside a rolling window and limited between zero and one. Two gamma parameters separately shape contrast for the line and for labels.
Coloring: When the oscillator is above the midline, a green gradient is used; below the midline, a red gradient is used. Intensity increases with normalized distance. Optional area fill to the midline and a background gradient reinforce strength.
Volume levels: Volume is standardized over a lookback window, clipped by a user cap, and mapped to a level between one and ten. Only positive excursions are considered; non-positive values map to zero.
Event markers: When the oscillator reaches extreme zones and the volume level is positive, the script spawns layered circular labels at fixed y-positions. A small trail can extend behind the event. An internal queue discards the oldest labels when a user-defined maximum is exceeded.
Alerts: Alerts fire on overbought and oversold spikes, midline shifts with minimum intensity and volume, and continuation patterns inside strong zones.
Parameter Guide
TFRSI length (default six): Core momentum lookback. Shorter values react faster but are less stable.
Signal SMA (default two): Light smoothing of the oscillator. Larger values reduce jitter.
Gradient window (default one hundred): Normalization window for intensity. Longer values produce steadier contrast but slower adaptation.
Line/marker transparency (default zero): Visual prominence of drawings. Higher values reduce dominance.
Background on and BG transparency (defaults true and eighty-five): Enables and tunes the pane background gradient.
Area fill to fifty and Fill transparency (defaults true and eighty): Fills between the oscillator and the midline.
Gamma bars/labels and Gamma plot (defaults zero point seven and zero point eight): Contrast shapers for markers and line. Higher values compress low intensities.
Bottom marker and Show last N (defaults true and three hundred thirty-three): Optional compact heat markers with a display cap.
Up/Down colors: Dark and neon pairs for positive and negative regimes.
Lookback (default two hundred) and Z cap (default five): Volume standardization window and clipping level before scaling to one through ten.
Enable bursts, Layers, Trail, Trail transparency, Max live labels, Size scale: Control the layered glow effect, trail length, opacity, label budget, and size multiplier. Reducing the size scale lowers visual dominance.
Spike min level, Shift min level, Min intensity, Rise/Fall length: Gates for alerts; adjust to balance sensitivity and false positives.
Reading & Interpretation
Line color and intensity: Green shades above the midline indicate bullish pressure; red shades below indicate bearish pressure. Stronger color corresponds to stronger normalized distance.
Background and fill: Reinforce regime strength; consider reducing transparency when the pane feels too busy.
Bursts and trails: Emphasize volume-backed extremes. Larger bursts reflect stronger volume levels or scaling choices.
Volume level: Internal level between one and ten. Levels near the upper bound signal exceptional activity.
Practical Workflows & Combinations
Trend following: Use midline cross upward with minimum shift level and intensity as a trigger. Confirm with structure such as higher highs and higher lows. For shorts, reverse the conditions.
Exits and risk: Fade exposure when intensity weakens toward the midline or when volume level drops below the shift threshold. Consider disabling bursts when monitoring many symbols.
Multi-asset and multi-timeframe: Defaults are designed to travel across liquid futures, large-cap equities, and major crypto pairs. For higher timeframes, increase the lookback window and consider reducing the Z cap.
Behavior, Constraints & Performance
Repaint and confirmation: Signals are evaluated on the live bar. They can appear and withdraw before bar close. For confirmed signals, require closed-bar alerts or manual confirmation.
Higher-timeframe sources: Not used. No `security` calls.
Resources: `max_bars_back` is two thousand. The script uses arrays and label objects, including loops for trails. The label budget mitigates clutter.
Known limits: Very illiquid symbols with unstable volume can reduce the usefulness of the Z-score. Sharp regime changes can still produce brief flips.
Sensible Defaults & Quick Tuning
Starting point: TFRSI length six, Signal two, Gradient window one hundred, Z cap five, Spike level six, Shift level four, Min intensity zero point four, Rise length three, Size scale zero point five.
Too many flips: Increase Signal, increase Gradient window, or raise Shift level.
Too sluggish: Decrease TFRSI length or reduce Gradient window.
Bursts too dominant: Lower Size scale or reduce Layers; increase Trail transparency or set Trail length to zero.
What this indicator is—and isn’t
This is a visualization and signal layer that couples momentum with a volume gate and adaptive visuals. It is not a complete trading system, optimizer, or predictor. Use it together with market structure, risk controls, and position management.
Disclaimer
The content provided, including all code and materials, is strictly for educational and informational purposes only. It is not intended as, and should not be interpreted as, financial advice, a recommendation to buy or sell any financial instrument, or an offer of any financial product or service. All strategies, tools, and examples discussed are provided for illustrative purposes to demonstrate coding techniques and the functionality of Pine Script within a trading context.
Any results from strategies or tools provided are hypothetical, and past performance is not indicative of future results. Trading and investing involve high risk, including the potential loss of principal, and may not be suitable for all individuals. Before making any trading decisions, please consult with a qualified financial professional to understand the risks involved.
By using this script, you acknowledge and agree that any trading decisions are made solely at your discretion and risk.
Best regards and happy trading
Chervolino

Oversold & Overbought Signal with RSISimple RSI overbought/oversold signals. Signals overbought when RSI > 80 and oversold when RSI < 30.

RSI: alternative derivationMost traders accept the Relative Strength Index (RSI) as a standard tool for measuring momentum. But what if RSI is actually a position indicator?
This script introduces an alternative derivation of RSI, offering a fresh perspective on its true nature. Instead of relying on the traditional calculation of average gains and losses, this approach directly considers the price's position relative to its equilibrium (moving average), adjusted for volatility.
While the final value remains identical to the standard RSI, this alternative derivation offers a completely new understanding of the indicator.
Key components:
Price (Close)
Utilizes the closing price, consistent with the original RSI formula.
normalization factor
Transforms raw calculations into a fixed range between -1 and +1.
normalization_factor = 1 / (Length - 1)
EMA of Price
Applies Wilder’s Exponential Moving Average (EMA) to the price, serving as the anchor point for measuring price position, similar to the traditional RSI formula.
myEMA = ta.rma(close,Length)
EMA of close-to-close absolute changes (unit of volatility)
Adjusts for market differences by applying a Wilder’s EMA to absolute price changes (volatility), ensuring consistency across various assets.
CC_vol = ta.rma(math.abs(close - close ),Length)
Calculation Breakdown
DISTANCE:
Calculate the difference between the closing price and its Wilder's EMA. A positive value indicates the price is above the EMA; a negative value indicates it is below.
distance = close - myEMA
STANDARDIZED DISTANCE
Divide the distance by the unit of volatility to standardize the measurement across different markets.
S_distance = distance / CC_vol
NORMALIZED DISTANCE
Normalize the standardized distance using the normalization factor (n-1) to adjust for the lookback period.
N_distance = S_distance * normalization_factor
RSI
Finally, scale the normalized distance to fit within the standard RSI range of 0 to 100.
myRSI = 50 * (1 + N_distance)
The final equation:
RSI = 50 ×
What This Means for RSI
Same RSI Values, Different Interpretation
The standard RSI formula may obscure its true measurement, whereas this approach offers clarity.
RSI primarily indicates the price's position relative to its equilibrium, rather than directly measuring momentum.
RSI can still be used to analyze momentum, but in a more intuitive and well-informed way.

AI Trading Alerts v6 — SL/TP + Confidence + Panel (Fixed)Overview
This Pine Script is designed to identify high-probability trading opportunities in Forex, commodities, and crypto markets. It combines EMA trend filters, RSI, and Stochastic RSI, with automatic stop-loss (SL) & take-profit (TP) suggestions, and provides a confidence panel to quickly assess the trade setup strength.
It also includes TradingView alert conditions so you can set up notifications for Long/Short setups and EMA crosses.
⚙️ Features
EMA Trend Filter
Uses EMA 50, 100, 200 for trend confirmation.
Bull trend = EMA50 > EMA100 > EMA200
Bear trend = EMA50 < EMA100 < EMA200
RSI Filter
Bullish trades require RSI > 50
Bearish trades require RSI < 50
Stochastic RSI Filter
Prevents entries during overbought/oversold extremes.
Bullish entry only if %K and %D < 80
Bearish entry only if %K and %D > 20
EMA Proximity Check
Price must be near EMA50 (within ATR × adjustable multiplier).
Signals
Continuation Signals:
Long if all bullish conditions align.
Short if all bearish conditions align.
Cross Events:
Long Cross when price crosses above EMA50 in bull trend.
Short Cross when price crosses below EMA50 in bear trend.
Automatic SL/TP Suggestions
SL size adjusts depending on asset:
Gold/Silver (XAU/XAG): 5 pts
Bitcoin/Ethereum: 100 pts
FX pairs (default): 20 pts
TP = SL × Risk:Reward ratio (default 1:2).
Confidence Score (0–4)
Based on conditions met (trend, RSI, Stoch, EMA proximity).
Labels:
Strongest (4/4)
Strong (3/4)
Medium (2/4)
Low (1/4)
Visual Panel on Chart
Shows ✅/❌ for each condition (trend, RSI, Stoch, EMA proximity, signal now).
Confidence row with color-coded strength.
Alerts
Long Setup
Short Setup
Long Cross
Short Cross
🖥️ How to Use
1. Add the Script
Open TradingView → Pine Editor.
Paste the full script.
Click Add to chart.
Save as "AI Trading Alerts v6 — SL/TP + Confidence + Panel".
2. Configure Inputs
EMA Lengths: Default 50/100/200 (works well for swing trading).
RSI Length: 14 (standard).
Stochastic Length/K/D: Default 14/3/3.
Risk:Reward Ratio: Default 2.0 (can change to 1.5, 3.0, etc.).
EMA Proximity Threshold: Default 0.20 × ATR (adjust to be stricter/looser).
3. Read the Panel
Top-right of chart, you’ll see ✅ or ❌ for:
Trend → Are EMAs aligned?
RSI → Above 50 (bull) or below 50 (bear)?
Stoch OK → Not extreme?
Near EMA50 → Close enough to EMA50?
Above/Below OK → Price position vs. EMA50 matches trend?
Signal Now → Entry triggered?
Confidence row:
🟢 Green = Strongest
🟩 Light green = Strong
🟧 Orange = Medium
🟨 Yellow = Low
⬜ Gray = None
4. Alerts Setup
Go to TradingView Alerts (⏰ icon).
Choose the script under “Condition”.
Select alert type:
Long Setup
Short Setup
Long Cross
Short Cross
Set notification method (popup, sound, email, mobile).
Click Create.
Now TradingView will notify you automatically when signals appear.
5. Example Workflow
Wait for Confidence = Strong/Strongest.
Check if market session supports volatility (e.g., XAU in London/NY).
Review SL/TP suggestions:
Long → Entry: current price, SL: close - risk_pts, TP: close + risk_pts × RR.
Short → Entry: current price, SL: close + risk_pts, TP: close - risk_pts × RR.
Adjust based on your own price action analysis.
📊 Best Practices
Use on H1 + D1 combo → align higher timeframe bias with intraday entries.
Risk only 1–2% of account per trade (position sizing required).
Filter with market sessions (Asia, Europe, US).
Strongest signals work best with trending pairs (e.g., XAUUSD, USDJPY, BTCUSD).

Sols Day Trading Signals (5m / 10m)This indicator is designed for day trading on the 5-minute and 10-minute charts.
Includes:
EMA 9 & EMA 21 crossover signals
MACD momentum confirmation
RSI trend filter (50+)
Buy/Sell labels directly on the chart
💡 How to Use:
Go long when EMA 9 crosses above EMA 21, MACD is positive, and RSI is above 50
Go short when EMA 9 crosses below EMA 21, MACD is negative, and RSI is below 50
Best used with proper risk management (1-2% per trade)
⚠️ Disclaimer: This is for educational purposes only — always backtest and trade responsibly.

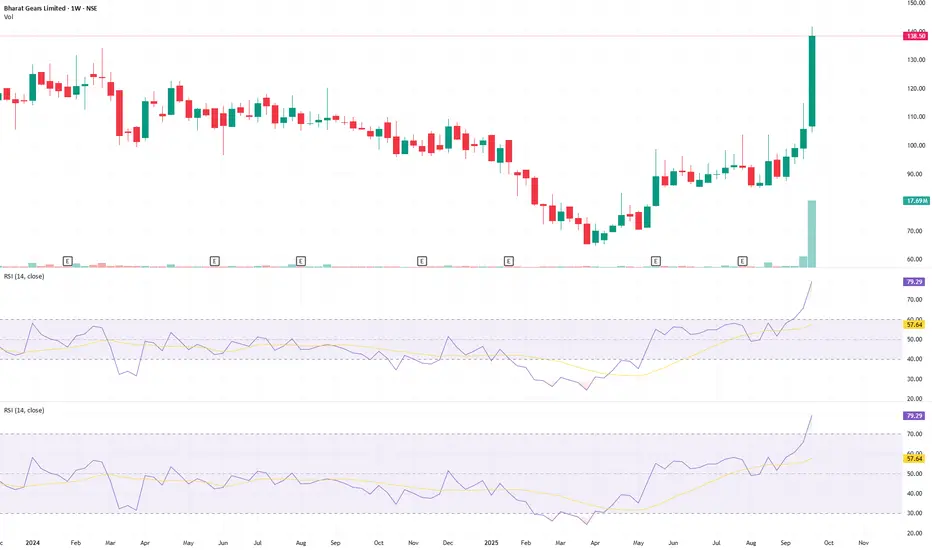
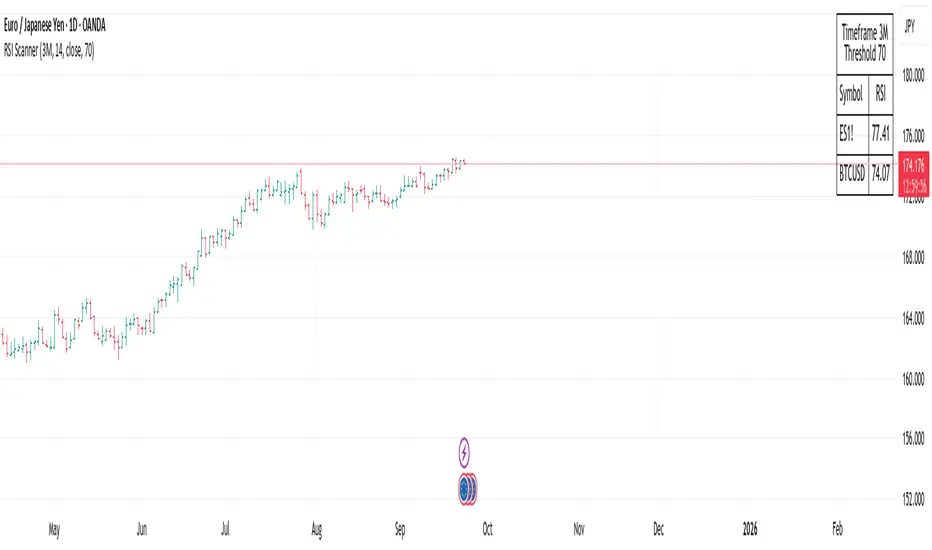
RSI ScannerRSI Scanner
This script scans a custom list of symbols and displays their RSI values for a selected higher timeframe (default: 3M). It provides a quick way to monitor multiple markets in one place without switching charts.
Features:
Customizable timeframe for RSI calculation (default: 3M).
Adjustable RSI length and source input.
Flexible filter: display all symbols or only those with RSI above a chosen threshold.
Input your own list of symbols (stocks, forex, futures, crypto) via a text field.
Results displayed in a clean, table directly on the chart.
Automatic column split when the symbol list is long.
Table header shows selected timeframe and filter settings for clarity.
How to use:
Add the script to your chart.
Open the Inputs panel.
In Symbols List, enter the tickers you want to track, separated by commas (e.g. AAPL, TSLA, EURUSD, BTCUSD).
Set the desired Timeframe (e.g. 3M, 1M, W).
Adjust RSI Length and Source if needed.
Enable or disable filtering:
If filtering is enabled, only symbols with RSI ≥ the threshold will be shown.
If disabled, all entered symbols will be displayed.
The table in the top-right corner will update automatically on the last bar.
Use cases:
Monitor RSI across different asset classes on higher timeframes.
Quickly spot overbought symbols (e.g. RSI > 70) without switching charts.
Create a custom multi-market watchlist tailored to your strategy.
Momentum Shift Oscillator (MSO) [SharpStrat]Momentum Shift Oscillator (MSO)
The Momentum Shift Oscillator (MSO) is a custom-built oscillator that combines the best parts of RSI, ROC, and MACD into one clean, powerful indicator. Its goal is to identify when momentum shifts are happening in the market, filtering out noise that a single momentum tool might miss.
Why MSO?
Most traders rely on just one momentum indicator like RSI, MACD, or ROC. Each has strengths, but also weaknesses:
RSI → great for overbought/oversold, but often lags in strong trends.
ROC (Rate of Change) → captures price velocity, but can be too noisy.
MACD Histogram → shows trend strength shifts, but reacts slowly at times.
By blending all three (with adjustable weights), MSO gives a balanced view of momentum. It captures trend strength, velocity, and exhaustion in one oscillator.
How MSO Works
Inputs:
RSI, ROC, and MACD Histogram are calculated with user-defined lengths.
Each is normalized (so they share the same scale of -100 to +100).
You can set weights for RSI, ROC, and MACD to emphasize different components.
The components are blended into a single oscillator value.
Smoothing (SMA, EMA, or WMA) is applied.
MSO plots as a smooth line, color-coded by slope (green rising, red falling).
Overbought and oversold levels are plotted (default: +60 / -60).
A zero line helps identify bullish vs bearish momentum shifts.
How to trade with MSO
Zero line crossovers → crossing above zero suggests bullish momentum; crossing below zero suggests bearish momentum.
Overbought and oversold zones → values above +60 may indicate exhaustion in bullish moves; values below -60 may signal exhaustion in bearish moves.
Slope of the line → a rising line shows strengthening momentum, while a falling line signals fading momentum.
Divergences → if price makes new highs or lows but MSO does not, it can point to a possible reversal.
Why MSO is Unique
Combines trend + momentum + velocity into one view.
Filters noise better than standalone RSI/MACD.
Adapts to both trend-following and mean-reversion styles.
Can be used across any timeframe for confirmation.

Mean Reversion Probability Zones [BigBeluga]🔵 OVERVIEW
The Mean Reversion Probability Zones indicator measures the likelihood of price reverting back toward its mean . By analyzing oscillator dynamics (RSI, MFI, or Stochastic), it calculates probability zones both above and below the oscillator. These zones are visualized as histograms, colored regions on the main chart, and a compact dashboard, helping traders spot when the market is statistically stretched and more likely to revert.
🔵 CONCEPTS
Mean Reversion : The tendency of price to return to its average after significant extensions.
Oscillator-Based Analysis : Uses RSI, MFI, or Stochastic as the base signal for detecting overextension.
Probability Model : The probability of reversion is computed using three factors:
Whether the oscillator is rising or declining.
Whether the oscillator is above or below user-defined thresholds.
The oscillator’s actual value (distance from equilibrium).
Dual-Zone Output :
Upper histogram = probability of downward mean reversion.
Lower histogram = probability of upward mean reversion.
Historical Extremes : The dashboard highlights the recent maximum probability values for both upward and downward scenarios.
🔵 FEATURES
Oscillator Choice : Switch between RSI, MFI, and Stochastic.
Customizable Zones : User-defined upper/lower thresholds with independent colors.
Probability Histograms :
Above oscillator → down reversion probability.
Below oscillator → up reversion probability.
Colored Gradient Zones on Chart : Visual overlays showing where mean reversion probabilities are strongest.
Probability Labels : Percentages displayed next to histogram values for clarity.
Dashboard : Compact table in the corner showing the recent maximum probabilities for both upward and downward mean reversion.
Overlay Compatibility : Works in both chart pane and sub-pane with oscillators.
🔵 HOW TO USE
Set Oscillator : Choose RSI, MFI, or Stochastic depending on your strategy style.
Adjust Zones : Define upper/lower bounds for when oscillator values indicate strong overbought/oversold conditions.
Interpret Histograms :
Orange (upper) histogram → higher chance of a pullback/downward mean reversion.
Green (lower) histogram → higher chance of upward reversion/bounce.
Watch Gradient Zones : On the main chart, shaded areas highlight where probability of mean reversion is elevated.
Consult Dashboard : Use the “Recent MAX” values to understand how strong recent reversion probabilities have been in either direction.
Confluence Strategy : Combine with support/resistance, order flow, or trend filters to avoid counter-trend trades.
🔵 CONCLUSION
The Mean Reversion Probability Zones provides traders with an advanced way to quantify and visualize mean reversion opportunities. By blending oscillator momentum, threshold logic, and probability calculations, it highlights when markets are statistically stretched and primed for reversal. Whether you are a contrarian trader or simply looking for exhaustion signals to fade, this tool helps bring structure and clarity to mean reversion setups.

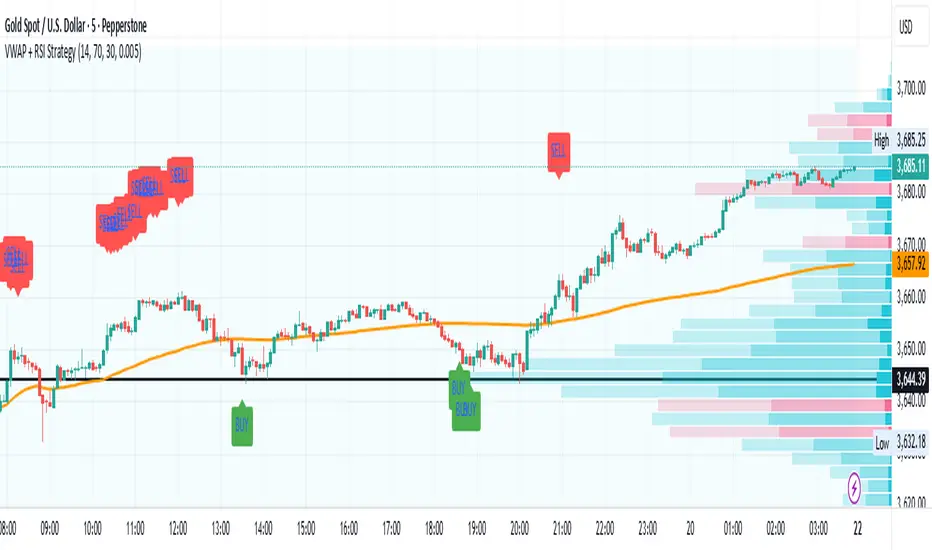
VWAP + RSI Strategytesting this method, based on RSI combine with Vwap
there is a buy and sell alert, if you like pls comment it, this is a simple method that can surely adapt to any assets,
Entry Signals (Long/Short)The indicator visualizes precise entry signals for long and short setups directly on the price chart. Long is marked with a green triangle-up, short with a red triangle-down. To contextualize trend structure, the Fast EMA (5) is plotted in black and the Slow EMA (20) in blue (line width 1). Signals print only at bar close for reproducible execution. Applicable across all timeframes—ideal for top-down analysis from the 195-minute chart through daily to weekly.
RSI/Stochastic with overlays a moving average + Bollinger BandsCompact oscillator panel that lets you switch the base between RSI and Stochastic %K, then overlays a moving average + Bollinger Bands on the oscillator values (not on price) to read momentum strength and squeeze/expansion.
What’s added
Selectable base: RSI ↔ Stochastic %K (plots %D when Stoch is chosen).
MA + BB on oscillator to gauge momentum trend (MA) and volatility (bands).
Adjustable bands 70/50/30 with optional fill, plus optional regular divergence and alerts.
How to read
Bull bias: %K above osc-MA and pushing/closing near Upper BB; confirm with %K > %D.
Bear bias: %K below osc-MA and near Lower BB; confirm with %K < %D.
Squeeze: BB on oscillator tightens → expect momentum breakout.
Overextension: repeated touches of Upper/Lower BB in 70/30 zones → strong trend; watch for %K–%D recross.
Quick settings (start here)
Stoch: 14 / 3 / 3; Bands: 70/50/30.
Osc-MA: EMA 14.
BB on oscillator: StdDev 2.0 (tune 1.5–2.5).
Note
Analysis tool, not financial advice. Backtest across timeframes and use risk management.

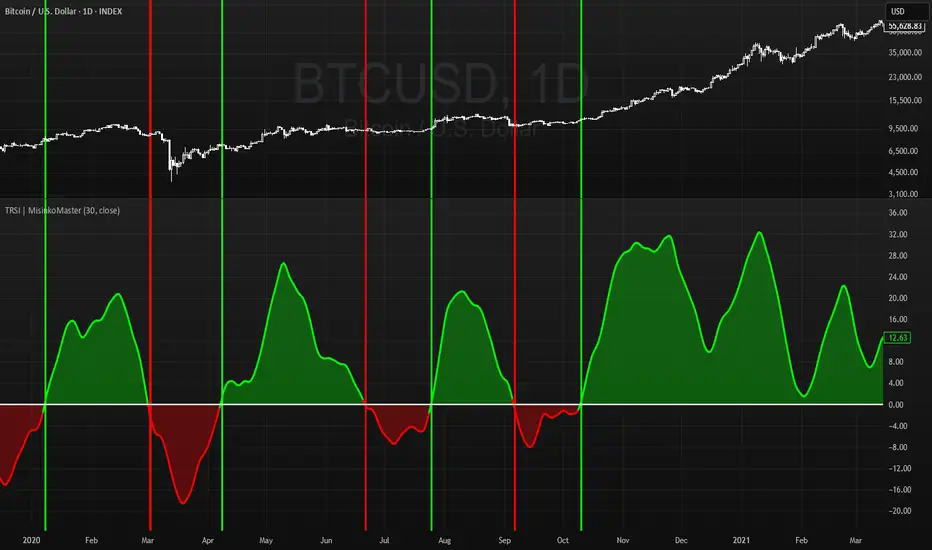
Triple RSI | MisinkoMasterThe Triple RSI (TRSI) is an advanced trend-following oscillator designed to capture trend reversals with speed and smoothness, combining concepts from traditional RSI, multi-timeframe momentum analysis, and layered moving average smoothing.
By blending multiple RSI lengths and applying a unique smoothing sequence, the TRSI creates a fast, momentum-driven RSI oscillator that reduces noise without sacrificing responsiveness.
🔎 Methodology
The indicator is built in three main steps:
Multi-Length RSI Calculation
Three RSIs are calculated using different lengths derived from the user’s input n:
RSI(√n) → very fast, highly responsive.
RSI(n/2) → moderately fast.
RSI(n) → slower, more stable baseline.
Each RSI is normalized by subtracting 50, centering values around zero.
Triple RSI Formula
The three RSIs are combined into the base formula:
TRSI=RSI(√n)+RSI(n/2)−RSI(n)
TRSI=RSI(√n)+RSI(n/2)−RSI(n)
This subtracts the slower RSI from the faster ones, boosting responsiveness and making the TRSI more momentum-oriented than a standard RSI.
Layered Smoothing
The raw TRSI is smoothed in three steps:
RMA(n/2)
RMA(√n)
HMA(√n)
This sequence balances stability and speed:
RMA provides consistency and reduces false noise.
HMA adds responsiveness and precision.
The result is a smooth yet reactive oscillator, optimized for reversal detection.
📈 Trend Classification
The TRSI offers three ways to interpret trend direction:
Oscillator Values
Above 0 → Bullish (uptrend).
Below 0 → Bearish (downtrend).
Oscillator Colors
Green TRSI line → Positive momentum.
Red TRSI line → Negative momentum.
Background Colors
Green background flash → Reversal into bullish trend.
Red background flash → Reversal into bearish trend.
This makes it easy to scan past price history and quickly identify turning points.
🎨 Visualization
TRSI line plotted with dynamic coloring (green/red).
Filled area between TRSI and zero-line reflects momentum bias.
Background flashes highlight trend reversal points, adding context and clarity for visual traders.
⚡ Features
Adjustable length parameter (n).
Dynamic use of √n and n/2 for multi-speed RSI blending.
Built-in smoothing with 2× RMA + 1× HMA.
Multiple trend detection methods (value, color, background).
Works across all assets and timeframes (crypto, forex, stocks, indices).
✅ Use Cases
Reversal Detection → Catch early shifts in trend direction.
Trend Confirmation → Stay aligned with momentum.
Momentum Filter → Avoid counter-trend trades in trending markets.
Historical Analysis → Quickly scan past reversals via background coloring.
⚠️ Limitations
As with all oscillators, TRSI may give false signals in sideways/choppy markets.
Optimal sensitivity depends on asset volatility → adjust n for best results.
It is not a standalone system and should be combined with other tools (trend filters, volume, higher timeframe confluence).
Multi-Indicator Panel (RSI, Stoch, MACD, VIX Fix, MFI)A versatile single-pane oscillator panel combining RSI, Stochastic, MACD (scaled to 0–100), Williams VIX Fix (normalized & inverted: low value = high fear), and MFI. Each module is toggleable, with reference levels, background highlights, and ready-made alerts.
Key features
Per-indicator toggles: RSI, Stoch %K/%D, MACD (lines + optional histogram), inverted 0–100 VIX Fix, and MFI.
Standard levels & center line at 50; adjustable overbought/oversold thresholds.
Contextual background coloring (optional) for extreme conditions.
Built-in alerts: RSI/Stoch OB/OS, MACD–Signal cross, VIX Fix “High Fear/Low Fear,” and MFI OB/OS.
Unified scale: MACD mapped around 50 to align with other oscillators; VIX Fix normalized to 0–100.
How to use (quick)
Add the indicator → enable needed modules via “Indicator Toggles.”
Tune periods & levels (e.g., RSI 14, Stoch 14/3, MACD 12-26-9, VIX Fix 22/252, MFI 14).
(Optional) Turn on MACD histogram.
Create alerts from “Add alert on…” using the provided conditions.
Interpretation notes
Inverted VIX Fix: low values ⇒ high fear/volatility (potential bounces); high values ⇒ complacency.
Scaled MACD: lines around 50 ≈ MACD zero; line crosses remain valid despite scaling.
Disclaimer
Analysis tool, not financial advice. Test across timeframes/instruments and pair with risk management.

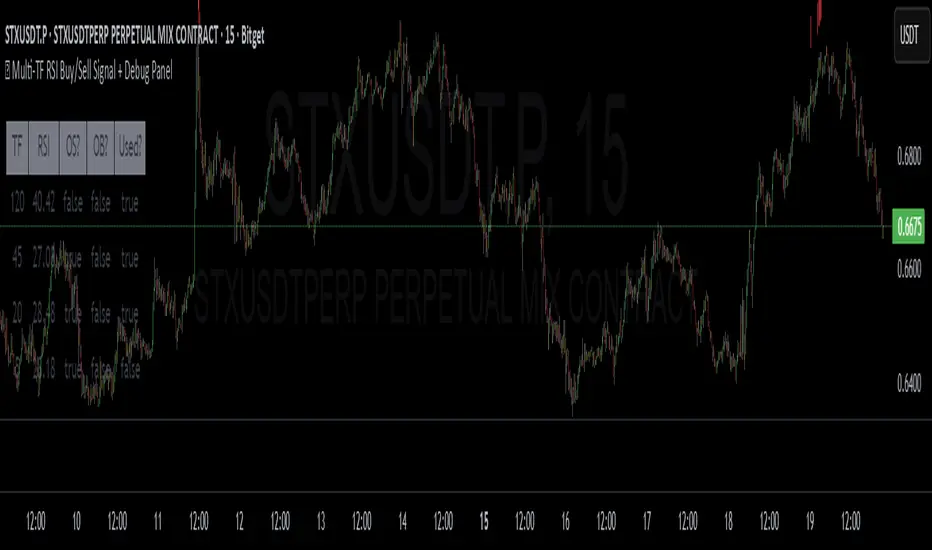
✅ Multi-TF RSI Buy/Sell Signal + Debug Panel
Multi-TF RSI Buy/Sell Signal + Debug Panel
This script provides RSI-based Buy and Sell signals confirmed across multiple timeframes, designed to help identify high-confluence market entries. Includes an optional debug panel for real-time monitoring and diagnostics.
How It Works
RSI Thresholds:
Oversold (OS): RSI < Oversold value → potential Buy
Overbought (OB): RSI > Overbought value → potential Sell
Timeframe Inputs:
You can monitor RSI across up to 4 different timeframes (customizable).
You can enable/disable each individually.
Signal Confirmation:
You define how many of the selected timeframes need to agree (via Min Confirmations).
If Auto Confirm is enabled, it automatically matches the number of confirmations to how many timeframes are enabled.
Signal Logic:
If enough RSI values are oversold, a Buy arrow is shown below the bar.
If enough RSI values are overbought, a Sell arrow appears above the bar.
Alerts are also triggered accordingly.
How to Use
Choose the 4 timeframes you want to monitor.
Toggle which ones to enable (checkboxes).
Select RSI thresholds for oversold/overbought conditions.
Enable Auto Confirmations or manually set how many confirmations are required to trigger a signal.
Use the Style tab to customize the signal visuals.
Turn on alerts with Buy Alert or Sell Alert
Debug Panel
Toggle it on/off via Show Debug Panel.
Move its position to any chart corner.
Updates every 5 bars.
Displays:
Each TF label
RSI value
If it's currently oversold/overbought
If that TF is currently enabled
Tips:
Try to match chart timeframe with one of your selected TFs for better signal visibility.
Use in confluence with other indicators for best results.
RSI alone is not a guaranteed signal – treat it as a filter or alert, not a full strategy.
Notes
This is not financial advice. Always combine with your own analysis.
RSI-based systems work best in ranging or balanced conditions.
Confirmation logic helps reduce noise, but no indicator is infallible.
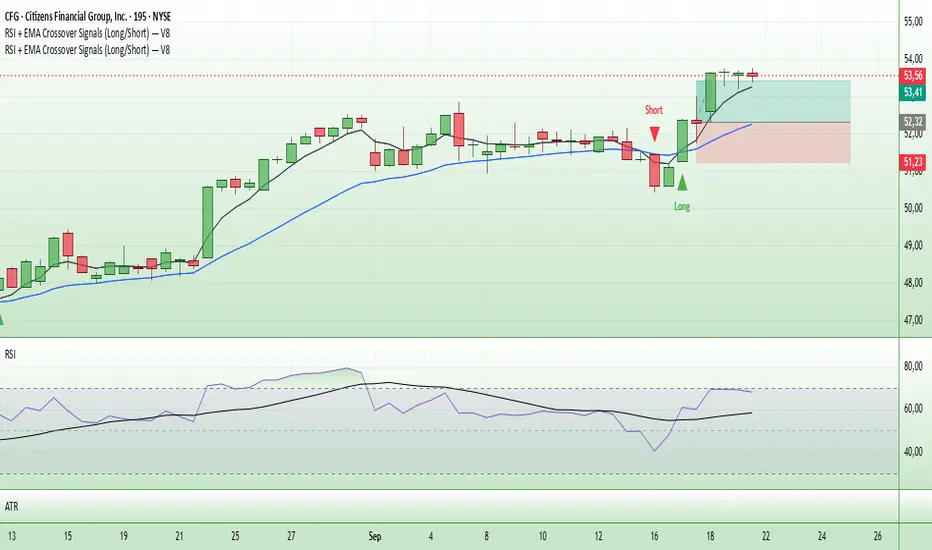
EMA RSI CrossThe EMA RSI Cross (ERC) indicator combines exponential moving average (EMA) crossovers with relative strength index (RSI) momentum signals to highlight potential bullish and bearish trading opportunities.
It works in two layers:
EMA Cross Layer: Tracks short‑term vs. mid‑term trend shifts using EMA(5) crossing above/below EMA(20), while also displaying EMA(50) and EMA(200) for longer‑term structure.
RSI Confirmation Layer: Confirms momentum by requiring RSI(14) to cross its moving average (SMA 14) within a recent lookback window.
Only when both conditions align, and the price confirms the setup in relation to EMA20, a signal is generated:
Bullish Signal (green triangle): EMA5 crosses above EMA20 + RSI crosses up + close above EMA20
Bearish Signal (red triangle): EMA5 crosses below EMA20 + RSI crosses down + close below EMA20
Features
Customizable timeframe input for multi‑timeframe analysis
Adjustable lookback period for RSI confirmation
Clear charting with EMA overlays and arrow signals when confirmed setups occur
RSI panel with dynamic background and overbought/oversold visualization
How to Use
Add the script to your chart, select your preferred signal timeframe.
Look for green arrows as bullish entry confirmation and red arrows for bearish setups.
Use additional filters (trend direction, support/resistance, volume) to refine trades.
Avoid relying on signals in sideways/choppy markets where EMA and RSI may give false triggers.

BB + OBV + RSI Strategy (Enhanced + Daily Table) Script Brief – *BB + OBV + RSI Strategy (Enhanced + Daily Table)*
This TradingView Pine Script combines **Bollinger Bands (BB)**, **On-Balance Volume (OBV)**, **Relative Strength Index (RSI)**, and **Exponential Moving Average (EMA)** to help traders identify potential trend conditions and market strength.
**Key Features:**
* **Bollinger Bands** (20-period SMA ± 2 Std Dev by default) to track volatility and price extremes.
* **OBV & OBV Moving Average** to confirm buying or selling pressure.
* **RSI** to highlight overbought and oversold zones.
* **200 EMA** as a long-term trend filter.
* **Daily Comparison Table** (top-right corner):
* Displays today’s vs. yesterday’s values for Close, RSI, OBV vs MA, BB Position, and EMA Trend.
* Helps quickly assess whether momentum and trend conditions are strengthening or weakening.
**Usage:**
* The chart shows **BB lines and EMA** for real-time analysis on any timeframe.
* The **table provides higher-timeframe context** (daily values), making it easier to confirm signals across multiple timeframes.
* Best applied with backtesting and proper risk management.

MAxRSI Signals [KedArc Quant]Description:
MAxRSI Indicator Marks LONG/SHORT signals from a Moving Average crossover and (optionally) confirms them with RSI. Includes repaint-safe confirmation, optional higher-timeframe (HTF) smoothing, bar coloring, and alert conditions.
Why combine MA + RSI
* The MA crossover is the primary trend signal (fast trend vs slow trend).
* RSI is a gate, not a second, separate signal. A crossover only becomes a trade signal if momentum agrees (e.g., RSI ≥ level for LONG, ≤ level for SHORT). This reduces weak crosses in ranging markets.
* The parts are integrated in one rule: *Crossover AND RSI condition (if enabled)* → plot signal/alert. No duplicated outputs or unrelated indicators.
How it works (logic)
* MA types: SMA / EMA / WMA / HMA (HMA is built via WMA of `len/2` and `len`, then WMA with `sqrt(len)`).
* Signals:
* LONG when *Fast MA crosses above Slow MA* and (if enabled) *RSI ≥ Long Min*.
* SHORT when *Fast MA crosses below Slow MA* and (if enabled) *RSI ≤ Short Max*.
* Repaint-safe (optional): confirms crosses on closed bars to avoid intrabar repaint.
* HTF (optional): computes MA/RSI on a higher timeframe to smooth noise on lower charts.
* Alerts: crossover alerts + state-flip (bull↔bear) alerts.
How to use (step-by-step)
1. Add to chart. Set MA Type, Fast and Slow (keep Fast < Slow).
2. Turn Use RSI Filter ON for confirmation (default: RSI 14 with 50/50 levels).
3. (Optional) Turn Repaint-Safe ON for close-confirmed signals.
4. (Optional) Turn HTF ON (e.g., 60 = 1h) for smoother signals on low TFs.
5. Enable alerts: pick “MAxRSI Long/Short” or “Bullish/Bearish State”.
Timeframe guidance
* Intraday (1–15m): EMA 9–20 fast vs EMA 50 slow, RSI filter at 50/50.
* Swing (1h–D): EMA 20 fast vs EMA 200 slow, RSI 50/50 (55/45 for stricter).
What makes it original
* Repaint-safe cross confirmation (previous-bar check) for reliable signals/alerts.
* HTF gating (doesn’t compute both branches) for speed and clarity.
* Warning-free MA helper (precomputes SMA/EMA/WMA/HMA each bar), HMA built from built-ins only.
* State-flip alerts and optional RSI overlay on price pane.
Built-ins used
`ta.sma`, `ta.ema`, `ta.wma`, (HMA built from these), `ta.rsi`, `ta.crossover`, `ta.crossunder`, `request.security`, `plot`, `plotshape`, `barcolor`, `alertcondition`, `input.*`, `math.*`.
Note: Indicator only (no orders). Test settings per symbol. Not financial advice.
⚠️ Disclaimer
This script is provided for educational purposes only.
Past performance does not guarantee future results.
Trading involves risk, and users should exercise caution and use proper risk management when applying this strategy.

Pullback & ATR Trailing Strategy※日本語は英文の次に記載あります。
Overview
This indicator combines short-term RSI pullback/rebound signals with long-term RSI divergence to visualize potential buy and sell opportunities.
It also plots ATR-based trailing stops and partial take-profit lines, making it suitable for day trading and short-term trading.
Alerts are triggered when signal conditions are met.
Key Features
Detect short-term RSI pullbacks/rebounds (default 6 periods)
Detect divergences on long-term RSI
Visualize buy/sell signals with labels
Display ATR-based trailing stop and partial take-profit lines
Trigger alerts when conditions are met
Settings Explanation
Short-term RSI Length (rsiShortLen) Period for short-term RSI used to detect pullbacks or rebounds
Pullback Threshold (levelLow) RSI level below which a buy signal is considered
Rebound Threshold (levelHigh) RSI level above which a sell signal is considered
Long-term Timeframe (longTF) Timeframe used for divergence detection
Long-term RSI Length (longRSILen) Period for RSI on the long-term timeframe, used for divergence detection
Pivot Width Left / Right (pivotLeft / pivotRight)
Determines how we detect swing highs/lows (peaks and valleys).
For example, with pivotLeft=3 and pivotRight=3, a bar is considered a swing high if it is higher than the 3 bars to its left and 3 bars to its right.
Larger numbers detect only bigger swings, smaller numbers also detect smaller swings.
ATR Length (atrLen) Period for ATR calculation for trailing stops
ATR Multiplier (atrMult) Multiplier for ATR to calculate trailing stop distance
Partial Take-Profit Multiplier (tpMult) Multiplier to calculate half-profit level based on swing amplitude
Green line (Long Trail / translucent green)
ATR-based trailing stop line for long positions.
Used as a stop-loss or trailing stop for open buy trades.
Dark green line shows partial take-profit (TP), translucent green shows trailing stop level.
Red line (Short Trail / translucent red)
ATR-based trailing stop line for short positions.
Used as a stop-loss or trailing stop for open sell trades.
Dark red line shows partial take-profit (TP), translucent red shows trailing stop level.
Note: TP lines indicate partial take-profit targets, while ATR trailing lines indicate stop-loss/trailing stop levels if the price moves against the position.
日本語説明ーーーーーーーーーーーーーーーーーーーーーーーーーーーー
概要
このインジケーターは、短期RSIの押し目/戻りシグナルと、長期足RSIによるダイバージェンスを組み合わせて、買い・売りのチャンスを可視化します。
さらに、ATRベースのトレールストップラインや半分利確ラインも表示し、デイトレードや短期トレードに最適化しています。
シグナル条件に一致した場合にアラートも作動します。
主な機能
短期RSI(デフォルト6期間)で押し目・戻りを検出
長期足RSIでのダイバージェンスを検出
BUY/SELLラベルでシグナルを視覚化
ATRベースのトレールライン・半分利確ラインを表示
条件一致時にアラート発動
各設定の説明
短期RSI期間 (rsiShortLen) デイトレ用の短期RSIの期間。押し目や戻りのシグナルに使用
押し目閾値 (levelLow) RSIが下回ったら買いシグナル判定に使用
戻り閾値 (levelHigh) RSIが上回ったら売りシグナル判定に使用
長期足 (longTF) ダイバージェンス判定用の長期足の時間軸
長期RSI期間 (longRSILen) 長期足で計算するRSIの期間。ダイバージェンス判定に使用
左右ピボット幅 (pivotLeft / pivotRight) 高値や安値を「スイングの山・谷」として判定する時に使う幅です。
例えば pivotLeft=3, pivotRight=3 の場合、「左に3本、右に3本のローソク足より高い/低い点」をスイングの頂点や底と見なします。
数値を大きくすると大きな波だけを拾い、小さくすると小さな波も拾いやすくなります。
ATR期間 (atrLen) トレールライン計算用ATRの期間
ATR倍率 (atrMult) トレールラインの距離をATRに掛ける倍率
半分利確倍率 (tpMult) 押し目/戻り幅に対して半分利確ラインを設定する倍率
緑の線(Long Trail / 半透明緑)
ATRベースのトレールストップラインです。
買いポジション中の損切り目安やトレーリングストップとして使います。
緑の濃い線は半分利確ライン(TP)、薄い緑の線はトレールストップの位置を示します。
赤い線(Short Trail / 半透明赤)
ATRベースのトレールストップラインです。
売りポジション中の損切り目安やトレーリングストップとして使います。
赤の濃い線は半分利確ライン(TP)、薄い赤の線はトレールストップの位置を示します。
補足:TP(Take Profit)線は半分利確の目安で、ATRトレールラインはポジションが逆行した時の損切り目安です。

EMA-RSI-ADX Trend Bands
📌 EMA-RSI-ADX Trend Bands (ERA Trend Bands)
🔥 Overview
The ERA Trend Bands indicator combines Exponential Moving Average (EMA), Relative Strength Index (RSI), and Average Directional Index (ADX) into a powerful multi-factor trend system.
It helps traders:
Identify trend direction (Bullish / Bearish)
Measure trend strength using EMA deviation bands
Confirm momentum with RSI & ADX filters
Visualize conditions with dynamic colors, labels, tables, and signals
⚡ Key Features
📍 EMA Trend Bands
EMA100 with gradient glow effect showing trend bias
Strength bands around EMA (Very Weak → Hyper levels)
Bands color-coded for bullish/bearish extremes
📊 RSI + ADX Confluence
Bullish Signal: RSI ≥ threshold & ADX ≥ threshold → 🟢
Bearish Signal: RSI ≤ threshold & ADX ≤ threshold → 🔴
Candles recolored when conditions are met
Auto-generated labels show live RSI/ADX values
🧩 Strength Levels
Classifies deviation from EMA into 8 levels:
Neutral → Very Weak → Weak → Moderate → Strong → Very Strong → Extreme → Hyper
Dashboard table shows deviation % ranges & strength colors
Dynamic labels display Trend, Strength, Deviation %, RSI & ADX
🎨 Visual Enhancements
Gradient EMA line with glow effect
Bullish (greens) & bearish (reds) vibrant palettes
Background coloring (optional) based on strength
Symbols & labels for entry confirmation
🎯 How to Use
Trend Direction – EMA color + deviation bands show whether market is bullish or bearish.
Strength Confirmation – Use strength labels & dashboard table to gauge overextension.
Entry Signals – Watch for RSI/ADX confluence (green/red labels on chart).
Exits – Monitor when strength fades back toward Neutral/Weak levels.
⚙️ Settings & Inputs
EMA Settings → Length, Line Width, Gradient Intensity
RSI Settings → Length & Thresholds (Bullish / Bearish)
ADX Settings → Length & Thresholds (Bullish / Bearish)
Bands → Enable/disable EMA deviation bands
Labels/Table → Toggle strength info display
Colors → Fully customizable vibrant palettes
🚨 Alerts & Signals
Bullish Condition → RSI & ADX above thresholds
Bearish Condition → RSI & ADX below thresholds
Visual confirmation with labels, candles, and background
⚠️ Disclaimer
This script is for educational purposes only.
It does not constitute financial advice.
Always backtest and use proper risk management before trading live.
✨ Add EMA-RSI-ADX Trend Bands (ERA Trend Bands) to your chart to trade with clarity, strength, and precision.

Argentum Flag [AGP] Ver.2.5Central Purpose and Concept
The Argentum Flag script is a multifunctional tool that integrates and visualizes multiple key indicators to provide a detailed and unified perspective of the market. The core concept is to analyze price from different angles—volatility, volume, and momentum—to identify confluences and patterns that may be difficult to see with separate indicators. This "mashup" is not a simple fusion of indicators, but a strategic combination of tools that complement each other to offer a comprehensive view of asset behavior.
Components and Their Functionality
This script combines and visualizes the following elements:
EMA Percentage Bands (EMA Bands):
Uses an Exponential Moving Average (EMA) as a baseline.
Calculates and draws several volatility bands that deviate from the central EMA by fixed percentages (0.47%, 0.94%, 2.36%). These bands are inspired by Fibonacci ratios and the cyclical nature of the market.
The bands are colored with a dynamic gradient that reflects the current state of volatility.
Utility: These bands act as dynamic support and resistance areas. The price entering or exiting these zones can indicate a change in volatility or a possible exhaustion of the movement.
Volatility Signals (Vortex & Prime Signals):
The script generates visual signals when the price stays outside the volatility bands for a specific number of bars.
Vortex Signals (diamond ⍲): Appear when the price crosses and stays outside the Prime bands, suggesting a high volatility or a possible continuation of the trend.
Exit/Entry Signals (circle ⌾): Are activated when the price stays outside the Vortex bands, indicating an extreme extension of volatility. These can be interpreted as potential reversal or profit-taking zones.
Utility: They help traders quickly identify moments of high and low volatility and potential turning points in price action.
Volume Analysis (Volume Bar Colors):
The script changes the color of the bars based on the relationship between the current volume and the average volume over a 50-bar period.
Utility: This feature allows the trader to immediately visualize the strength behind a price movement. For example, a bullish candle with "extreme" volume suggests strong buying interest, while a bearish candle with "low" volume could indicate a weak correction.
Summary Tables (Dashboard):
EMA-Fibo Table: Displays the values of 12 EMAs based on the Fibonacci sequence (5, 8, 13, 21...) in an easy-to-access table. The background color of each value indicates if the current price is above (bullish) or below (bearish) that EMA.
Multi-Timeframe RSI Table: Displays the Relative Strength Index (RSI) values across multiple timeframes (from 1 minute to monthly). The text color changes to highlight if the RSI is in overbought (orange) or oversold (white) areas, according to the established levels.
Utility: These tables condense a large amount of data into a simple format, allowing traders to perform a quick, multi-timeframe market analysis without constantly switching charts.
How to Use the Script
This script is a contextual analysis tool that works best when its different components are combined. It is not a "buy and sell signal" system on its own, but a tool for informed decision-making.
Trend Identification: Use the EMA table to see the general trend direction across different timeframes. A price above most of the EMAs in the table suggests a bullish bias.
Volatility Reading: Observe the EMA bands. If the price stays within the bands, volatility is low. A strong move that breaks out of the bands, accompanied by an "extreme" volume color (blue), suggests strong momentum that could continue.
Momentum Analysis: Use the RSI table to confirm movements. An overbought 15m RSI could support a reversal signal from the Vortex bands, while a 1D RSI in a neutral zone may indicate that the main trend has not changed.
Signal Confirmation: Visual signals (diamond and circle) should not be used in isolation. They must be confirmed by volume analysis and dashboard readings. For example, an "Exit Signal" (circle) with low volume may be less reliable than one with high volume and a clear reversal candle.
Disclaimer
This script is for informational and educational purposes only. It is not financial advice, nor is it a recommendation to buy or sell any financial instrument. All trading involves risk, and past performance is not indicative of future results. The user is solely responsible for their own trading decisions.

Adaptive RSIFor traders who want more control, the indicator allows customization of RSI length, smoothing type, and Bollinger Band settings, making it adaptable to day trading, swing trading, and even long-term investing.
In short, this is more than just an RSI — it’s a complete momentum toolkit that combines clarity, flexibility, and advanced signal detection in one clean package.
