BTC Price Prediction Model [Global PMI]🇨🇳 中文说明 (Chinese Version)
1. 简介
本指标由 GW Capital 使用 Gemini Vibe Coding 技术制作。利用先进的 AI 编程能力,将复杂的宏观经济模型重构为可执行的交易工具。
2. 致谢
特别感谢模型原作者 Marty Kendall。他对这一算法的研究奠定了基础,揭示了比特币价格与宏观经济因素之间的深层联系。
3. 模型原理与公式
该模型基于四大宏观经济支柱计算比特币的“公允价值”。它假设比特币的价格是全球流动性、网络安全性、风险偏好和经济周期的函数。
模型公式
$$\ln(BTC) = \alpha + (1 + \beta \cdot PMI_{z}) \times $$
全球流动性 (M2): 美、中、欧、日四大经济体的 M2 总量(折算为美元)。代表可流入资产的法币资金池。
网络安全性 (Hashrate): 比特币全网算力,代表网络的物理安全性和实用价值。
风险偏好 (S&P 500): 作为全球风险情绪的代理指标。
经济周期 (PMI Z-Score): 美国制造业 PMI 用于根据商业周期(扩张 vs 收缩)来放大或抑制估值。
4. 指标用法
指标会在图表上绘制 公允价值 (白线) 以及基于统计偏差 (Z-Score) 的四条情绪带。
情绪区间
🚨 极度贪婪 (红色区域): 价格 > +0.3 标准差。历史上通常预示市场顶部或情绪过热。
⚠️ 一般贪婪 (橙色区域): 价格 > +0.15 标准差。多头动能强劲,但需谨慎。
⚖️ 公允价值 (白线): 基于宏观数据的理论“正确”价格。
😨 一般恐惧 (青色区域): 价格 < -0.15 标准差。进入低估区域。
💎 极度恐惧 (绿色区域): 价格 < -0.3 标准差。历史上通常是代际级别的买入机会。
情绪评分 (0-100)
100: 极度贪婪 (顶部)
50: 公允价值
0: 极度恐惧 (底部)
5. 使用建议
周期: 仅限日线 (1D) 或周线 (1W)。
原因: 底层数据源(M2, PMI)是月度更新的。标普500和算力是日度更新的。在日内图表(如15分钟、1小时、4小时)上使用此指标没有任何意义,因为基本面数据不会变化得那么快。
长期视角: 这是一个宏观周期指标,旨在识别数月甚至数年的周期顶部和底部,而非用于日内交易。
6. 免责声明
本指标仅供教育和参考使用,不构成任何财务建议。该模型依赖于历史相关性,未来可能不再适用。所有交易均涉及风险。GW Capital 及制作者不对任何交易损失承担责任。
🇺🇸 English Guide (英文说明)
1. Introduction
This indicator was created by GW Capital using Gemini Vibe Coding technology. It leverages advanced AI coding capabilities to reconstruct complex macroeconomic models into actionable trading tools.
2. Credits
Special thanks to the original model author, Marty Kendall. His research into the correlation between Bitcoin's price and macroeconomic factors lays the foundation for this algorithm.
3. Model Principles & Formula
This model calculates the "Fair Value" of Bitcoin based on four key macroeconomic pillars. It assumes that Bitcoin's price is a function of Global Liquidity, Network Security, Risk Appetite, and the Economic Cycle.
The Formula
$$\ln(BTC) = \alpha + (1 + \beta \cdot PMI_{z}) \times $$
Global Liquidity (M2): Sum of M2 supply from US, China, Eurozone, and Japan (converted to USD). Represents the pool of fiat money available to flow into assets.
Network Security (Hashrate): Bitcoin's hashrate, representing the physical security and utility of the network.
Risk Appetite (S&P 500): Used as a proxy for global risk sentiment.
Economic Cycle (PMI Z-Score): US Manufacturing PMI is used to amplify or dampen the valuation based on where we are in the business cycle (Expansion vs. Contraction).
4. How to Use
The indicator plots the Fair Value (White Line) and four sentiment bands based on statistical deviation (Z-Score).
Sentiment Zones
🚨 Extreme Greed (Red Zone): Price > +0.3 StdDev. Historically indicates a market top or overheated sentiment.
⚠️ Greed (Orange Zone): Price > +0.15 StdDev. Bullish momentum is strong but caution is advised.
⚖️ Fair Value (White Line): The theoretical "correct" price based on macro data.
😨 Fear (Teal Zone): Price < -0.15 StdDev. Undervalued territory.
💎 Extreme Fear (Green Zone): Price < -0.3 StdDev. Historically a generational buying opportunity.
Sentiment Score (0-100)
100: Maximum Greed (Top)
50: Fair Value
0: Maximum Fear (Bottom)
5. Usage Recommendations
Timeframe: Daily (1D) or Weekly (1W) ONLY.
Reason: The underlying data sources (M2, PMI) are updated monthly. The S&P 500 and Hashrate are daily. Using this indicator on intraday charts (e.g., 15m, 1h, 4h) adds no value because the fundamental data does not change that fast.
Long-Term View: This is a macro-cycle indicator designed for identifying cycle tops and bottoms over months and years, not for day trading.
6. Disclaimer
This indicator is for educational and informational purposes only. It does not constitute financial advice. The model relies on historical correlations which may not hold true in the future. All trading involves risk. GW Capital and the creators assume no responsibility for any trading losses.
Cari dalam skrip untuk "spx"

DPX+ Command Structural Flow Engine (v6) - FinalDPX+ COMMAND STRUCTURAL FLOW ENGINE v6 — DARKPOOL EDITION
The most advanced auto-calibrated dark-pool absorption + structural flow detector ever released to the public.
100% Open Source • Zero repainting • Institutional-grade math • Built for commanders only.
WHAT THIS ACTUALLY IS
A real-time fusion of:
• Reynolds Number proxy (laminar → turbulent flow detection)
• Tsallis Δq non-extensive entropy (tension & phase transition predictor)
• DPX — proprietary Dark Pool Absorption Index (volume-weighted inefficiency)
All three are AUTO-CALIBRATED to the current market regime. No manual thresholds. Works on BTC, SPX, TSLA, 1m or monthly — same settings.
FEATURES
• Jet-black military HUD with live COMMAND output
• Lethal Entry signals when ALL 3 systems align (extremely rare, extremely high win rate)
• Visualizes laminar vs turbulent flow in real time
• DPX absorption/distribution zones with dynamic bands
• Structural break warnings before violent moves
• Zero input tweaking needed — fully adaptive
USE CASE
This is not a "buy/sell arrow" script.
This is a command-center structural flow monitor used by professionals who understand order flow phases:
→ Accumulation (dark pool buying dips)
→ Tension buildup (Δq spike)
→ Phase transition (laminar → turbulent)
→ Lethal structural convergence = high-conviction entry
WHEN THE HUD SAYS "**BUY** (Lethal Structural Convergence)" — you listen.
Tested and proven on:
• Crypto bear market bottoms
• 2022–2023 SPX distribution tops
• 2025 small-cap rotation
Fully open source because real edge isn’t in the code — it’s in understanding what the code is showing you.
If you know, you know.
#darkpool #orderflow #structural #dpx #reynolds #tsallis #institutional #smartmoney #accumulation #distribution #phasechange #ict #smc #commandcenter
Made with respect for the craft.
Drop a ♥ if this speaks to you.

Classic Wave: The Easy WayClassic Wave is a simple strategy with few rules and no over-optimization. Despite its simplicity, it is backed by a nearly century-long historical track record, delivering excellent returns on the weekly chart of the SPX (TVC).
I also recommend observing its strong performance on the SPY (weekly), which is the perfect instrument for executing this strategy with futures in the future.
Strategy Rules and Parameters
When a bullish candle closes above the 20-period EMA, we place the stop-loss below the low of that candle and target a risk-reward ratio of 1:1.
A second, more profitable variant is to change the risk-reward ratio in the code to 2:1.
-Total capital: $10,000
-We use 10% of the total capital per trade.
-Commissions: 0.1% per trade.
The code construction is simple and very well detailed within the script itself.
Risk-Reward Ratio 2:1
Using a 2:1 risk-reward ratio reduces the win rate but significantly increases profitability.
Across the full historical data of the SPX index (weekly), the system would have generated 236 trades, with a win rate of 51.27% and a profit factor of 2.53.
From January 1, 2023, to November 28, 2025, the system would have generated 5 trades, with an 80% win rate and a profit factor of 9.244.
What makes this system so good?
-It takes advantage of the long-term bullish bias of U.S. stock indices and traditional markets.
-It filters out a lot of noise thanks to the weekly timeframe.
-It uses simple parameters with no over-optimization.
Final Notes:
This strategy has consistently outperformed the returns offered by most traditional funds over time, with fewer drawdowns and significantly less stress. I hope you like it.

SVE Daily ATR + SDTR Context BandsSVE Daily ATR + SDTR Context Bands is a free companion overlay from The Volatility Engine™ ecosystem.
It plots daily ATR-based expansion levels and a Standardized Deviation Threshold Range (SDTR) to give traders a clean, quantitative view of where intraday price sits relative to typical daily movement and volatility extremes.
This module is designed as an SVE-compatible context layer—using discrete, RTH-aligned daily zones, expected-move bands, and a standardized volatility shell—so traders can build situational awareness even without the full SPX Volatility Engine™ (SVE).
It does not generate trade signals.
Its sole purpose is to provide a clear volatility framework you can combine with your own structure, Fibonacci, or signal logic (including SVE, if you use it).
🔍 What It Shows
* Daily ATR Bands (expHigh / expLow)
- Expected high/low based on smoothed daily ATR
- Updates at the RTH open
* Daily SDTR Bands (expHighSDTR / expLowSDTR)
- Standard deviation threshold range for volatility extremes
- Helps identify overextended conditions
Discrete RTH-aligned Zones
- Bands reset cleanly at each RTH session
No continuous carry-over from prior days
Daily ATR & SDTR stats label
Quick-reference box showing current ATR and SDTR values
🎯 Purpose
This tool helps traders:
- Gauge intraday context relative to expected daily movement
- Assess volatility state (quiet, normal, expanded, extreme)
- Identify likely exhaustion or expansion zones
- Frame intraday price action inside daily volatility rails
- Support decision-making with objective context rather than emotion
It complements any strategy and works on any intraday timeframe.
⚙️ Inputs
- ATR Lookback (default: 20 days)
- RTH Session Times
- SDTR Lookback
- Show/Hide Daily Stats Label
🧩 Part of the SVE Ecosystem
This module is part of the broader SPX Volatility Engine™ framework.
The full SVE system includes:
- Composite signal scoring
- Volatility compression logic
- Histogram slope and momentum analysis
- Internals (VIX / VVIX / TICK)
- Structural zone awareness
- Real-time bias selection
- High-clarity decision support
⚠️ Disclaimer
This tool is provided for educational and informational purposes only.
No performance claims are made or implied.
Not investment advice.

Distribution Day Grading [Blk0ut]Distribution Day Grading
This script is designed to give traders and investors a fast, objective, and modern read on market health by analyzing distribution days, and stall days, two forms of institutional selling that often begin to appear before trend weakness, failed breakouts, and sharp corrections.
The goal of this script isn’t to predict tops or bottoms, but instead, it measures the character of the tape in a way that’s simple, visual, and immediately actionable.
While distribution analysis has existed for decades, my implementation is, I think, a little more adaptive. Traditional rules for identifying distribution days, coming from CANSLIM methodology, were built for markets which had lower volatility, different liquidity profiles, and slower institutional rotation. This script updates the traditional method with modernized thresholds, recency-weighted decay, stall-day logic, and dynamic presets tuned uniquely for the personality of each major U.S. index (you can change the values yourself as well).
The results are displayed as a compact letter-grade that quantitatively reflects a measure of how much institutional supply has been hitting the market, as well as how recently. This helps determine whether conditions are supportive of breakouts, mean reversion trades, aggressive trend trades, or whether caution and lighter sizing are warranted.
__________________________________________________________________________________
How It Works
The script evaluates each bar for two conditions:
1. Distribution Day
A bar qualifies as distribution when:
- Price closes down beyond a threshold (default 0.30%, adjustable)
- Volume is higher than the prior session (optional toggle)
Distribution days typically represent active institutional selling .
2. Stall Day
A softer form of supply:
-Price remains flat to slightly negative within a small threshold
-Close < open
-Volume higher than prior day
Stall days represent a passive distribution or hidden supply .
Each distribution day is counted as 1 unit by the script, each stall day as 0.5 units.
Recency Weighting
The script applies an optional half-life decay so that fresh distribution matters more than old distribution. This mimics the “aging out” effect that professional traders use, but does it in a smoother, more mathematically consistent way.
The script then produces:
A weighted distribution score
A raw distribution + stall count
A letter grade from A → F
Let's talk about the letters...
_________________________________________________________________________________
Letter Grade Meaning
A — Very Healthy Tape
Minimal institutional selling.
Breakouts behave better, momentum holds, pullbacks are shallow, upside targets are hit more consistently.
B — Healthy / Slight Caution
Some isolated supply but nothing structural.
Conditions remain favorable for trend trades, pullbacks, and breakout continuation.
C — Mixed / Caution Warranted
Distribution is building.
Breakouts begin to fail faster, candles widen, rotation becomes unstable, and risk/reward compresses.
D — Weak / Risk Elevated
Institutional selling is becoming persistent.
Failed breakouts, sharp reversals, and failed rallies become more common. Position sizing should tighten.
F — Clear Deterioration
Broad, repeated institutional distribution.
This is where major tops, deeper pullbacks, and corrections often begin to form underneath the surface.
_________________________________________________________________________________
Index-Tuned Presets (Auto Mode)
Market structure varies dramatically across indices.
To address this, the script includes auto-detect presets for:
SPY / SPX equivalents
QQQ / NASDAQ-100 equivalents
IWM / Russell 2000 equivalents
DIA / Dow 30 equivalents
Each preset contains optimized values based on volatility, liquidity, noise, and institutional behavior:
SPY / SPX
Low noise, deep liquidity → classic thresholds work well.
Distribution thresholds remain conservative.
QQQ
Higher volatility → requires a slightly larger down-percentage filter to avoid false signals.
IWM
Noisiest of the major indices → requires much stricter thresholds to filter out junk signals.
DIA
Slowest-moving index → tighter conditions catch real distribution earlier.
The script automatically detects which symbol family you’re viewing and loads the appropriate preset unless manual overrides are enabled.
__________________________________________________________________________________
How to Interpret This Indicator
Grade A–B:
Breakouts have higher odds of clean continuation
Mean reversion is smoother
Position sizing can be more assertive
Grade C:
Start tightening risk
Focus on A- setups, not B- or C- risk ideas
Grade D–F:
Expect lower win rates
Expect breakout failures
Favor countertrend plays or reduced exposure
Take faster profits
____________________________
This indicator should help traders prevent themselves from fighting the tape or sizing aggressively when the underlying environment is deteriorating through:
- Modernized distribution logic, not the 1990s thresholds
- Recency-weighted decay instead of the old 5-week “aging out”
- Stall-day detection for subtle institutional supply
- Auto-presets tuned per index, adjusting thresholds to match volatility and liquidity
- Unified letter-grade scoring for visual clarity
- Independent application for any trading style, it helps with trend, momentum, mean reversion, and options
_________________________________________________________________________________
Keep in mind: This script is provided strictly for educational and informational purposes.
Nothing in this indicator constitutes financial advice, trading advice, investment guidance, or a recommendation to buy or sell any security, option, cryptocurrency, or financial instrument.
No indicator should ever be used as the sole basis for a trading or investment decision.
Markets carry risk. Past performance does not predict future results.
Always perform your own analysis, use proper risk management, and consult a licensed professional if you need advice specific to your financial situation.
Happy Trading!
Blk0uts

Relative Performance Areas [LuxAlgo]The Relative Performance Areas tool enables traders to analyze the relative performance of any asset against a user-selected benchmark directly on the chart, session by session.
The tool features three display modes for rescaled benchmark prices, as well as a statistics panel providing relevant information about overperforming and underperforming streaks.
🔶 USAGE
Usage is straightforward. Each session is highlighted with an area displaying the asset price range. By default, a green background is displayed when the asset outperforms the benchmark for the session. A red background is displayed if the asset underperforms the benchmark.
The benchmark is displayed as a green or red line. An extended price area is displayed when the benchmark exceeds the asset price and is set to SPX by default, but traders can choose any ticker from the settings panel.
Using benchmarks to compare performance is a common practice in trading and investing. Using indexes such as the S&P 500 (SPX) or the NASDAQ 100 (NDX) to measure our portfolio's performance provides a clear indication of whether our returns are above or below the broad market.
As the previous chart shows, if we have a long position in the NASDAQ 100 and buy an ETF like QQQ, we can clearly see how this position performs against BTSUSD and GOLD in each session.
Over the last 15 sessions, the NASDAQ 100 outperformed the BTSUSD in eight sessions and the GOLD in six sessions. Conversely, it underperformed the BTCUSD in seven sessions and the GOLD in nine sessions.
🔹 Display Mode
The display mode options in the Settings panel determine how benchmark performance is calculated. There are three display modes for the benchmark:
Net Returns: Uses the raw net returns of the benchmark from the start of the session.
Rescaled Returns: Uses the benchmark net returns multiplied by the ratio of the benchmark net returns standard deviation to the asset net returns standard deviation.
Standardized Returns: Uses the z-score of the benchmark returns multiplied by the standard deviation of the asset returns.
Comparing net returns between an asset and a benchmark provides traders with a broad view of relative performance and is straightforward.
When traders want a better comparison, they can use rescaled returns. This option scales the benchmark performance using the asset's volatility, providing a fairer comparison.
Standardized returns are the most sophisticated approach. They calculate the z-score of the benchmark returns to determine how many standard deviations they are from the mean. Then, they scale that number using the asset volatility, which is measured by the asset returns standard deviation.
As the chart above shows, different display modes produce different results. All of these methods are useful for making comparisons and accounting for different factors.
🔹 Dashboard
The statistics dashboard is a great addition that allows traders to gain a deep understanding of the relationship between assets and benchmarks.
First, we have raw data on overperforming and underperforming sessions. This shows how many sessions the asset performance at the end of the session was above or below the benchmark.
Next, we have the streaks statistics. We define a streak as two or more consecutive sessions where the asset overperformed or underperformed the benchmark.
Here, we have the number of winning and losing streaks (winning means overperforming and losing means underperforming), the median duration of each streak in sessions, the mode (the number of sessions that occurs most frequently), and the percentages of streaks with durations equal to or greater than three, four, five, and six sessions.
As the image shows, these statistics are useful for traders to better understand the relative behavior of different assets.
🔶 SETTINGS
Benchmark: Benchmark for comparison
Display Mode: Choose how to display the benchmark; Net Returns: Uses the raw net returns of the benchmark. Rescaled Returns: Uses the benchmark net returns multiplied by the ratio of the benchmark and asset standard deviations. Standardized Returns: Uses the benchmark z-score multiplied by the asset standard deviation.
🔹 Dashboard
Dashboard: Enable or disable the dashboard.
Position: Select the location of the dashboard.
Size: Select the dashboard size.
🔹 Style
Overperforming: Enable or disable displaying overperforming sessions and choose a color.
Underperforming: Enable or disable displaying underperforming sessions and choose a color.
Benchmark: Enable or disable displaying the benchmark and choose colors.

RED-E Index and ETF ConverterThis indicator provides real-time conversion between major US stock market indices and their corresponding ETFs, displaying current prices, calculated conversions, and market sentiment in an easy-to-read dashboard format.
WHAT IT DOES:
Tracks three major index-ETF pairs and shows bi-directional conversions:
SPX (S&P 500 Index) ↔ SPY (SPDR S&P 500 ETF)
NDX (NASDAQ-100 Index) ↔ QQQ (Invesco QQQ ETF)
RUT (Russell 2000 Index) ↔ IWM (iShares Russell 2000 ETF)
HOW IT WORKS:
The script uses request.security() to fetch real-time price data from each instrument and applies standard conversion ratios:
SPX to SPY: ~1:10 ratio
NDX to QQQ: ~1:40 ratio
RUT to IWM: ~1:10 ratio
Market sentiment is determined by comparing current price to previous bar, displaying BULLISH (green ▲), BEARISH (red ▼), or NEUTRAL (gray ●).
KEY FEATURES:
Real-time price tracking for all six instruments
Bi-directional conversion calculations
Visual sentiment indicators based on price movement
Customizable dashboard position
Adjustable font sizes
Toggle individual index pairs on/off
Color-coded sections
Clean professional table layout
USAGE:
Add the indicator to any chart. The dashboard will display in the bottom left corner by default. Use the settings to:
Change dashboard position
Adjust font size
Show/hide specific index-ETF pairs
Customize sentiment colors
This tool is useful for traders who:
Trade both indices and ETFs
Want to quickly compare index vs ETF pricing
Monitor multiple market segments simultaneously
Need at-a-glance sentiment across major indices
Note: Conversion ratios are approximate and based on standard tracking ratios. Actual ETF prices may vary slightly due to tracking error, fees, and market conditions.
Disclaimer: This indicator is for educational and informational purposes only. It does not constitute financial advice. The creator is not a financial advisor, and users should consult with a licensed financial professional before making any investment decisions. Use at your own risk.

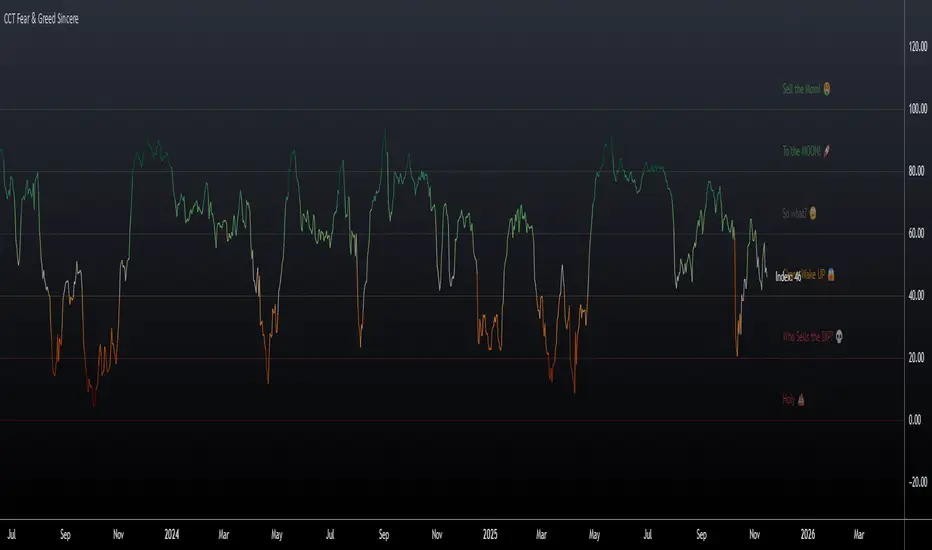
CCT Fear & Greed Sincere📄 CCT Fear & Greed Sincere — Technical Overview
The CCT Fear & Greed Sincere indicator provides a consolidated view of macro-market conditions using exclusively price-derived and market-structure data. The goal is to translate multiple independent risk-appetite components into a unified 0–100 index. This tool does not rely on survey sentiment, alternative datasets, or social indicators; it uses only verifiable, market-observable inputs.
All components are normalized into a comparable scale and combined into a composite metric representing broad risk-seeking or risk-averse behaviour in global markets. While applicable to any instrument on TradingView, the indicator is particularly effective for cryptocurrency markets due to their historical sensitivity to equity volatility, liquidity cycles, and macroeconomic shifts.
📊 Components Included in the Index
Below is an overview of the internal factors used to compute the final score. Each item is independently transformed into a 0–100 range before aggregation.
1. S&P 500 Price Deviation (SPX 125-Day Distance)
Measures how far the S&P 500 is trading above or below its 125-day moving average.
Large positive deviations generally reflect elevated risk-taking, while negative deviations suggest conservative market posture.
2. 52-Week Range Position (NYSE Composite)
Evaluates the NYSE Composite’s distance from its annual high/low range.
A higher relative position indicates greater market confidence, whereas lower values capture prolonged weakness or systemic stress.
3. Advance/Decline Momentum (ADVN vs. DECN)
Applies smoothing to the net difference between advancing and declining issues.
This highlights internal market participation, breadth conditions, and the balance between accumulation and distribution phases.
4. Put/Call Ratio Pressure (PCC)
Uses a smoothed version of the equity put/call ratio.
A higher put/call ratio (inverted here) reflects risk aversion, while lower ratios align with speculative environments.
5. VIX Relative Position (VIX vs. 50-Day Average)
Compares the current VIX value to its 50-day moving average.
VIX above its mean implies elevated volatility and fear; values below suggest calmer conditions and stronger risk appetite.
6. Equity vs. Treasury Performance (SPX vs. US10Y)
Contrasts 20-day returns of equities and U.S. 10-year bonds.
Strong equity performance relative to treasuries is normally associated with risk-on flows, while the opposite reflects defensive positioning.
7. High-Yield Spread (JNK vs. US10Y)
Tracks the yield differential between high-yield bonds and U.S. Treasury rates.
A wider spread captures stress in credit markets; a narrower spread indicates improved confidence.
🧮 Composite Calculation
The indicator computes each component independently, normalizes the values into a 0–100 scale using a consistent methodology, and then calculates the simple average.
This ensures transparency and avoids hidden weighting schemes or model bias.
The final index is plotted as a continuous line with adaptive coloring based on its current level, visually highlighting shifts between fear-dominant and greed-dominant market states.
📈 Suggested Usage
The indicator can be applied to any tradable asset, but it tends to be especially informative for:
Cryptocurrencies, due to their pronounced reaction to global liquidity and risk sentiment.
High-beta stocks, which often mirror broader volatility cycles.
Macro-focused analysis, where risk-on/risk-off transitions impact multiple asset classes simultaneously.
This tool is intended as a contextual framework rather than a standalone signal generator. Market participants may use it to contextualize regime changes, identify extremes, or complement existing technical strategies.
📏 Fear & Greed Levels Included in the Indicator
These levels are plotted with dedicated labels and tooltips to offer additional visual clarity:
Level Interpretation
0 – “Holy 💩” Extreme market stress; structural capitulation environment.
20 – “Who Sells the DIP?” Strong fear signal; frequently aligns with oversold conditions.
40 – “C’mon Wake UP!” Cautious or bearish environment; transitional zone.
60 – “So What?” Neutral risk environment; consolidation or equilibrium.
80 – “To the MOON!” Elevated risk appetite; momentum-driven phases.
100 – “Sell the MOM!” Peak optimism; historically associated with overheated conditions.
These thresholds do not provide direct buy/sell instructions; they are reference bands designed to help illustrate the structural context of market behavior.
📌 Why This Indicator Is Uniquely Updated
Uses 7 fully technical components
Zero survey sentiment
Zero social media data
Zero alternative datasets or search trend metrics
Fully transparent, fully reproducible, and based only on market-derived inputs
Built on Pine Script® v6, aligned with modern TradingView standards
Does not rely on proprietary or black-box scoring systems
This positions the CCT Fear & Greed Sincere as one of the most technically grounded and transparent fear/greed-style indicators available using only TradingView-native data.
AUD/USD Optimized Sentiment Pro By Revan BlezinskyAUD/USD Global Sentiment Pro is an advanced trading indicator that combines both technical and fundamental analysis to provide comprehensive sentiment signals for the AUD/USD currency pair.
Key Features:
Multi-Timeframe Analysis: Utilizes daily data from key financial instruments including DXY (US Dollar Index), XAU/USD (Gold), CNY/USD (Chinese Yuan), SPX (S&P 500 Index), and AUD/CAD for a holistic view.
Dynamic Scoring System:
Fundamental Score: Weighted changes in DXY, Gold, CNY, SPX, and AUD/CAD.
Technical Score: Based on EMA crossovers (13, 48, 89), RSI with dynamic levels, and trend direction.
Momentum Confirmation: MACD for additional momentum insight.
Adaptive Thresholds: Uses moving average and standard deviation of the total score to generate dynamic buy/sell thresholds.
Risk Management: Includes ATR-based stop loss and take profit levels, and limits the number of signals per day to avoid overtrading.
Advanced Filtering:
Volume spike detection
Volatility filter (high/low/normal)
Trend filter (using 89 EMA)
Parameters:
EMA Lengths: Fast (13), Slow (48), Trend (89)
RSI Length: 14
Dynamic Lookback: 55 periods
Risk/Reward Ratio: 1.5
Max Signals Per Day: 3
Signals:
Bullish: Total score above dynamic threshold and above zero, with trend and volume confirmation.
Bearish: Total score below dynamic threshold and below zero, with trend and volume confirmation.
This indicator is designed for traders who want to incorporate both technical and fundamental factors into their trading decisions, providing a systematic approach to trading the AUD/USD pair.

Advanced Psychological Levels with Dynamic Spacing═══════════════════════════════════════
ADVANCED PSYCHOLOGICAL LEVELS WITH DYNAMIC SPACING
═══════════════════════════════════════
A comprehensive psychological price level indicator that automatically identifies and displays round number levels across multiple timeframes. Features dynamic ATR-based spacing, smart crypto detection, distance tracking, and customizable alert system.
───────────────────────────────────────
WHAT THIS INDICATOR DOES
───────────────────────────────────────
This indicator automatically draws psychological price levels (round numbers) that often act as support and resistance:
- Dynamic ATR-Based Spacing - Adapts level spacing to market volatility
- Multiple Level Types - Major (250 pip), Standard (100 pip), Mid, and Intraday levels
- Smart Asset Detection - Automatically adjusts for Forex, Crypto, Indices, and CFDs
- Crypto Price Adaptation - Intelligent level spacing based on cryptocurrency price magnitude
- Distance Information Table - Real-time percentage distance to nearest levels
- Combined Level Labels - Clear identification when multiple level types coincide
- Performance Optimized - Configurable visible range and label limits
- Comprehensive Alerts - Notifications when price crosses any level type
───────────────────────────────────────
HOW IT WORKS
───────────────────────────────────────
PSYCHOLOGICAL LEVELS CONCEPT:
Psychological levels are round numbers where traders tend to place orders, creating natural support and resistance zones. These include:
- Forex: 1.0000, 1.0100, 1.0050 (pips)
- Crypto: $100, $1,000, $10,000 (whole numbers)
- Indices: 10,000, 10,500, 11,000 (points)
Why They Matter:
- Traders naturally gravitate to round numbers
- Stop losses cluster at these levels
- Take profit orders concentrate here
- Institutional algorithmic trading often targets these levels
DYNAMIC ATR-BASED SPACING:
Traditional Method:
- Fixed spacing regardless of volatility
- May be too tight in volatile markets
- May be too wide in quiet markets
Dynamic Method (Recommended):
- Uses ATR (Average True Range) to measure volatility
- Automatically adjusts level spacing
- Tighter levels in low volatility
- Wider levels in high volatility
Calculation:
1. Calculate ATR over specified period (default: 14)
2. Multiply by ATR multiplier (default: 2.0)
3. Round to nearest psychological level
4. Generate levels at dynamic intervals
Benefits:
- Adapts to market conditions
- More relevant levels in all volatility regimes
- Reduces clutter in trending markets
- Provides more detail in ranging markets
LEVEL TYPES:
Major Levels (250 pip/point):
- Highest significance
- Primary support/resistance zones
- Color: Red (default)
- Style: Solid lines
- Spacing: 2.5x standard step
Standard Levels (100 pip/point):
- Secondary importance
- Common psychological barriers
- Color: Blue (default)
- Style: Dashed lines
- Spacing: Standard step
Mid Levels (50% between major):
- Optional intermediate levels
- Halfway between major levels
- Color: Gray (default)
- Style: Dotted lines
- Usage: Additional confluence points
Intraday Levels (sub-100 pip):
- For intraday traders
- Fine-grained precision
- Color: Yellow (default)
- Style: Dotted lines
- Only shown on intraday timeframes
SMART ASSET DETECTION:
Forex Pairs:
- Detects major currency pairs automatically
- Uses pip-based calculations
- Standard: 100 pips (0.0100)
- Major: 250 pips (0.0250)
- Intraday: 20, 50, 80 pip subdivisions
Cryptocurrencies:
- Automatic price magnitude detection
- Adaptive spacing based on price:
* Under $0.10: Levels at $0.01, $0.05
* $0.10-$1: Levels at $0.10, $0.50
* $1-$10: Levels at $1, $5
* $10-$100: Levels at $10, $50
* $100-$1,000: Levels at $100, $500
* $1,000-$10,000: Levels at $1,000, $5,000
* Over $10,000: Levels at $5,000, $10,000
Indices & CFDs:
- Fixed point-based system
- Major: 500 point intervals (with 250 sub-levels)
- Standard: 100 point intervals
- Suitable for stock indices like SPX, NASDAQ
COMBINED LEVEL LABELS:
When multiple level types coincide at the same price:
- Single line drawn (highest priority color)
- Combined label shows all types
- Priority: Major > Standard > Mid > Intraday
Example Label Formats:
- "1.1000 Major" - Major level only
- "1.1000 Std + Major" - Both standard and major
- "50000 Intra + Mid + Std" - Three levels coincide
Benefits:
- Cleaner chart appearance
- Clear identification of confluence
- Reduced visual clutter
- Easy to spot high-importance levels
DISTANCE INFORMATION TABLE:
Real-time tracking of nearest levels:
Table Contents:
- Nearest major level above (price and % distance)
- Nearest standard level above (price and % distance)
- Nearest standard level below (price and % distance)
Display:
- Top right corner (configurable)
- Color-coded by level type
- Real-time percentage calculations
- Helpful for position management
Usage:
- Identify proximity to key levels
- Set realistic profit targets
- Gauge potential move magnitude
- Monitor approaching resistance/support
ALERT SYSTEM:
Comprehensive crossing alerts:
Alert Types:
- Major Level Crosses
- Standard Level Crosses
- Intraday Level Crosses
Alert Modes:
- First Cross Only: Alert once when level is crossed
- All Crosses: Alert every time level is crossed
Alert Information:
- Level type crossed
- Specific price level
- Direction (above/below)
- One alert per bar to prevent spam
Configuration:
- Enable/disable by level type
- Choose alert frequency
- Customize for your trading style
───────────────────────────────────────
HOW TO USE
───────────────────────────────────────
INITIAL SETUP:
General Settings:
1. Enable "Use Dynamic ATR-Based Spacing" (recommended)
2. Set ATR Period (14 is standard)
3. Adjust ATR Multiplier (2.0 is balanced)
Visibility Settings:
1. Set Visible Range % (10% recommended for clarity)
2. Adjust Label Offset for readability
3. Configure performance limits if needed
Level Selection:
1. Enable/disable level types based on trading style
2. Adjust line counts for each type
3. Choose line styles and colors for visibility
TRADING STRATEGIES:
Breakout Trading:
1. Wait for price to approach major or standard level
2. Monitor for consolidation near level
3. Enter on confirmed break above/beyond level
4. Stop loss just beyond the broken level
5. Target: Next major or standard level
Rejection Trading:
1. Identify major psychological level
2. Wait for price to test the level
3. Look for rejection signals (wicks, bearish/bullish candles)
4. Enter in direction of rejection
5. Stop beyond the level
6. Target: Previous level or mid-level
Range Trading:
1. Identify range between two major levels
2. Buy at lower psychological level
3. Sell at upper psychological level
4. Use standard and mid-levels for position management
5. Exit if major level breaks with volume
Confluence Trading:
1. Look for combined levels (Std + Major)
2. These represent high-probability zones
3. Use as primary support/resistance
4. Increase position size at confluence
5. Expect stronger reactions at these levels
Session-Based Trading:
1. Note opening level at session start (Asian/London/NY)
2. Trade breakouts of major levels during high-volume sessions
3. London/NY sessions: More likely to break levels
4. Asian session: More likely to respect levels (range trading)
RISK MANAGEMENT WITH PSYCHOLOGICAL LEVELS:
Stop Loss Placement:
- Place stops just beyond psychological levels
- Add buffer (5-10 pips for forex)
- Avoid exact round numbers (stop hunting risk)
- Use previous major level as maximum stop
Take Profit Strategy:
- First target: Next standard level (partial profit)
- Second target: Next major level (remaining position)
- Trail stops to breakeven at first target
- Use distance table to calculate risk/reward
Position Sizing:
- Larger positions at major levels (higher probability)
- Smaller positions at intraday levels (lower probability)
- Scale in at standard levels between major levels
- Reduce size when multiple levels are close together
TIMEFRAME CONSIDERATIONS:
Higher Timeframes (4H, Daily, Weekly):
- Focus on Major and Standard levels only
- Disable Intraday and Mid levels
- Wider level spacing expected
- Use for swing trading and position trading
Lower Timeframes (5m, 15m, 1H):
- Enable all level types
- Use Intraday levels for precision
- Tighter level spacing acceptable
- Good for day trading and scalping
Multi-Timeframe Approach:
- Identify major levels on Daily/4H charts
- Refine entries using 15m/1H intraday levels
- Trade in direction of higher timeframe bias
- Use lower timeframe levels for position management
───────────────────────────────────────
CONFIGURATION GUIDE
───────────────────────────────────────
GENERAL SETTINGS:
Dynamic ATR-Based Spacing:
- Enabled: Recommended for most markets
- Disabled: Fixed psychological levels
- ATR Period: 14 (standard), 10 (responsive), 20 (smooth)
- ATR Multiplier: 1.0-5.0 (2.0 is balanced)
VISIBILITY SETTINGS:
Visible Range %:
- 5%: Very tight range, minimal clutter
- 10%: Balanced view (recommended)
- 20%: Wide range, more context
- 50%: Maximum range, all levels visible
Label Offset:
- 10-20 bars: Close to current price
- 30-50 bars: Moderate distance
- 50-100 bars: Far from price action
Performance Limits:
- Max Historical Bars: Reduce if indicator loads slowly
- Max Labels: Reduce for cleaner chart (20-30 recommended)
LEVEL CUSTOMIZATION:
Line Count:
- Lower (1-3): Cleaner chart, fewer levels
- Medium (4-6): Balanced view
- Higher (7-10): More context, busier chart
Line Styles:
- Solid: High importance, easy to see
- Dashed: Medium importance, clear but subtle
- Dotted: Low importance, minimal visual weight
Colors:
- Use contrasting colors for different level types
- Red/Blue/Yellow default works well
- Adjust based on chart background and personal preference
DISTANCE TABLE:
Position:
- Top Right: Doesn't interfere with price action
- Top Left: Good for right-side price scale
- Bottom positions: Less common but available
Colors:
- Default (white text, dark background) works for most charts
- Match your chart theme for consistency
- Ensure text is readable against background
ALERT CONFIGURATION:
Alert by Level Type:
- Major: Most important, fewer false signals
- Standard: Balance of frequency and importance
- Intraday: Many signals, best for active traders
Alert Frequency:
- First Cross Only: Cleaner, less noise (recommended for swing trading)
- All Crosses: Every touch, good for scalping
Alert Setup in TradingView:
1. Configure desired alert types in indicator settings
2. Right-click chart → Add Alert
3. Select this indicator
4. Choose "Any alert() function call"
5. Set delivery method (mobile, email, webhook)
───────────────────────────────────────
ASSET-SPECIFIC TIPS
───────────────────────────────────────
FOREX (EUR/USD, GBP/USD, etc.):
- Major levels at x.x000, x.x500
- Standard levels at x.xx00
- Intraday levels at 20/50/80 pips
- Most effective during London/NY sessions
- Watch for "figure" levels (1.0000, 1.1000)
CRYPTOCURRENCIES (BTC, ETH, etc.):
- Enable dynamic spacing for volatile markets
- Levels adjust automatically based on price
- Watch major $1,000 increments for BTC
- $100 levels important for ETH
- Smaller caps: Use standard levels
- High volatility: Increase ATR multiplier to 3.0
STOCK INDICES (SPX, NASDAQ, etc.):
- 100-point levels most important
- 500-point levels for major S/R
- 50-point mid-levels for refinement
- Watch end-of-day for level reactions
- Futures often lead spot on level breaks
GOLD/COMMODITIES:
- Major levels at $50 increments ($1,900, $1,950)
- Standard levels at $10 increments
- Very reactive to psychological levels
- Watch for false breaks during low volume
- Best reactions during active trading hours
───────────────────────────────────────
BEST PRACTICES
───────────────────────────────────────
Chart Setup:
- Use clean price action charts
- Avoid too many indicators
- Ensure psychological levels are clearly visible
- Match colors to your chart theme
Level Selection:
- Start with Major and Standard levels only
- Add Mid and Intraday as needed
- Less is more - avoid chart clutter
- Adjust based on timeframe
Combining with Other Tools:
- Volume profile for confluence
- Trendlines intersecting psychological levels
- Moving averages near round numbers
- Fibonacci levels coinciding with psychological levels
Common Mistakes to Avoid:
- Trading every level touch (be selective)
- Ignoring volume confirmation
- Setting stops exactly at levels (stop hunting)
- Forgetting to adjust for different assets
- Over-relying on levels without price action confirmation
Performance Optimization:
- Reduce visible range for faster loading
- Lower max historical bars on lower timeframes
- Limit labels to 30-50 for clarity
- Disable unused level types
───────────────────────────────────────
EDUCATIONAL DISCLAIMER
───────────────────────────────────────
This indicator identifies psychological price levels based on round numbers that tend to act as support and resistance. The methodology includes:
- Round number detection algorithms
- ATR-based dynamic spacing calculations
- Asset-specific level determination
- Distance percentage calculations
Psychological levels are a recognized concept in technical analysis, studied by traders and institutions. However, they do not guarantee price reactions and should be used as part of a comprehensive trading strategy including proper risk management, volume analysis, and price action confirmation.
───────────────────────────────────────
USAGE DISCLAIMER
───────────────────────────────────────
This tool is for educational and analytical purposes. Psychological levels can act as support or resistance but price reactions are not guaranteed. Dynamic spacing may generate different levels in different market conditions. Always conduct independent analysis, use proper risk management, and never risk capital you cannot afford to lose. Past performance does not indicate future results.
───────────────────────────────────────
CREDITS & ATTRIBUTION
───────────────────────────────────────
Original Concept: Sonar Lab

Flux AI PullBack System (Hybrid Pro)Flux AI PullBack System (Hybrid Pro)
//Session-Aware | Adaptive Confluence | Grace Confirm Logic//
Overview:
The Flux AI PullBack System (Hybrid Pro v5) is an adaptive, session-aware pullback indicator designed to identify high-probability continuation setups within trending markets. It automatically adjusts between “Classic” and “Enhanced” logic modes based on volatility, volume, and ATR slope, allowing it to perform seamlessly across different market sessions (Asian, London, and New York).
Core Features:
Hybrid Auto Mode — Dynamically switches between Classic (fast-moving) and Enhanced (strict) modes.
Session-Aware Context — Optimized for intraday trading in ES, NQ, and SPY.
Grace Confirmation Logic — Validates pullbacks with a follow-through condition to reduce noise.
Adaptive EMA Zone (38/62) — Highlights pullback areas with dynamic aqua fill and transparency linked to trend strength.
Noise Suppression Filter — Prevents false pullbacks during EMA crossovers or unstable transitions.
Weighted Confluence Model — Combines trend, ATR, volume, and swing structure for confirmation strength.
Pine v6 Compliant Alerts — Constant-string safe, ready for webhooks and automation.
Visual Elements:
Aqua EMA Zone: Displays the “breathing” pullback band (tightens during volatility spikes).
PB↑ / PB↓ Markers: Confirmed pullbacks with subtle transparency and fixed label size.
Bar Highlights: Yellow for pullbacks; ice-blue for confirmed continuation.
Use Cases
Perfect for:
Intraday trend traders
0DTE SPX / ES scalpers
Futures traders (NQ, MNQ, MES)
Algorithmic strategy builders using webhooks
Recommended Timeframes:
1–15 minute charts (scalping / intraday)
Higher timeframes for swing confirmations.
Attribution:
This open-source script was inspired by Chris Moody’s “CM Slingshot System” and JustUncleL’s Pullback Tools, but it was built from scratch using AI-assisted code refinement (ChatGPT).
All logic and enhancements are original, not derived from proprietary software.
License: MIT (Open Source)
© 2025 Ken Anderson — You may modify, use, or redistribute with credit.
Keywords:
Pullback, Reversal, AI Trading, EMA Zone, Session Aware, Futures Trading, SPX, ES, NQ, ATR Filter, Volume Confirmation, Flux System, Pine Script v6, Non-Repainting, Adaptive Trading Indicator.

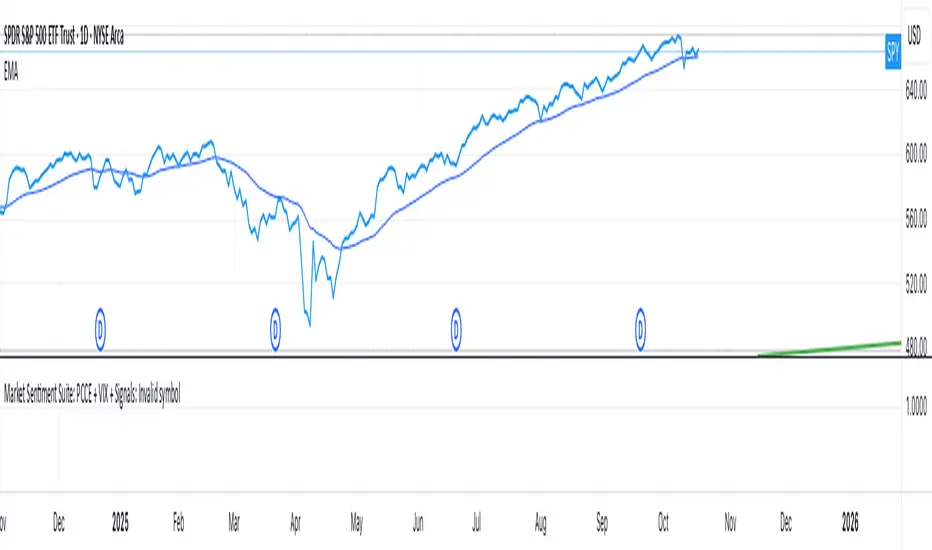
Market Sentiment Suite: PCCE + VIX + Signals📊 Market Sentiment Suite: PCCE + VIX + Signals
Identify fear, greed, and turning points in the market.
This script combines the CBOE Put/Call Ratio (PCCE) with the VIX volatility index percentile to visualize crowd sentiment and highlight potential market tops and bottoms.
🔍 Key Features
Dual-indicator design: PCCE + normalized VIX percentile
Color-coded zones for Greed (<0.6) and Fear (>1.2)
Automatic alert signals when sentiment reaches extremes
Live sentiment table displaying real-time PCCE and VIX data
Works seamlessly on SPX, SPY, QQQ, or any major index
🧠 How to Use
When PCCE > 1.2 and VIX percentile > 80%, fear is extreme → possible market bottom
When PCCE < 0.6 and VIX percentile < 20%, greed is extreme → possible market top
Perfect for contrarian traders, sentiment analysts, and swing traders
✨ Best Timeframe: Daily
⚙️ Markets: SPX / SPY / QQQ / Global Indexes
📈 Type: Contrarian Sentiment Indicator
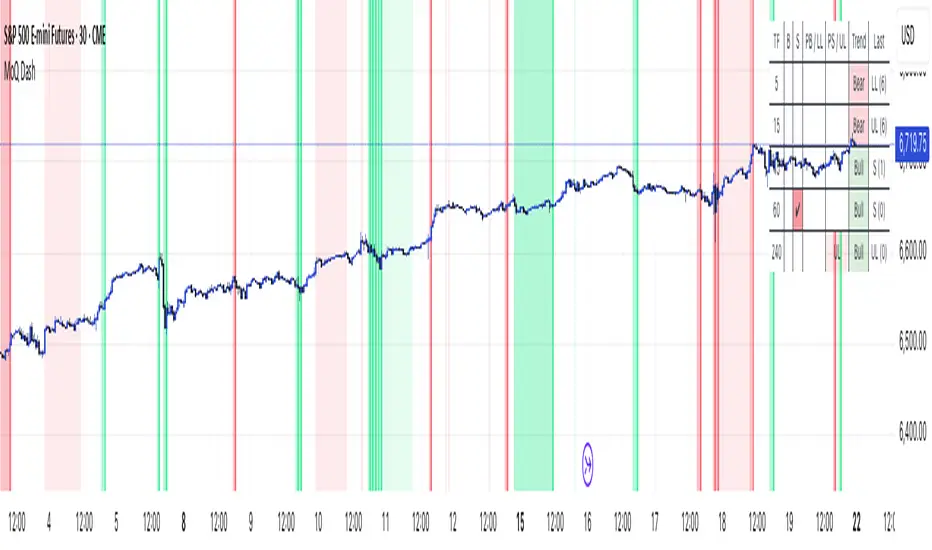
MomentumQ DashMomentumQ Dash – Multi-Timeframe & Watchlist Dashboard
The MomentumQ Dash is a professional dashboard-style indicator designed to help traders quickly evaluate market conditions across multiple timeframes and assets.
Unlike single-signal tools, MomentumQ Dash consolidates market regime, buy/sell conditions, and pre-signal alerts into an easy-to-read table, allowing traders to stay focused on actionable setups without flipping between charts.
All signals displayed in MomentumQ Dash are derived from the MomentumQ Oscillator (MoQ Osci) , our proprietary tool designed to identify momentum shifts and adaptive buy/sell conditions. By integrating these signals into a dashboard format, MomentumQ Dash provides a structured overview of the market that is both comprehensive and easy to interpret.
A unique advantage of this tool is the dual-table system:
A timeframe table that tracks the current symbol across five user-defined timeframes.
A watchlist table that monitors up to five different assets on the same timeframe.
This combination gives traders a complete market overview at a glance, supporting both intraday and higher-timeframe strategies.
Key Features
1. Multi-Timeframe Signal Dashboard
Tracks buy, sell, pre-buy, and pre-sell conditions for up to 5 configurable timeframes.
Highlights market regime (Bull/Bear) with background colors for quick visual recognition.
Displays the last detected signal and how many bars ago it occurred.
2. Watchlist Asset Table
Monitor up to 5 custom symbols (e.g., indices, commodities, crypto pairs) in one view.
Independent timeframe selection for the watchlist table.
Clean symbol display with exchange prefixes automatically removed.
3. Flexible Layout & Theme Integration
Choice of table position (Top Right, Middle Right, Bottom Right) for each table.
Light/Dark mode setting for seamless chart integration.
Compact, minimal design to avoid clutter.
4. MoQ Osci Signal Engine
Signals are powered by the MomentumQ Oscillator (MoQ Osci), which uses adaptive momentum analysis.
Identifies early pre-signals (potential setup zones) as well as confirmed buy/sell events.
Helps traders recognize transitions in market structure without lagging indicators.
How It Works
Timeframe Analysis
The indicator calculates MoQ Osci signals on each timeframe.
When price deviates beyond upper/lower adaptive thresholds, buy/sell signals are generated.
Pre-signals are displayed when price approaches these zones, offering early alerts.
Trend Regime Detection
Regime is derived from MoQ Osci’s momentum distance relative to its adaptive mean.
Bull regime = positive momentum bias; Bear regime = negative momentum bias.
This provides a simple but reliable context for trade direction.
Watchlist Tracking
Signals are calculated identically for each custom symbol selected by the user.
Results are presented in a compact table, making it easy to spot alignment or divergence across markets.
How to Use This Indicator
Use the Timeframe Table to align intraday setups with higher-timeframe context.
Monitor the Watchlist Table to track correlated assets (e.g., SPX, NDX, VIX, Oil, Gold).
Pay attention to pre-buy / pre-sell warnings for early setup confirmation.
Use the “Last” column to quickly check the most recent signal and its timing.
Combine with your existing price action strategy to validate entries and exits.
This indicator works on all TradingView markets: Forex, Stocks, Crypto, Futures, and Commodities.
Why Is This Indicator Valuable?
Provides a complete dashboard view of market conditions in one place.
Combines multi-timeframe confirmation with multi-asset monitoring .
Signals are based on the proven MoQ Osci tool , ensuring consistency across strategies.
Saves time and reduces the need to constantly switch charts.
Fully customizable to match any trading workflow.
Example Trading Approaches
1. Multi-Timeframe Alignment
Wait for a buy signal on the lower timeframe (e.g., 15m) while the higher timeframe (1h/4h) is in Bull regime.
Enter long with higher-timeframe confirmation, improving trade probability.
2. Cross-Market Confirmation
If SPX and NDX both trigger sell signals while VIX shows a buy, this may confirm risk-off sentiment.
Use this confluence to support trade decisions in equities or correlated markets.
3. Pre-Signal Monitoring
Watch for PB (Pre-Buy) or PS (Pre-Sell) warnings before confirmed signals.
These can highlight potential breakout or reversal zones before they occur.
Disclaimer
This indicator is a technical analysis tool and does not guarantee profits.
It should be used as part of a complete trading plan that includes risk management.
Past performance is not indicative of future results.
VIX Stoch RSI Oscillator [HUD Box + Compression]vix stoch rsi Oscillator
watch volatility without switching charts,
gives signal based off fib levels 0-100 / volatility,
emoji box to show signal,
HUD Box: emoji-coded tactical feedback
bounce 100 "💥 Expansion" :
bounce 0.8 "🔴 Overbought" :
bounce 0.618 "📉 Distribution" :
bounce 0.5 "🧠 Midline" :
bounce 0.382 "📈 Accumulation" :
bounce 0.2 "🟢 Oversold" :
bounce0.0 "💣 Expansion" : "⚪ Neutral"
Tiger EMA/STOCH
This logic checks if the oscillator is trending above or below its 48-period EMA,
If above, it paints the line GREEN🟢 (bullish),
If below, it paints it RED🔴 (bearish),
If compression is active, it overrides both with purple🟣 to highlight tactical squeeze conditions,
⚠️WARNING⚠️
ALWAYS REMEMBER THIS CHART IS VIX/USD
IN MOST CASES SPY MOVES VICE VERSA
I AM NOT RESPOSIBLE FOR YOUR OWN ACTIONS/TRADE IDEAS
AMEX:USD
TVC:VIX
SP:SPX

NY Session First 15m Range ORB Strategy first 15m high&low NY session
let you know the high and low of first 15m and the first candle is sitck out of the line you can ride on the wave to make moeny no bul OANDA:XAUUSD SP:SPX
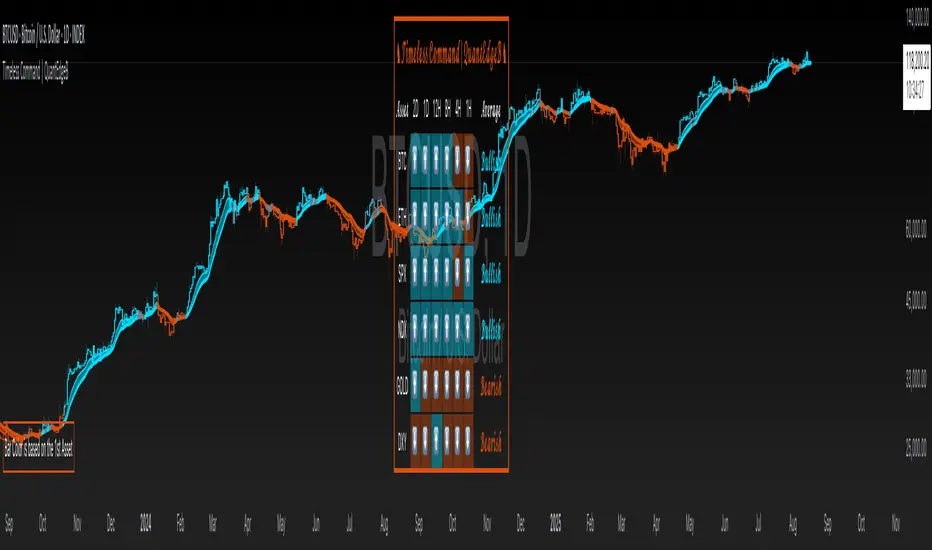
Timeless Command | QuantEdgeB🔍 Overview
Timeless Command is a multi-asset, multi-timeframe “sentiment dashboard” built around a custom Universal Strategy. It fuses two independent proprietary oscillators into one normalized signal, then snapshots that signal across six user-chosen assets and six user-chosen timeframes—right on your price chart. You instantly see whether Bitcoin, Ethereum, Gold, the U.S. Dollar Index, the S&P 500 or the Nasdaq are “Bullish” or “Bearish” from the 2-day down to the 15-minute horizon, plus an overall bias and bar-color overlays.
✨ Key Features
• 🧠 Universal Strategy
o Combines two independent strategic modules into a single oscillator.
o Applies upper/lower thresholds to generate Long/Short/Neutral signals.
• 🌐 Multi-Asset, Multi-TF Grid
o Up to six symbols (e.g. BTC, ETH, SPX, NDX, GOLD, DXY).
o Six configurable timeframes (days, hours, minutes).
o Automatic conversion of “4H” → “240” minutes for seamless request.security calls.
• 📊 Live Sentiment Table
o Arrow icons per asset/timeframe (“⬆️” vs “⬇️”).
o Per-asset average bias (“Bullish” / “Bearish” / “Neutral”), color-coded.
o Clean, right-aligned table overlay with asset labels and timeframe headers.
• 🎨 Chart Overlays
o Bar coloring driven by the first asset’s average TPI bias.
o Two EMAs (default 12/21) filled to show trend direction.
o Optional mini info table to explain bar-color logic.
⚙️ How It Works
1. Signal Calculation
o Applies thresholds (±0.1) to yield discrete signals from a Universal Strategy: +1 (long), –1 (short), 0 (neutral).
2. Multi-TF Signal Gathering
o For each asset, the script uses request.security to pull the TPI on each selected timeframe, locking values at bar close for consistency.
o Converts each reading into a binary direction (up/down).
3. Averaging & Labeling
o Averages the six directional values per asset to gauge overall bias.
o Renders a “Bullish” or “Bearish” label (or “Neutral” if exactly zero).
4. Visual Overlay
o Bar Color: The chart’s candles recolor based on the first asset’s average bias—blue for bullish, orange for bearish, gray for neutral.
o EMAs: Two exponential moving averages sweep the chart, filled to highlight trending regimes.
5. Dashboard Table
o Rows = assets, columns = timeframes + “Average” column.
o Each cell shows an arrow icon with background shading.
o Last column spells out the per-asset average bias in styled text and color.
🎯 Who Should Use It
• Macro Traders who want a quick cross-market heatmap.
• Multi-Asset Strategists balancing exposure across crypto, equities, FX and commodities.
• Systematic & Discretionary players looking for unified, threshold-based signals.
• Risk Managers needing a real-time sentinel on regime shifts across key markets.
⚙️ Default Settings
• Assets: BTCUSD, ETHUSD, SPX, NDX, GOLD, DXY
• Timeframes: 2D, 1D, 12H, 4H, 1H, 15m
• Thresholds: ±0.1 for long/short entries
📌 Conclusion
With Timeless Command, you gain an at-a-glance “command center” for cross-market sentiment. It turns complex, multi-TF oscillator data into a simple arrow-and-table view, coloring your price bars to reinforce the prevailing bias. Whether you’re hunting trend continuations, regime changes or mean-reversion setups, this overlay gives you the high-level context you need—without digging through six different charts.
🔹 Disclaimer: Past performance is not indicative of future results. No trading strategy can guarantee success in financial markets.
🔹 Strategic Advice: Always backtest, optimize, and align parameters with your trading objectives and risk tolerance before live trading.
Fear and Greed Indicator [DunesIsland]The Fear and Greed Indicator is a TradingView indicator that measures market sentiment using five metrics. It displays:
Tiny green circles below candles when the market is in "Extreme Fear" (index ≤ 25), signalling potential buys.
Tiny red circles above candles when the market is in "Greed" (index > 75), indicating potential sells.
Purpose: Helps traders spot market extremes for contrarian trading opportunities.Components (each weighted 20%):
Market Momentum: S&P 500 (SPX) vs. its 125-day SMA, normalized over 252 days.
Stock Price Strength: Net NYSE 52-week highs (INDEX:HIGN) minus lows (INDEX:LOWN), normalized.
Put/Call Ratio: 5-day SMA of Put/Call Ratio (USI:PC).
Market Volatility: VIX (VIX), inverted and normalized.
Stochastic RSI: 14-period RSI on SPX with 3-period Stochastic SMA.
Alerts:
Buy: Index ≤ 25 ("Extreme Fear - Potential Buy").
Sell: Index > 75 ("Greed - Potential Sell").
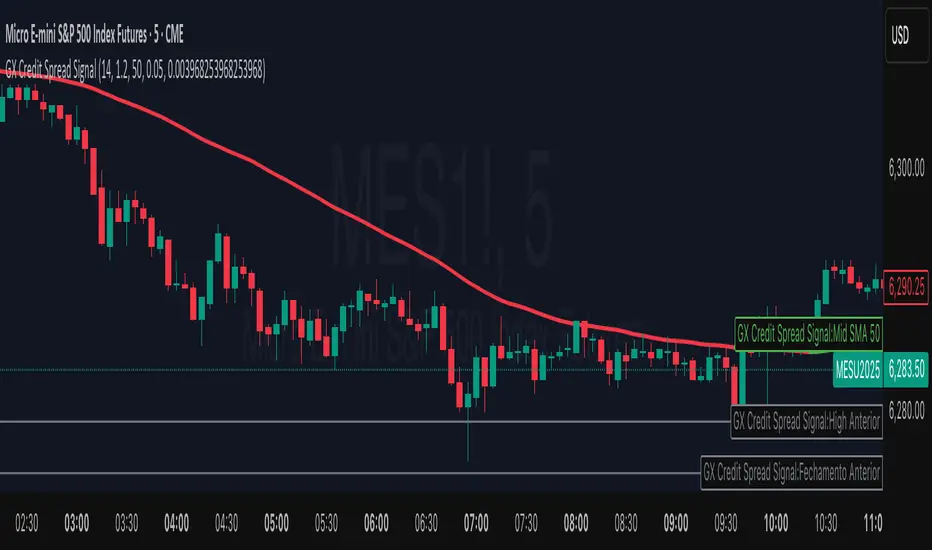
GX Credit Spread SignalThe GX Credit Spread Signal is an advanced indicator designed for traders who trade options strategies on the SPX index, especially using vertical credit spreads. It combines traditional technical analysis with volatility and option pricing concepts to provide relevant signals and projections on the chart.
Main features:
Trend analysis: Uses opening gap, position relative to VWAP and simple moving average (SMA 50) to indicate bullish or bearish bias right after the first 15-minute candle.
Safe range projection: Calculates a range based on the ATR (Average True Range) multiplied by a safety factor, suggesting potential strikes for credit spreads.
Quantitative estimates:
Calculates the estimated delta of options via the Black-Scholes formula approximation.
Estimated probability of expiring out of the money (OTM).
Chart visualizations: Displays projected ATR lines, previous day's levels (high, low, close) and an informative panel with strikes, delta, OTM probability, ATR and VWAP data.
Configurable alerts: Notifications for detected bullish or bearish bias, helping the trader to identify opportunities quickly.
This indicator is ideal for those who day trade with SPX options, facilitating decision-making by combining technical analysis, volatility and option probabilities in one place.
Intraday & Annual CAPM AlphaIntraday & Annual CAPM Alpha
This TradingView™ Pine v6 indicator computes and plots a stock’s CAPM α (alpha) on both intraday and daily/annualized timeframes, allowing you to monitor relative performance against a chosen benchmark (e.g. SPX, NDX).
⸻
Key Outputs
1. Intraday α per Bar (blue line)
• Calculates α from a rolling-window linear regression of the last N bars’ returns (default 60).
• Expressed as “extra return per bar” vs. the benchmark.
2. Intraday α Daily-Equivalent (stepped blue line)
• Scales the per-bar α to a full trading day (390 minutes), showing “if this pace held all day, outperformance (%)”.
3. Annualized α (yellow line)
• Performs the same CAPM regression on daily returns over a D-day lookback (default 252), then annualizes α by multiplying by 252.
• Indicates longer-term relative strength/weakness vs. the benchmark.
⸻
Inputs
• Benchmark Symbol: Choose any index or ETF (e.g. “SPX”, “NDX”).
• Intraday Lookback Bars: Number of bars for intraday α regression (default 60).
• Daily Lookback Days: Number of trading days for daily CAPM regression (default 252).
• Use Log Returns?: Toggle between arithmetic vs. log returns.
⸻
How to Use
• Short-Term Signals:
• Watch the blue α/bar line on 1–15 min charts. A cross from negative to positive suggests intraday outperformance; a reversal warns of weakening momentum.
• The blue daily-equivalent α gives a smoother view—e.g. > +1% signals strong intraday bias, < –1% signals underperformance.
• Long-Term Trends:
• On daily charts, focus on the yellow annualized α. A sustained positive α implies this stock has historically beaten the benchmark; sustained negative α implies the opposite.
• Combining Timeframes:
• Use intraday α for timing entries/exits within the session, and annualized α to confirm whether you want a bullish or bearish bias over days to weeks.
⸻
Install & Configure
1. Copy the Pine v6 script into the TradingView Pine Editor.
2. Set your favorite benchmark, lookback periods, and returns type.
3. Add to your chart to start visualizing real-time CAPM α signals!
Feel free to adjust the lookback windows and threshold levels to suit your trading style.

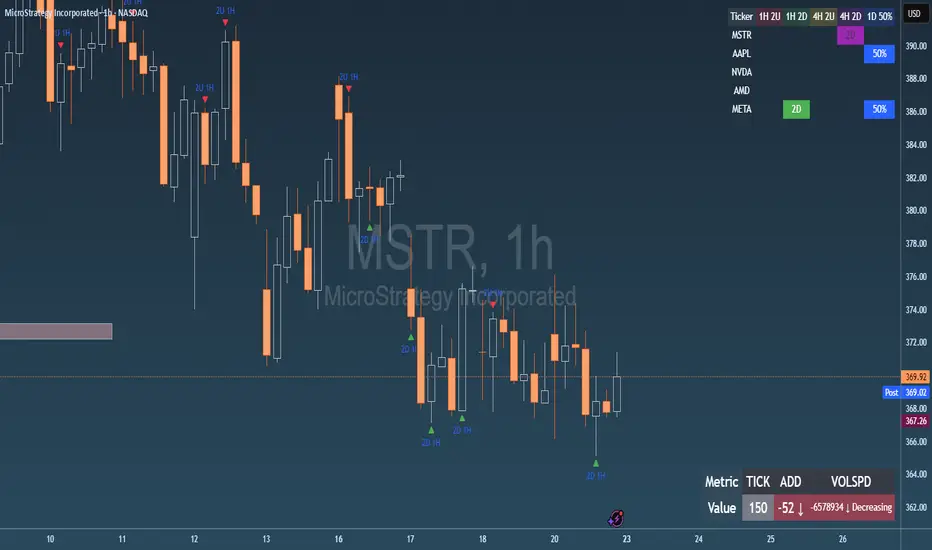
Failed 2U/2D + 50% Retrace Scanner📈 Multi-Ticker Failed 2U/2D Scanner with Daily Retrace & Market Breadth Table
This TradingView indicator is a multi-symbol price action scanner designed to catch high-probability reversal signals using The Strat’s failed 2U/2D patterns and daily 50% retrace logic, while also displaying market breadth metrics ( USI:TICK and USI:ADD ) for context.
Monitored Symbols:
SPY, SPX, QQQ, IWM, NVDA, AMD, AAPL, META, MSTR
🔍 Detection Logic
1. Failed 2U / Failed 2D Setups
Failed 2U: Price breaks above the previous candle’s high but closes back below the open → Bearish reversal
Failed 2D: Price breaks below the previous candle’s low but closes back above the open → Bullish reversal
Timeframes Monitored:
🕐 1-Hour (1H)
⏰ 4-Hour (4H)
2. Daily 50% Candle Retrace
Checks if price has retraced 50% or more of the previous day’s candle body
Highlights potential trend exhaustion or reversal confluence
3. Market Breadth Metrics (Display Only)
USI:TICK : Measures real-time NYSE up vs. down ticks
USI:ADD : Advance-Decline Line (net advancing stocks)
Not used in signal logic — just displayed in the table for overall market context
🖼️ Visual Elements
✅ Chart Markers
🔺 Red/Green Arrows for 1H Failed 2U/2D
🟨 Yellow Squares for 4H Failed 2U/2D
Visual markers are plotted directly on the relevant candles
📊 Signal Table
Lists all 9 tickers in rows
Columns for:
1H Signal
4H Signal
Daily 50% Retrace
USI:TICK Value
USI:ADD Value
Color-Coded Cells:
🔴 Red = Failed 2U
🟢 Green = Failed 2D
⚠️ Highlight if 50% Daily Retrace condition is true
🟦 Neutral-colored cells for TICK/ADD numeric display
🔔 Alerts
Hardcoded alerts fire when:
A 1H or 4H Failed 2U/2D is detected
The Daily 50% retrace condition is met
Each alert is labeled clearly by symbol and timeframe:
"META 4H Failed 2D"
"AAPL Daily 50% Retrace"
🎯 Use Case
Built for:
Reversal traders using The Strat
Swing or intraday traders watching hourly setups
Traders wanting quick visual context on market breadth without relying on it for confirmation
Monitoring multiple tickers in one clean view
This is scan 2
Add scan 1 for spx, spy, iwm, qqq, aapl
This indicator is not financial advice. Use the alerts to check out chart and when tickers trigger.
StatMetricsLibrary "StatMetrics"
A utility library for common statistical indicators and ratios used in technical analysis.
Includes Z-Score, correlation, PLF, SRI, Sharpe, Sortino, Omega ratios, and normalization tools.
zscore(src, len)
Calculates the Z-score of a series
Parameters:
src (float) : The input price or series (e.g., close)
len (simple int) : The lookback period for mean and standard deviation
Returns: Z-score: number of standard deviations the input is from the mean
corr(x, y, len)
Computes Pearson correlation coefficient between two series
Parameters:
x (float) : First series
y (float) : Second series
len (simple int) : Lookback period
Returns: Correlation coefficient between -1 and 1
plf(src, longLen, shortLen, smoothLen)
Calculates the Price Lag Factor (PLF) as the difference between long and short Z-scores, normalized and smoothed
Parameters:
src (float) : Source series (e.g., close)
longLen (simple int) : Long Z-score period
shortLen (simple int) : Short Z-score period
smoothLen (simple int) : Hull MA smoothing length
Returns: Smoothed and normalized PLF oscillator
sri(signal, len)
Computes the Statistical Reliability Index (SRI) based on trend persistence
Parameters:
signal (float) : A price or signal series (e.g., smoothed PLF)
len (simple int) : Lookback period for smoothing and deviation
Returns: Normalized trend reliability score
sharpe(src, len)
Calculates the Sharpe Ratio over a period
Parameters:
src (float) : Price series (e.g., close)
len (simple int) : Lookback period
Returns: Sharpe ratio value
sortino(src, len)
Calculates the Sortino Ratio over a period, using only downside volatility
Parameters:
src (float) : Price series
len (simple int) : Lookback period
Returns: Sortino ratio value
omega(src, len)
Calculates the Omega Ratio as the ratio of upside to downside return area
Parameters:
src (float) : Price series
len (simple int) : Lookback period
Returns: Omega ratio value
beta(asset, benchmark, len)
Calculates beta coefficient of asset vs benchmark using rolling covariance
Parameters:
asset (float) : Series of the asset (e.g., close)
benchmark (float) : Series of the benchmark (e.g., SPX close)
len (simple int) : Lookback window
Returns: Beta value (slope of linear regression)
alpha(asset, benchmark, len)
Calculates rolling alpha of an asset relative to a benchmark
Parameters:
asset (float) : Series of the asset (e.g., close)
benchmark (float) : Series of the benchmark (e.g., SPX close)
len (simple int) : Lookback window
Returns: Alpha value (excess return not explained by Beta exposure)
skew(x, len)
Computes skewness of a return series
Parameters:
x (float) : Input series (e.g., returns)
len (simple int) : Lookback period
Returns: Skewness value
kurtosis(x, len)
Computes kurtosis of a return series
Parameters:
x (float) : Input series (e.g., returns)
len (simple int) : Lookback period
Returns: Kurtosis value
cv(x, len)
Calculates Coefficient of Variation
Parameters:
x (float) : Input series (e.g., returns or prices)
len (simple int) : Lookback period
Returns: CV value
autocorr(x, len)
Calculates autocorrelation with 1-lag
Parameters:
x (float) : Series to test
len (simple int) : Lookback window
Returns: Autocorrelation at lag 1
stderr(x, len)
Calculates rolling standard error of a series
Parameters:
x (float) : Input series
len (simple int) : Lookback window
Returns: Standard error (std dev / sqrt(n))
info_ratio(asset, benchmark, len)
Calculates the Information Ratio
Parameters:
asset (float) : Asset price series
benchmark (float) : Benchmark price series
len (simple int) : Lookback period
Returns: Information ratio (alpha / tracking error)
tracking_error(asset, benchmark, len)
Measures deviation from benchmark (Tracking Error)
Parameters:
asset (float) : Asset return series
benchmark (float) : Benchmark return series
len (simple int) : Lookback window
Returns: Tracking error value
max_drawdown(x, len)
Computes maximum drawdown over a rolling window
Parameters:
x (float) : Price series
len (simple int) : Lookback window
Returns: Rolling max drawdown percentage (as a negative value)
zscore_signal(z, ob, os)
Converts Z-score into a 3-level signal
Parameters:
z (float) : Z-score series
ob (float) : Overbought threshold
os (float) : Oversold threshold
Returns: -1, 0, or 1 depending on signal state
r_squared(x, y, len)
Calculates rolling R-squared (coefficient of determination)
Parameters:
x (float) : Asset returns
y (float) : Benchmark returns
len (simple int) : Lookback window
Returns: R-squared value (0 to 1)
entropy(x, len)
Approximates Shannon entropy using log returns
Parameters:
x (float) : Price series
len (simple int) : Lookback period
Returns: Approximate entropy
zreversal(z)
Detects Z-score reversals to the mean
Parameters:
z (float) : Z-score series
Returns: +1 on upward reversal, -1 on downward
momentum_rank(x, len)
Calculates relative momentum strength
Parameters:
x (float) : Price series
len (simple int) : Lookback window
Returns: Proportion of lookback where current price is higher
normalize(x, len)
Normalizes a series to a 0–1 range over a period
Parameters:
x (float) : The input series
len (simple int) : Lookback period
Returns: Normalized value between 0 and 1
composite_score(score1, score2, score3)
Combines multiple normalized scores into a composite score
Parameters:
score1 (float)
score2 (float)
score3 (float)
Returns: Average composite score

SectorRotationRadarThe Sector Rotation Radar is a powerful visual analysis tool designed to track the relative strength and momentum of a stock compared to a benchmark index and its associated sector ETF. It helps traders and investors identify where an asset stands within the broader market cycle and spot rotation patterns across sectors and timeframes.
🔧 Key Features:
Benchmark Comparison: Measures the relative performance (strength and momentum) of the current symbol against a chosen benchmark (default: SPX), highlighting over- or underperformance.
Automatic Sector Detection: Automatically links stocks to their relevant sector ETFs (e.g., XLK, XLF, XLU), based on an extensive internal symbol map.
Multi-Timeframe Analysis: Supports simultaneous comparison across the current, next, and even third-higher timeframes (e.g., Daily → Weekly → Monthly), providing a bigger-picture perspective of trend shifts.
Tail Visualization: Displays a "trail" of price behavior over time, visualizing how the asset has moved in terms of relative strength and momentum across a user-defined period.
Quadrant-Based Layout: The chart is divided into four dynamic main zones, each representing a phase in the strength/momentum cycle:
🔄 Improving: Gaining strength and momentum
🚀 Leading: High strength and high momentum — top performers
💤 Weakening: Losing momentum while still strong
🐢 Lagging: Low strength and low momentum — underperformers
Clean Chart Visualization:
Background grid with axis labels
Dynamic tails and data points for each symbol
Option to include the associated sector ETF for context
Descriptive labels showing exact strength/momentum values per point
⚙️ Customization Options:
Benchmark Selector: Choose any symbol to compare against (e.g., SPX, Nasdaq, custom index)
Start Date Control: Option to fix a historical start point or use the current data range
Trail Length: Set the number of previous data points to display
Additional Timeframes: Enable analysis of one or two higher timeframes beyond the current
Sector ETF Display: Toggle to show or hide the related sector ETF alongside the asset
📚 Technical Architecture:
The indicator relies on external modules for:
Statistical modeling
Relative strength and momentum calculations
Chart rendering and label drawing
These components work together to compute and display a dynamic, real-time map of asset performance over time.
🧠 Use Case:
Sector Rotation Radar is ideal for traders looking to:
Spot stocks or sectors rotating into strength or weakness
Confirm alignment across multiple timeframes
Identify sector leaders and laggards
Understand how a symbol is positioned relative to the broader market and its peers
This tool is especially valuable for swing traders, sector rotation strategies, and macro-aware investors who want a visual edge in decision-making.

Base Detector Pro [AletheiaTradeLab]This custom Trading View indicator combines William O’Neal “Base” patterns with several complementary tools—David Ryan’s ANT indicator, key pivot‐based price levels, index and earnings lines, relative strength (RS) line, and moving averages—to help you pinpoint base formations and validate whether each one merits a trade.
1. Bases (William O'Neal)
A “base” is simply a period of price consolidation following a significant run-up. During this phase, a stock moves mostly sideways within a defined trading range, forming clear support and resistance lines.
Key Criteria for a Valid Base
- Prior Uptrend
Before a base begins, the stock should already have a healthy advance—typically at least a 30% gain.
- Shapes of Bases
Bases can form in several distinct geometric patterns, each signaling a different kind of consolidation and potential breakout:
Flat Base
Shape : A horizontal rectangle bounded by nearly parallel support (bottom) and resistance (top) trendlines.
Minimum Length : 5 weeks
Maximum Length : 65 weeks
Depth : < 15%
Pivot Point : Left-side high of base
i.ibb.co i.ibb.co
Cup Base
Shape : A smooth, rounded “U” curve.
Minimum Length : 6 weeks
Maximum Length : 65 weeks
Minimum Depth : 8%
Maximum Depth : 50%
Pivot Point : Left-side high of base
i.ibb.co i.ibb.co
Sauce Base
Shape : A very gradual, broad “U” curve, often taking more length than cup bases.
Minimum Length : 6 weeks
Maximum Length : 65 weeks
Minimum Depth : 8%
Maximum Depth : 50%
Pivot Point : Left-side high of base
i.ibb.co i.ibb.co
Cup with Handle Base
Shape : A “U”‐shaped cup followed by a smaller downward-sloping flag or channel (the handle).
Minimum Length : 6 weeks
Maximum Length : 65 weeks
Minimum Depth : 8%
Maximum Depth : 50%
Pivot Point : High of the handle
i.ibb.co i.ibb.co
Saucer with Handle Base
Shape : Similar to cup with handle, but cup looks like the saucer base.
Minimum Length : 6 weeks
Maximum Length : 65 weeks
Minimum Depth : 8%
Maximum Depth : 50%
Pivot Point : High of the handle
i.ibb.co
Ascending Base
Shape : An upward-sloping channel or wedge with 3 pullbacks. Each pullback low should be higher than the previous one. It needs around 20% increase from a base to the other.
Minimum Length : 8 weeks
Maximum Length : 16 weeks
Minimum Depth : 8%
Maximum Depth : 50%
Pivot Point : Left-side high of third base
i.ibb.co i.ibb.co
Consolidation Base
Shape : Similar to flat base, but wider and fails to form any of the above bases.
Minimum Length : 8 weeks
Maximum Length : 16 weeks
Minimum Depth : 8%
Maximum Depth : 50%
Pivot Point : Left-side high of base
i.ibb.co i.ibb.co
- Base Stages
Once a stock has completed its initial 30% run-up and formed its first base, that pattern is labeled Stage 1.
After a breakout from Stage N, the stock must rally at least 20% above the Stage N pivot (the base’s resistance point). If it does, the next valid base becomes Stage N + 1.
When a breakout fails to advance at least 20% a base on base forms. This is considered an extension for the current base stage, and a letter is assigned after the stage number.
When a breakout fails and the price undercuts the low for the previous base, the base stages reset, and a rally of 30% will be needed to form a new stage 1 base.
Note that for IPO stocks, a 30% increase is not required to form the first base. As soon as it meets any of the shape of any of the available bases, it will be drawn.
- Base statistics
To help you determine how healthy is a base, some statistics are available when you hover on the small dot shown above the high-left side of each base.
i.ibb.co
Base : The specific pattern type (Flat, Cup, Sauce, etc.).
Stage : The stage number of the base (1, 2, 3 …) and, in parentheses, how many distinct bases have formed since the very first base (including base-on-base like 1a, 1b, etc.).
Pivot : The resistance level that defines the top of the base. A close above this price often signals a valid breakout and a potential entry point.
Length : The number of bars (days on a daily chart; weeks on a weekly chart) between the start of the base and the bar immediately before breakout. (The initial bar and the breakout bar themselves are not counted.)
Depth : How far, in percentage terms, the low of the base has fallen below its left-side high.
Prior Uptrend : The percent gain from the pivot of the previous base up to the start of the current base.
Blue/Red Count : The number of up days (Blue) and down days (Red) during the base where volume was above the 50-period moving average.
Price % : The percent change from the close at the end of the base to the close at the breakout bar.
Volume % : The percent difference between the volume on the breakout bar and the 50-period average volume at the end of the base.
2. ANT Indicator (David Ryan)
The ANT indicator, developed by David Ryan, is a momentum-based signal used to identify high-potential breakout candidates during a stock’s run-up phase. It complements the base patterns by flagging moments of unusually strong price and volume activity within an uptrend, helping confirm emerging strength before or during a base formation.
i.ibb.co
3. Key Price Levels (Pivots)
Plots recent pivot-based support and resistance levels.
i.ibb.co
4. Index Line Overlay
Overlays a chosen index (e.g. SPX) on the top portion of the chart to compare relative performance.
i.ibb.co
5. Relative Strength (RS) Line
Plots the price ratio of the symbol vs. an index (e.g. SPX) to identify outperformance.
i.ibb.co
6. Moving Averages (SMA & RS-MA)
Allows up to four simple (or exponential) moving averages on price (daily/weekly) and three on the RS line.
7. Earnings Line & EPS Change
Marks earnings events on daily/weekly charts and optionally plots YoY EPS change in a lower portion of the chart. The earnings line also shows a projection to estimated earnings. To maintain alignment with the price chart, the line and YoY EPS data are limited to the most recent 28 quarters on weekly charts and 8 quarters on daily charts. For analyzing older data, you can use the replay feature.
i.ibb.co
8. Bars
Since Trading View displays very thin bars when zoomed out, I added 2-pixel-wide vertical lines over the bars to make them easier to see.
9. Dark Theme
I added this for a quick workaround to adapt colors for dark theme. Enabling this overrides any custom settings. Uncheck to customize colors.
i.ibb.co
