Anchored Relative StrengthThe Anchored Relative Strength (RS) Indicator is a tool designed for traders to compare the performance of a selected stock or security against a benchmark index or another security starting from a specific point in time.
Traditional Relative Strength
The traditional RS line is a popular tool used to compare the performance of a stock, typically calculated as the ratio of the stock's price to a benchmark index's price. It helps identify outperformers and underperformers relative to the market or a specific sector.
The Anchored Approach
The Anchored RS line enhances the traditional concept of the RS line by introducing an anchored approach, where calculations begin from a user-defined date. This feature provides the flexibility to start the comparison from a specific historical event, earnings, market peak, trough, or any date significant to the trader's analysis.
Calculating Relative Strength
The RS value is calculated by dividing the close price of the chosen stock by the close price of the comparative symbol (SPX by default). This calculation is performed for each bar since the Anchor Date.
Indicator Features
🔶Custom Start Date
🔶Custom Comparison Symbol
🔶RS Line Moving Average
🔶Comparison Symbol Line
🔶Customize Colors & Appearance
Users can change the anchor date simply by clicking on the indicator and dragging the anchor point.
Cari dalam skrip untuk "spx"

Bull Flag DetectionThe FuturesGod bull flag indicator aims to identify the occurrence of bull flags.
Bull flags are a popular trading pattern that allows users to gauge long entries into a given market. Flags consist of a pole that is followed by either a downward or sideways consolidation period.
This script can be used on any market but was intended for futures (NQ, ES) trading on the intraday timeframe.
The script does the following:
1. Identifies the occurrence of a flag pole. This is based on a lookback period and percentage threshold decided by the user.
2. Marks the consolidation area after the pole occurrence using swing highs and swing lows.
3. Visually the above is represented by a shaded green area.
4. When a pole is detected, it is marked by a downward off-white triangle. Note that if the percentage threshold is reached several times on the same upward climb, the script will continue to identify points where the threshold for pole detection is met.
5. Also visualized are the 20, 50 and 200 period exponential moving averages. The area between the 20 and 50 EMAs are shaded to provide traders a visual of a possible support area.

Market Internals (TICK, ADD, VOLD, TRIN, VIX)OVERVIEW
This script allows you to perform data transformations on Market Internals, across exchanges, and specify signal parameters, to more easily identify sentiment extremes.
Notable transformations include:
1. Cumulative session values
2. Directional bull-bear Ratios and Percent Differences
3. Data Normalization
4. Noise Reduction
This kind of data interaction is very useful for understanding the relationship between two mutually exclusive metrics, which is the essence of Market Internals: Up vs. Down. Even so, they are not possible with symbol expressions alone. And the kind of symbol expression needed to produce baseline data that can be reliably transformed is opaque to most traders, made worse by the fact that prerequisite symbol expressions themselves are not uniform across symbols. It's very nuanced, and if this last bit was confusing … exactly.
All this to say, rather than forcing that burden onto you, I've baked the baseline symbol expressions into the indicator so: 1) the transform functions consistently ingest the baseline data in the correct format and 2) you don't have to spend time trying to figure it all out. Trading is hard. There's no need to make it harder.
INPUTS
Indicator
Allows you to specify the base Market Internal and Exchange data to use. The list of Market Internals is simplified to their fundamental representation (TICK, ADD, VOLD, TRIN, VIX, ABVD, TKCD), and the list of Exchange data is limited to the most common (NYSE, NASDAQ, All US Stocks). There are also options for basic exchange combinations (Sum or Average of NYSE & NASDAQ).
Mode
Short for "Plot Mode", this is where you specify the bars style (Candles, Bars, Line, Circles, Columns) and the source value (used for single value plots and plot color changes).
Scale
This is the first and second data transformation grouped together. The default is to show the origin data as it might appear on a chart. You can then specify if each bar should retain it's unique value (Bar Value) or be added to a running total (Cumulative). You can also specify if you would like the data to remain unaltered (Raw) or converted to a directional ratio (Ratio) or a percentage (Percent Diff). These options determine the scale of the plot.
Both Ratio and Percent Diff. convert a given symbol into a positive or negative number, where positive numbers are bullish and negative numbers are bearish.
Ratio will divide Bull values by Bear values, then further divide -1 by the quotient if it is less than 1. For example, if "0.5" was the quotient, the Ratio would be "-2".
Percent Diff. subtracts Bear values from Bull values, then divides that difference by the sum of Bull and Bear values multiplied by 100. If a Bull value was "3" and Bear value was "7", the difference would be "-4", the sum would be "10", and the Percent Diff. would be "-40", as the difference is both bearish and 40% of total.
Ratio Norm. Threshold
This is the third data transformation . While quotients can be less than 1, directional ratios are never less than 1. This can lead to barcode-like artifacts as plots transition between positive and negative values, visually suggesting the change is much larger than it actually is. Normalizing the data can resolve this artifact, but undermines the utility of ratios. If, however, only some of the data is normalized, the artifact can be resolved without jeopardizing its contextual usefulness.
The utility of ratios is how quickly they communicate proportional differences. For example, if one side is twice as big as the other, "2" communicates this efficiently. This necessarily means the numerical value of ratios is worth preserving. Also, below a certain threshold, the utility of ratios is diminished. For example, an equal distribution being represented as 0, 1, 1:1, 50/50, etc. are all equally useful. Thus, there is a threshold, above which we want values to be exact, and below which the utility of linear visual continuity is more important. This setting accounts for that threshold.
When this setting is enabled, a ratio will be normalized to 0 when 1:1, scaled linearly toward the specified threshold when greater than 1:1, and then retain its exact value when the threshold is crossed. For example, with a threshold of "2", 1:1 = 0, 1.5:1 = 1, 2:1 = 2, 3:1 = 3, etc.
With all this in mind, most traders will want to set the ratios threshold at a level where accuracy becomes more important than visual continuity. If this level is unknown, "2" is a good baseline.
Reset cumulative total with each new session
Cumulative totals can be retained indefinitely or be reset each session. When enabled, each session has its own cumulative total. When disabled, the cumulative total is maintained indefinitely.
Show Signal Ranges
Because everything in this script is designed to make identifying sentiment extremes easier, an obvious inclusion would be to not only display ranges that are considered extreme for each Market Internal, but to also change the color of the plot when it is within, or beyond, that range. That is exactly what this setting does.
Override Max & Min
While the min-max signal levels have reasonable defaults for each symbol and transformation type, the Override Max and Override Min options allow you to … (wait for it) … override the max … and min … signal levels. This may be useful should you find a different level to be more suitable for your exact configuration.
Reduce Noise
This is the fourth data transformation . While the previous Ratio Norm. Threshold linearly stretches values between a threshold and 0, this setting will exponentially squash values closer to 0 if below the lower signal level.
The purpose of this is to compress data below the signal range, then amplify it as it approaches the signal level. If we are trying to identify extremes (the signal), minimizing values that are not extreme (the noise) can help us visually focus on what matters.
Always keep both signal zones visible
Some traders like to zoom in close to the bars. Others prefer to keep a wider focus. For those that like to zoom in, if both signals were always visible, the bar values can appear squashed and difficult to discern. For those that keep a wider focus, if both signals were not always visible, it's possible to lose context if a signal zone is vertically beyond the pane. This setting allows you to decide which scenario is best for you.
Plot Colors
These define the default color, within signal color, and beyond signal color for Bullish and Bearish directions.
Plot colors should be relative to zero
When enabled, the plot will inherit Bullish colors when above zero and Bearish colors when below zero. When disabled and Directional Colors are enabled (below), the plot will inherit the default Bullish color when rising, and the default Bearish color when falling. Otherwise, the plot will use the default Bullish color for all directions.
Directional colors
When the plot colors should be relative to zero (above), this changes the opacity of a bars color if moving toward zero, where "100" percent is the full value of the original color and "0" is transparent. When the plot colors are NOT relative to zero, the plot will inherit Bullish colors when rising and Bearish colors when falling.
Differentiate RTH from ETH
Market Internal data is typically only available during regular trading hours. When this setting is enabled, the background color of the indicator will change as a reminder that data is not available outside regular trading hours (RTH), if the chart is showing electronic trading hours (ETH).
Show zero line
Similar to always keeping signal zones visible (further up), some traders prefer zooming in while others prefer a wider context. This setting allows you to specify the visibility of the zero line to best suit your trading style.
Linear Regression
Polynomial regressions are great for capturing non-linear patterns in data. TradingView offers a "linear regression curve", which this script is using as a substitute. If you're unfamiliar with either term, think of this like a better moving average.
Symbol
While the Market Internal symbol will display in the status line of the indicator, the status line can be small and require more than a quick glance to read properly. Enabling this setting allows you to specify if / where / how the symbol should display on the indicator to make distinguishing between Market Internals more efficient.
Speaking of symbols, this indicator is designed for, and limited to, the following …
TICK - The TICK subtracts the total number of stocks making a downtick from the total number of stocks making an uptick.
ADD - The Advance Decline Difference subtracts the total number of stocks below yesterdays close from the total number of stocks above yesterdays close.
VOLD - The Volume Difference subtracts the total declining volume from the total advancing volume.
TRIN - The Arms Index (aka. Trading Index) divides the ratio of Advancing Stocks / Volume by the ratio of Declining Stocks / Volume. Given the inverse correlation of this index to market movement, when transforming it to a Ratio or Percent Diff., its values are inverted to preserve the bull-bear sentiment of the transformations.
VIX - The CBOE Volatility Index is derived from SPX index option prices, generating a 30-day forward projection of volatility. Given the inverse correlation of this index to market movement, when transforming it to a Ratio or Percent Diff., its values are inverted and normalized to the sessions first bar to preserve the bull-bear sentiment of the transformations. Note: If you do not have a Cboe CGIF subscription , VIX data will be delayed and plot unexpectedly.
ABVD - The Above VWAP Difference is an unofficial index measuring all stocks above VWAP as a percent difference. For the purposes of this indicator (and brevity), TradingViews PCTABOVEVWAP has has been shortened to simply be ABVD.
TKCD - The Tick Cumulative Difference is an unofficial index that subtracts the total number of market downticks from the total number of market upticks. Where "the TICK" (further up) is a measurement of stocks ticking up and down, TKCD is a measurement of the ticks themselves. For the purposes of this indicator (and brevity), TradingViews UPTKS and DNTKS symbols have been shorted to simply be TKCD.
INSPIRATION
I recently made an indicator automatically identifying / drawing daily percentage levels , based on 4 assumptions. One of these assumptions is about trend days. While trend days do not represent the majority of days, they can have big moves worth understanding, for both capitalization and risk mitigation.
To this end, I discovered:
• Article by Linda Bradford Raschke about Capturing Trend Days.
• Video of Garrett Drinon about Trend Day Trading.
• Videos of Ryan Trost about How To Use ADD and TICK.
• Article by Jason Ruchel about Overview of Key Market Internals.
• Including links to resources outside of TradingView violates the House Rules, but they're not hard to find, if interested.
These discoveries inspired me adopt the underlying symbols in my own trading. I also found myself wanting to make using them easier, the net result being this script.
While coding everything, I also discovered a few symbols I believe warrant serious consideration. Specifically the Percent Above VWAP symbols and the Up Ticks / Down Ticks symbols (referenced as ABVD and TKCD in this indicator, for brevity). I found transforming ABVD or TKCD into a Ratio or Percent Diff. to be an incredibly useful and worthy inclusion.
ABVD is a Market Breadth cousin to Brian Shannon's work, and TKCD is like the 3rd dimension of the TICKs geometry. Enjoy.

Rule of 16 - LowerThe "Rule of 16" is a simple guideline used by traders and investors to estimate the expected annualized volatility of the S&P 500 Index (SPX) based on the level of the CBOE Volatility Index (VIX). The VIX, often referred to as the "fear gauge" or "fear index," measures the market's expectations for future volatility. It is calculated using the implied volatility of a specific set of S&P 500 options.
The Rule of 16 provides a rough approximation of the expected annualized percentage change in the S&P 500 based on the VIX level. Here's how it works:
Find the VIX level: Look up the current value of the VIX. Let's say it's currently at 20.
Apply the Rule of 16: Divide the VIX level by 16. In this example, 20 divided by 16 equals 1.25.
Result: The result of this calculation represents the expected annualized percentage change in the S&P 500. In this case, 1.25% is the estimated annualized volatility.
So, according to the Rule of 16, a VIX level of 20 suggests an expected annualized volatility of approximately 1.25% in the S&P 500.
Here's how you can use the Rule of 16:
Market Sentiment: The VIX is often used as an indicator of market sentiment. When the VIX is high (above its historical average), it suggests that investors expect higher market volatility, indicating potential uncertainty or fear in the markets. Conversely, when the VIX is low, it suggests lower expected volatility and potentially more confidence in the markets.
Risk Management: Traders and investors can use the Rule of 16 to estimate the potential risk associated with their portfolios. For example, if you have a portfolio of S&P 500 stocks and the VIX is at 20, you can use the Rule of 16 to estimate that the annualized volatility of your portfolio may be around 1.25%. This information can help you make decisions about position sizing and risk management.
Option Pricing: Options traders may use the Rule of 16 to get a quick estimate of the implied annualized volatility priced into S&P 500 options. It can help them assess whether options are relatively expensive or cheap based on the VIX level.
It's important to note that the Rule of 16 is a simplification and provides only a rough estimate of expected volatility. Market conditions and the relationship between the VIX and the S&P 500 can change over time. Therefore, it should be used as a guideline rather than a precise forecasting tool. Traders and investors should consider other factors and use additional analysis to make informed decisions.

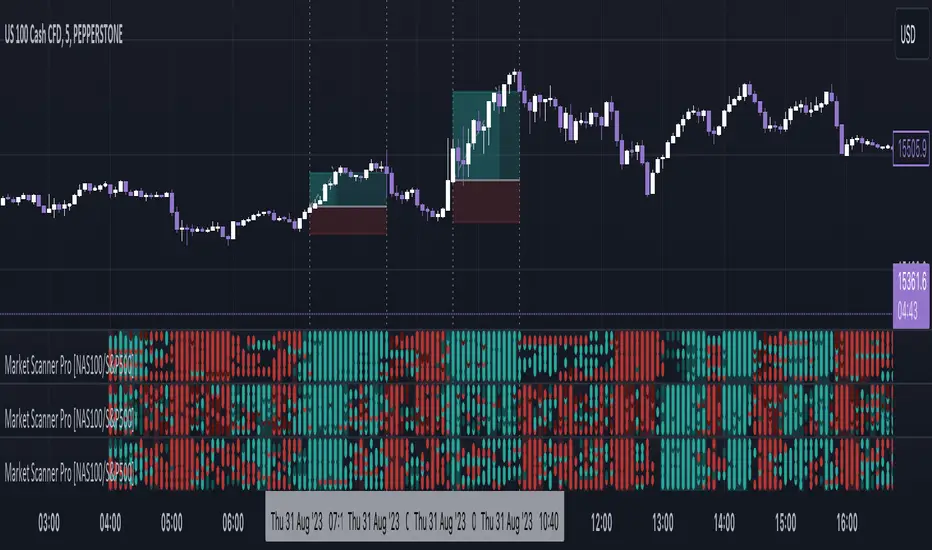
Market Scanner Pro - NAS100/S&P500 [FxScripts]***** OVERVIEW *****
Market Scanner Pro is both a multi-functional indicator and market scanner combined. The combination allows you to have multiple eyes across the market, all from a single chart.
The scanner is comprised of an intuitively designed 3-in-1 tool that tracks the key metrics that drive markets. Each use advanced algorithms to gather information from multiple data points, distilled into one simplified view.
***** TREND SCANNER *****
The first indicator featured on the chart is the Trend Scanner, this allows you to track price action across the wider market. Instantly see pattern shifts and emerging trends; when the market moves, you move with it.
***** MOMENTUM SCANNER *****
The second is the Momentum Scanner which offers a realtime representation of momentum shifts as they occur. This allows you to monitor false breakouts and catch the moves that matter.
***** VOLUME SCANNER *****
The third is the Volume Scanner which provides unique insight into where buy and sell volume is being placed across the market. It offers a further way of determining entry and exit points or simply confirmation that a trend is underway.
***** HOW IT WORKS *****
1. The scanner surveys the market looking for strengths and weaknesses in Trend, Momentum or Volume.
2. It displays the underlying strength or weakness as a series of dots with up to 10 green dots showing strength and up to 10 red dots showing weakness.
3. Lighter colored dots are displayed where the strength of the trend, momentum or volume is lesser; if a dot is missing this is a sign of market neutrality.
4. All scanners have a sensitivity setting plus a volatility filter which can be adjusted according to your style of trading and the underlying instrument (full details below).
5. The background can be set to color-fill when the majority of dots are coloured either red or green, with higher values denoting greater strength or greater weakness.
6. Alerts can be configured in the same way as the background to provide both entry and exit signals (further details below).
***** INSTRUMENTS *****
Market Scanner Pro is made up of both a European and US indices scanner, both forming part of the same package.
European features the DAX40 and FTSE100; US (this scanner) features the NAS100 plus S&P500. The US scanner works on futures and options such as ES, NQ, QQQ, SPX and SPY.
***** SETTINGS OVERVIEW *****
The scanner features the following customizable settings:
~~ Trend Settings ~~
▶ Trend Filter - adjusting this will allow you to focus on short term trends (most suitable for scalping), medium or long term (best for swing trading).
▶ Countertrend Strength - increases the sensitivity of weaker vs stronger countertrends. As countertrends are trends that run against the main trend, this will assist in detecting the strength of a pullback or reversal and allow you to either hold, exit or reverse the trade with confidence.
~~ Momentum Settings ~~
▶ Momentum Filter - increase or decrease the sensitivity of the momentum scanner. Increase to avoid periods of low or weak momentum, decrease to highlight stronger surges in momentum.
~~ Volume Settings ~~
▶ Volume Filter - increase or decrease the sensitivity of the volume scanner. Increase to avoid periods where buy and sell volume can potentially cancel each other out.
~~ Volatility Settings ~~
▶ Volatility Offset - use this to fine tune the volatility filter. A higher value generally delays the volatility filter allowing for confirmation of stronger trends, a lower value will detect trend, momentum or volume movement sooner but may be less accurate.
▶ Each scanner has its own setting allowing you to adjust how you monitor the underlying volatility for each.
▶ As with all settings, we recommend adjusting this to your style of trading, instrument and timeframe.
~~ Alerts ~~
Alerts can be configured to send notifications when anything from 6-10 bullish or bearish dots are showing. Exit markers can be configured when anything from 2+ dots are revealed. This adds an extra layer of sensitivity for traders who appreciate complete control over their trade.
~~ Display Settings ~~
You have the ability to hide all colored dots and only show the background or, alternatively, hide the background and only show colored dots.
***** TRIAL PERIOD *****
We offer a FREE, no questions asked, 7-day trial with every new registration. Visit the link below to register.
Market Scanner Pro - DAX/FTSE [FxScripts]***** OVERVIEW *****
Market Scanner Pro is both a multi-functional indicator and market scanner combined. The combination allows you to have multiple eyes across the market, all from a single chart.
The scanner is comprised of an intuitively designed 3-in-1 tool that tracks the key metrics that drive markets. Each use advanced algorithms to gather information from multiple data points, distilled into one simplified view.
***** TREND SCANNER *****
The first indicator featured on the chart is the Trend Scanner, this allows you to track price action across the wider market. Instantly see pattern shifts and emerging trends; when the market moves, you move with it.
***** MOMENTUM SCANNER *****
The second is the Momentum Scanner which offers a realtime representation of momentum shifts as they occur. This allows you to monitor false breakouts and catch the moves that matter.
***** VOLUME SCANNER *****
The third is the Volume Scanner which provides unique insight into where buy and sell volume is being placed across the market. It offers a further way of determining entry and exit points or simply confirmation that a trend is underway.
***** HOW IT WORKS *****
1. The scanner surveys the market looking for strengths and weaknesses in Trend, Momentum or Volume.
2. It displays the underlying strength or weakness as a series of dots with up to 10 green dots showing strength and up to 10 red dots showing weakness.
3. Lighter colored dots are displayed where the strength of the trend, momentum or volume is lesser; if a dot is missing this is a sign of market neutrality.
4. All scanners have a sensitivity setting plus a volatility filter which can be adjusted according to your style of trading and the underlying instrument (full details below).
5. The background can be set to color-fill when the majority of dots are coloured either red or green, with higher values denoting greater strength or greater weakness.
6. Alerts can be configured in the same way as the background to provide both entry and exit signals (further details below).
***** INSTRUMENTS *****
Market Scanner Pro is made up of both a European and US indices scanner, both forming part of the same package.
European (this scanner) features the DAX40 and FTSE100; US features the NAS100 plus S&P500. The US scanner works on futures and options such as ES, NQ, QQQ, SPX and SPY.
***** SETTINGS OVERVIEW *****
The scanner features the following customizable settings:
~~ Trend Settings ~~
▶ Trend Filter - adjusting this will allow you to focus on short term trends (most suitable for scalping), medium or long term (best for swing trading).
▶ Countertrend Strength - increases the sensitivity of weaker vs stronger countertrends. As countertrends are trends that run against the main trend, this will assist in detecting the strength of a pullback or reversal and allow you to either hold, exit or reverse the trade with confidence.
~~ Momentum Settings ~~
▶ Momentum Filter - increase or decrease the sensitivity of the momentum scanner. Increase to avoid periods of low or weak momentum, decrease to highlight stronger surges in momentum.
~~ Volume Settings ~~
▶ Volume Filter - increase or decrease the sensitivity of the volume scanner. Increase to avoid periods where buy and sell volume can potentially cancel each other out.
~~ Volatility Settings ~~
▶ Volatility Offset - use this to fine tune the volatility filter. A higher value generally delays the volatility filter allowing for confirmation of stronger trends, a lower value will detect trend, momentum or volume movement sooner but may be less accurate.
▶ Each scanner has its own setting allowing you to adjust how you monitor the underlying volatility for each.
▶ As with all settings, we recommend adjusting this to your style of trading, instrument and timeframe.
~~ Alerts ~~
Alerts can be configured to send notifications when anything from 6-10 bullish or bearish dots are showing. Exit markers can be configured when anything from 2+ dots are revealed. This adds an extra layer of sensitivity for traders who appreciate complete control over their trade.
~~ Display Settings ~~
You have the ability to hide all colored dots and only show the background or, alternatively, hide the background and only show colored dots.
***** TRIAL PERIOD *****
We offer a FREE, no questions asked, 7-day trial with every new registration. Visit the link below to register.

ETF/Futures Prices Simple indicator to display the current SPY, SPX, ES1! prices to be used for quick reference without having to refernce multiple charts and the indicator works with any ETF or futures tickers
Dm if you need anything fixed, modified or added to the script

McClellan Indicators (Oscillator, Summation Index w/ RSI & MACD)Four indicators in one based on the McClellan Oscillator for both the NYSE and Nasdaq exchanges. Designed to be used in conjunction with each other- plot the Oscillator (Osc), Summation Index (MSI), and RSI/MACD of the MSI on both your SPX and Nasdaq chart. Select the exchange and indicator within the settings. These tools are secondary- but when the signals are combined with the action of the index and stocks can be helpful in identifying market turns and trend strength.
McClellan Oscillator--
The Osc is a market breadth tool that uses a fast and slow EMA based on the difference between advancing and declining stocks on the exchange. Used primarily to identify breadth thrusts, divergences, and extremes (oversold/overbought). Plot horizontal levels to see when the market internals are extremely overbought or oversold, and take note of when the Osc is declining while the market is advancing or vice versa.
McClellan Summation Index--
For intermediate trends the MSI is a running total of the Osc which can be used to confirm the strength of a trend, and spot potential reversals. A 10 period ema is included on this indicator, where crossovers can aid in spotting the change in trend of market internals, and divergences can identify when market internals are not in line with the trend. Shading is applied for when the internals are in a bullish or bearish trend.
Two additional indicators are the RSI and MACD of the Summation Index. An overbought or oversold MSI RSI generally indicates a strong trend in the market internals, however you may want to take note when the RSI stalls and begins to "hook" in the opposite direction. This indicator has signals to show when the market internals may be turning and to be on lookout for trend change.
Similarly- the MACD of the MSI identifies the strength of the trend, and crossovers can be used to help spot reversals. Shading is included in this indicator to spot the bullish/bearish trend of internals.

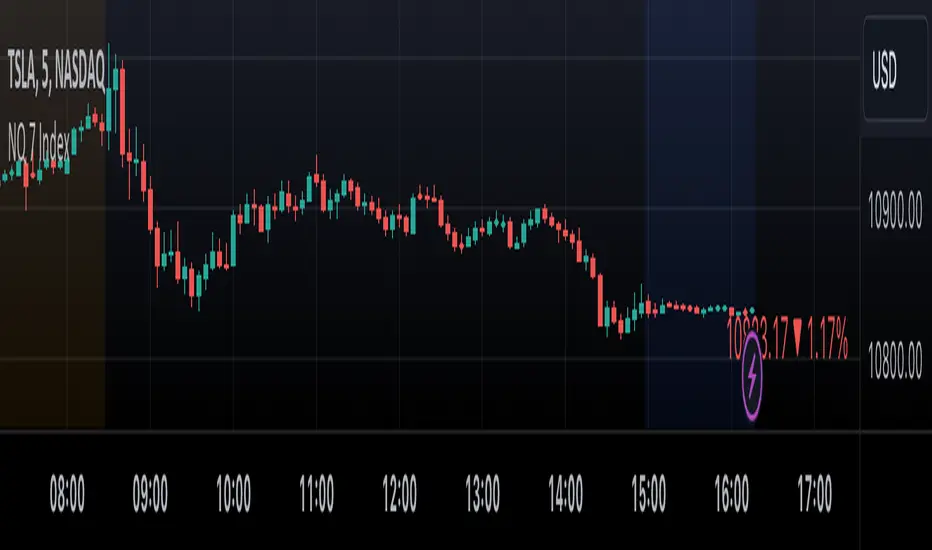
NQ 7 IndexThis is a simple index-like script that adds up the market value of the magnificent 7 (AAPL, MSFT, NVDA, TSLA, META, AMZN, GOOG) and divided by a constant.
The way this works is similar to SPX and NDX, except that it doesn't have any special weighting mechanism.
Average Range LinesThis Average Range Lines indicator identifies high and low price levels based on a chosen time period (day, week, month, etc.) and then uses a simple moving average over the length of the lookback period chosen to project support and resistance levels, otherwise referred to as average range. The calculation of these levels are slightly different than Average True Range and I have found this to be more accurate for intraday price bounces.
Lines are plotted and labeled on the chart based on the following methodology:
+3.0: 3x the average high over the chosen timeframe and lookback period.
+2.5: 2.5x the average high over the chosen timeframe and lookback period.
+2.0: 2x the average high over the chosen timeframe and lookback period.
+1.5: 1.5x the average high over the chosen timeframe and lookback period.
+1.0: The average high over the chosen timeframe and lookback period.
+0.5: One-half the average high over the chosen timeframe and lookback period.
Open: Opening price for the chosen time period.
-0.5: One-half the average low over the chosen timeframe and lookback period.
-1.0: The average low over the chosen timeframe and lookback period.
-1.5: 1.5x the average low over the chosen timeframe and lookback period.
-2.0: 2x the average low over the chosen timeframe and lookback period.
-2.5: 2.5x the average low over the chosen timeframe and lookback period.
-3.0: 3x the average low over the chosen timeframe and lookback period.
Look for price to find support or resistance at these levels for either entries or to take profit. When price crosses the +/- 2.0 or beyond, the likelihood of a reversal is very high, especially if set to weekly and monthly levels.
This indicator can be used/viewed on any timeframe. For intraday trading and viewing on a 15 minute or less timeframe, I recommend using the 4 hour, 1 day, and/or 1 week levels. For swing trading and viewing on a 30 minute or higher timeframe, I recommend using the 1 week, 1 month, or longer timeframes. I don’t believe this would be useful on a 1 hour or less timeframe, but let me know if the comments if you find otherwise.
Based on my testing, recommended lookback periods by timeframe include:
Timeframe: 4 hour; Lookback period: 60 (recommend viewing on a 5 minute or less timeframe)
Timeframe: 1 day; Lookback period: 10 (also check out 25 if your chart doesn’t show good support/resistance at 10 days lookback – I have found 25 to be useful on charts like SPX)
Timeframe: 1 week; Lookback period: 14
Timeframe: 1 month; Lookback period: 10
The line style and colors are all editable. You can apply a global coloring scheme in the event you want to add this indicator to your chart multiple times with different time frames like I do for the weekly and monthly.
I appreciate your comments/feedback on this indicator to improve. Also let me know if you find this useful, and what settings/ticker you find it works best with!
Also check out my profile for more indicators!

Global Liquidity IndexThe Global Liquidity Index offers a consolidated view of all major central bank balance sheets from around the world. For consistency and ease of comparison, all values are converted to USD using their relevant forex rates and are expressed in trillions. The indicator incorporates specific US accounts such as the Treasury General Account (TGA) and Reverse Repurchase Agreements (RRP), both of which are subtracted from the Federal Reserve's balance sheet to give a more nuanced view of US liquidity. Users have the flexibility to enable or disable specific central banks and special accounts based on their preference. Only central banks that both don’t engage in currency pegging and have reliable data available from late 2007 onwards are included in this aggregated liquidity model.
Global Liquidity Index = Federal Reserve System (FED) - Treasury General Account (TGA) - Reverse Repurchase Agreements (RRP) + European Central Bank (ECB) + People's Bank of China (PBC) + Bank of Japan (BOJ) + Bank of England (BOE) + Bank of Canada (BOC) + Reserve Bank of Australia (RBA) + Reserve Bank of India (RBI) + Swiss National Bank (SNB) + Central Bank of the Russian Federation (CBR) + Central Bank of Brazil (BCB) + Bank of Korea (BOK) + Reserve Bank of New Zealand (RBNZ) + Sweden's Central Bank (Riksbank) + Central Bank of Malaysia (BNM).
This tool is beneficial for anyone seeking to get a snapshot of global liquidity to interpret macroeconomic trends. By examining these balance sheets, users can deduce policy trajectories and evaluate the global economic climate. It also offers insights into asset pricing and assists investors in making informed capital allocation decisions. Historically, riskier assets, such as small caps and cryptocurrencies, have typically performed well during periods of rising liquidity. Thus, it may be prudent for investors to avoid additional risk unless there's a consistent upward trend in global liquidity.

Market Smith IndicatorsMarket Smith has a collection of tools that are useful for identifying stocks. On their charts they have a 21/50/200 day moving averages, high and low pivot points, a relative strength line, and a relative strength rating. This script contains indicators for the following:
21/50/200 Day Moving Averages
High and Low pivot points
A Relative Strength line
A Relative Strength rating
21/50/200 Day Moving Averages
The 21/50/200 Day moving averages are simple moving averages. They are visible in any chart increment but to use them properly you need to set you charts to be by day. Labels will appear on the right of the lines to show that they are representative of 21/50/200 day moving averages.
High and Low pivot points
The High and Low pivot points are green for high pivot points and red for low points. They are show in the Market Smith style with the numbers simply above the pivot points.
Relative Strength line
The Relative Strength line is a line that shows the strength of the stock compared to the S&P 500. In this case we utilize the SPX ticker to compare the stock to. This line is almost identical to the Market Smith tool and is an excellent tool to determine how a stock is doing compared to the market. When movements in the stock and shown with sideways trending of the RS line that means that the stock is following the market. When a stock is outperforming the market the RS line will follow.
Relative Strength rating
Thank you to ©Fred6724 for the RS Rating inspiration. They wrote excellent open source code for a RS Rating comparable to Market Smith. As the RS Rating in Market Smith is not open source it is difficult to know exactly how it is being calculated. After simplifying Fred's code and building upon a few ideas I had I compared the RS Rating to multiple Market Smith Ratings. The rating is close but often off by multiple points. If there is anyone who has a better idea on how to get this rating or how to improve on the code please send me a PM or fork this project. This rating is a good indicator to see how a certain stock compares to other stocks in the market. In Market Smith they are able to utilize their database to compare it to all other stocks. Since we do not have access to the same tools we are only able to compare it to the percentage of stocks above the 200, 150, 100, 50, and 20 day moving average.
Using these tools together are a small fraction what make people like Bill O'neill and Jim Roppel so successful. I plan on updating the RS Rating as I continue to work on this project so if there is anyone who has ideas then please send me a PM. Ultimately the goal of this project is to have a solution that is identical to Market Smith.

CE - Market Performance TableThe 𝓜𝓪𝓻𝓴𝓮𝓽 𝓟𝓮𝓻𝓯𝓸𝓻𝓶𝓪𝓷𝓬𝓮 𝓣𝓪𝓫𝓵𝓮 is a sophisticated market tool designed to provide valuable insights into the current market trends and the approximate current position in the Macroeconomic Regime.
Furthermore the 𝓜𝓪𝓻𝓴𝓮𝓽 𝓟𝓮𝓻𝓯𝓸𝓻𝓶𝓪𝓷𝓬𝓮 𝓣𝓪𝓫𝓵𝓮 provides the Correlation Implied Trend for the Asset on the Chart. Lastly it provides information about current "RISK ON" or "RISK OFF" periods.
Methodology:
𝓜𝓪𝓻𝓴𝓮𝓽 𝓟𝓮𝓻𝓯𝓸𝓻𝓶𝓪𝓷𝓬𝓮 𝓣𝓪𝓫𝓵𝓮 tracks the 15 underlying Stock ETF's to identify their performance and puts the combined performances together to visualize 42MACRO's GRID Equity Model.
For this it uses the below ETF's:
Dividends (SPHD)
Low Beta (SPLV)
Quality (QUAL)
Defensives (DEF)
Growth (IWF)
High Beta (SPHB)
Cyclicals (IYT, IWN)
Value (IWD)
Small Caps (IWM)
Mid Caps (IWR)
Mega Cap Growth (MGK)
Size (OEF)
Momentum (MTUM)
Large Caps (IWB)
Overall Settings:
The main time values you want to change are:
Correlation Length
- Defines the time horizon for the Correlation Table
ROC Period
- Defines the time horizon for the Performance Table
Normalization lookback
- Defines the time horizon for the Trend calculation of the ETF's
- For longer term Trends over weeks or months a length of 50 is usually pretty accurate
Visuals:
There is a variety of options to change the visual settings of what is being plotted and the two table positions and additional considerations.
Everything that is relevant in the underlying logic that can help comprehension can be visualized with these options.
Market Correlation:
The Market Correlation Table takes the Correlation of the above ETF's to the Asset on the Chart, it furthermore uses the Normalized KAMA Oscillator by IkkeOmar to analyse the current trend of every single ETF.
It then Implies a Correlation based on the Trend and the Correlation to give a probabilistically adjusted expectation for the future Chart Asset Movement. This is strengthened by taking the average of all Implied Trends.
With this the Correlation Table provides valuable insights about probabilistically likely Movement of the Asset, for Traders and Investors alike, over the defined time duration.
Market Performance:
𝓜𝓪𝓻𝓴𝓮𝓽 𝓟𝓮𝓻𝓯𝓸𝓻𝓶𝓪𝓷𝓬𝓮 𝓣𝓪𝓫𝓵𝓮 is the actual valuable part of this Indicator.
It provides valuable information about the current market environment (whether it's risk on or risk off), the rough GRID models from 42MACRO and the actual market performance.
This allows you to obtain a deeper understanding of how the market works and makes it simple to identify the actual market direction.
Utility:
The 𝓜𝓪𝓻𝓴𝓮𝓽 𝓟𝓮𝓻𝓯𝓸𝓻𝓶𝓪𝓷𝓬𝓮 𝓣𝓪𝓫𝓵𝓮 is divided in 4 Sections which are the GRID regimes:
Economic Growth:
Goldilocks
Reflation
Economic Contraction:
Inflation
Deflation
Top 5 Equity Style Factors:
Are the values green for a specific Column? If so then the market reflects the corresponding GRID behavior.
Bottom 5 Equity Style Factors:
Are the values red for a specific Column? If so then the market reflects the corresponding GRID behavior.
So if we have Goldilocks as current regime we would see green values in the Top 5 Goldilocks Cells and red values in the Bottom 5 Goldilocks Cells.
You will find that Reflation will look similar, as it is also a sign of Economic Growth.
Same is the case for the two Contraction regimes.

REVE Cohorts - Range Extension Volume Expansion CohortsREVE Cohorts stands for Range Extensions Volume Expansions Cohorts.
Volume is divided in four cohorts, these are depicted in the middle band with colors and histogram spikes.
0-80 percent i.e. low volumes; these get a green color and a narrow histogram bar
80-120 percent, normal volumes, these get a blue color and a narrow histogram bar
120-200 percent, high volume, these get an orange color and a wide histogram bar
200 and more percent is extreme volume, maroon color and wide bar.
All histogram bars have the same length. They point to the exact candle where the volume occurs.
Range is divided in two cohorts, these are depicted as candles above and below the middle band.
0-120 percent: small and normal range, depicted as single size, square candles
120 percent and more, wide range depicted as double size, rectangular candles.
The range candles are placed and colored according to the Advanced Price Algorithm (published script). If the trend is up, the candles are in the uptrend area, which is above the volume band, , downtrend candles below in the downtrend area. Dark blue candles depict a price movement which confirms the uptrend, these are of course in the uptrend area. In this area are also light red candles with a blue border, these depict a faltering price movement countering the uptrend. In the downtrend area, which is below the volume band, are red candles which depict a price movement confirming the downtrend and light blue candles with a red border depicting price movement countering the downtrend. A trend in the Advanced Price Algorithm is in equal to the direction of a simple moving average with the same lookback. The indicator has the same lagging.as this SMA.
Signals are placed in the vacated spaces, e.g. during an uptrend the downtrend area is vacated.
There are six signals, which arise as follows:
1 Two blue triangles up on top of each other: high or extreme volume in combination with wide range confirming uptrend. This indicates strong and effective up pressure in uptrend
2 Two pink tringles down on top of each other: high or extreme volume in combination with wide range down confirming downtrend. This indicates strong and effective down pressure in downtrend
3 Blue square above pink down triangle down: extreme volume in combination with wide range countering uptrend. This indicates a change of heart, down trend is imminent, e.g. during a reversal pattern. Down Pressure in uptrend
4 Pink square below blue triangle up: extreme volume in combination with wide range countering downtrend. This indicates a change of heart, reversal to uptrend is imminent. Up Pressure in downtrend
5 single blue square: a. extreme volume in combination with small range confirming uptrend, b. extreme volume in combination with small range countering downtrend, c. high volume in combination with wide range countering uptrend. This indicates halting upward price movement, occurs often at tops or during distribution periods. Unresolved pressure in uptrend
6 Single pink square: a extreme volume in combination with small range confirming downtrend, b extreme volume in combination with small range countering uptrend, c high volume in combination with wide range countering downtrend. This indicated halting downward price movement. Occurs often at bottoms or during accumulation periods. Unresolved pressure in downtrend.
The signals 5 and 6 are introduced to prevent flipping of signals into their opposite when the lookback is changed. Now signals may only change from unresolved in directional or vice versa. Signals 3 and 4 were introduced to make sure that all occurrences of extreme volume will result in a signal. Occurrences of wide volume only partly lead to a signal.
Use of REVE Cohorts.
This is the indicator for volume-range analyses that I always wanted to have. Now that I managed to create it, I put it in all my charts, it is often the first part I look at, In my momentum investment system I use it primarily in the layout for following open positions. It helps me a lot to decide whether to close or hold a position. The advantage over my previous attempts to create a REVE indicator (published scripts), is that this version is concise because it reports and classifies all possible volumes and ranges, you see periods of drying out of volume, sequences of falter candles, occurrences of high morning volume, warning and confirming signals.. The assessment by script whether some volume should be considered low, normal, high or extreme gives an edge over using the standard volume bars.
Settings of REVE Cohorts
The default setting for lookback is ‘script sets lookback’ I put this in my indicators because I want them harmonized, the script sets lookback according to timeframe. The tooltip informs which lookback will be set at which timeframe, you can enable a feedback label to show the current lookback. If you switch ‘script sets lookback’ off, you can set your own preferred user lookback. The script self-adapts its settings in such a way that it will show up from the very first bar of historical chart data, it adds volume starting at the fourth bar.
You can switch off volume cohorts, only range candles will show while the middle band disappears. Signals will remain if volume is present in the data. Some Instruments have no volume data, e.g. SPX-S&P 500 Index,, then only range candles will be shown.
Colors can be adapted in the inputs. Because the script calculates matching colors with more transparency it is advised to use 100 percent opacity in these settings.
Take care, Eykpunter

Easy Trade Pro [Buy and Sell Strategy + Backtesting System]Hello Traders,
Easy Trade Pro is a comprehensive tool that combines multiple technical indicators into a single customizable one. This tool is the culmination of an extensive trading career, it is designed to help traders navigate the markets in any timeframe and financial asset, like Equities, Futures, Crypto, Forex and Commodities.
Before we deep dive into the comprehensive guide on what Easy Trade Pro is, let's kick off by showcasing the strategy used in this example. Please note, we have adopted an extremely conservative approach strictly following the Tradingview House Rules, which you can review here: www.tradingview.com
The backtest strategy parameters:
Currency pair: EUR USD
Timeframe: 15-min chart
Market: Spot, no leverage
Broker: FXCM
Trading range: 2022-09-01 07:30 — 2023-06-26 20:00
Backtesting range: 2022-08-31 23:00 — 2023-06-26 20:00
Initial Capital: $10,000
Buy Order Size: 20% of the capital, $2,000
Stop Loss: 0.50%
Sell orders: Four different take profits where we unload the position by 25% each time
Broker Fees: Commission set at 0.08$
Slippage: 10 ticks
Understanding FXCM Commissions and Setting Realistic Slippage for EUR/USD Spot Trading:
◉I would like to provide some clarity on the commission structure and slippage setting used in the study for trading the EUR/USD pair on the FXCM spot market. Based on the information available, FXCM charges a commission of $4.00 per standard lot (100,000) on both sides of the trade (meaning at open and close) for the EUR/USD pair. Since the study involve an order size of $2,000 USD, which is equivalent to 0.02 lots, the commission fee for one side of the trade (either buying or selling) would be calculated as $4.00 multiplied by 0.02, which is $0.08. This means that for each individual trade, whether it be a buy or sell, the commission fee would be $0.08.
◉As for slippage, it is crucial to account for the inherent uncertainty in the execution price due to market fluctuations. In the forex market, the EUR/USD pair is quoted with a precision of five decimal places, with the smallest price change being a "pipette" (0.00001). Given that slippage can vary based on market conditions, it is considered fair practice to use a slippage of around 10 ticks under normal market conditions for the EUR/USD pair. This allows for a more realistic representation of the execution price, especially in a liquid and fast-moving market such as forex.
More detailed information about FXCM fees structure in the link below:
docs.fxcorporate.com
Enter a Trade conditions:
For our buy order, we utilize a custom buy signal called 'Bullish Reversal'. A detailed explanation of this and other buy orders can be found later in the guide, specifically in section 1).
To enhance realism in our trading strategy, we have implemented a confirmation mechanism. When utilizing the strategy tester, you have the option to input a value to determine the number of confirmation candles to consider.
For example, if you set the input to 1, the system will check if the next candle following the signal meets the criteria for confirmation. If set to 2, the system will evaluate the second candle, and so on for higher values. The confirmation is determined by comparing the closing or opening price of the selected buy signal candle with the corresponding closing price of the confirmation candle.
In this case we choose as buy signal: 'Bullish Reversal' + 2 candle of confirmation
Exit a trade conditions:
On the sell side, we exit a trade in four different types of sell orders where we take profits. Inside '', you will encounter unique labels attributed to our custom sell signals. A detailed explanation of these sell orders can be found later in the guide, specifically in section 1). We used custom order called:
1TP 'Good Sell'
2TP 'Good Sell'
3TP 'Good Sell'
4TP 'Bearish Reversal' + 4 confirmation candles
Our confirmation logic, for sell signals, is applied only to 'Bearish Reversal' signal. The confirmation is determined by comparing the closing or opening price of the selected 'Bearish Reversal' candle with the corresponding closing price of the confirmation candle. In this case, we wait for the fourth candle from the 'Bearish Reversal' signal to confirm the sell trade.
Protect your capital:
This super-conservative study involves a clear low risk, with the use of $2,000, 20% of our capital. If the stop loss of 0.5% were triggered, we lose 10$, equating to 0.10% of $10,000 - thus affecting only 0.10% of our capital.
Super Conservative Approach & Results:
With 353 closed trades, we achieved a net profit of 2.03%, or $203.34$ relative to our initial $10,000 capital, and a win rate of 73.37%.
Less Conservative Approach & Results:
We could also consider increasing our risk to 0.5% of our capital per trade. We would maintain our stop loss at 0.50%, but we would need to use all our capital to enter the market. If the stop loss of 0.5% will be triggered, we would lose 50$, equating to 0.5% of $10,000.
In this scenario, our net profit would have increased to 10.15%, equivalent to $1015.
Please be aware:
While fully automated strategies can bring considerable advantages, they are not without their cons. For one, relying solely on an automated system may not take into account the potential confluence of other strategies or indicators, such as the significance of support and resistance zones. These elements often require a more nuanced, human understanding of the markets and cannot always be perfectly replicated by an algorithm.
Additionally, it's essential to remember that a significant percentage of traders are not consistently profitable. As such, prudent risk management, a conservative approach, and acceptance of a reasonable profit are crucial aspects of successful trading. While the allure of high returns can be tempting, the sustainability of your trading strategy should always take precedence. Achieving steady, reliable profits over time often outweighs the appeal of a risky, high-return strategy that could potentially lead to substantial losses.
So, while automation can be a powerful tool in your trading arsenal, it's also important to consider other strategies and factors. Always ensure you're managing your risk effectively and approaching trading with a realistic and informed perspective.
------------------------------------------------------------------------ Why Easy Trade Pro is Original? ----------------------------------------------------------------------------------
We developed Easy Trade Pro as a unique and comprehensive solution, and we decided to protect our code to preserve its originality. We invested significant time and effort into making it a realistic trading strategy simulator. The standout features that set Easy Trade Pro apart include:
☀ Versatile Stop Loss Mechanisms: Stop loss execution can be complex and often requires careful coding to work as intended. In most freely available open-source codes, stop losses are implemented using the Average True Range (ATR). ATR can be beneficial but has limitations:
☁ Lagging Indicator - Like most technical indicators, the ATR is a lagging indicator. This means it is based on past data, and so it may not accurately reflect future market volatility. If market conditions change rapidly, the ATR may not adjust quickly enough, potentially leading to suboptimal stop loss levels.
☁ No Directional Information - The ATR measures volatility, but it does not provide any indication of the direction of the trend. Therefore, it should not be used as a standalone tool for making trading decisions, but should be used in conjunction with other technical analysis tools that can provide directional cues.
☁ Inefficiency in Trending Markets - In strongly trending markets, ATR-based stops can sometimes be too far from the current price level. This could lead to larger losses if the price moves against your trade before hitting the stop loss. On the flip side, in less volatile, sideways markets, an ATR-based stop might be set too close to the entry point, leading to premature stop outs.
☁ Overoptimization Risk - If you're backtesting a trading strategy, there's a risk of overoptimizing your stop loss settings by fine-tuning them to past data. The best ATR multiplier that worked in the past might not necessarily work in the future, leading to potential performance issues.
☀ We countered these by implementing four different types of 'protect the trade' mechanisms:
✔ Fixed Percentage Stop Loss
✔ Trailing Stop Loss
✔ Stop Loss Moved to Entry Upon Reaching Certain Gain
✔ Stop Loss Moved to Entry Upon Reaching First Take Profit Order ("Custom Order").
☀ Dual Exit Strategy: We incorporated two distinct methods of exiting a trade. The first uses our custom signals, while the second triggers exit at a certain percentage of gain.
☀ Multiple Take Profit Orders: You have the flexibility to establish up to four different sell orders. This feature enables you to fractionate your exit strategy according to your needs. You can choose to trigger these fractions based on our custom signals or determine your own exit points by setting targeted gains at a fixed percentage.
☀ Confirmation Candle System: This feature enhances trade precision by requiring confirmation candles after a buy or sell signal. This confirmation, dependent on the next candle's closing price, helps reduce false signals and improves entry and exit points. While our confirmation system is applicable to all custom buy signals, it's solely dedicated for the bearish reversal when it comes to sell signals.
☀ Universal Compatibility: Easy Trade Pro's Strategy Tester works perfectly with any asset class. The code can handle different contract types, including the SPX contracts and fractional assets like Bitcoin. It's optimized to ensure proper execution of trades without rounding issues.
☀ Bullish and Bearish Reversal candles: Our method of detecting these pivotal candles combines conditions from buy and sell signals with pertinent divergences in Price, RSI, and Volume (OBV). The distinguishing factor, however, lies in recognizing significant shifts in market structure and liquidity grabs. To further enhance the credibility of our indicator, we've incorporated Bollinger Bands, serving as an additional layer in spotting potential trend reversals, particularly when aligned with long-wick candlesticks, engulfing patterns, and morning or evening star formations.
☀ Non-Repainting Indicator: Our indicator signals are designed not to repaint. Once a signal appears, it stays fixed, offering a reliable tool for your trading decisions.
================================================== EXTENSIVE TECHNICAL DESCRIPTION ====================================================
Easy Trade Pro is versatile, allowing you to analyze market trends across any financial asset. With its rigorous testing, our tool can be used confidently on any timeframe, from 1D to 1min, whether you prefer longer-term or shorter-term trades.
Although we recommend trading on timeframes between 1D and 1min, higher timeframes like 1W chart, can also provide broader insights.
Our study combines a variety of popular technical indicators, such as RSI, Stochastic RSI, MACD, DMI, Bollinger Bands as well as relevant EMAs. On the volume side OBV and MFI. Using a data-driven approach, “Easy Trade Pro” analyzes historical market trends to identify optimal ways to combine these indicators with significant divergences between price and oscillators. On top of that the code considers relevant changes in market structure and liquidity grabs, to generate reliable and accurate signals for potential buy and sell opportunities.
* ☎ --> Please not that MACD, BBs, and EMAs account for a minimal part of our script <--- ☎, If you're looking for a simpler tool, consider checking out our open-source indicator, 'RSI, SRSI, MACD, and DMI cross - Open source code'. You can find it here:
With our customizable system, traders will be able to identify:
1) Three types of buy signals🐂,💰,💎 and sell signals 🐻,🔨,💀
2) Bullish and bearish reversal candles with support and resistance lines
3) Bull and bear momentum signals
4) A function that utilizes Color bars to identify the strength of the trend
5) Three customizable moving averages
6) Alerts direct to your email or phone
7) Advanced and customizable settings menu
8) Our software also includes a backtesting system that that allows users to test their trading strategies on historical data, to check how they would have performed in real-world market conditions. This can help refine a trading strategy and make more informed decisions.
------------------------------------------------------------------------------ 1) BUY AND SELL SIGNALS ---------------------------------------------------------------------------------
Our buy and sell signals are generated using a custom combination of RSI, MFI, and Stochastic RSI levels, as well as relevant MACD and Stochastic RSI crosses. These indicators are carefully analyzed to identify potential trading opportunities and determine optimal entry and exit points for trades.
RSI (Relative strength index) measures the strength of a security's price action, while the SRSI (Stochastic Relative Strength Index) is a momentum oscillator that measures the current price relative to its high and low range over a set period. The Money Flow Index (MFI) is another momentum indicator that uses both price and volume data to measure buying and selling pressure. MACD (Moving Average Convergence Divergence) is a popular technical indicator used in financial markets to analyze price trends and momentum.
▶ With our system, you'll be able to identify three different levels of buy signals:
◉ The first level of buy signal is represented by a 🐂 emoji and is a "Good Buy". This signal indicates a possible buying opportunity. It indicates that could be a good opportunity to enter in a long trade. It's important to note that, the "Good Buy" signal can sometimes be supplemented with a green "Bull" text and a flag plotshape positioned beneath the signal. In these scenarios, we categorize this as a "Good Buy Bull" signal.
◉ The second level of buy signal is represented by a 💰 emoji and is a "Great Buy". This signal indicates a stronger buying opportunity than the "Good Buy" signal.
◉ The third and strongest buy signal is represented by a 💎 emoji and is an "Incredible Buy". This signal indicates a stronger buying opportunity than the "Good Buy" and "Great Buy" signals
▶ With our system, you'll be able to identify three different levels of sell signals:
◉ On the sell side, the first level is represented by a 🐻 emoji and is a "Good Sell". This signal indicates a possible selling opportunity. It indicates that could be a good opportunity to exit a trade or open a short position. It's important to note that, the "Good Sell" signal can occasionally be accompanied by a red "Bear" text and a flag plotshape positioned beneath the signal. In such instances, we refer to this as a "Good Sell Bear" signal.
◉ The second sell signal is represented by a 🔨 emoji and is a "Great Sell". This signal indicates a stronger selling opportunity than the "Good Sell" signal.
◉ The third and strongest sell signal is represented by a 💀 emoji and is an "Incredible Sell". This signal indicates a stronger selling opportunity than the "Good Sell" and "Great Sell" signals.
------------------------------------------2) "BULLISH AND BEARISH REVERSAL CANDLES PLUS SUPPORT AND RESISTANCE LINES" ------------------------------------------------
Bullish and bearish reversal candles are specific candles that have more probability to reverse the trend.
Our trading indicator is designed to identify bullish and bearish reversal candles. Our method of detecting these pivotal candles combines conditions from buy and sell signals with pertinent divergences in Price, RSI, and Volume (OBV). The distinguishing factor, however, lies in recognizing significant shifts in market structure and liquidity grabs. To further enhance the credibility of our indicator, we've incorporated Bollinger Bands, serving as an additional layer in spotting potential trend reversals, particularly when aligned with long-wick candlesticks, engulfing patterns, and morning or evening star formations.
These candles are represented by blue and orange colors respectively by default. Additionally, the indicator also uses lines that are drawn at either the opening or closing of candles to help identify pivot points of support or resistance. These candles, lines color or shape are customizable in the settings menu.
How can I benefit the most from bullish reversal candles? To make the most of bullish reversal candles, a powerful strategy is:
E.g, 1D chart - Wait for the next 1 or 2 candles to close above the support line linked to the bullish reversal candle. For lower timeframes, it is recommended to wait for 2 or 3 candles before making a trading decision. A good tip is also to look for other signals (confluence), like a buy signal. Traders should decide based on their risk tolerance.
Here below we can see an example of a bullish reversal candle in the BTC/USDT, 1D, chart. The system identify a bullish reversal candle (blue color), the next 2 candles are green and closed above the support blue line, in addition we have other bullish signals (confluence).
How can I benefit the most from bullish reversal lines? Bullish reversal lines can help traders to identify key level of support and maintain control of their position until a clear break below occurs.
In the example below we se how the price retrace to the support line:
After touching the price bounce up.
How can I benefit the most from bearish reversal candles? To make the most of bearish reversal candles, a powerful strategy is:
E.g, 1D chart - Wait for the next 1 or 2 candles to close below the resistance line linked to the bearish reversal candle. For lower timeframes, it is recommended to wait for 2 or 3 candles before making a trading decision. Traders should decide based on their risk tolerance.
Here below we can see an example of a bearish reversal candle in the ETH/USDT, 1D, chart. The system identify a bearish reversal candle (orange color), the next candle is red and closes below the resistance orange line. A good tip is also to look for other signals (confluence), like a sell signal.
How can I benefit the most from bearish reversal lines? Bearish reversal lines can help traders to identify key level of resistance and maintain control of their position until a clear break above occurs.
In the example below we se how the price bounce back to the resistance line and get rejected.
------------------------------------------------------------------------- 3) BULL AND BEAR MOMENTUM SIGNALS -----------------------------------------------------------------------
We analyzed factors such as buy or sell signals, long or short confirmation signals, DMI crossup or crossdown and breaks of market structure (BOS) or change of character (CHoCh) to determine the strength and direction of the trend. These study give us bull trend or bear trend signals that can help traders identify potential trading opportunities and make informed decisions.
These conditions are represented by a green word "BULL" and a flag shape below (bull momentum) and by a red word "BEAR" and a flag shape above (bear momentum) respectively by default. These plots shapes are customizable in the settings menu.
How can I benefit the most from bull momentum signals? To make the most of bull momentum signals, a powerful strategy is:
E.g, 1D chart - Look for confluence. If bull signal comes with a "Good Buy 🐂" in the same candle the signal is more strong. Another good combo is to look for a bullish reversal candle prior or after this signal, usually within a range of 1/2 candles. For lower timeframes, it is recommended to wait 2/3 candles before making a trading decision.
In the picture below we can see an example of a bull momentum signal in the US500, 1D, chart.
How can I benefit the most from bear momentum signals? To make the most of bear momentum signals, a powerful strategy is:
E.g, 1D chart - Look for confluence. If bear signal comes with a "Good Sell 🐻" in the same candle the signal is more strong. Another good combo is to look for a bearish reversal candle prior or after this signal, usually within a range of 1/2 candles. For lower timeframes, it is recommended to wait 2/3 candles before making a trading decision.
In the picture below we can see an example of a bear momentum signal in combo with a sell signal, NETFLIX, 1D, chart.
-------------------------------------------------------------- 4) "COLOR BARS THAT INDICATE THE STRENGTH OF THE TREND -----------------------------------------------------
This code is responsible for changing the color of the bars on a chart based on certain conditions. The gradient colors are defined for green and red, and the algorithm checks if the current bar is within a certain range of either a bearish reversal or bullish reversal candle and whether the price is above or below certain exponential moving averages or if important break of market structure occurs.
Ultimately, this feature helps traders visually identify potential trends and market shifts and avoid getting distracted by price fluctuations. Please note that every gradient of color can be customize by the user. We set 3 different bullish colors and 3 different bearish colors.
Below the picture of the settings menu related to the bar color.
----------------------------------------------------------------------5)THREE CUSTOMIZABLE MOVING AVERAGES ----------------------------------------------------------------------
You can choose up to three moving averages, any length and any type like SMA, EMA, WMA, HMA, RMA, SWMA and VWMA. Furthermore, you have the freedom to adjust the color and width of the lines to your preference.
Below the picture of the settings menu related to the moving averages.
----------------------------------------------------------------------6) ALERTS DIRECT TO YOUR EMAIL OR PHONE --------------------------------------------------------------------
Our alert feature sends real-time notifications directly to your email or phone when a signal is generated, allowing you to take immediate action and stay ahead of the market.
With our system, you first establish your own rules for trading in the strategy tester - this includes your criteria for entering and exiting trades.
Once you've defined these conditions, our system will start sending you alerts. These alerts will be triggered whenever your specified conditions are met. So, if the market matches your 'enter trade' conditions, you'll receive an alert prompting. Similarly, when your 'exit trade' conditions are met, you'll receive another alert.
Remember, these alerts are purely based on the conditions you set.
Once the condition is met, you will receive alerts directly to your email or phone when enter and exit a trade based on your custom conditions. To make sure you receive these notifications click on notifications tab.
---------------------------------------------------------------7) ADVANCED AND CUSTOMIZABLE SETTINGS MENU----------------------------------------------------------------------
We designed Easy Trade indicators with traders in mind, so it's user-friendly, easy to navigate and users can customize inputs, style, and colors of every feature in the indicator's settings menu.
-----------------------------------------------------------------------8) EASY TRADE PRO - BACKTESTING SYSTEM----------------------------------------------------------------------
Easy Trade Pro features a highly effective and realistic backtesting system, designed to mirror as closely as possible the real-world scenarios of entering and exiting trades.
Step 1:
Open the settings menu of the Indicator.
Once opened the settings menu click on properties.
Decide on the capital you wish to invest. Choose whether to use contracts or USD and determine the size of your orders. For the sake of realism, we recommend not exceeding 25% of your capital per order. However, if you decide to utilize your entire capital, make sure to adjust your stop loss accordingly. For instance, if you have a capital of 10K and use 10K with a stop loss at 2%, your potential loss would be $200. Conversely, if you use only 2K of your 10K capital with a stop loss at 10%, you would still lose the same 2% of your capital. To make your simulation even more authentic, consider incorporating broker fees or commissions into your calculations. For example, spot market fees are typically around 0.10%. If you're backtesting markets with low liquidity, consider factoring in slippage as well.
Step 2:
Navigate to the 'Inputs' section and scroll down until you come across 'Backtesting System - Strategy Test'. Once you locate this, click on the box and activate the 'USE STRATEGY SYSTEM' option by checking the tick box.
Also You will then need to set a 'Start Date' and 'End Date', establishing a specific time period during which you wish to test your strategy.
Otherwise you can consider to use the deep backtesting feature.
Step 3:
It's now time to establish the conditions for entering a trade. You can choose from five different types of custom buy signals: Good Buy, Good Buy Bull, Great Buy, Incredible Buy, and Bullish Reversal. Note that 'Great Buy' and 'Incredible Buy' are rare signals, so we advise against using them frequently in mechanical strategy tests; instead, consider them more for manual live tests. For more consistent results, we recommend using the other buy signals.
After determining your preferred buy signal, you can choose how many confirmation candles you wish to wait for before entering a trade. A 'confirmation' means that if the next candle closes above the opening or closing price of the chosen buy signal, it's considered a confirmation. This could be the opening or closing price, depending on whether the candle is green (close > open) or red.
You can set the number of confirmation candles in different time frames: below 2h, between 2h and 10h, and above 10h.
Step 4:
It's now time to safeguard your trade by managing risk. You can choose to implement a stop loss, expressed in percentage terms, or opt for a trailing stop. A trailing stop is a type of stop loss order that moves with the market price. It is designed to protect gains by enabling a trade to remain open and continue to profit as long as the market price is moving in a favorable direction. However, the trade closes if the market price changes direction by a specified amount (the 'trailing stop distance').
Additionally, you can minimize losses and move the stop loss to your entry point once the price reaches a certain percentage of profit. This strategy can help secure potential gains while limiting the potential for losses.
Step 5:
Now it's time to set the conditions for exiting the trade. You have the option to divide your exit into a maximum of four parts, with each part representing 25% of the position size. For each take profit point, you can choose from three different custom sell signals: Good Sell, Good Sell Bear, and Bearish Reversal.
Similarly, the concept of confirmation candles also applies here, but in this case, the candles are not closing above. A 'confirmation' for a sell signal means that if the next candle closes below the opening or closing price of the selected sell signal, it's considered a confirmation. This could be the opening or closing price, depending on whether the candle is green (open > close) or red (close < open).
So, when you're looking to sell, a confirmation would occur if the next candlestick's closing price is lower than the opening or closing price of the candlestick that triggered the sell signal. This indicates a potential bearish trend, providing the confirmation to execute the sell order.
Additionally, we've introduced a feature that allows you to move your stop loss to the entry point whenever the first take profit (1TP) is reached, which equates to hitting one custom sell signal.
Step 6:
We've also designed an alternative method for taking profits. With this approach, you can choose to exit your position once a fixed percentage gain from the entry point is reached. For instance, you might decide to exit when a 10% profit is achieved. Similarly to the previous method, this approach allows you to choose up to four exit points and determine the proportion of your position you want to close at each stage.
Conclusion:
Easy Trade Pro provides users with various options for entering and exiting trades. To effectively utilize the indicator, we strongly recommend conducting thorough backtesting and considering the results across your preferred trading pairs. It is advisable to analyze a substantial number of trades, ideally exceeding 100 trades, to obtain reliable insights into the indicator's performance. This approach will help you gain a better understanding of how Easy Trade Pro aligns with your trading strategy and objectives.
❗Keep attention❗
It is important to note that no trading indicator or strategy is foolproof, and there is always a risk of losses in trading. While this indicator may provide useful information for making conclusions, it should not be used as the sole basis for making trading decisions. Traders should always use proper risk management techniques and consider multiple factors when making trading decisions.
It is also important to be aware of the limitations of simulated performance results. Hypothetical or simulated results do not represent actual trading, and since trades have not been executed, results may be over- or under-compensated for market factors such as lack of liquidity. Simulated trading programs are also designed with the benefit of hindsight, and no representation is being made that any account will achieve profits or losses similar to those shown. Therefore, our indicators are for informative purposes only and not intended to be used as financial advice.
We encourage traders to use our indicators as part of a well-rounded trading strategy and to always be aware of the risks involved in trading. Remember that past performance is not indicative of future results and always trade responsibly.

Regression Candle Conversion IndicatorHey everyone!
I got a pseudo-request a while ago for something like this, essentially the ability to track where another ticker would fall based on an alternative ticker.
I did create my ticker correlation reference indicator which directly looks at the correlation between 2 tickers. However, this is an indicator that operates on the same principle but is more pragmatic for trading.
What does it do?
Well, in keeping with the theme of what I call my indicators, this has a title that explains exactly what it does, "Regression Candle Conversion Indicator" or "RCCI" for short. It uses simple regression to convert one ticker to another. So while you are tracking one indicator, you can see where the expected value should fall on the other.
Applications?
The big application of this for me is being able to track where SPY/QQQ or IWM is falling during overnight trading sessions. Extended trading hours close at 8 pm NYSE time. After that, you have to guess where futures prices will put the ETF version of it. This indicator will allow you to track where, theoretically, the underlying ETF ticker will fall based on the current trading behaviour.
Some other applications are just the ability to track how similar or dissimilar one stock is to the other. For example, if we wanted to trade, say, Boeing using shares of DFEN or ITA (a defence specific ETF), here is what we get:
In the chart above we can see BA as the primary chart and ITA as the RCCI converted chart. We will see 2 major things that should cause us concern.
First, there is a really poor correlation between the two tickers. This indicates that ITA may not produce the best exposure if I am directly looking for Boeing exposure.
Second, there is a wide standard error. this means that the results that the RCCI is providing may be skewed up to +/- 2 points (as indicated by the standard error chart).
Let's take a look at BA and DFEN:
In the above, we can see that the correlation is not great, but the standard error is quite low.
This means that, while this may not be the best ticker for Boeing exposure, the RCCI is able to confidently calculate the ticker within +/- 0.50 cents based on BA's underlying data.
However, its important to note that it is not advisable to really rely on these results if the correlation is less than + 0.5 or greater than -0.5.
Let's take a look at a few more examples:
Above we have BA (NYSE) vs BA (NEO TSX CAD Hedged). We can see the strong relationship and high confidence calculations.
And some others:
SPX (primary) and ES1! (secondary):
RTY and IWM:
ES1! and SPY:
Customizations:
As you can see above, it is pretty straight forward. There are 3 options:
Lookback Length: Determines the length of assessment for correlation and the regression assessment.
Manual Ticker Input: The indicator will pull the data from your current chart and compare it against a manually selected indicator. You must tell the indicator which ticker you are comparing against.
Data Table: This will show you the data table which contains the standard error assessment and the correlation assessment. These are determined by your lookback length. The lookback length is defaulted to 500.
And that's the indicator! It's pretty straight forward. Hopefully you find it helpful, especially if you track futures during overnight sessions.
Leave your comments/questions and feedback below.
Thanks for checking it out!

VIX HeatmapVIX HeatMap
Instructions:
- To be used with the S&P500 index (ES, SPX, SPY, any S&P ETF) as that's the input from where the CBOE calculates and measures the VIX. Can also be used with the Dow Jones, Nasdaq, & Nasdaq100.
Description:
- Expected Implied Volatility regime simplified & visualized. Know if we are in a high, medium, or low volatility regime, instantly.
- Ranges from Hot to Cold: The hotter the heat-map, the higher the implied volatility and fear & vice versa.
- The VIX HeatMap, color-maps important VIX levels (7 in this case) in measuring volatility for day trading & swing trading.
Using the VIX HeatMap:
- A LOW level volatility environment: Represented by "cooler" colors (Blue & White) depicts that the level of volatility and fear is low. Percentage moves on the index level are going to be tame and less volatile more often than not. Low fear = low perceived risk.
- A MEDIUM level volatility environment: Represented by "warmer" colors (Green & Yellow) depicts that the markets are transitioning from a calmer period or from a more fearful period. Market volatility here will be higher and provide more volatile swings in price.
- A HIGH level volatility environment: Represented by "hotter" colors (Orange, Red, & Purple) depicts that the markets are very fearful at the moment and will have big swings in both directions. Historically, extreme VIX levels tend to coincide with bottoms but are in no way predictive of the exact timing as the volatile moves can continue for an extended period of time.
- Transitioning between the 7 VIX Zones: Each and every one of these specific VIX zone levels is important.
1. Extreme low: <16
2. Low: 16 to 20
3. Normal: 20 to 24
4. Medium: 24 to 28
5. Med-High: 28 to 32
6. High: 32 to 36
7. Extreme high: >36
- These VIX levels in particular measure volatility changes that have a major impact on switching between smaller time frames and measuring depths of a sell move and vice versa. Each level also behaves as its own support & resistance level in terms of taking a bit of effort to switch regimes, and aids in identifying and measuring the potential depth of pullbacks in bull markets and bounces in bear markets to reveal reversal points.
- Examples of VIX level supports depicted on the chart marked with arrows. From left to right:
1. March 10th: Markets jumped 2 volatility levels in 2 days. The fluctuations from blue to yellow to green where a sign that price action would reverse from the selloff.
2. March 28th: As soon as we move from green to the blue VIX level (<20), markets began to rally and only ended when the volatility level moved sub VIX 16 (white).
3. May 4th & 24th: Next we see the 2 dips where volatility levels went from blue to green (VIX > 20), marked bottoms and reversed higher.
4. June 1st: We see a change in VIX regime yet again into lower VIX level and markets rocket higher.
Knowing the current VIX regime is a very important tool and aid in trading, now easily visualized.

Correlation TrackerCorrelation Tracker Indicator
The Correlation Tracker indicator calculates and visualizes the correlation between two symbols on a chart. It helps traders and investors understand the relationship and strength of correlation between the selected symbol and another symbol of their choice.
Indicator Features:
- Correlation Calculation: The indicator calculates the correlation between two symbols based on the provided lookback period.
- Correlation Scale: The correlation value is normalized to a scale ranging from 0 to 1 for easy interpretation.
- Table Display: A table is displayed on the chart showing the correlation value and a descriptive label indicating the strength of the correlation.
- Customization Options: Users can customize the text color, table background color, and choose whether to display the Pearson correlation value.
- The Correlation Tracker indicator utilizes a logarithmic scale calculation, making it particularly suitable for longer timeframes such as weekly charts, thereby providing a more accurate and balanced measure of correlations across a wide range of values.
How to Use:
1. Select the symbol for which you want to track the correlation (default symbol is "SPX").
2. Adjust the lookback period to define the historical data range for correlation calculation.
3. Customize the text color and table background color according to your preference.
4. Choose whether to display the Pearson correlation value or a descriptive label for correlation strength.
5. Observe the correlation line on the chart, which changes color based on the strength of the correlation.
6. Refer to the correlation table for the exact correlation value or the descriptive label indicating the correlation strength.
Note: The indicator can be applied to any time frame chart and is not limited to logarithmic scale.

AggBands (v1) [qrsq]The "AggBands" indicator is a custom trading indicator designed to provide a consolidated view of the price action across multiple assets or trading pairs. It combines the price data from multiple tickers and calculates an aggregated price using user-defined weights for each ticker.
The indicator starts by defining the tickers to be included in the aggregation. You can choose from predefined configurations such as "BTC PAIRS," "CRYPTO TOTAL MARKET CAP," "TOP 5 PAIRS," "TOP 5 MEMECOINS," "SPX," "DXY," or "FANG." Each configuration includes specific tickers or indices relevant to the chosen category.
The indicator then fetches the closing, high, and low prices for each ticker and applies the user-defined weights to calculate the aggregated prices. The aggregated prices are normalized within a specified length to provide a consistent scale across different assets or pairs.
Next, the indicator calculates the midpoint, which is the average of the highest high and lowest low of the aggregated prices over a specified aggregation period.
To assess the volatility, the indicator calculates the price range and applies the Average True Range (ATR) indicator to determine the volatility value. The standard deviation is then computed using the price range and aggregation period, with an additional scaling factor applied to the volatility value.
Based on the standard deviation, the indicator generates multiple bands above and below the midpoint. By default, three standard deviation bands are calculated, but the user can choose between one and five bands. The upper and lower bands are smoothed using various moving average (MA) types, such as Simple Moving Average (SMA), Exponential Moving Average (EMA), Smoothed Moving Average (SMMA/RMA), Weighted Moving Average (WMA), Volume Weighted Moving Average (VWMA), Volume Weighted Average Price (VWAP), or Arnaud Legoux Moving Average (ALMA). The user can also adjust the length, offset, and sigma parameters for the moving averages.
The indicator can optionally smooth the midpoint, upper bands, and lower bands using a separate set of moving average parameters.
The indicator can be useful for traders and analysts who want to gain a consolidated view of price movements across multiple assets or trading pairs. It helps identify trends, volatility, and potential support and resistance levels based on the aggregated price and standard deviation bands. Traders can use this information to make informed decisions about trading strategies, risk management, and market analysis.

[TTI] Fed Net Liquidity Indicator📜 ––––HISTORY & CREDITS
The Fed Net Liquidity Indicator is a tool developed after reading Max Anderson's twitter thread. This indicator is based on the calculation of the Fed's balance sheet, the Treasury General checking account, and what banks are parking at the overnight repo window at the Fed. The net of these three components gives us the net liquidity available to the markets, which is considered the fuel behind market moves.
🎯 ––––WHAT IT DOES
The Fed Net Liquidity Indicator provides a visual representation of the net liquidity levels in the market. It plots the SPX along with blue shading that represents the net liquidity levels. It also includes risk on/risk off signals and a fair value line that measures whether the market is overbought or oversold compared to the net liquidity readings.
The indicator also includes two levels for overbought and oversold conditions. The "short/hedge" level indicates that the market is becoming overbought and it's time to reduce risk-on positions. The "euphoric" level indicates extreme overbought conditions and it's time to actively short the market or exit. On the other side, the "bounce" line indicates oversold conditions and a potential short-term pop, while the "capitulation" level indicates extreme oversold conditions and a potential for a significant bounce.
🛠️ ––––HOW TO USE IT
To use the Fed Net Liquidity Indicator, you first need to set it up on your chart. Once set up, you can use it to guide your trading decisions based on the net liquidity levels, risk on/risk off signals, and the fair value line.
👉Follow the net liquidity levels: The market generally follows the net liquidity. If the liquidity is increasing, the market tends to go up, and if the liquidity is decreasing, the market tends to go down.
👉Pay attention to risk on/risk off signals: These signals can help you understand the market environment and adjust your positions accordingly. A risk-on signal indicates a good time to expose yourself to the market and go long on risk assets like stocks and crypto. A risk-off signal indicates that it's time to exit the market, hedge your positions, or go short.
👉Use the fair value line: This line can help you determine whether the market is overbought or oversold compared to the net liquidity readings. If the market is rising steeply but the liquidity is not confirming that, it could indicate overbought conditions. Conversely, if the market is falling but the liquidity is not confirming that, it could indicate oversold conditions.
👉Consider the overbought and oversold levels: These levels can help you identify potential tops and bottoms in the market. If the market reaches the short/hedge level, it's time to reduce risk-on positions. If it reaches the euphoric level, it's time to actively short the market or exit. On the other side, if the market reaches the bounce line, it could indicate a potential short-term pop. If it reaches the capitulation level, it could indicate a potential for a significant bounce.

Fundamental Strength IndicatorName of the indicator: Fundamental Strength Indicator
A brief description of the indicator:
Using this indicator, you can evaluate a company in terms of the strength of its financial performance and see how that score has changed over time.
The background to the creation of the indicator:
The main idea that inspired me to create this indicator is: " Even if you buy just 1 share of a company, treat it like buying the whole business ". However, when I need to evaluate the business of thousands of public companies traded on exchanges, there is an objective difficulty: it is very time-consuming. To solve this problem, I had to create a scoring system of the fundamental analysis of the company, embodied in this indicator.
What the indicator looks like:
- First, it is a Histogram with bars of three colors: green, orange, and red. The width of the histogram depends on the depth of data from the company statements. The more historical data, the wider the histogram over time.
The green color of the bars means that the company has been showing excellent financial results by the sum of the factors in that time period. According to my terminology, the company has a " strong foundation " during this period. Green corresponds to values between 8 and 15 (where 15 is the maximum possible positive value on the sum of the factors).
The orange color of the bars means that according to the sum of factors during this period the company demonstrated mediocre financial results, i.e. it has a " mediocre foundation ". Orange color corresponds to values from 1 to 7.
The red color of the bars means that according to the sum of factors in this period of time, the company demonstrated weak financial results, i.e. it has a " weak foundation ". The red color corresponds to values from -15 to 0 (where -15 is the maximum possible negative value on the sum of factors).
- Second, this is the Blue Line , which is the moving average of the Histogram bars over the last year (*). Averaging over the year is necessary in order to obtain a weighted estimate that is not subject to medium-term fluctuations. It is by the last value of the blue line that the actual Fundamental Strength of the company is determined.
(*) The last year means the last 252 trading days, including the current trading day.
- Third, these are operating, investing, and financing Cash Flows expressed in Diluted net income. These flows look like thick green, orange, and red lines, respectively.
- Fourth, this is the Table on the left, which shows the latest actual value of the Fundamental Strength and Cash Flows.
Indicator settings:
In the indicator settings, I can disable the visibility of the Histogram, Blue Line, Cash Flows (each separately), and Table. It helps to study each of the parameters separately. It is also possible to change the color, transparency, and thickness of lines.
Mandatory requirements for using the indicator:
- works only on a daily timeframe;
- only applies to shares of public companies;
- company financial statements for the last 4 quarters and more are required;
- it is necessary to have the data from the Balance sheet, Income statement, and Cash flow statement, required for the calculation.
If at least one component required for calculating the Fundamental Strength is missing, the message " no data to calculate the Fundamental Strength correctly " is displayed. In the same case, but for the operating cash flow, the message " no data to calculate the Operating Cash Flow correctly " is shown, and similarly for other flows.
What is the value of the Fundamental Strength Indicator:
- allows for a quantitative assessment of a company's financial performance in points (from -15 to 15 points);
- allows you to visually track how the company's financial performance has changed (positively/negatively) over time;
- allows to visually trace the movement of main cash flows over time;
- speeds up the process of selecting companies for your shortlist (if you are focused on financial results when selecting companies);
- allows you to protect yourself from investing in companies with weak and mediocre fundamentals.
Indicator calculation methodology:
Guided by the "Treat stock investments as buying the whole business" approach, you can imagine what kind of business an investor is interested in owning and simultaneously determine the input parameters for calculating the indicator.
(!) Here it is important to emphasize that the idea of a benchmark business for investment is a subjective notion, so be sure to check whether it coincides with your own opinion.
For me, a benchmark business is:
- A business that operates efficiently without diminishing the return on shareholders' investment. To assess the efficiency and profitability of a business, I use the following financial ratios (*): Diluted EPS and Return on Equity (ROE). The first two parameters for calculating the indicator are there.
- A business that scales sales and optimizes its costs. From this point of view, the following financial ratios are suitable: Gross margin, Operating expense ratio, and Total revenue. Plus three other metrics.
- A business that turns goods/services into cash quickly and does not fall behind on payments to suppliers. The following financial ratios will fit here: Days payable, Days sales outstanding, and Inventory to revenue ratio. These are three more metrics.
- A business that does not resort to significant accounts payable and shows financial strength. Here I use the following financial ratios: Current ratio, Interest coverage, and Debt to revenue ratio. These are the last three parameters.
(*) If you want to learn more about these financial ratios, I suggest reading my two articles on TradingView:
Financial ratios: digesting them together
What can financial ratios tell us?
Next, each of the parameters is assigned a certain number of points based on its last value or the position of that value relative to the annual maximum and minimum.
For example, if the Current ratio:
- greater than or equal to 2 (+1 point);
- less than or equal to 1 (-1 point);
- more than 1 but less than 2 (0 points).
Or for example, if Diluted EPS:
- near or above the annual high (+2 points);
- near the annual minimum and below (-2 points);
- between the annual maximum and minimum (0 points).
And so on with each of the parameters.
As a result, the maximum number of points a company can score is 15 points. The minimum number of points a company can score is -15 points. These levels are marked with horizontal dotted lines: the green line is for the maximum value, and the red line is for the minimum.
I track the number of points for each day of a company's life on a three-color Histogram. The resulting average value for the last year is on the Blue Line. For me, it is the last value of the Blue Line that determines - this is the actual Fundamental Strength of the company.
The business valuation model I created is more suitable for companies that produce goods or services, and where tangible assets play a significant role in the business. For example, when analyzing companies in the financial sector, you may see the message "no data to calculate the Fundamental Strength correctly". Many of them may simply be missing data that is used as input for the calculation: Inventory to revenue ratio, Days sales outstanding, etc.
Examples:
Below I will evaluate various companies using the Fundamental Strength Indicator.
Tesla, Inc.
The indicator shows that since 2020, Tesla Inc. has been steadily increasing its Fundamental Strength (from 3.27 in Q1 2020 to 12.79 in Q1 2023). This is noticeable both by the color change of the Histogram from orange to green and by the rising Blue Line. If you look in detail at what has been happening with the financials during this time, it's clear what meaningful work the company has done. Revenues have almost quadrupled. Earnings per share have increased 134 times. At the same time, total debt to revenue fell almost 10 times.
Keurig Dr Pepper Inc.
The company, formed in 2018 by the merger of Keurig Green Mountain and Dr Pepper Snapple Group, has failed to deliver outstanding financial results, causing its Fundamental Strength to fall from 4.63 in Q1 2018 to -0.53 in Q1 2023. During this period, the drop in diluted earnings per share was accompanied by higher debt and deteriorating liquidity.
Costco Wholesale Corporation
Wholesaler Costco has been surprisingly stable in its financial performance and with steady growth in both earnings and revenue. This is the reason why the Histogram bars are exceptionally green throughout the calculation of the indicator. The Fundamental Strength has not changed in three years and is high at 11 points.
As an additional filter, for example, when comparing two companies where all other conditions are equal - I use the dynamics of Cash Flows expressed in Diluted net income (*). These are the thick green, orange, and red lines over the Histogram.
Why do I use income as a unit of measure of Cash Flows? Because it is a good way to make the scale of indicator values the same for companies from different countries, with different currencies. It also allows you to use a single value scale for both Cash Flows and Fundamental Strength.
(*) If you want to learn more about Cash Flows, I suggest reading my two articles on TradingView:
Cash flow statement or Three great rivers
Cash flow vibrations
So, an additional filter shows the dynamics of Cash Flows over time.
To interpret the dynamics of Cash Flows, I pay attention to the following patterns:
- How the cash flows are positioned in relation to each other;
- In which zone each of the cash flows is located - in the positive or negative;
- What is the trend of each of the cash flows;
- How volatile each of the cash flows is.
As an example, let's look at several companies in order to interpret the dynamics of their Cash Flows.
John B. Sanfilippo & Son, Inc.
This is the most ideal situation for me: operating cash flow (green line) is above the other cash flows, investment cash flow (orange line) is near zero and practically unchanged, and financial cash flow (red line) is consistently below zero. This picture shows that the company lives off its operating cash flow, does not increase its debt, does not spend a substantial amount of money on expensive purchases, and retains (does not sell off) assets.
Parker Hannifin Corporation
With stable operating cash flow (green line), the company implements investment programs by raising additional funding. This is noticeable due to an increase in financial cash flow (red line) and a simultaneous decrease in investment cash flow (orange line) with a significant deepening into negative areas. Apparently, there is not enough operating cash flow to realize the planned investments. One has to wonder how sustainable a company can be if it invests in its development using borrowed funds without a subsequent increase in operating cash flow.
Schlumberger N. V.
The chaotic intertwining of cash flows outside of the Fundamental Strength range (-15 to 15) is indicative of the company's rich life, but to me, it is an indicator of high riskiness of its actions. And as we can see, Fundamental Strength has only begun to strengthen in the last year, when the external appearance of cash flow has normalized.
Risk disclaimer:
When working with the Fundamental Strength Indicator and the additional filter in the form of Cash Flows, you should understand that the publication of the Balance sheet, Income statement, and Cash flow statement takes place sometime after the end of the financial quarter. This means that new relevant data for the calculation will only appear after the publication of the new statements. In this regard, there may be a significant change in the values of the Indicator after the publication of new statements. The magnitude of this change will depend both on the content of the new statements and on the number of days between the end of the financial quarter and the publication date of the statements. Until the date of publication of the new statements, the latest relevant data will be used for calculations.
I would like to draw your attention to the fact that the calculation of Fundamental Strength and Cash Flows requires the availability of data for all parameters of the valuation model . It uses data that is exclusively available on TradingView (there is no reconciliation with other sources). If at least one parameter is missing, I switch to another company's analysis to continue using the indicator.
Thus, the Fundamental Strength Indicator and an additional filter in the form of Cash Flows make it possible to evaluate the financial results of the company based on the available data and the methodology I created. A simple visualization in the form of a three-color Histogram, a Blue line, and three thick Cash Flow lines significantly reduces the time for selecting fundamentally strong companies that fit the criteria of the selected model. However, this Indicator and/or its description and/or examples cannot be used as the sole reason for buying or selling stocks or for any other action or inaction related to stocks.
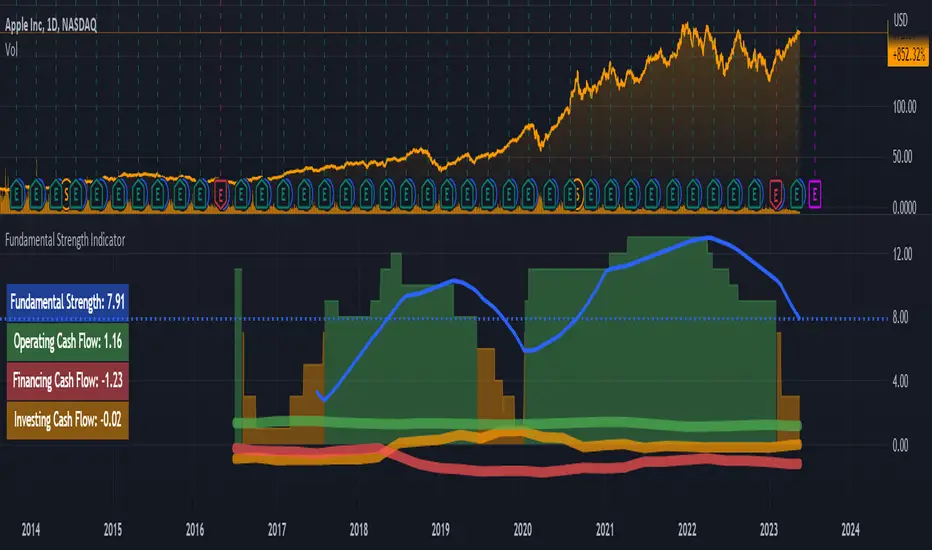
[TT] Sectors Dist % From MA- The script shows the distance in percentages from the 200 MA (or any other MA period) , for the 11 SP500 sectors.
- It works based on the current time frames.
Could be useful when working with mean reversion strategies to detect extremes zones and overbought/oversold conditions in the given sectors compared others.

Divergences in 52 Week Moving Averages, Adjusted and SmoothedThis script description is intended to be holistic and comprehensive for the understanding of the interested parties who view the script.
Following the PineCoders suggestions, I have provided detailed breakdowns both within the code and in the description immediately below:
► Description
This description is intended to be detailed and meaningful, conveying the understanding of the script’s intention to the user:
The theory: Divergences and extreme readings in 52-Week highs on major indexes can provide a view into a potential pending move in the opposite direction of how the market has been trending. By comparing the 52-Week Hi/Lo indices and applying an Exponential Moving Average (EMA), we can assess how extreme a move is from the average. If the move provides an extreme reading, it would potentially be beneficial to “fade” the move (take a position in the opposing direction).
The intention: The intentionality of this script is to provide a visualization of when the highly-probable opportunity to fade over a multi-day or multi-week period arises. In addition to this, based on backtesting prior moves and reading the various levels of significant reversals, three tiers: “Standard”, “Sensitive”, and “Highly Sensitive” have been applied, the user can choose which sensitivity level they would like to see, there are far less false positives on the Standard and Sensitive settings, while Highly Sensitive often signals multiple times with the move coming a few days later.
The application: The settings allow the user to customize their sensitivity to the fade signals, with the ability to customize the visual that shows up as well. For higher-highs that are fade-worthy, the signal will appear on the top of the candle, for lower-lows that are fade-worthy, the signal will appear on the bottom of the candle. The users risk criteria should be the primary driver of the entry/exit, although when backtesting it appears that the significant move is typically completed within a 2-4 week period at max and 3-5 day period at minimum.
A personal note: I am a futures trader intraday but would very strongly caution users when using this strategy with futures (unless their risk tolerance is higher than most). The most beneficial strategy when fading moves would be to enter in tranches, starting at the first signal and adding on any pullback (as long as the pullback is not below the initial entry point). 1-6 Week Date-To-Expiry options would be the primary method for applying this strategy. I would also like to add that SPY/SPX options (SPDR S&P 500 ETF Trust / CBOE S&P 500 Index) are the most liquid options that could be applied in this strategy.
► Description (additional)
With the understanding that few users can read pinescript (Pine), the description above contains all of the necessary information that is necessary for a user to understand the intention for script utilization. For those who do understand Pine, the code is commented in each section in order to provide an understanding of the underlying functions, calculations, and thought process that went on during the writing of the script.
► Description (additional)
This script’s description contains no delegations, all aspects of the script as well as the initial idea behind it are contained in the description above, which is self-contained in it’s entirety with a clear and defined purpose that is written with the intent to holistically capture the intent of the potential use for this indicator.
► General House Rule #2
This script and the description (as well as my profile) contain no links or associations to promotion of any kind, I am not a business, I am not an individual that will in any way make money from this script or the promotion of another person, idea, company, entity, or legal persons (foreign or domestic).
► Originality and usefulness
This is an original and custom script (and idea) that is not a rehashing or a copy of any code from any other programmers in the tradingview community.