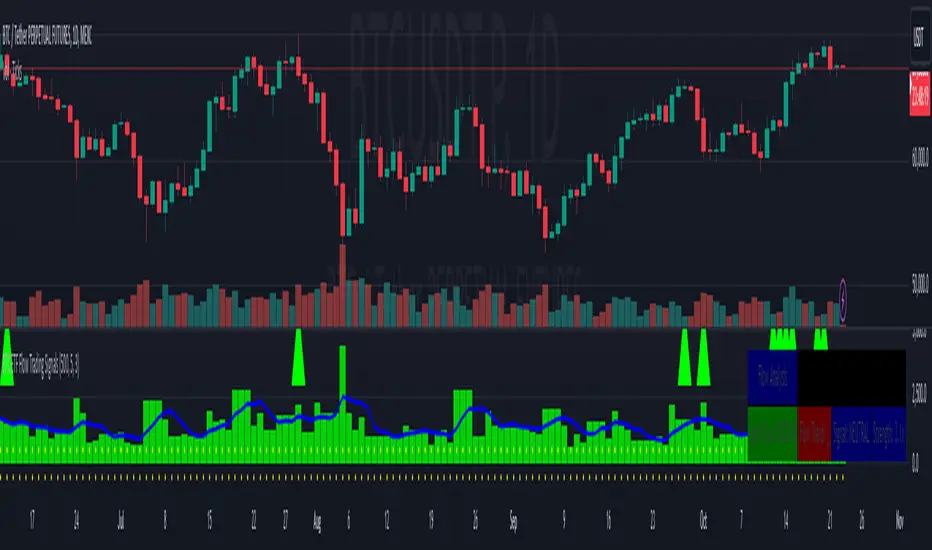
BTC ETF Flow Trading SignalsTracks large money flows (500M+) across major Bitcoin ETFs (IBIT, BTCO, FBTC, ARKB, BITB)
Generates long/short signals based on institutional money movement
Shows flow trends and strength of movements
This script provides a foundation for comparing ETF inflows and Bitcoin price. The effectiveness of the analysis depends on the quality of the data and your interpretation of the results. Key levels of 500M and 350M Inflow/Outflow Enjoy
Collaboration with Vivid Vibrations
Enjoy & improve!
Cari dalam skrip untuk "track"

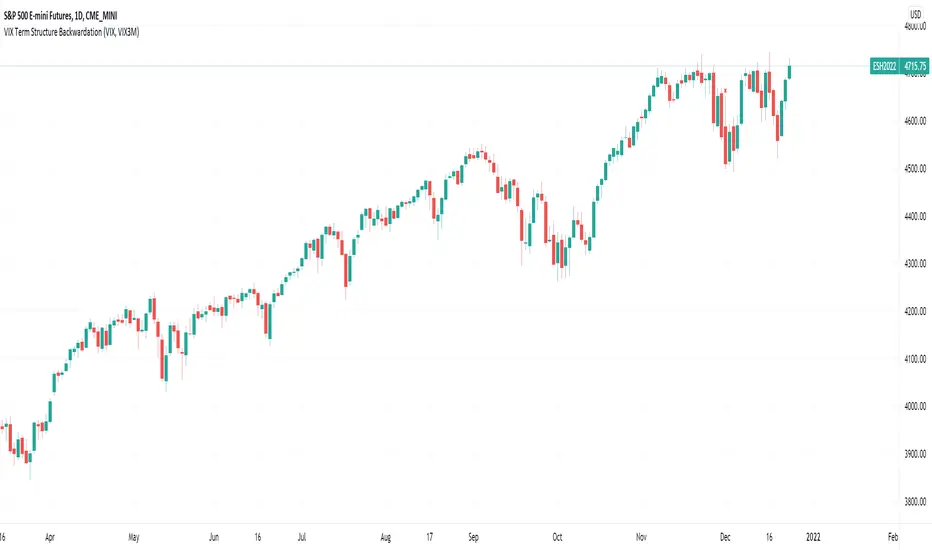
VIX Term Structure BackwardationTracks backwardation of the VIX Term Structure using the difference between 2 custom durations VIX / VIX3M /VIX6M/VIX1Y
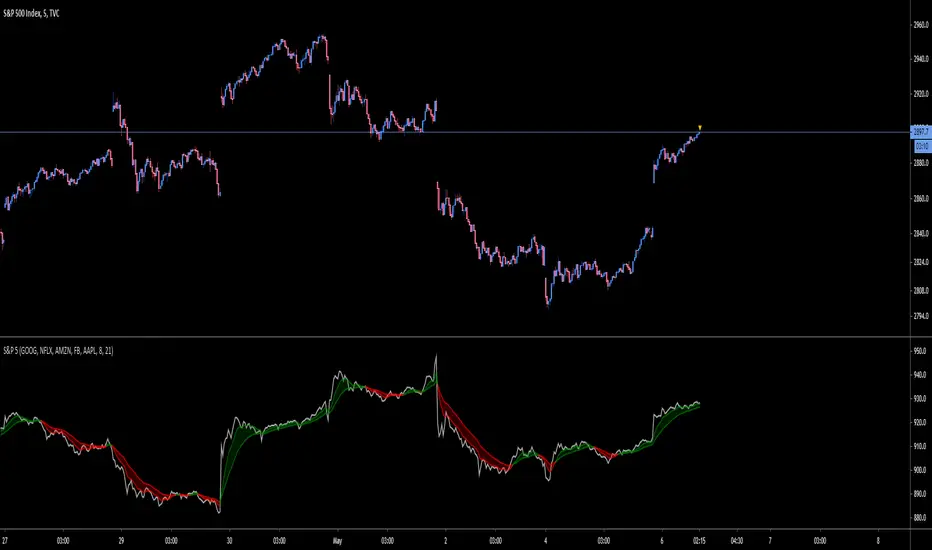
S&P 5Tracks the 5 largest stocks by market cap in the S&P 500. As of May 2020 they make up 50% of the index
SMA & EMA Simple CrossoverTracks and highlights trends by using a simple SMA and EMA indicator. When a shorter SMA (default set to 10 periods) and a longer EMA (default set to 20 periods) cross over, a cross is placed upon the chart at the crossover point. Defaults settings for the periods and colours can be changed the user to meet their own preferences using the settings button (i.e. without having to edit the script).

BTC Traffic LightsTracks BTC price of various exchanges across several time frames
Time frames:
1 minute
5 minutes
15 minutes
30 minutes
1 hour
4 hour
8 hour
1 day
8 red lights: dump incoming
8 green lights: pump incoming


weekend rally bloody mondayTracks the gain-loss of the price on Mondays and the range gain-loss from Monday (configurable) to Sunday. Then, it identifies Sunday's pumps that end with a Monday dump.

Moving Gain Loss PercentTracks the percentage gain/loss in three ranges:
single candle (can be turned on or off)
custom range of candles
custom range of candles
For example, with a range of 3 candles, and the serie:
1 - close 10
2 - close 5
3 - close 20
The moving gain would be:
1 - close 10 - gain 10, infinite%
2 - close 5 - gain 5, infinite%
3 - close 18 - gain 8, 80%
Or, for example if the range is 12 candles on a monthly chart, then the result is the Year-To-Date gain/loss plotted as a percentage.

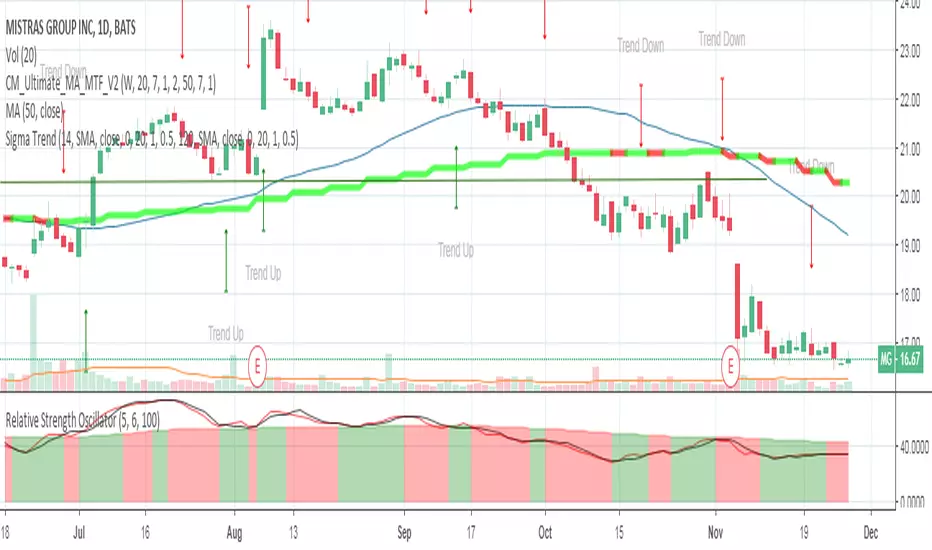
Relative Strength OscillatorTracks an EMA and SMA of the 14 day RSI. Also avoids the market with 14 day RSI is above 90.
Buy when green, sell when red.
BLUE TREND PRESSURETracks buying and selling pressure with unique multi-timeframe algo. No repainting so far. Current version works on 1H TF only. Blue is a buy signal, orange short signal.


Average Price BUY-SELL_Bulent-V2Tracking prices that you have defined and trigger the crossing of them

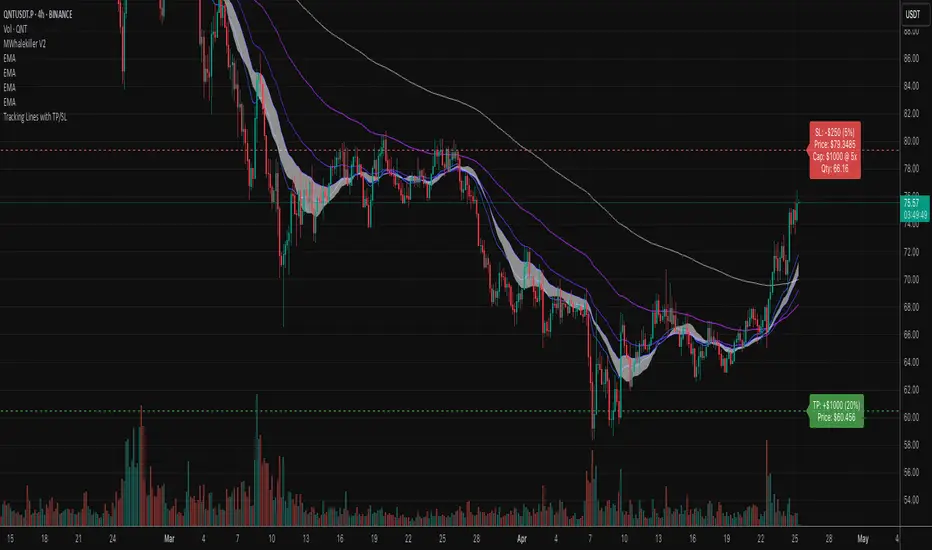
Tracking Lines with TP/SL + Labels at LeftA simple indicator so you can set your TP and SL tolerance along with capital and leverage.
A red line and green line will represent where current TP and SL would be on the chart along with the number of tokens you need to trade to meet the USD capital to be trades.
Just gives a visual representation of SL to key zones on the chart so you can judge scalp entries a little better :)
Cumulative Price Change %Tracking cumulative percentage change in price for each candle over a period.


MSTR mNAV indicatorTrack and compute MicroStrategy's mNAV (EV divided by BTC reserve value) over time.
- compute method: www.strategy.com
- data source: www.strategy.com

Current Session H/L — EvolvingTrack the current session high and low as it's formed. Lines are projected back to previous sessions and forward in time. Bot projections are adjustable.

Wallet Follower - [Silver-Wong]Track your active positions directly on your chart with a simple, clear display.
Key Features:
- Displays a summary table of up to 5 custom positions.
- Real-time calculation of P/L (%) and net gain/loss based on your entry price and quantity.
- Automatically updates with live prices.
- Works with any symbol: crypto, stocks, forex...
- Customizable display: text size and screen position.
Why use it?
Save time and keep a precise overview of your portfolio without leaving your chart. Ideal for both active traders and long-term holders.

ADR TableTrack volatility and session momentum in real-time with customizable precision.
Key Features:
Average Daily Range (ADR): Configurable length (default 5 days), based on previous daily high–low ranges.
Session Anchor Options: Choose anchor at 4 am NY, 6 pm NY, 9:30 am NY, 8:30 am NY, Previous Day Close, or Current Bar.
Session Range & %ADR: Displays the real-time range from the chosen anchor, plus what percentage of ADR has been covered.
High / Low Target Levels: Calculates ADR targets based on anchor: anchor ± ADR.
Optional Target Lines: Draw horizontal lines for high and low targets across the session; customize color and width.
Dynamic Table Display: User-selectable table size and text size (Tiny to Huge) for optimal readability.
Robust Anchor Logic: Uses the first bar at-or-after anchor time each NY day, ensuring stability even on irregular intraday timeframes.
How to Use
Choose your anchor in settings.
View ADR, session range (with %ADR), and target price levels in the top-right pane.Toggle High/Low lines to overlay targets on the chart.
Adjust table and text size to match your workspace.
Why It Matters
Quickly assess where price stands relative to typical volatility.
Easily identify intraday price exhaustion or breakout zones.
Anchor flexibility enables use for both futures and equities, aligning with your trading session.
Clean, professional display—no clutter, no guesswork.
