ZenAlgo - SessionsZenAlgo - Sessions is a robust TradingView indicator designed to analyze and visualize global trading sessions (Asian, European, and US). By combining session-specific price levels, volume and delta tracking, and historical performance metrics, it delivers actionable insights for session-based trading strategies, simplifying decision-making in dynamic markets.
Features
Session Highlighting: Distinguishes trading sessions with customizable colors for easy identification.
Session Levels: Dynamically calculates and projects five key levels (0%, 25%, 50%, 75%, 100%) to identify support and resistance zones.
Volume and Delta Tracking: Tracks session-specific total volume, inflows, outflows, and delta to assess market sentiment.
Interactive Performance Table: Summarizes recent session metrics, including win/loss percentages, volume, and delta, enabling trend analysis.
Historical Analysis: Retains session performance data for up to 100 sessions, providing insights into long-term trends.
Dynamic Range Projection: Extends session levels into subsequent sessions, maintaining market context.
Customizable Time Zones: Adapts session tracking to any trading environment.
Added Value: Why Is This Indicator Original/Why Shall You Pay for This Indicator?
1. Synergy Between Indicators
Session Levels: Highlight key market zones that guide entry/exit points.
Volume and Delta Metrics: Clarify price action at these levels by identifying buyer/seller dominance.
Performance Metrics: Aggregate historical session data, helping traders identify recurring patterns, sentiment shifts, and session-specific tendencies.
Together, these features amplify one another, creating actionable insights that exceed the value of standalone tools.
2. Comparison to Freely Available Indicators
Traditional indicators like Bollinger Bands, RSI, or Moving Averages operate on broad price action trends. ZenAlgo - Sessions focuses on session-specific patterns, volume dynamics, and real-time updates, delivering more context-specific insights.
By consolidating multiple functionalities into one tool, it eliminates the need for multiple separate indicators, streamlining analysis.
3. Why Pay for This Indicator?
Comprehensive Insights: Delivers session-specific metrics unavailable in standalone tools.
Real-Time Updates: Ensures metrics and levels reflect the latest market movements.
Seamless Integration: Combines price action, volume, and historical performance into a single, intuitive interface.
How It Works
1. Session Detection
Defines sessions for Asia, Europe, and the US based on fixed opening and closing times. Time zones ensure compatibility with global markets, excluding weekends and holidays for relevance.
2. Price Levels
Calculates five levels (0%, 25%, 50%, 75%, 100%) based on session high and low, projecting these into subsequent sessions for continued analysis.
3. Volume and Delta Metrics
Tracks session volume, separating inflows and outflows based on price movements.
Calculates delta to gauge net buying/selling activity.
4. Performance Metrics
Tracks win/loss rates and percentage changes across sessions.
Stores session metrics (volume, delta, win/loss) for up to 100 sessions.
5. Dynamic Visualization
Continuously updates session levels and metrics in real time for actionable insights.
Usage Examples
Support/Resistance Levels: Use session levels, especially the 50% midline, as potential pivot points for trades.
Breakout Analysis: Monitor price action beyond session highs or lows to confirm breakouts.
Volume Trends: Compare session volumes to identify high-activity periods.
Delta Shifts: Assess delta changes to determine market sentiment at key levels.
Session Comparison: Identify which session drives significant activity using the performance table.
Multi-Session Strategies: Plan trades based on extended session levels to anticipate reactions at previously tested zones.
Settings
Asia Session Color: Adjust the highlight color for the Asian session.
Europe Session Color: Customize the color for the European session.
US Session Color: Define the color for the US session.
Time Zone: Set the time zone for session tracking.
Line Transparency: Adjust session line opacity.
Number of Sessions for Total Count: Define how many sessions to analyze in the performance table.
Important Notes
This indicator is a technical analysis tool and does not guarantee trading success. Use it alongside other indicators and fundamental analysis for a comprehensive trading strategy.
Combine with Other Tools: Use complementary indicators such as RSI, Bollinger Bands, or ATR to filter out unreliable signals and improve accuracy.
Known Weaknesses and Mitigation Strategies
1. Extreme Volatility
Issue: During sudden, significant price movements (e.g., news-driven events), session levels and delta metrics may become less reliable as the market temporarily disregards historical patterns.
Mitigation: Combine ZenAlgo - Sessions with volatility indicators like ATR (Average True Range) or a news alert system to adjust expectations during these periods.
2. Low Liquidity Periods
Issue: During holidays or outside peak trading hours, session metrics may misrepresent actual market activity due to reduced participant involvement.
Mitigation: Focus on sessions with higher activity (e.g., overlapping US and European sessions) to ensure more accurate insights.
3. Non-Standard Trading Hours
Issue: Market-specific differences, such as extended hours or daylight saving adjustments, can misalign session boundaries.
Mitigation: Verify session times align with your market and adjust settings accordingly.
4. Historical Data Dependencies
Issue: Historical metrics rely on consistent session patterns; deviations (e.g., extended or shortened sessions) can impact trend accuracy.
Mitigation: Regularly review and interpret historical data alongside real-time metrics to ensure alignment.
Cari dalam skrip untuk "track"

Leverage Aware Trade OptimizerWelcome to the Leverage-Aware Trade Optimizer (LATO)! I’m thrilled to have you exploring this dynamic algorithm! LATO combines advanced market oscillation tracking, leverage-aware trade optimization, and real-time market analysis to help you make smarter, more informed trading decisions. Whether you're just starting or you’re an experienced trader, LATO provides powerful tools and insights to enhance your strategies. LATO is here to support you in optimizing your trades with precision, so feel free to dive in and explore all the features. Let’s make your trading experience as effective and rewarding as possible. Safe trading!
Leverage-Aware Trade Optimizer (LATO)
Short Title: LATO
Category: Trading Tools / Technical Analysis
Overview
The Leverage-Aware Trade Optimizer (LATO) is a powerful algorithm designed to track and analyze market oscillations, identify reversal zones, and provide dynamic trading levels for optimal decision-making. With built-in risk management features, LATO enhances traders’ ability to make well-informed decisions based on a comprehensive range of market indicators, including price oscillations, probabilities, and leverage-related risks.
Key Features
Comprehensive Market Oscillation Tracking: LATO utilizes advanced indicators such as the Indexed Position Oscillator (IPO), Candle Relative Percentage (CRP), and Oscillating Range Indicator (ORI) to track price fluctuations and detect key market oscillations, providing a detailed view of price movements.
Dynamic Price Levels for Trading Decisions: The script calculates critical price levels such as WAP, WBP, XAP, and XBP. These weighted and expanded prices help identify potential support and resistance zones for accurate trade entries and exits.
Reversal Detection and Trend Identification: LATO is designed to recognize top and bottom reversal zones using user-defined thresholds (e.g., upper_reversal, lower_reversal). The algorithm signals potential trend changes with event markers such as UP, DOWN, UIP, and DIP, enabling traders to anticipate market reversals.
Risk and Leverage Mapping: By estimating liquidation levels for various leverage values (5x, 10x, 20x, etc.), LATO assists in risk management, helping traders visualize leverage exposure and optimize their trades according to risk tolerance.
Integrated Visualization and Event Labels: LATO enhances visual analysis by plotting key levels, trend lines, and event markers on the chart. Custom labels summarize critical values, including SOD (Sell Odds), BOD (Buy Odds), ORI (Oscillating Range Indicator), and PVI (Price Volatility Index), offering a quick, actionable summary for traders.
User Inputs
Orders Deviation (order_deviation): Controls the deviation for calculating trade levels.
Top Reversal (upper_reversal): Sets the threshold for the upper reversal zone.
Bottom Reversal (lower_reversal): Sets the threshold for the lower reversal zone.
How It Works
LATO tracks market oscillations through the Indexed Position Oscillator (IPO) and Candle Relative Percentage (CRP), dynamically adjusting as the market fluctuates. The algorithm then identifies key levels using weighted prices (e.g., WAP, WBP) and generates reversal signals based on defined thresholds.
Once the Leverage-Aware Trade Optimizer (LATO) is applied to a chart, it automatically calculates dynamic support and resistance levels and identifies potential buying or selling opportunities. The script also plots liquidation zones based on different leverage levels and visualizes these areas through color-coded lines.
Use Case Scenarios
Trend Reversal Detection: Identify when the market is likely to reverse based on the ORI and price action.
Dynamic Price Levels: Use the weighted price levels and trend lines to pinpoint entry/exit points.
Leverage Risk Management: Monitor liquidation levels and use them for managing risk while trading with leverage.
Oscillation Tracking: Track key oscillations for detecting overbought or oversold conditions.
Alert Setup for LATO
You can set up alerts based on the key conditions like UP, DOWN, UIP, and DIP, as well as specific market movements.
Down Trend Alert (DOWN): Alerts when there’s a downtrend, triggered by a crossover of WBP and BL5, with specific conditions for ORI and SOD.
Up Trend Alert (UP): Alerts when there’s an uptrend, triggered by a crossunder of WAP and SL5, with ORI below -0.5.
Upper Reversal Alert (UIP): Alerts when ORI crosses below the lower_reversal threshold.
Downward Reversal Alert (DIP): Alerts when ORI crosses above the upper_reversal threshold.
Conclusion
The Leverage-Aware Trade Optimizer (LATO) is a comprehensive trading tool designed for traders seeking to optimize their trade entries and exits. By combining multiple indicators, dynamic price levels, and reversal zone detection, LATO offers an advanced approach to market analysis and decision-making. Whether you’re trading with leverage or simply looking for trend confirmation, LATO provides the insights you need to maximize your trading potential.
Notes
This script is designed to be used on any time frame.
Adjust the order_deviation parameter based on the asset volatility you are trading.
The reversal thresholds (upper and lower) should be fine-tuned depending on market conditions.

Uptrick: Oscillator SpectrumUptrick: Oscillator Spectrum is a versatile trading tool designed to bring together multiple aspects of technical analysis—oscillators, momentum signals, divergence checks, correlation insights, and more—into one script. It includes customizable overlays and alert conditions intended to address a wide range of market conditions and trading styles.
Developed in Pine Script™, Uptrick: Oscillator Spectrum represents an extended version of the classic Ultimate Oscillator concept. It consolidates short-, medium-, and long-term momentum readings, applies correlation analysis across different symbols, and offers optional table-based metrics to provide traders with a more structured overview of potential trade setups. Whether used alongside your existing charts or as a standalone toolkit, it aims to build on and enhance the functionality of the standard Ultimate Oscillator.
### A Few Key Features
- Momentum Insights: Multiple timeframes for oscillators, plus buy/sell signal modes for flexible identification of overbought/oversold situations or crossovers.
- Divergence Detection: Automated checks for bullish/bearish divergences, aiming to help traders spot potential shifts in momentum.
- Correlation Meter: A visual histogram summarizing how selected assets are collectively trending. It is useful for tracking the bigger market picture.
- Gradient Overlays & Bar Coloring: Dynamic color transitions designed to emphasize changes in momentum, trend shifts, and overall sentiment without cluttering the chart.
- Money Flow Tracker: Tracks the flow of money into and out of the market using a smoothed Money Flow Index (MFI). Highlights overbought/oversold conditions with dynamic bar coloring and visual gradient fills, helping traders assess volume-driven sentiment shifts.
- Advanced Table Metrics: An optional table showing return on investment (ROI), collateral risk, and other contextual metrics for supported assets.
- Alerts & Automation: Configurable alerts covering divergence events, crossing of critical levels, and more, helping to keep traders informed of developments in real time.
### Intended Usage
- For Multiple Markets: Works on various markets (cryptocurrencies, forex pairs, stocks) to deliver a consistent view of momentum, potential entry/exit signals, and correlation.
- Adaptable Trading Styles: With customizable input settings, you can enable or disable specific features to align with your preferred strategies—intraday scalping, swing trading, or position holding.
By combining these elements under one indicator, Uptrick: Oscillator Spectrum allows traders to streamline analysis workflows, helping them stay focused on interpreting market moves and making informed decisions rather than juggling multiple scripts.
Purpose
Purpose of the “Uptrick: Oscillator Spectrum” Indicator
The “Uptrick: Oscillator Spectrum” indicator is intended to bring together several technical analysis elements into one tool. It combines oscillator-based momentum readings across different lookback periods, checks for potential divergences, provides optional buy/sell signal triggers, and offers correlation-based insights across multiple symbols. Additionally, it includes features such as bar coloring, gradient visualization, and user-configurable alerts to help highlight various market conditions.
By consolidating these functions, the script aims to help users systematically observe changing momentum, identify when prices reach user-defined overbought or oversold levels, detect when oscillator movements diverge from price, and examine whether different assets are aligning or diverging in their trends. The indicator also allows for optional advanced metric tables, which can supply further context on risk, ROI calculations, or other factors for supported assets. Overall, the script’s purpose is to organize multiple layers of technical analysis so that users have a structured way to evaluate potential trade opportunities and market behavior.
## Usage Guide
Below is an outline of how you can utilize the various components and features of Uptrick: Oscillator Spectrum in your charting workflow.
---
### 1. Using the Core Oscillator
- Basic View: By default, the script calculates a multi-timeframe oscillator (commonly displayed as the “Ultimate Oscillator”). This oscillator combines short-, medium-, and long-term measurements of buying pressure and true range.
- Overbought/Oversold Zones: You can configure thresholds (e.g., 70 for overbought, 30 for oversold) to help identify potential turning points. When the oscillator crosses these levels, it may indicate that price is extended in one direction.
- You can use the colors of the main oscillator to help you take short-term trades as well: cyan : Buy , red: Sell
- Alerts: If you enable alerts, the indicator can notify you when the oscillator crosses above or below your chosen overbought/oversold boundaries or when you get buy/sell signals.
---
### 2. Buy/Sell Signals in Overlay Modes
Uptrick: Oscillator Spectrum provides several signal modes and a choice between overlay true and overlay false or both. Additionally, you can pick which “line” (data source) the script uses to generate signals. This is set in the “Line to Analyze” dropdown, which includes Oscillator, HMA of Oscillator, and Moving Average. The following sections describe how each piece fits together.
---
#### Line to Analyze - Overlay Flase: Oscillator / HMA of Oscillator / Moving Average
1. Oscillator
- The core momentum reading, reflecting short-, medium-, and long-term periods combined.
2. HMA of Oscillator
- Applies a Hull Moving Average to the oscillator, creating a smoother but still responsive curve.
- Signals will be derived from this smoothed line. Some traders find it filters out minor fluctuations while remaining quicker to react than standard averages.
3. Moving Average
- Uses a user-selected MA type (SMA, EMA, WMA, etc.) over the oscillator values, rather than the raw oscillator itself.
- Tends to be more stable than the raw oscillator, but might delay signals more depending on the chosen MA settings.
---
#### Signal Modes
Regardless of which line you choose to analyze, you can use one of the following seven signal modes in overlay being true:
1. Overbought/Oversold (Pyramiding)
- What It Does:
- Buy signal when the chosen line crosses below the oversold threshold.
- Sell signal when it crosses above the overbought threshold.
- Pyramiding:
- Allows multiple triggers within the same overbought/oversold event.
2. Overbought/Oversold (Non Pyramiding)
- What It Does:
- Same thresholds but only one signal per oversold or overbought event.
- Use Case:
- Prevents repeated signals and chart clutter.
3. Smoothed MA Middle Crossover
- What It Does:
- Uses an MA defined by the user.
- Buy when crossing above the midpoint (50), Sell when crossing below.
- Use Case:
- Generates fewer signals, focusing on broader momentum shifts. There is no pyramiding.
In this image ,for example, the VWMA is used with length of 14 to identify buy sell signals.
4. Crossing Above Overbought/Below Oversold (Non Pyramiding)
- What It Does:
- Buy occurs if the line exits oversold territory by crossing back above it.
- Sell occurs if the line exits overbought territory by crossing back below it.
- Non Pyramiding:
- Restricts repeated signals until conditions reset.
5. Crossing Above Overbought/Below Oversold (Pyramiding)
- What It Does:
- Same thresholds, but allows multiple signals if the line repeatedly dips in and out of overbought or oversold.
- Use Case:
- More frequent entries/exits for active traders.
6. Divergence (Non Pyramiding)
- What It Does:
- Identifies bullish or bearish divergences using the chosen line vs. price.
- Buy for bullish divergence (higher low on the line vs. lower low on price), Sell for bearish divergence.
- Single Trigger:
- Only one signal per identified divergence event. (non pyramiding)
7. Divergence (Pyramiding)
- What It Does:
- Same divergence logic but triggers multiple times if the script sees repeated divergence in the same direction.
- Use Case:
- Could suit traders who layer positions during sustained divergence scenarios.
#### Overlay Modes: True vs. False
1. Overlay True
- Buy/sell arrows or labels plot directly on the main price chart, often at or near candlesticks.
- Bar Coloring:
- Can turn the candlestick bars green (buy) or red (sell), with intensity reflecting signal recency if bar coloring is enabled for this mode. (read below.)
- Advantage:
- Everything (price, signals, bar colors) is in one spot, making it straightforward to associate signals with current market action. You can adjust the periods of the main oscillator or lookback periods of divergences or overbought/oversold thresholds, to play around with your signals.
2. Overlay False
- Signal Placement:
- Signals appear in a sub-window or oscillator panel, leaving the main price chart uncluttered.
- Bar Coloring:
- You may still enable bar colors on the main chart (green for buy, red for sell) if desired.
- Alternatively, you can keep them neutral if you prefer a completely separate display of signals.
- Advantage:
- Clear separation of price action from signals, useful for cleaner charts or if using multiple overlay-based tools.
At the bottom are the signals for overlay being false and on the chart are the signals for overlay being true:
#### Bar Color Adjustments
1. Coloring Logic
- Bars typically go green on buy signals, red on sell signals.
- The opacity or brightness can vary to indicate signal freshness. When a new signal is formed, the color gets brighter. When there is no signal for a longer period of time, then the color slowly fades.
2. Enabling Bar Coloring
- In the indicator’s settings, turn on Bar Coloring.
- Choose “Signals Overlay True” or “Signals Overlay False” from the “Color should depend on:” dropdown, depending on which overlay approach you want to drive your bar colors. You can also chose the cloud fill in overlay false, correlation meter and smoothed HMA to color bars. Read more below:
### Bar Color Options:
When you enable bar coloring in Uptrick: Oscillator Spectrum, you can select which component or signal logic drives the color changes. Below are the five available choices:
---
#### Option 1: Overlay True Signals
- What It Does:
- Uses signals generated under the Overlay True mode to color the bars on your main chart.
- If a buy signal is triggered, bars turn green. If a sell signal occurs, bars turn red.
- Color Intensity:
- Bars appear brighter (more opaque) immediately after a new signal fires, then gradually fade over subsequent bars if no new signal appears.
---
#### Option 2: Overlay False Signals
- What It Does:
- Links bar coloring to signals generated when Overlay False mode is active.
- Buy/sell labels typically plot in a separate sub-window instead of the main chart, but your price bars can still change color based on these signals.
- Color Intensity:
- Similar to Overlay True, new buy/sell signals yield stronger color intensity, which fades over time.
- Use Case:
- Helps maintain a clean main chart (with signals off-chart) while still providing an immediate color-coded indication of a buy or sell state.
- Particularly useful if you prefer less clutter from signal markers on your price chart yet still want a visual representation of signal timing.
In this example normal divergence Pyramiding Signals are used in the overlay being true and the signals in overlay false are signals that analyze the HMA. This can help clear out noise (using a combo of both).
Option 3: Money Flow Tracker
What It Does:
The Money Flow Tracker uses the Money Flow Index (MFI), a volume-weighted oscillator, to measure the strength of money flowing into or out of an asset. The script smooths the raw MFI data using an EMA for a more responsive and visually intuitive output.
The feature also includes dynamic color gradients and bar coloring that highlight whether money flow is positive or negative.
Green Fill/Bar Color: Indicates positive money flow, suggesting potential accumulation.
Red Fill/Bar Color: Indicates negative money flow, signaling potential distribution.
Overbought and oversold thresholds are dynamically emphasized with transparency, making it easier to identify high-confidence zones.
Use Case:
Ideal for traders focusing on volume-driven sentiment to identify turning points or confirm existing trends.
Suitable for assessing broader market conditions when used alongside other indicators like oscillators or correlation analysis.
Provides additional clarity in spotting areas of accumulation or distribution, making it a valuable complement to price action and momentum studies.
---
#### Option 4: Correlation Meter
- What It Does:
- Colors the bars based on the indicator’s Correlation Meter output. The script checks multiple chosen tickers and sums up how many are trending positively or negatively.
- If the meter indicates an overall bullish bias (e.g., more than three assets in uptrend), bars turn green; if it’s bearish, bars turn red.
- Trend Readings:
- The correlation meter typically plots a histogram of bullish/neutral/bearish states. The bar color option links your chart’s candlestick coloring to that higher-level market sentiment.
- Use Case:
- Useful for traders wanting a quick visual prompt of whether the broader market (or a selection of related assets) is bullish or bearish at any given time.
- Helps avoid signals that conflict with the market majority.
#### Option 5: Smoothed HMA
- What It Does:
- Bar colors are driven by the slope or state of the Hull Moving Average (HMA) of the oscillator, rather than individual buy/sell triggers or correlation data.
- If the HMA indicates a strong upward slope (possibly darkening), bars may turn green; if the slope is downward (purple in the HMA line), bars turn red.
- Use Case:
- Ideal for those who focus on momentum continuity rather than discrete signals like overbought/oversold or divergence.
- May help identify smoother, more sustained moves, as the HMA filters out minor oscillations.
---
### 3. Using the Hull Moving Average (HMA) of the Oscillator
- HMA Calculation: You can enable a dedicated Hull Moving Average (HMA) for the oscillator. This creates a smoother line of the same underlying momentum reading, typically responding more quickly than classic moving averages.
- Color Intensity: As the HMA sustains an uptrend or downtrend, the script can adjust the line’s color. When slope momentum persists in one direction, the color appears more opaque. This intensification can hint that the existing direction may be well-established.
- Reversal Potential: If you observe the HMA color shifting or darkening after multiple bars of slope in the same direction, it may indicate increasing momentum. Conversely, a sudden flattening or change in color can be a clue that momentum is waning.
---
### 4. Moving Average Overlays & Gradient Cloud
- Oscillator MA: The script allows you to apply moving average types (SMA, EMA, SMMA, WMA, or VWMA) to the core oscillator, rather than to price. This can smooth out noise in the oscillator, potentially highlighting more consistent momentum shifts.
- Gradient Cloud: You can also enable a cloud in overlay true between two moving averages (for instance, a Hull MA and a Double EMA) on the price chart. The cloud fills with different colors, depending on which MA is above the other. This can provide a quick visual reference to bullish or bearish areas.
---
### 5. Divergence Detection
- Bullish & Bearish Divergence: By toggling “Calculate Divergence,” the script looks for oscillator pivots that contrast with price pivots (e.g., price making a lower low while the oscillator makes a higher low).
- A divergence is when the price makes an opposite pivot to the indicator value. E.g. Price makes lower low but indicator does higher low - This suggests a bullish divergence. THe opposite is for a bearish divergence.
- Visual Labels: When a divergence is found, labels (such as “Bull” or “Bear”) appear on the oscillator. This helps you see if the oscillator’s momentum patterns differ from the price movement.
- Filtering Signals: You can combine divergence signals with other features like overbought/oversold or the HMA slope to refine potential entries or exits.
---
### 6. Correlation & Multi-Ticker Analysis
- Correlation Meter: You can select up to five tickers in the settings. The script calculates a slope-based metric for each, then combines those metrics to show an overall bullish or bearish tendency (displayed as a histogram).
- Bar Coloring & Overlay: If you activate correlation-based bar coloring, it will reflect the broader trend alignment among the selected assets, potentially indicating when most are trending in the same direction.
- Use Case: If you trade multiple markets, the correlation histogram can help you quickly see if several major assets support the same market bias or are diverging from one another.
—
### 7. Money Flow Tracker
Money Flow Calculation: The Money Flow Tracker calculates the Money Flow Index (MFI) based on price and volume data, factoring in buying pressure and selling pressure. The output is smoothed using a low-lag EMA to reduce noise and enhance usability.
Visual Features:
Dynamic Gradient Fill:
The space between the smoothed MFI line and the midline (set at 50) is filled with a gradient.
Above 50: Green gradient, with intensity increasing as the MFI moves further above the midline.
Below 50: Red gradient, with intensity increasing as the MFI moves further below the midline.
This gradient provides a clear visual representation of money flow strength and direction, making it easier to assess sentiment shifts at a glance.
Overbought/Oversold Levels: Default thresholds are set at 70 (overbought) and 30 (oversold). When the MFI crosses these levels, it signals potential reversals or trend continuations.
Bar Coloring:
Bars turn green for positive money flow and red for negative money flow.
Color intensity fades over time, ensuring recent signals stand out while older ones remain visible without dominating the chart.
Alerts:
Alerts are triggered when the Money Flow Tracker crosses into overbought or oversold zones, keeping traders informed of critical conditions without constant monitoring.
Practical Applications:
Trend Confirmation: Use the Money Flow Tracker alongside the oscillator or HMA to confirm trends or identify potential reversals.
Volume-Based Reversal Signals: Spot turning points where price action aligns with shifts in money flow direction.
Sentiment Analysis: Gauge whether market participants are accumulating (positive flow) or distributing (negative flow) assets, offering an additional layer of insight into price movement.
(Space for an example chart: “Money Flow Tracker with gradient fills and overbought/oversold levels”)
### 8. Putting It All Together
- Combining Signals: A practical approach might be to watch for a bullish divergence in the oscillator, confirm it with a shift in the HMA slope color, and then wait for the price to be near or below oversold conditions. The correlation histogram may further confirm if the broader market is also leaning bullish at that time.
- Visual Cues: Bar coloring adds another layer, making your chart easier to interpret at a glance. You can also set alerts to ensure you don’t miss key events like divergences, crossovers, or moving average flips.
- Flexibility: Not every feature needs to be used simultaneously. You might opt to focus on divergences and overbought/oversold signals, or you could emphasize the correlation histogram and bar colors. The settings let you enable or disable each module to suit your style.
---
### 9. Tips for Customization
- Adjust Periods: Shorter periods can yield more signals but also more noise. Longer periods may provide steadier, but fewer, signals.
- Set Appropriate Alert Conditions: Only alert on events most relevant to your strategy to avoid overload.
- Explore Different MAs: Depending on the instrument, some moving average types may give a smoother or more responsive indication.
- Monitor Risk Management: As with any tool, these signals do not guarantee performance, so consider position sizing and stop-loss strategies.
---
By toggling and experimenting with the features described above—buy/sell signals, divergences, moving averages, dynamic gradient clouds, and correlation analysis—you can tailor Uptrick: Oscillator Spectrum to your specific trading approach. Each module is designed to give you a clearer, structured view of potential momentum shifts, overbought or oversold states, and the alignment or divergence of multiple assets.
## Features Explanation
Below is a detailed overview of key features in Uptrick: Oscillator Spectrum. Each component is designed to provide different angles of market analysis, allowing you to customize the tool to your preferences.
---
### 1. Main Oscillator
- Purpose: The primary oscillator in this script merges short-, medium-, and long-term views of buying pressure and true range into a single line.
- Calculation: It weights each period’s contribution (e.g., a heavier focus on the short period if desired) and normalizes the result on a 0–100 scale, where higher readings may suggest more robust momentum. (like from the classic Ultimate Oscillator)
- Practical Use:
- Traders can watch for overbought/oversold conditions at user-defined thresholds (e.g., 70/30).
- It can also provide a straightforward momentum reading for those who prefer to see if momentum is rising, falling, or leveling off.
---
### 2. HMA of the Smoothed Oscillator
- What It Is: A Hull Moving Average (HMA) applied to the main oscillator values. The HMA is often more responsive than standard MAs, offering smoother lines while preserving relatively quick reaction to changes.
- How It Works:
- The script takes the oscillator’s output and processes it through a Hull MA calculation.
- The HMA’s slope and color can change more dynamically, highlighting sharper momentum shifts.
- Why It’s Useful:
- By smoothing out minor fluctuations, the HMA can highlight trends in the oscillator’s trajectory.
- If you see an extended run in the HMA slope, it may indicate a more persistent trend in momentum.
- Color Intensity:
- As the HMA continues in one direction for several bars, the script can intensify the color, signaling stronger or more sustained momentum in that direction.
- Sudden changes in color or slope can signal the start of a new momentum swing.
---
### 3. Gradient Fill
This script uses two gradient-based visual elements:
1. Shining/Layered Gradient on the Main Oscillator
- Purpose: Adds multiple layers around the oscillator line (above and below) to emphasize slope changes and highlight how quickly the oscillator is moving up or down.
- Color Changes:
- When the oscillator rises, it uses a color scheme (e.g., aqua/blue) that intensifies as the slope grows.
- When the oscillator declines, it uses a distinct color (e.g., red/pink).
- User Benefit: Makes it easier to see at a glance if momentum is accelerating or decelerating, beyond just the numerical reading.
2. Dynamic Cloud Fill (Between MAs)
- Purpose: Allows you to plot two moving averages (for example, a short-term Hull MA and a longer-term DEMA) and fill the area between them with a color gradient.
- Bullish vs. Bearish:
- When the short MA is above the long MA, the cloud might appear in a greenish hue.
- When the short MA is below the long MA, the cloud can switch to red or another color.
- Transparency/Intensity:
- The fill can get more opaque if the difference between the two MAs is large, indicating a stronger trend but a higher probability of a reversal.
- User Benefit: Helps visualize changes in trend or momentum across multiple time horizons, all within a single chart overlay.
---
### 4. Correlation Meter & Symbol Inputs
- What It Is: This feature looks at multiple user-selected symbols (e.g., BTC, ETH, BNB, etc.) and computes each symbol’s short-term slope. It then aggregates these slopes into an overall “trend” score.
- Inputs Configuration:
1. Ticker Inputs: You can specify up to five different tickers.
2. Timeframe: Decide whether to pull data from different chart timeframes for each symbol.
3. Slope Calculation: The script may compute, for instance, a 5-period SMA minus a 20-period SMA to gauge if each symbol is trending up or down.
- Market Trend Histogram:
- Displays a column that goes above/below zero depending on how many symbols are bullish or bearish.
- If more than three (out of five) symbols are bullish, the histogram can show a green bar at +1; if fewer than three are bullish, it can show red at –1.
- How to Use:
- Quick Glance: Lets you know if most correlated assets are aligning or diverging.
- Bar Coloring (Optional): If enabled, your main chart’s bars can reflect the aggregated correlation, turning green or red depending on the meter’s reading.
---
### 5. Advanced Metrics Table
- What It Is: An optional table displaying additional metrics for several cryptocurrencies (or any symbols you define).
- Metrics Included:
1. ROI (30D): Calculates return relative to the lowest price in a 30-day period.
2. Collateral Risk: Uses standard deviation to assess volatility (higher risk if standard deviation is large).
3. Liquidity Recovery: A rolling average of volume, aiming to show how liquidity flows might recover over time.
4. Weakening (Rate of Change): Reflects how quickly price is changing compared to previous bars.
5. Monetary Bias (SMA): A simple average of recent prices. If price is below this SMA, it might be seen as undervalued relative to the short term.
6. Risk Phase: Categorizes risk as low, medium, or high based on the standard deviation figure.
7. DCA Signal: Suggests “Accumulate” or “Do Not Accumulate” by checking if the current price is below or above the SMA.
- Why It’s Useful:
- Offers a concise view of multiple assets in one place—helpful for portfolio-level insight.
- DCA (Dollar-Cost Averaging) suggestions can guide longer-term strategies, while volatility (collateral risk) helps gauge how aggressive the price swings might be.
---
### 6. Other Vital Aspects
- Alerts & Notifications:
- The script can trigger alerts for various conditions—crossovers, divergence detections, overbought/oversold transitions, or correlation-based signals.
- Useful for automating watchlists or ensuring you don’t miss a key setup while away from the screen.
- Customization:
- Each module (oscillator settings, divergence detection, correlation meter, advanced metrics table, etc.) can be enabled or disabled based on your preferences.
- You can fine-tune parameters (e.g., periods, smoothing lengths, alert triggers) to align the indicator with different trading styles—scalping, swing, or position trading.
- Combining Features:
- One might watch the main oscillator for momentum extremes, confirm via the HMA slope, check if correlation supports the same bias, and look at the table for risk-phase validation.
- This multi-layer approach can help develop a more structured and informed trading view.
(Space for an example chart: “A fully configured layout showing oscillator, HMA, gradient cloud, correlation meter, and table all in use.”)
7. Money Flow Tracker
Purpose: The Money Flow Tracker adds a volume-based perspective to the indicator suite by incorporating the Money Flow Index (MFI), which assesses buying and selling pressure over a defined period. By smoothing the MFI using an exponential moving average (EMA), the feature highlights the directional flow of capital into and out of the market with greater clarity and reduced noise.
Dynamic Gradient Visualization:
The Money Flow Tracker enhances visual analysis with gradient fills that reflect the MFI’s relationship to the midline (50).
Above 50: A green gradient emerges, intensifying as the MFI moves higher, indicating stronger positive money flow.
Below 50: A red gradient appears, with deeper shades signifying increasing selling pressure.
Transparency dynamically adjusts based on the MFI’s proximity to the midline, making high-confidence zones (closer to 0 or 100) visually distinct.
Directional Sensitivity:
The Tracker emphasizes the importance of overbought (above 70) and oversold (below 30) zones. These thresholds help traders identify when an asset might be overextended, signaling potential reversals or trend continuations.
The inclusion of a midline (50) as a neutral zone helps gauge shifts between accumulation (money flowing in) and distribution (money flowing out).
Bar Integration:
By enabling bar coloring linked to the Money Flow Tracker, traders can visualize its impact directly on price bars.
Green bars reflect positive money flow (above 50), signaling bullish conditions.
Red bars indicate negative money flow (below 50), highlighting bearish sentiment.
Intensity adjustments ensure that recent signals are more visually prominent, while older signals gradually fade for a clean, non-cluttered chart.
Key Advantages:
Volume-Informed Context: Traditional oscillators often focus solely on price; the Money Flow Tracker incorporates volume, adding a crucial dimension for analyzing market behavior.
Adaptive Filtering: The EMA-smoothing feature ensures that sudden, insignificant spikes in volume don’t trigger false signals, providing a clearer and more actionable representation of money flow trends.
Early Warning System: Divergences between price movement and the Money Flow Tracker’s trends can signal potential turning points, helping traders anticipate reversals before they occur.
Practical Use Cases:
Trend Confirmation: Pair the Money Flow Tracker with the oscillator or HMA to confirm bullish or bearish trends. For example, a rising oscillator with positive money flow indicates strong buying interest.
Identifying Entry/Exit Zones: Use overbought/oversold conditions as entry/exit points, particularly when combined with other features like divergence detection.
Market Sentiment Analysis: The Tracker’s ability to dynamically assess buying and selling pressure provides a clear picture of market sentiment, helping traders adjust their strategies to align with broader trends.
By understanding these features—main oscillator readings, the HMA’s smoothing capabilities, gradient-based visual highlights, correlation insights, advanced metrics, and the money flow tracker—you can tailor Uptrick: Oscillator Spectrum to your specific needs, whether you’re focusing on quick trades, longer-term market moves, or broad portfolio health.
Originality of the “Uptrick: Oscillator Spectrum” Indicator
While it includes elements of standard momentum analysis, Uptrick: Oscillator Spectrum sets itself apart by adding an array of features that broaden the typical oscillator’s scope:
1. Slope Coloring & Layered Gradient Effects
- Beyond just plotting a single line, the indicator visually highlights momentum shifts using color changes and gradient fills.
- As the oscillator’s slope becomes steeper or flatter, these gradients intensify or fade, helping users see at a glance when momentum is accelerating, slowing, or reversing.
2. Mean Reversion & Divergence Detection
- The script offers optional logic for marking potential mean reversion points (e.g., overbought/oversold crossovers) and flagging divergences between price and the oscillator line.
- These divergence signals come with adjustable lookback parameters, giving traders control over how recent or extended the pivots should be for detection.
- This functionality can reveal subtle momentum discrepancies that a basic oscillator might overlook.
3. Integrated Multi-Asset Correlation Meter
- In addition to monitoring a single symbol, the indicator can fetch data for multiple tickers. It aggregates each symbol’s slope into a histogram showing whether the broader market (or a group of assets) leans bullish or bearish.
- This cross-market insight moves beyond standard “one-symbol, one-oscillator” usage, adding a bigger-picture perspective in one tool.
4. Advanced Metrics Table
- Users can enable a table that covers ROI calculations, volatility-based risk (“Collateral Risk”), liquidity checks, DCA signals, and more.
- Rather than just seeing an oscillator value, traders can view additional metrics for selected assets in one place, helping them judge overall market conditions or assess multiple instruments simultaneously.
5. Flexible Overlay & Bar Coloring
- Signals can be displayed directly on the price chart (Overlay True) or in a sub-window (Overlay False).
- Bars themselves may change color (e.g., green for bullish or red for bearish) according to different rules—signals, dynamic cloud fill, correlation meter states, etc.
- This adaptability allows traders to keep the chart as simple or as info-rich as they prefer.
6. Custom Smoothing Options & HMA Extensions
- The oscillator can be processed further with a Hull Moving Average (HMA) to reduce noise while still reacting quickly to market changes.
- Slope-based coloring on the HMA provides an additional layer of visual feedback, which is not common in a standard oscillator.
By blending traditional momentum checks with slope-based color feedback, mean reversion triggers, divergence signals, correlation analysis, and an optional metrics table, Uptrick: Oscillator Spectrum offers a more rounded approach than a typical oscillator. It integrates multiple market insights—both visual and analytical—into one script, giving users a broader toolkit for studying potential reversals, gauging momentum strength, and assessing multi-asset trends.
## Conclusion
Uptrick: Oscillator Spectrum brings together multiple layers of analysis—oscillator momentum, divergence detection, correlation insights, HMA smoothing, and more—into one adaptable toolkit. It aims to streamline your charting process by offering meaningful visual cues (such as gradient fills and bar color shifts), advanced tables for broader market data, and flexible alerts to keep you informed of potential setups.
Traders can choose the specific features that suit their style, whether they prefer to focus on raw oscillator signals, multi-ticker correlation, or smooth trend cues from the HMA. By centralizing these different methods in one place, Uptrick: Oscillator Spectrum can help users build more structured approaches to spotting trend shifts and extended conditions, while also remaining compatible with additional analysis techniques.
---
### Disclaimer
This script is provided for informational purposes only and does not constitute financial or investment advice. Past performance is not indicative of future results, and all trading involves risk. You should carefully consider your objectives, risk tolerance, and financial situation before making any trading decisions.

IBD Market School [tradeviZion]IBD Market School Indicator: User Guide and Settings Reference
A comprehensive guide to configuring and using the IBD Market School indicator for TradingView
Introduction
The IBD Market School indicator is an advanced market analysis tool that implements Investor's Business Daily's methodology for identifying optimal trading opportunities. By tracking key market indexes and analyzing price and volume patterns, it provides actionable buy and sell signals based on the CANSLIM investment system.
The indicator offers a comprehensive set of features:
Complete Signal System
10 primary buy signals (B1-B10)
Additional buy-side indicators (HH - Higher High, ED - Expired Days)
14 sell signals (S1-S14)
Index Rise 6% signal for Distribution/Stalling Day expiration
Market Health Tracking
Distribution Day detection and counting
Stalling Day identification and validation
Automatic 25-day signal expiration
6% price rise monitoring for signal clearing
Market Condition Analysis
Rally Day detection (major and minor)
Follow-Through Day confirmation
Dynamic market exposure management (0-100%)
Power Trend analysis with multiple states
Risk Management Features
Circuit Breaker system for major declines
Buy Switch system for exposure control
Customizable volume analysis (Nasdaq/S&P 500)
Distribution day clustering detection
Visual Analysis Tools
IBD-style candle display option
Power Trend state visualization
Signal line drawing system
Customizable tooltips and alerts
Proper configuration of the indicator's settings is essential as it affects:
Signal detection sensitivity and accuracy
Market exposure calculations and adjustments
Volume confirmation requirements
Visual display of market conditions and signals
Alert system behavior and notifications
This guide provides detailed explanations of each component and setting to help you optimize the indicator for your trading strategy while maintaining adherence to IBD's proven methodology.
📊 General Settings
This section controls the indicator's tooltip display, alert behavior, and candle visualization preferences.
The General Settings panel allows you to configure tooltip modes, alert types, and candle appearance.
Tooltip Display Mode
Select how detailed the tooltips should be when hovering over signals and indicators:
The three tooltip display modes: Simple (left), Detailed (center), and Market Analysis (right).
Simple Mode
Displays concise signal definitions
Shows basic entry and exit conditions
Focuses on essential trigger points
Perfect for experienced traders
Detailed Mode
Provides in-depth explanations of each buy/sell signal
Shows complete validation criteria and conditions
Includes volume requirements and percentage thresholds
Explains the context and significance of each signal
Market Analysis Mode
Focuses on broad market health metrics
Shows market exposure percentage and trend
Displays buy switch and power trend status
Tracks distribution days and signal buffers
Note: Choose the tooltip mode based on your needs:
- Simple: Provides quick, essential information on signals for fast decision-making
- Detailed: Breaks down conditions for each buy/sell signal, ideal for users wanting in-depth explanations
- Market Analysis: Focuses on broad market health, including exposure, buy switch, distribution days, and trends
Market Exposure Alert System
The indicator alerts you when market exposure levels change, helping you adjust your positions accordingly.
Alert Types
On Close (Recommended)
Triggers only after bar closes
More reliable signals as price action is confirmed
Real-Time
Triggers immediately when conditions are met
Note: Signals may change by bar close
Setting Up Alerts
Click the "..." (More) button on the indicator label "$tradeviZion - IBD Market School"
Select "Add alert on $tradeviZion - IBD Market School..."
In the Create Alert dialog:
Settings tab:
Verify the symbol and timeframe (e.g., NASDAQ:IXIC , 1D)
Condition: Select "$tradeviZion - IBD Market School"
Alert function: Choose "Any alert() function call"
Expiration: Set to "Open-ended alert"
Alert name will auto-populate
Switch to Notifications tab:
Enable "Notify in app" for push notifications in the mobile app
Enable "Show toast notification" for on-screen alerts
Enable "Play sound" and customize duration (e.g., Thin, 10 seconds)
Optional settings:
Send email (requires profile settings configuration)
Webhook URL for POST requests
Send plain text for alternative email format
Click Create to activate the alert
Alert Messages
Message format: "Market exposure change for : Market exposure from % to %"
Example: "Market exposure change for NASDAQ:IXIC : 📈 Market exposure reduced from 100% to 75%"
📈 Arrow indicates exposure increase
📉 Arrow indicates exposure decrease
Messages include previous and new exposure percentages
Note: These alerts specifically track changes in market exposure levels, helping you stay aligned with market conditions. They are essential for maintaining proper position sizing and risk management.
Chart Style Options
IBD-style Candles
Enable to match Investor's Business Daily chart style
For MarketSmith style setup, right-click on chart and go to Settings
Navigate to Symbol tab
Uncheck Body, Borders, and Wicks
Press Alt+R to restore chart view if zoom affects display
To revert to original style, right-click on chart and go to Settings
Navigate to Symbol tab
Check Body, Borders, and Wicks
Color Based on Previous Close
Colors bars based on close vs. previous close
When enabled, determines colors by comparing current close to previous close
Use blue color for closes above previous
Use pink color for closes below previous
📈 Market Exposure Table Settings
Configure how the market exposure information is displayed on your chart.
The Market Exposure Table Settings panel allows you to customize the appearance and layout of the market status display.
Layout Options
• Hide Table
Completely hides the market status display
• Basic (2 Columns)
Shows main indicators in two columns
Compact view without signal list
Ideal for minimalist chart view
• Detailed (2 Columns with Signals)
Displays main indicators plus signal panel
Shows Buy and Sell signals in separate columns
Provides comprehensive market overview
• Stacked (1 Column, Compact)
Vertical layout with single column
Most space-efficient option
Ideal for smaller chart windows
Color Settings
Background : Dark gray background for the table
Text : White text for general information
Buy Signal : Green highlighting for buy signals
Sell Signal : Red highlighting for sell signals
Additional Options
Show Trading Wisdom: Enable rotating trading messages
Displays empowering trading messages
Helps reinforce disciplined trading practices
Updates every 5 bars with new wisdom
Includes tooltips with comprehensive trading guidance
Customizable yellow text color for messages
💹 Buy Signals Settings
This section controls the visibility and behavior of buy signals and related indicators.
The Buy Signals Settings panel allows you to configure signal visibility, volatility calculations, and visual appearance of buy signals.
Signal Display Options
Buy Signals Display : Choose display mode
Show Selected Signals
Hide All
Compact Signals
Individual Signal Toggles
Primary Buy Signals (B1-B10)
Special Indicators (HH, ED)
Understanding Buy Signals
B1: Follow-Through Day (FTD)
Buy on the initial FTD with volume higher than the previous day. You may use an FTD from an index other than the NASDAQ:IXIC , but if you do, you must stay within that index for future Buy and Sell Signals.
B2: Additional Follow-Through
Buy on all additional follow-through days within 25 days from a rally day that closes above the low of the initial follow-through day.
B3: Low Above EMA21
Buy on an up or flat day when the intraday low is at or above the EMA21. Note: Once you have a B3 or B4, you can't have another until it is reset by an S5.
Special Buy Indicators
HH: Higher High (No FTD after Rally)
Triggers when current close exceeds highest point since last confirmed rally. Must not have a Follow-Through Day (FTD). Buy switch turns on when close exceeds last rally's high and turns off if close drops below that high.
ED: Expired Days
Tracks Distribution and Stalling days that have aged out. Days are tracked for a specific trading period and expired days are removed from the count.
Index Rise Settings
Index Rise 6% from DD & SD
Toggle to enable/disable monitoring of price rises above Distribution and Stalling Days. Default value of 6% (adjustable) for monitoring rises above these days.
Understanding Index Rise
This feature tracks significant market recoveries by monitoring when the index rises substantially above Distribution Days (DD) or Stalling Days (SD). When the index rises 6% or more above the closing price of any DD or SD, it indicates a strong market recovery. This is an important signal because it helps identify when the market has shown enough strength to potentially overcome previous distribution periods. When triggered, this signal reduces the distribution day count, effectively acknowledging that the previous distribution pattern may no longer be as relevant due to the market's strong recovery.
B1 Signal Configuration
Volatility Settings
B1 Auto Volatility: Calculates FTD price requirement based on 200-day volatility
B1 Manual Volatility: Fixed value (default 1.245) when auto is disabled
Visual Settings
Label Size: Small (options: Tiny, Small, Normal, Large)
Signal Color: Light green background for buy signals
Text Color: Customizable text color for signal labels
Important Notes
Signal visibility affects both chart display and calculations
Auto volatility is recommended for most users
Manual volatility should only be adjusted by experienced users
Visual settings apply to all enabled buy signals
Confirmation Rules
Price Requirements
Follow-Through Day (B1) thresholds based on 200-day volatility:
Below 0.4% volatility: 0.7% gain required
0.4% to 0.55% volatility: 0.85% gain required
0.55% to 1% volatility: 1% gain required
Above 1% volatility: 1.245% gain required
EMA Breaks (S5/S6): 0.2% threshold below 21 EMA
Downside Reversal (B9): 1.75% high-to-low spread required
Volume Requirements
Distribution Days: Volume > previous day, with -0.20% or more price decline
Stalling Days: Volume ≥ 95% of previous day
Follow-Through Days (B1/B2): Volume > previous day
Accumulation Days (B7): Volume > previous day, close in upper 25% range
Sell Signals Settings
This section controls the visibility and behavior of sell signals and market weakness indicators.
The Sell Signals Settings panel allows you to configure signal visibility and visual appearance of sell signals and market health indicators.
Signal Display Options
Sell Signals Display: Dropdown with options to control signal visibility:
Show Selected Signals
Hide All
Compact Signals
Individual Signal Toggles
Primary Sell Signals: S1-S14 and CB (Circuit Breaker)
Market Health Indicators:
Distribution Days (DD): Indicative of institutional selling. Occurs when:
Market closes down by at least 0.2%
Volume greater than or equal to prior day
Tracked for 25 trading days
Stalling Days (SD): Sign of heavy volume without upside progress. Occurs when:
Market at/near new highs
Closes with small gain (0% to 0.4%)
High volume in lower half of day's range
Understanding Sell Signals
S1: Follow-Through Day Undercut
Sell if the index closes below the low of the initial follow-through day.
S2: Failed Rally Attempt
Sell if the index undercuts the major low of the rally attempt. Market exposure is reduced to zero and the Buy Switch is turned off.
S2ml: Minor Low Undercut
Minor Low undercut of rally attempt. Market exposure is reduced by two. This does not turn off the Buy Switch.
S3: Full Distribution Minus One
Sell after the distribution count increases to one less than the full distribution count.
S4: Full Distribution
Sell after reaching the full distribution count.
S5: Break Below EMA21
Sell if the index closes 0.2% or more below the EMA21. Note: Once you have an S5, S6, or S7, you can't have another until it is reset by a B3.
S6: Overdue Break Below EMA21
Sell if the index closes down 0.2% or more below the EMA21 after 30 days have passed since the last B3 without triggering an S5.
S7: Trending Below EMA21
Sell after S5 on the 5th consecutive day that the high is below the EMA21 and a down day.
S8: Living Below EMA21
Sell after S5 on the 10th and every 5th consecutive day after that (15th, 20th, 25th, etc.) that the high is below the EMA21.
S9: Break Below 50-Day MA
Sell if the index closes below the 50-Day Moving Average. Triggers only if a B6 signal was previously printed.
S10: Bad Break
Sell if the close is down 2.25% or greater in the bottom 25% of the range. Close below the MA50 or intraday high below EMA21.
S11: Downside Reversal
Sell after a Downside Reversal Day, which occurs with:
New High within 13 weeks
Close in bottom quartile of range
Close Down for the day
Spread of 1.75% or greater
S12: Lower Low
Sell after closing below the last marked low as defined by MarketSmith.
S13: Distribution Cluster
Distribution and stalling days increase to four up to eight days within a rolling eight-day period.
S14: Break Below Higher High
Sell after closing below the last marked high that printed a B8 (Higher High).
CB: Circuit Breaker
Triggers when the index drops 10% from the highest high since the FTD (B1) and falls 5% or more below the 50-Day MA intraday.
Buy/Sell Undercut Lines
This section controls the visibility and appearance of important price level lines on your chart.
The Buy/Sell Undercut Lines panel allows you to configure which signal lines are displayed and their visual appearance.
Line Visibility
Buy Signal Lines :
B8 Line: First high above the last pivot high
HH Line: Close above the prior high since last confirmed rally without FTD
Sell Signal Lines :
S1 Line: Close below the initial follow-through day
S2 Line: Undercut of major low
S2ml Line: Minor low undercut
S12 Line: Close below last marked low
S14 Line: Close below last marked high
Line Appearance
Color Settings :
B8: Green (Buy signal)
HH: Green (Buy signal)
S1: Red (Sell signal)
S2: Red (Sell signal)
S2ml: Orange (Modified sell signal)
S12: Purple (Pivot low signal)
S14: Blue (Close below pivot)
Line Style : Dashed (options: solid, dotted, dashed)
Line Width : 1 (adjustable)
📈 Rally Signal Settings
The Rally Signal Settings panel allows you to configure Rally Day detection and visualization.
Rally Day:
Toggle to enable/disable Rally Day signals. These mark the beginning of potential market uptrends when the market closes higher than the previous day, following a significant decline.
Visual Settings:
Label Size: small (options: tiny, small, normal, large)
Background Color: Customizable background for Rally Day labels
Text Color: Customizable text color for Rally Day labels
Distribution Day Settings:
Use Manual FullDDcount: Option to manually set the minimum combined number of Distribution and Stalling Days
Count Value: Default is 6 days (adjustable when manual mode is enabled)
This setting determines how many Distribution/Stalling Days are required to trigger a new rally
Pivot Point Settings
The Pivot Point Settings panel allows you to configure the display of high/low points and percentage changes between pivots.
Display Options
Display H/L Points
Toggle to show or hide pivot levels (high and low points) on the chart
%Change
Toggle to display percentage changes between pivot points
Color Settings
Positive % Color : Blue (customizable) - Used for positive percentage changes
Negative % Color : Pink (customizable) - Used for negative percentage changes
Precision Settings
Decimal Places: Set the number of decimal places (default: 2) for:
Pivot point price levels
Percentage change calculations
⚡ Power Trend Settings
This section controls how Power Trend information is visualized on your chart.
The Power Trend Settings panel allows you to configure how trend states are displayed and customize their visual appearance.
Example of Power Trend visualization showing both boxes (green background) and trend lines. The boxes indicate trend state while lines show trend transitions.
Display Options
Show Power Trend Line : Display trend states as lines on the chart
Show Boxes : Display trend states as boxes
Show Background : Display trend states as background colors
Power Trend Color Settings
On : Light green - Full power trend active
Resume : Light green - Power trend resuming
Off : Gray - Power trend inactive
With Floor : Yellow - Under pressure with support
No Floor : Orange - Under pressure without support
Power Trend Line Settings
Line Width : Set line thickness (default: 1)
Line Offset : Adjust line position (default: 5)
Power Trend Box Settings
Text Align : Set text alignment (left, center, right)
Text Position : Set vertical position (top, middle, bottom)
Size : Set box size (tiny, small, normal, large)
Color : Customize box background color
Power Trend States
Full Power (On)
Represents strongest market condition with maximum exposure of +7
Base maximum exposure of 5 plus 2 buffer signals
Buffer allows maintaining high exposure during normal pullbacks
2 sell signals reduce count from 7 to 5 without affecting base
Indicates very healthy market that can absorb normal profit-taking
Resume State
Shows successful market recovery after pressure period
Requires 10+ days without S2 minor, S9, or S13 signals
Must reestablish all initial strength conditions
Maintains same benefits as Full Power (+7 max, +2 floor)
Shows as light green in visualization
Under Pressure With Floor
First warning stage triggered by S2 minor or S13 signals
Reduces maximum exposure to +5
Maintains minimal protection with +1 floor
Suggests defensive positioning while keeping core positions
Shows as yellow in visualization
Under Pressure No Floor
Severe warning stage triggered by S9 signal
Maintains +5 maximum exposure but removes floor protection
Indicates higher risk of continued market decline
Requires careful position management
Shows as orange in visualization
Power Trend Off
Triggered by EMA/MA crossdowns with declining price
Can also be activated by S2 or Circuit Breaker signals
Maximum exposure limited to +5 with no buffer signals
Suggests focus on capital preservation
Shows as gray in visualization
Power Trend System Rules
Each state enforces strict exposure limits with automatic floor and ceiling adjustments
Power Trend can activate Buy Switch when entering Full Power state
Restraint Rule limits exposure to +2 until significant progress or B4 signal when starting from zero exposure
State transitions immediately update exposure limits and Buy Switch status
Distribution Cluster (S13) can move Power Trend to Under Pressure With Floor state
System maintains exposure floors to prevent panic selling while allowing flexibility below floor levels
Weekly SMAs Settings
The Weekly SMAs Settings panel allows you to configure the weekly moving averages display and calculations.
SMA 1: 10 periods (enabled), Red
Length: 10
Optional EMA toggle
Width: 1
SMA 2: 20 periods, Pink
Length: 20
Optional EMA toggle
Width: 1
SMA 3: 30 periods, Green
Length: 30
Optional EMA toggle
Width: 1
SMA 4: 40 periods (enabled), White
Length: 40
Optional EMA toggle
Width: 1
SMAs Settings
The SMAs Settings panel allows you to configure the daily moving averages display and calculations.
MA 1: 10 periods, Optional EMA, Pink
Length: 10
Optional EMA toggle
Width: 1
MA 2: 21 periods (enabled), EMA, Green
Length: 21
EMA enabled
Width: 1
MA 3: 50 periods (enabled), SMA, Red
Length: 50
EMA disabled
Width: 1
MA 4: 200 periods (enabled), SMA, White
Length: 200
EMA disabled
Width: 1
Volume Settings (NASDAQ & S&P 500)
This section controls volume data sources for market analysis. Proper volume settings are crucial for confirming market signals and analyzing institutional participation.
The Volume Settings panel allows you to configure volume data sources and custom ticker options for accurate market analysis.
Important Volume Source Information
TradingView's default volume data differs from IBD's Yahoo Finance data source
Current default settings (IXIC and TVOL) provide the most accurate results compared to IBD signals
Volume differences between TradingView and IBD are expected due to different data sources
Custom ticker options are provided for future compatibility with Yahoo Finance volume data
Volume Configuration
Nasdaq Volume Settings
Default Source: NASDAQ:IXIC (Nasdaq Composite Index)
Custom Ticker Option: USI:TVOL.NQ
Enable custom source by checking "Use Custom Nasdaq Ticker?"
Note: Custom ticker must be price-based for accurate volume analysis
S&P 500 Volume Settings
Default Source: TVOL (S&P 500 Total Volume)
Custom Ticker Option: USI:TVOL.NY
Enable custom source by checking "Use Custom S&P 500 Ticker?"
Note: Custom ticker must be price-based for accurate volume analysis
Volume Analysis Impact
Used for Distribution Day confirmation
Required for Follow-Through Day validation
Helps identify institutional buying/selling
Critical for Stalling Day detection
Recommendations
Keep default settings for most accurate current results
Only use custom tickers if you have confirmed price-based volume sources
Be aware that volume-based signals might slightly differ from IBD due to data source differences
Future updates may add Yahoo Finance volume compatibility
Market Status Table
The Market Status Table provides a real-time visual overview of current market conditions and signal status. Users can customize the table's appearance through the Market Exposure Table Settings.
The Market Status Table can be displayed in three different layouts: Basic (left), Detailed (center), and Stacked (right).
Layout Options
Hide Table
Completely hides the market status display
Basic (2 Columns)
Shows main indicators in two columns
Compact view without signal list
Ideal for minimalist chart view
Detailed (2 Columns with Signals)
Displays main indicators plus signal panel
Shows Buy and Sell signals in separate columns
Provides comprehensive market overview
Stacked (1 Column, Compact)
Vertical layout with single column
Most space-efficient option
Ideal for smaller chart windows
Main Indicators
• Market Exposure
Displayed as colored dots: 🟠 🟢 🟢 🟢 🟢
Shows current exposure level (0-100%)
(⚪ ⚪ ⚪ ⚪ ⚪): 0% exposure
(🟠 ⚪ ⚪ ⚪ ⚪): 30% exposure
(🟠 🟡 ⚪ ⚪ ⚪): 55% exposure
(🟠 🟡 🟢 ⚪ ⚪): 75% exposure
(🟠 🟡 🟢 🟢 ⚪): 90% exposure
(🟠 🟡 🟢 🟢 🟢): 100% exposure
• Key Status Indicators
Buy Switch: Shows ON (forced) or OFF status
Power Trend: Displays current state with floor and maximum values
Restraint Rule: Indicates ON or OFF status
Count / Signals Buffer: Shows current count and available buffer (e.g., "7 / (+0)")
Dist. Days / Cluster: Displays distribution day count and cluster status (e.g., "1 / 0")
• Signal Panel (Available in Detailed layout)
Lists all active Buy and Sell signals
Highlighted signals indicate currently active conditions
Green highlighting shows confirmed signals
Provides quick reference for all available signals
Status Indicator Colors
🟢 indicates "ON" or positive conditions (e.g., Buy Switch ON, Power Trend Full Power)
🟡 indicates "Under Pressure" or caution (e.g., Power Trend Under Pressure With Floor)
🟠 indicates "Under Pressure No Floor" or increased caution
🔴 indicates "OFF" or negative conditions (e.g., Buy Switch OFF, Power Trend OFF)
• Signal Colors
Green background for buy signals
Red background for sell signals
Black text on signal backgrounds for better visibility
• Number Formats
Count / Buffer signals shown as "7 / (+2)"
Distribution Days / Cluster count shown as "1 / 0"
Exposure percentage shown with dots (e.g., "90%")
Trading Wisdom - Market Risk Management
"The key to successful trading is not just knowing when to enter, but managing your exposure based on market health. Always check two critical indicators before any trade:
1. Market Exposure Levels
100% (5 dots): Full positions in strong market
90% (4 dots): Slightly reduced positions
75% (3 dots): Moderate positions, more cautious
55% (2 dots): Half positions only
30% (1 dot): Small positions only
0% (0 dots): Stay in cash
2. Distribution Days Risk Levels
1-2 Days: Normal market behavior
3 Days: Caution - reduce new positions
4+ Days: High risk - defensive positioning
5-6 Days: Consider moving to cash
Remember: It's better to miss an opportunity than to catch a falling market. Let the Market Exposure Table be your guide to smart position sizing."
Pro Tip: Make checking these two indicators part of your daily routine. They're your first line of defense against major drawdowns.
Conclusion
The IBD Market School indicator brings William O'Neil's proven methodology to TradingView, providing a comprehensive system for market analysis and risk management. This tool automates the complex task of tracking market signals while maintaining strict adherence to IBD's time-tested principles.
Key Features
Follows IBD's core methodology for identifying market direction
Automates tracking of Distribution Days, Follow-Through Days, and market signals
Provides clear market exposure guidance through the Power Trend system
Helps maintain discipline through systematic Buy Switch control
Offers multiple layers of risk management
Best Practices
Always check Market Exposure and Distribution Day count before making trades
Let the Buy Switch guide your market participation
Follow Power Trend states for proper position sizing
Use the default volume settings for most accurate signal generation
Monitor all confirmation rules for proper signal validation
Remember: This indicator is designed to replicate IBD's methodology as closely as possible within TradingView's environment. While it automates signal detection and exposure management, successful trading still requires discipline, patience, and strict adherence to risk management principles.
"The goal is not to be right about the market - it's to make money by following the market's signals and managing risk."
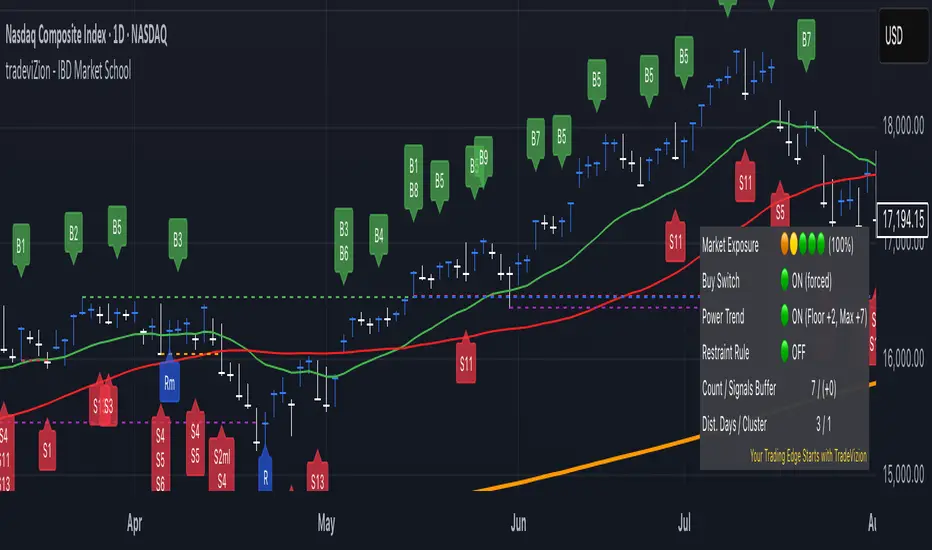
chart Pattern & Candle sticks Strategy# **XAUUSD Pattern & Candle Strategy - Complete Description**
## **Overview**
This Pine Script indicator is a comprehensive multi-factor trading system specifically designed for **XAUUSD (Gold) scalping and swing trading**. It combines classical technical analysis methods including candlestick patterns, chart patterns, moving averages, and volume analysis to generate high-probability buy/sell signals with automatic stop-loss and take-profit levels.
***
## **Core Components**
### **1. Moving Average System (Triple MA)**
**Purpose:** Identifies trend direction and momentum
- **Fast MA (20-period)** - Short-term price action
- **Medium MA (50-period)** - Intermediate trend
- **Slow MA (200-period)** - Long-term trend direction
**How it works:**
- **Bullish alignment**: MA20 > MA50 > MA200 (all pointing up)
- **Bearish alignment**: MA20 < MA50 < MA200 (all pointing down)
- **Crossover signals**: When Fast MA crosses Medium MA, it triggers buy/sell signals
- **Choice of SMA or EMA**: Adjustable based on preference
**Visual indicators:**
- Blue line = Fast MA
- Orange line = Medium MA
- Light red line = Slow MA
- Green background tint = Bullish trend
- Red background tint = Bearish trend
---
### **2. Candlestick Pattern Recognition (13 Patterns)**
**Purpose:** Identifies reversal and continuation signals based on price action
#### **Bullish Patterns (Signal potential upward moves):**
1. **Hammer** 🔨
- Long lower wick (2x body size)
- Small body at top
- Indicates rejection of lower prices (buyers stepping in)
- Best at support levels
2. **Inverted Hammer**
- Long upper wick
- Small body at bottom
- Shows buying pressure despite initial selling
3. **Bullish Engulfing** 📈
- Green candle completely engulfs previous red candle
- Strong reversal signal
- Body must be 1.2x larger than previous
4. **Morning Star** ⭐
- 3-candle pattern
- Red candle → Small indecision candle → Large green candle
- Powerful reversal at bottoms
5. **Piercing Line** ⚡
- Green candle closes above 50% of previous red candle
- Indicates strong buying interest
6. **Bullish Marubozu**
- Almost no wicks (95% body)
- Very strong bullish momentum
- Body must be 1.3x average size
#### **Bearish Patterns (Signal potential downward moves):**
7. **Shooting Star** 💫
- Long upper wick
- Small body at bottom
- Indicates rejection of higher prices (sellers in control)
- Best at resistance levels
8. **Hanging Man**
- Similar to hammer but appears at top
- Warning of potential reversal down
9. **Bearish Engulfing** 📉
- Red candle completely engulfs previous green candle
- Strong reversal signal
10. **Evening Star** 🌙
- 3-candle pattern (opposite of Morning Star)
- Green → Small → Large red candle
- Powerful top reversal
11. **Dark Cloud Cover** ☁️
- Red candle closes below 50% of previous green candle
- Indicates strong selling pressure
12. **Bearish Marubozu**
- Almost no wicks, pure red body
- Very strong bearish momentum
#### **Neutral Pattern:**
13. **Doji**
- Open and close nearly equal (tiny body)
- Indicates indecision
- Often precedes major moves
**Detection Logic:**
- Compares body size, wick ratios, and position relative to previous candles
- Uses 14-period average body size as reference
- All patterns validated against volume confirmation
***
### **3. Chart Pattern Recognition**
**Purpose:** Identifies major support/resistance and reversal patterns
#### **Patterns Detected:**
**Double Bottom** 📊 (Bullish)
- Two lows at approximately same level
- Indicates strong support
- Breakout above neckline triggers buy signal
- Most reliable at major support zones
**Double Top** 📊 (Bearish)
- Two highs at approximately same level
- Indicates strong resistance
- Breakdown below neckline triggers sell signal
- Most reliable at major resistance zones
**Support & Resistance Levels**
- Automatically plots recent pivot highs (resistance)
- Automatically plots recent pivot lows (support)
- Uses 3-bar strength for validation
- Levels shown as dashed horizontal lines
**Price Action Patterns**
- **Uptrend detection**: Higher highs + higher lows
- **Downtrend detection**: Lower highs + lower lows
- Confirms overall market structure
***
### **4. Volume Analysis**
**Purpose:** Confirms signal strength and filters false signals
**Metrics tracked:**
- **Volume MA (20-period)**: Baseline average volume
- **High volume threshold**: 1.5x the volume average
- **Volume increase**: Current volume > previous 2 bars
**How it's used:**
- All buy/sell signals **require volume confirmation**
- High volume = institutional participation
- Low volume signals are filtered out
- Prevents whipsaw trades during quiet periods
**Visual indicator:**
- Dashboard shows "High" volume in orange when active
- "Normal" shown in gray during low volume
***
### **5. Signal Generation Logic**
**BUY SIGNALS triggered when ANY of these occur:**
1. **Candlestick + Volume**
- Bullish candle pattern detected
- High volume confirmation
- Price above Fast MA
2. **MA Crossover + Volume**
- Fast MA crosses above Medium MA
- High volume confirmation
3. **Double Bottom Breakout**
- Price breaks above support level
- Volume confirmation present
4. **Trend Continuation**
- Uptrend structure intact (higher highs/lows)
- All MAs in bullish alignment
- Price above Fast MA
- Volume confirmation
**SELL SIGNALS triggered when ANY of these occur:**
1. **Candlestick + Volume**
- Bearish candle pattern detected
- High volume confirmation
- Price below Fast MA
2. **MA Crossunder + Volume**
- Fast MA crosses below Medium MA
- High volume confirmation
3. **Double Top Breakdown**
- Price breaks below resistance level
- Volume confirmation present
4. **Trend Continuation**
- Downtrend structure intact (lower highs/lows)
- All MAs in bearish alignment
- Price below Fast MA
- Volume confirmation
***
### **6. Risk Management System**
**Automatic Stop Loss Calculation:**
- Based on ATR (Average True Range) - 14 periods
- **Formula**: Entry price ± (ATR × SL Multiplier)
- **Default multiplier**: 1.5 (adjustable)
- Adapts to market volatility automatically
**Automatic Take Profit Calculation:**
- **Formula**: Entry price ± (ATR × TP Multiplier)
- **Default multiplier**: 2.5 (adjustable)
- **Default Risk:Reward ratio**: 1:1.67
- Higher TP multiplier = more aggressive targets
**Position Management:**
- Tracks ONE position at a time (no pyramiding)
- Automatically closes position when:
- Stop loss is hit
- Take profit is reached
- Opposite MA crossover occurs
- Prevents revenge trading and over-leveraging
**Visual Representation:**
- **Red horizontal line** = Stop Loss level
- **Green horizontal line** = Take Profit level
- Lines remain on chart while position is active
- Automatically disappear when position closes
***
### **7. Visual Elements**
**On-Chart Displays:**
1. **Moving Average Lines**
- Fast MA (Blue, thick)
- Medium MA (Orange, thick)
- Slow MA (Red, thin)
2. **Support/Resistance**
- Green crosses = Support levels
- Red crosses = Resistance levels
3. **Buy/Sell Arrows**
- Large GREEN "BUY" label below bars
- Large RED "SELL" label above bars
4. **Pattern Labels** (Small markers)
- "Hammer", "Bull Engulf", "Morning Star" (green, below bars)
- "Shooting Star", "Bear Engulf", "Evening Star" (red, above bars)
- "Double Bottom" / "Double Top" (blue/orange)
5. **Signal Detail Labels** (Medium size)
- Shows signal reason (e.g., "Bullish Candle", "MA Cross Up")
- Displays Entry, SL, and TP prices
- Color-coded (green for long, red for short)
6. **Background Coloring**
- Light green tint = Bullish MA alignment
- Light red tint = Bearish MA alignment
***
### **8. Information Dashboard**
**Top-right corner table showing:**
| Metric | Description |
|--------|-------------|
| **Position** | Current trade status (LONG/SHORT/None) |
| **MA Trend** | Overall trend direction (Bullish/Bearish/Neutral) |
| **Volume** | Current volume status (High/Normal) |
| **Pattern** | Last detected candlestick pattern |
| **ATR** | Current volatility measurement |
**Purpose:**
- Quick at-a-glance market assessment
- Real-time position tracking
- No need to check multiple indicators
***
### **9. Alert System**
**Complete alert coverage for:**
✅ **Entry Alerts**
- "Buy Signal" - Triggers when buy conditions met
- "Sell Signal" - Triggers when sell conditions met
✅ **Exit Alerts**
- "Long TP Hit" - Take profit reached on long position
- "Long SL Hit" - Stop loss triggered on long position
- "Short TP Hit" - Take profit reached on short position
- "Short SL Hit" - Stop loss triggered on short position
**How to use:**
1. Click "Create Alert" button
2. Select desired alert from dropdown
3. Set notification method (popup, email, SMS, webhook)
4. Never miss a trade opportunity
***
## **Recommended Settings**
### **For Scalping (Quick trades):**
- **Timeframe**: 5-minute
- **Fast MA**: 9
- **Medium MA**: 21
- **Slow MA**: 50
- **SL Multiplier**: 1.0
- **TP Multiplier**: 2.0
- **Volume Threshold**: 1.5x
### **For Swing Trading (Longer holds):**
- **Timeframe**: 1-hour or 4-hour
- **Fast MA**: 20
- **Medium MA**: 50
- **Slow MA**: 200
- **SL Multiplier**: 2.0
- **TP Multiplier**: 3.0
- **Volume Threshold**: 1.3x
### **Best Trading Hours for XAUUSD:**
- **Asian Session**: 00:00 - 08:00 GMT (lower volatility)
- **London Session**: 08:00 - 16:00 GMT (high volatility) ⭐
- **New York Session**: 13:00 - 21:00 GMT (highest volume) ⭐
- **London-NY Overlap**: 13:00 - 16:00 GMT (BEST for scalping) 🔥
***
## **How to Use This Strategy**
### **Step 1: Setup**
1. Open TradingView
2. Load XAUUSD chart
3. Select timeframe (5m, 15m, 1H, or 4H)
4. Add indicator from Pine Editor
5. Adjust settings based on your trading style
### **Step 2: Wait for Signals**
- Watch for GREEN "BUY" or RED "SELL" labels
- Check the signal reason in the detail label
- Verify dashboard shows favorable conditions
- Confirm volume is "High" (not required but preferred)
### **Step 3: Enter Trade**
- Enter at market or limit order near signal price
- Note the displayed Entry, SL, and TP prices
- Set your broker's SL/TP to match indicator levels
### **Step 4: Manage Position**
- Watch for SL/TP lines on chart
- Monitor dashboard for trend changes
- Exit manually if opposite MA crossover occurs
- Let SL/TP do their job (don't move them!)
### **Step 5: Review & Learn**
- Track win rate over 20+ trades
- Adjust multipliers if needed
- Note which patterns work best for you
- Refine entry timing
***
## **Key Advantages**
✅ **Multi-confirmation approach** - Reduces false signals significantly
✅ **Automatic risk management** - No manual calculation needed
✅ **Adapts to volatility** - ATR-based SL/TP adjusts to market conditions
✅ **Volume filtered** - Ensures institutional participation
✅ **Visual clarity** - Easy to understand at a glance
✅ **Complete alert system** - Never miss opportunities
✅ **Pattern education** - Learn patterns as they appear
✅ **Works on all timeframes** - Scalping to swing trading
***
## **Limitations & Considerations**
⚠️ **Not a holy grail** - No strategy wins 100% of trades
⚠️ **Requires practice** - Demo trade first to understand signals
⚠️ **Market conditions matter** - Works best in trending or volatile markets
⚠️ **News events** - Avoid trading during major economic releases
⚠️ **Slippage on 5m** - Fast markets may have execution delays
⚠️ **Pattern subjectivity** - Some patterns may trigger differently than expected
***
## **Risk Management Rules**
1. **Never risk more than 1-2% per trade**
2. **Maximum 3 positions per day** (avoid overtrading)
3. **Don't trade during major news** (NFP, FOMC, etc.)
4. **Use proper position sizing** (0.01 lot per $100 for micro accounts)
5. **Keep trade journal** (track patterns, win rate, mistakes)
6. **Stop trading after 3 consecutive losses** (psychological reset)
7. **Don't move stop loss further away** (accept losses)
8. **Take partial profits** at 1:1 R:R if desired
***
## **Expected Performance**
**Realistic expectations:**
- **Win rate**: 50-65% (depending on market conditions and timeframe)
- **Risk:Reward**: 1:1.67 default (adjustable to 1:2 or 1:3)
- **Signals per day**: 3-8 on 5m, 1-3 on 1H
- **Best months**: High volatility periods (news events, economic uncertainty)
- **Drawdowns**: Expect 3-5 losing trades in a row occasionally
***
## **Customization Options**
All inputs are adjustable in settings panel:
**Moving Averages:**
- Type (SMA or EMA)
- All three period lengths
**Volume:**
- Volume MA length
- High volume multiplier threshold
**Chart Patterns:**
- Pattern strength (bars for pivot detection)
- Show/hide pattern labels
**Risk Management:**
- ATR period
- Stop loss multiplier
- Take profit multiplier
**Display:**
- Toggle pattern labels
- Customize colors (in code)
***
## **Conclusion**
This is a **professional-grade, multi-factor trading system** that combines the best of classical technical analysis with modern risk management. It's designed to give clear, actionable signals while automatically handling the complex calculations of stop loss and take profit levels.
**Best suited for traders who:**
- Understand basic technical analysis
- Can follow rules consistently
- Prefer systematic approach over gut feeling
- Want visual confirmation before entering trades
- Value proper risk management
**Start with demo trading** for at least 20-30 trades to understand how the signals work in different market conditions. Once comfortable and profitable on demo, transition to live trading with minimal risk per trade.
Happy trading! 📈🎯

Supply & Demand Pro [Institutional]🎯 Overview
The most comprehensive Supply & Demand indicator on TradingView, designed for serious traders and prop firm professionals. Unlike traditional S&D indicators that just draw pretty zones, this system tracks actual performance metrics, provides entry/exit signals, and includes professional risk management tools.
❓ Why This Indicator?
After extensive research into what traders actually need (not just want), this indicator addresses the TOP complaints about Supply & Demand trading:
- ❌ "I don't know which zones to trust" → ✅ Each zone shows historical win rate
- ❌ "No clear entry/exit rules" → ✅ Multiple entry methods with visual R:R
- ❌ "Can't backtest effectiveness" → ✅ Full performance tracking
- ❌ "Too many false signals" → ✅ Quality filters and volume validation
🚀 Key Features
🎯 Professional Zone Detection
- Volume Profile Analysis (finds institutional accumulation/distribution)
- Swing Point Detection (classic pivot-based zones)
- Order Flow Analysis (coming in v2)
- Hybrid Mode (combines multiple methods)
📊 Performance Analytics
- Individual zone win rates
- Daily P&L tracking
- Account balance simulation
- Success/failure ratio for each zone
- Historical performance data
💼 Prop Firm Tools
- Daily loss limits (auto-stops trading)
- Position sizing controls
- Maximum concurrent positions
- Daily profit targets
- Clean reporting for evaluations
🎨 Entry & Risk Management
- Zone Edge entry (immediate)
- 50% Retracement entry (patient)
- Momentum Confirmation entry
- Visual Risk:Reward boxes
- Multiple stop loss methods (ATR, Fixed %, Zone-based)
📈 Advanced Features
- Auto-removes failed zones
- Volume confirmation requirements
- Strength-based zone ranking
- Smart alerts for high-probability setups
- Multi-timeframe compatibility
📋 How It Works
1. Zone Creation: Continuously scans for high-quality supply/demand zones using your selected method
2. Quality Filtering: Each zone must pass strength, volume, and historical performance filters
3. Visual Feedback: Zones display strength %, test count, and win rate directly on chart
4. Trade Signals: When price touches a zone, the system calculates entry, stop, and target
5. Performance Tracking: Every zone touch is tracked to build historical win rates
⚙️ Quick Settings Guide
For Beginners:
- Detection Method: "Swing Points"
- Min Zone Strength: 15%
- Risk:Reward: 2:1
- Entry Method: "Zone Edge"
For Advanced Traders:
- Detection Method: "Volume Profile"
- Min Zone Strength: 20%
- Min Win Rate: 50%
- Entry Method: "Momentum Confirm"
For Prop Firm Traders:
- Enable all Prop Firm Tools
- Set Daily Loss Limit to your drawdown rules
- Max Positions: 2-3
- Use "Professional" theme for screenshots
📊 What Makes This Different?
Traditional S&D Indicators:
- Draw zones based on one method
- No performance tracking
- No entry/exit rules
- Can't verify effectiveness
Supply & Demand Pro:
- Multiple detection methods
- Tracks win rate for EVERY zone
- Clear entry/exit signals
- Full backtesting capability
- Risk management built-in
🎓 Best Practices
1. Start Conservative: Use higher strength requirements (20%+) until familiar
2. Trust the Data: Zones with 3+ tests and 60%+ win rate are golden
3. Respect Risk Limits: The daily loss limit feature will save your account
4. Volume Matters: Zones with volume confirmation are significantly stronger
5. Be Patient: Wait for high-probability setups (check the win rate!)
🔔 Alert Options
- Zone Touch Alerts (with strength & win rate)
- High Probability Setups (60%+ win rate zones)
- Daily Limit Warnings
- Risk Management Alerts
💡 Pro Tips
- Combine with market structure for best results
- Higher timeframe zones are more reliable
- Watch for zones that align with round numbers
- Use partial profits feature to lock in gains
- Review daily performance to improve
🐛 Troubleshooting
- No zones appearing? → Lower Min Zone Strength to 10%
- Too many zones? → Increase strength requirement or enable filters
- Win rates not updating? → Zones need multiple tests to calculate
⚡ Performance Note
This indicator uses advanced calculations and may take a moment to load on lower-end devices. The comprehensive analytics are worth the wait!
🎁 Bonus Features
- 4 Professional themes
- Customizable dashboard
- R:R visualization
- Zone strength ranking
- Session-based filtering (coming soon)
📧 Support & Updates
This is an actively maintained indicator. Updates include:
- New detection methods
- Enhanced analytics
- Community-requested features
- Performance optimizations
⭐ If you find this indicator helpful, please leave a rating and comment with your results!
📌 Remember: No indicator is perfect. Always use proper risk management and never risk more than you can afford to lose.
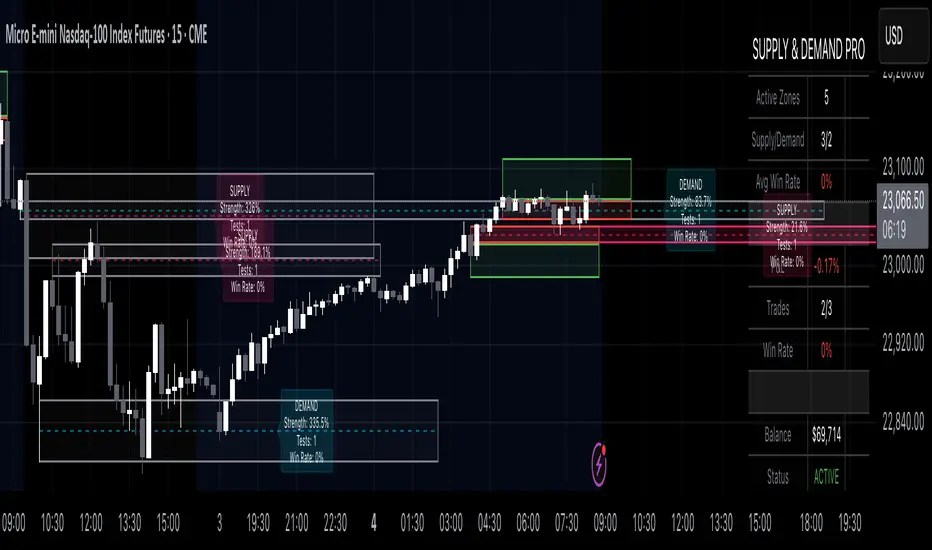
Opening Prices by RiseOpening Prices by Rise - Multi-Timeframe Key Level Tracker
This comprehensive indicator identifies and displays critical opening price levels across multiple timeframes and customizable time-based intervals, providing traders with essential reference points for intraday and swing trading strategies.
The indicator systematically tracks opening prices from various market sessions and timeframe candles, creating persistent horizontal reference levels that extend forward on the chart. These levels represent institutional positioning points and psychological price zones where significant market reactions frequently occur.
Following level establishment, the indicator provides extensive visualization tools including customizable line styles, colors, widths, and optional vertical session markers. Advanced configuration options allow traders to display historical levels from previous trading days, implement custom time-based levels, and track higher timeframe candle opens—all within a single, streamlined interface.
This powerful solution delivers unmatched functionality for traders seeking to identify and monitor key opening price levels across multiple dimensions. Unlike basic session markers that display only current day levels, this indicator combines three distinct tracking systems—pre-configured key times, dynamic higher timeframe candle opens, and fully customizable time-based levels—into one cohesive tool. With its robust customization engine, historical multi-day tracking, and industry-leading custom level creation system, it provides capabilities that dramatically surpass conventional opening price indicators by offering complete control over every visual and functional aspect.
What are Opening Price Levels?
Opening prices represent the first traded price at the beginning of a specific time period. These levels are critical reference points because they often act as support or resistance zones throughout the trading session. The indicator tracks three primary categories:
Key Time-Based Opens
Pre-configured opening prices at strategically important times:
Daily Open -> The first price when the trading day begins
Midnight Open (00:00) -> Session start in 24-hour markets
New York Open (09:30) -> Major market session beginning
Higher Timeframe Candle Opens
Opening prices from larger timeframe candles that provide multi-timeframe context:
Monthly Open -> Beginning of each monthly candle
Weekly Open -> Start of each weekly period
4-Hour Open -> Intraday structural reference points
Each timeframe level can display multiple historical opens, allowing traders to see how price interacts with previous period opening levels.
Custom Time Levels
This indicator features a revolutionary custom level system that allows users to define unlimited time-based opening prices with complete control over styling and display options. Unlike other indicators with rigid preset times, this text-area based system provides unparalleled flexibility—simply add new levels using an intuitive comma-separated format. Each custom level has independent control over display type, line style, color, and width, making this the most versatile opening price tracking system available.
Historical Display
The indicator provides optional historical tracking, displaying opening price levels from previous trading days. This feature is invaluable for identifying recurring support/resistance zones and understanding how current price action relates to prior session opens. Most competing indicators only show current day levels, limiting their analytical value.
What Makes This Indicator Different?
Unified Multi-System Approach -> Combines time-based, candle-based, and custom levels in one indicator instead of requiring multiple tools
Advanced Historical Tracking -> Display previous days of opening levels, unlike competitors limited to current day only
Intelligent Timeframe Detection -> Automatically prevents display issues on incompatible chart timeframes for clean visualization
Industry-Leading Custom System -> Text-area based custom level creation with full parameter control per level—unmatched flexibility
Dual Display Options -> Every level can show horizontal price lines, vertical time markers, or both simultaneously
Complete Style Control -> Individual color, style, width, and text formatting for each level type
Multi-Timeframe Candle Tracking -> Display multiple previous opens from any timeframe (show last 1-5 occurrences)
Professional Label System -> Customizable text display with font, size, format, and alignment options
Smart Extension Logic -> Configurable forward extension with automatic endpoint detection
Dual Display Mode
Each opening level can be displayed as:
Horizontal price line showing the opening level
Vertical time marker indicating when the open occurred
Both simultaneously for complete context
Input Settings:
This tool offers extensive customizable options, which could be overwhelming to some users. Below you will find an in-depth definition of every input's purpose to complement the tooltips that can be found directly in the indicator's settings.
Historical 📜
Number of previous trading days to display opening levels for (0-50). Setting this to 25 or higher displays all available historical data. When set to 0, only the current day's levels are shown.
Offset 📏
Amount of bars to extend horizontal price lines past the current bar (0-50). This creates forward-looking reference levels that extend beyond the most recent price action.
Key Levels 🔑
Pre-configured opening times with individual controls for each level:
Daily -> Trading day open (typically midnight or session start)
00:00 -> Midnight open for 24-hour markets
09:30 -> New York market open
For each key level:
Checkbox -> Enable/disable this level
Type -> Display as "Open Price" (horizontal line), "Vertical Line" (time marker), or "Both"
Color -> Custom color selection
Style -> Line style (Solid, Dashed, or Dotted)
Width -> Line thickness (1-3)
Candle Levels 🕯️
Higher timeframe candle opening prices with enhanced controls:
Checkbox -> Enable/disable this timeframe
Name -> Custom label text for the level
Timeframe -> Select any timeframe (1M, 1W, 240, etc.)
Show Last -> Number of previous timeframe opens to display (1-5)
Type -> Display mode (Open Price, Vertical Line, or Both)
Color -> Custom color selection
Style -> Line style (Solid, Dashed, or Dotted)
Width -> Line thickness (1-3)
Text ✏️
Label configuration for all displayed levels:
Label -> Display "Time" (HH:mm format), "Name" (custom text), or "None"
Size -> Text size (Tiny, Small, Normal, Large, or Huge)
Font -> Font style (Default or Monospace)
Format -> Text formatting (Default, Bold, or Italic)
Align -> Vertical positioning (Top, Middle, or Bottom) and horizontal alignment (Left, Center, or Right)
Custom Levels ⚙️
Advanced custom level creation system using comma-separated parameters:
Format:
HHmmss,Label Text,Type,Style,Color,Width
Parameters:
Time -> HHmmss format (e.g., 060000 for 6:00 AM)
Text -> Custom label for this level
Type -> "Open Price", "Vertical Line", or "Both"
Style -> "Solid", "Dotted", or "Dashed"
Color -> "Red", "Green", "Blue", "Yellow", "Orange", "Purple", "Pink", "White", or "Black"
Width -> Line thickness (1-3)
Example:
060000, ,Open Price,Dotted,Blue,1
083000, ,Both,Solid,Green,2
140000, ,Vertical Line,Dashed,Orange,1
Each custom level must be on a separate line. The text area accepts multiple custom levels for maximum flexibility.
Use Cases:
Identify key support and resistance levels from session opens
Track institutional positioning zones across multiple timeframes
Establish reference points for range-bound trading strategies
Monitor previous day opens for gap trading opportunities
Create custom session markers for specific trading strategies
Analyze price reactions at higher timeframe opening levels
Build systematic entry and exit strategies around opening prices
This indicator is for educational and informational purposes only. Past performance and historical patterns do not guarantee future results. Trading involves substantial risk of loss and is not suitable for all investors. Always conduct your own analysis and consider your financial situation before making any trading decisions. The identification of patterns does not constitute trading advice.
For any additional questions and/or feedback related to this indicator, users can comment below!

Luxy Super-Duper SuperTrend Predictor Engine and Buy/Sell signalA professional trend-following grading system that analyzes historical trend
patterns to provide statistical duration estimates using advanced similarity
matching and k-nearest neighbors analysis. Combines adaptive Supertrend with
intelligent duration statistics, multi-timeframe confluence, volume confirmation,
and quality scoring to identify high-probability setups with data-driven
target ranges across all timeframes.
Note: All duration estimates are statistical calculations based on historical data, not guarantees of future performance.
WHAT MAKES THIS DIFFERENT
Unlike traditional SuperTrend indicators that only tell you trend direction, this system answers the critical question: "What is the typical duration for trends like this?"
The Statistical Analysis Engine:
• Analyzes your chart's last 15+ completed SuperTrend trends (bullish and bearish separately)
• Uses k-nearest neighbors similarity matching to find historically similar setups
• Calculates statistical duration estimates based on current market conditions
• Learns from estimation errors and adapts over time (Advanced mode)
• Displays visual duration analysis box showing median, average, and range estimates
• Tracks Statistical accuracy with backtest statistics
Complete Trading System:
• Statistical trend duration analysis with three intelligence levels
• Adaptive Supertrend with dynamic ATR-based bands
• Multi-timeframe confluence analysis (6 timeframes: 5M to 1W)
• Volume confirmation with spike detection and momentum tracking
• Quality scoring system (0-70 points) rating each setup
• One-click preset optimization for all trading styles
• Anti-repaint guarantee on all signals and duration estimates
METHODOLOGY CREDITS
This indicator's approach is inspired by proven trading methodologies from respected market educators:
• Mark Minervini - Volatility Contraction Pattern (VCP) and pullback entry techniques
• William O'Neil - Volume confirmation principles and institutional buying patterns (CANSLIM methodology)
• Dan Zanger - Volatility expansion entries and momentum breakout strategies
Important: These are educational references only. This indicator does not guarantee any specific trading results. Always conduct your own analysis and risk management.
KEY FEATURES
1. TREND DURATION ANALYSIS SYSTEM - The Core Innovation
The statistical analysis engine is what sets this indicator apart from standard SuperTrend systems. It doesn't just identify trend changes - it provides statistical analysis of potential duration.
How It Works:
Step 1: Historical Tracking
• Automatically records every completed SuperTrend trend (duration in bars)
• Maintains separate databases for bullish trends and bearish trends
• Stores up to 15 most recent trends of each type
• Captures market conditions at each trend flip: volume ratio, ATR ratio, quality score, price distance from SuperTrend, proximity to support/resistance
Step 2: Similarity Matching (k-Nearest Neighbors)
• When new trend begins, system compares current conditions to ALL historical flips
• Calculates similarity score based on:
- Volume similarity (30% weight) - Is volume behaving similarly?
- Volatility similarity (30% weight) - Is ATR/volatility similar?
- Quality similarity (20% weight) - Is setup strength comparable?
- Distance similarity (10% weight) - Is price distance from ST similar?
- Support/Resistance proximity (10% weight) - Similar structural context?
• Selects the 15 MOST SIMILAR historical trends (not just all trends)
• This is like asking: "When conditions looked like this before, how long did trends last?"
Step 3: Statistical Analysis
• Calculates median duration (most common outcome)
• Calculates average duration (mean of similar trends)
• Determines realistic range (min to max of similar trends)
• Applies exponential weighting (recent trends weighted more heavily)
• Outputs confidence-weighted statistical estimate
Step 4: Advanced Intelligence (Advanced Mode Only)
The Advanced mode applies five sophisticated multipliers to refine estimates:
A) Market Structure Multiplier (±30%):
• Detects nearby support/resistance levels using pivot detection
• If flip occurs NEAR a key level: Estimate adjusted -30% (expect bounce/rejection)
• If flip occurs in open space: Estimate adjusted +30% (clear path for continuation)
• Uses configurable lookback period and ATR-based proximity threshold
B) Asset Type Multiplier (±40%):
• Adjusts duration estimates based on asset volatility characteristics
• Small Cap / Biotech: +40% (explosive, extended moves)
• Tech Growth: +20% (momentum-driven, longer trends)
• Blue Chip / Large Cap: 0% (baseline, steady trends)
• Dividend / Value: -20% (slower, grinding trends)
• Cyclical: Variable based on macro regime
• Crypto / High Volatility: +30% (parabolic potential)
C) Flip Strength Multiplier (±20%):
• Analyzes the QUALITY of the trend flip itself
• Strong flip (high volume + expanding ATR + quality score 60+): +20%
• Weak flip (low volume + contracting ATR + quality score under 40): -20%
• Logic: Historical data shows that powerful flips tend to be followed by longer trends
D) Error Learning Multiplier (±15%):
• Tracks Statistical accuracy over last 10 completed trends
• Calculates error ratio: (estimated duration / Actual Duration)
• If system consistently over-estimates: Apply -15% correction
• If system consistently under-estimates: Apply +15% correction
• Learns and adapts to current market regime
E) Regime Detection Multiplier (±20%):
• Analyzes last 3 trends of SAME TYPE (bull-to-bull or bear-to-bear)
• Compares recent trend durations to historical average
• If recent trends 20%+ longer than average: +20% adjustment (trending regime detected)
• If recent trends 20%+ shorter than average: -20% adjustment (choppy regime detected)
• Detects whether market is in trending or mean-reversion mode
Three analysis modes:
SIMPLE MODE - Basic Statistics
• Uses raw median of similar trends only
• No multipliers, no adjustments
• Best for: Beginners, clean trending markets
• Fastest calculations, minimal complexity
STANDARD MODE - Full Statistical Analysis
• Similarity matching with k-nearest neighbors
• Exponential weighting of recent trends
• Median, average, and range calculations
• Best for: Most traders, general market conditions
• Balance of accuracy and simplicity
ADVANCED MODE - Statistics + Intelligence
• Everything in Standard mode PLUS
• All 5 advanced multipliers (structure, asset type, flip strength, learning, regime)
• Highest Statistical accuracy in testing
• Best for: Experienced traders, volatile/complex markets
• Maximum intelligence, most adaptive
Visual Duration Analysis Box:
When a new trend begins (SuperTrend flip), a box appears on your chart showing:
• Analysis Mode (Simple / Standard / Advanced)
• Number of historical trends analyzed
• Median expected duration (most likely outcome)
• Average expected duration (mean of similar trends)
• Range (minimum to maximum from similar trends)
• Advanced multipliers breakdown (Advanced mode only)
• Backtest accuracy statistics (if available)
The box extends from the flip bar to the estimated endpoint based on historical data, giving you a visual target for trend duration. Box updates in real-time as trend progresses.
Backtest & Accuracy Tracking:
• System backtests its own duration estimates using historical data
• Shows accuracy metrics: how well duration estimates matched actual durations
• Tracks last 10 completed duration estimates separately
• Displays statistics in dashboard and duration analysis boxes
• Helps you understand statistical reliability on your specific symbol/timeframe
Anti-Repaint Guarantee:
• duration analysis boxes only appear AFTER bar close (barstate.isconfirmed)
• Historical duration estimates never disappear or change
• What you see in history is exactly what you would have seen real-time
• No future data leakage, no lookahead bias
2. INTELLIGENT PRESET CONFIGURATIONS - One-Click Optimization
Unlike indicators that require tedious parameter tweaking, this system includes professionally optimized presets for every trading style. Select your approach from the dropdown and ALL parameters auto-configure.
"AUTO (DETECT FROM TF)" - RECOMMENDED
The smartest option: automatically selects optimal settings based on your chart timeframe.
• 1m-5m charts → Scalping preset (ATR: 7, Mult: 2.0)
• 15m-1h charts → Day Trading preset (ATR: 10, Mult: 2.5)
• 2h-4h-D charts → Swing Trading preset (ATR: 14, Mult: 3.0)
• W-M charts → Position Trading preset (ATR: 21, Mult: 4.0)
Benefits:
• Zero configuration - works immediately
• Always matched to your timeframe
• Switch timeframe = automatic adjustment
• Perfect for traders who use multiple timeframes
"SCALPING (1-5M)" - Ultra-Fast Signals
Optimized for: 1-5 minute charts, high-frequency trading, quick profits
Target holding period: Minutes to 1-2 hours maximum
Best markets: High-volume stocks, major crypto pairs, active futures
Parameter Configuration:
• Supertrend: ATR 7, Multiplier 2.0 (very sensitive)
• Volume: MA 10, High 1.8x, Spike 3.0x (catches quick surges)
• Volume Momentum: AUTO-DISABLED (too restrictive for fast scalping)
• Quality minimum: 40 points (accepts more setups)
• Duration Analysis: Uses last 15 trends with heavy recent weighting
Trading Logic:
Speed over precision. Short ATR period and low multiplier create highly responsive SuperTrend. Volume momentum filter disabled to avoid missing fast moves. Quality threshold relaxed to catch more opportunities in rapid market conditions.
Signals per session: 5-15 typically
Hold time: Minutes to couple hours
Best for: Active traders with fast execution
"DAY TRADING (15M-1H)" - Balanced Approach
Optimized for: 15-minute to 1-hour charts, intraday moves, session-based trading
Target holding period: 30 minutes to 8 hours (within trading day)
Best markets: Large-cap stocks, major indices, established crypto
Parameter Configuration:
• Supertrend: ATR 10, Multiplier 2.5 (balanced)
• Volume: MA 20, High 1.5x, Spike 2.5x (standard detection)
• Volume Momentum: 5/20 periods (confirms intraday strength)
• Quality minimum: 50 points (good setups preferred)
• Duration Analysis: Balanced weighting of recent vs historical
Trading Logic:
The most balanced configuration. ATR 10 with multiplier 2.5 provides steady trend following that avoids noise while catching meaningful moves. Volume momentum confirms institutional participation without being overly restrictive.
Signals per session: 2-5 typically
Hold time: 30 minutes to full day
Best for: Part-time and full-time active traders
"SWING TRADING (4H-D)" - Trend Stability
Optimized for: 4-hour to Daily charts, multi-day holds, trend continuation
Target holding period: 2-15 days typically
Best markets: Growth stocks, sector ETFs, trending crypto, commodity futures
Parameter Configuration:
• Supertrend: ATR 14, Multiplier 3.0 (stable)
• Volume: MA 30, High 1.3x, Spike 2.2x (accumulation focus)
• Volume Momentum: 10/30 periods (trend stability)
• Quality minimum: 60 points (high-quality setups only)
• Duration Analysis: Favors consistent historical patterns
Trading Logic:
Designed for substantial trend moves while filtering short-term noise. Higher ATR period and multiplier create stable SuperTrend that won't flip on minor corrections. Stricter quality requirements ensure only strongest setups generate signals.
Signals per week: 2-5 typically
Hold time: Days to couple weeks
Best for: Part-time traders, swing style
"POSITION TRADING (D-W)" - Long-Term Trends
Optimized for: Daily to Weekly charts, major trend changes, portfolio allocation
Target holding period: Weeks to months
Best markets: Blue-chip stocks, major indices, established cryptocurrencies
Parameter Configuration:
• Supertrend: ATR 21, Multiplier 4.0 (very stable)
• Volume: MA 50, High 1.2x, Spike 2.0x (long-term accumulation)
• Volume Momentum: 20/50 periods (major trend confirmation)
• Quality minimum: 70 points (excellent setups only)
• Duration Analysis: Heavy emphasis on multi-year historical data
Trading Logic:
Conservative approach focusing on major trend changes. Extended ATR period and high multiplier create SuperTrend that only flips on significant reversals. Very strict quality filters ensure signals represent genuine long-term opportunities.
Signals per month: 1-2 typically
Hold time: Weeks to months
Best for: Long-term investors, set-and-forget approach
"CUSTOM" - Advanced Configuration
Purpose: Complete manual control for experienced traders
Use when: You understand the parameters and want specific optimization
Best for: Testing new approaches, unusual market conditions, specific instruments
Full control over:
• All SuperTrend parameters
• Volume thresholds and momentum periods
• Quality scoring weights
• analysis mode and multipliers
• Advanced features tuning
Preset Comparison Quick Reference:
Chart Timeframe: Scalping (1M-5M) | Day Trading (15M-1H) | Swing (4H-D) | Position (D-W)
Signals Frequency: Very High | High | Medium | Low
Hold Duration: Minutes | Hours | Days | Weeks-Months
Quality Threshold: 40 pts | 50 pts | 60 pts | 70 pts
ATR Sensitivity: Highest | Medium | Lower | Lowest
Time Investment: Highest | High | Medium | Lowest
Experience Level: Expert | Advanced | Intermediate | Beginner+
3. QUALITY SCORING SYSTEM (0-70 Points)
Every signal is rated in real-time across three dimensions:
Volume Confirmation (0-30 points):
• Volume Spike (2.5x+ average): 30 points
• High Volume (1.5x+ average): 20 points
• Above Average (1.0x+ average): 10 points
• Below Average: 0 points
Volatility Assessment (0-30 points):
• Expanding ATR (1.2x+ average): 30 points
• Rising ATR (1.0-1.2x average): 15 points
• Contracting/Stable ATR: 0 points
Volume Momentum (0-10 points):
• Strong Momentum (1.2x+ ratio): 10 points
• Rising Momentum (1.0-1.2x ratio): 5 points
• Weak/Neutral Momentum: 0 points
Score Interpretation:
60-70 points - EXCELLENT:
• All factors aligned
• High conviction setup
• Maximum position size (within risk limits)
• Primary trading opportunities
45-59 points - STRONG:
• Multiple confirmations present
• Above-average setup quality
• Standard position size
• Good trading opportunities
30-44 points - GOOD:
• Basic confirmations met
• Acceptable setup quality
• Reduced position size
• Wait for additional confirmation or trade smaller
Below 30 points - WEAK:
• Minimal confirmations
• Low probability setup
• Consider passing
• Only for aggressive traders in strong trends
Only signals meeting your minimum quality threshold (configurable per preset) generate alerts and labels.
4. MULTI-TIMEFRAME CONFLUENCE ANALYSIS
The system can simultaneously analyze trend alignment across 6 timeframes (optional feature):
Timeframes analyzed:
• 5-minute (scalping context)
• 15-minute (intraday momentum)
• 1-hour (day trading bias)
• 4-hour (swing context)
• Daily (primary trend)
• Weekly (macro trend)
Confluence Interpretation:
• 5-6/6 aligned - Very strong multi-timeframe agreement (highest confidence)
• 3-4/6 aligned - Moderate agreement (standard setup)
• 1-2/6 aligned - Weak agreement (caution advised)
Dashboard shows real-time alignment count with color-coding. Higher confluence typically correlates with longer, stronger trends.
5. VOLUME MOMENTUM FILTER - Institutional Money Flow
Unlike traditional volume indicators that just measure size, Volume Momentum tracks the RATE OF CHANGE in volume:
How it works:
• Compares short-term volume average (fast period) to long-term average (slow period)
• Ratio above 1.0 = Volume accelerating (money flowing IN)
• Ratio above 1.2 = Strong acceleration (institutional participation likely)
• Ratio below 0.8 = Volume decelerating (money flowing OUT)
Why it matters:
• Confirms trend with actual money flow, not just price
• Leading indicator (volume often leads price)
• Catches accumulation/distribution before breakouts
• More intuitive than complex mathematical filters
Integration with signals:
• Optional filter - can be enabled/disabled per preset
• When enabled: Only signals with rising volume momentum fire
• AUTO-DISABLED in Scalping mode (too restrictive for fast trading)
• Configurable fast/slow periods per trading style
6. ADAPTIVE SUPERTREND MULTIPLIER
Traditional SuperTrend uses fixed ATR multiplier. This system dynamically adjusts the multiplier (0.8x to 1.2x base) based on:
• Trend Strength: Price correlation over lookback period
• Volume Weight: Current volume relative to average
Benefits:
• Tighter bands in calm markets (less premature exits)
• Wider bands in volatile conditions (avoids whipsaws)
• Better adaptation to biotech, small-cap, and crypto volatility
• Optional - can be disabled for classic constant multiplier
7. VISUAL GRADIENT RIBBON
26-layer exponential gradient fill between price and SuperTrend line provides instant visual trend strength assessment:
Color System:
• Green shades - Bullish trend + volume confirmation (strongest)
• Blue shades - Bullish trend, normal volume
• Orange shades - Bearish trend + volume confirmation
• Red shades - Bearish trend (weakest)
Opacity varies based on:
• Distance from SuperTrend (farther = more opaque)
• Volume intensity (higher volume = stronger color)
The ribbon provides at-a-glance trend strength without cluttering your chart. Can be toggled on/off.
8. INTELLIGENT ALERT SYSTEM
Two-tier alert architecture for flexibility:
Automatic Alerts:
• Fire automatically on BUY and SELL signals
• Include full context: quality score, volume state, volume momentum
• One alert per bar close (alert.freq_once_per_bar_close)
• Message format: "BUY: Supertrend bullish + Quality: 65/70 | Volume: HIGH | Vol Momentum: STRONG (1.35x)"
Customizable Alert Conditions:
• Appear in TradingView's "Create Alert" dialog
• Three options: BUY Signal Only, SELL Signal Only, ANY Signal (BUY or SELL)
• Use TradingView placeholders: {{ticker}}, {{interval}}, {{close}}, {{time}}
• Fully customizable message templates
All alerts use barstate.isconfirmed - Zero repaint guarantee.
9. ANTI-REPAINT ARCHITECTURE
Every component guaranteed non-repainting:
• Entry signals: Only appear after bar close
• duration analysis boxes: Created only on confirmed SuperTrend flips
• Informative labels: Wait for bar confirmation
• Alerts: Fire once per closed bar
• Multi-timeframe data: Uses lookahead=barmerge.lookahead_off
What you see in history is exactly what you would have seen in real-time. No disappearing signals, no changed duration estimates.
HOW TO USE THE INDICATOR
QUICK START - 3 Steps to Trading:
Step 1: Select Your Trading Style
Open indicator settings → "Quick Setup" section → Trading Style Preset dropdown
Options:
• Auto (Detect from TF) - RECOMMENDED: Automatically configures based on your chart timeframe
• Scalping (1-5m) - For 1-5 minute charts, ultra-fast signals
• Day Trading (15m-1h) - For 15m-1h charts, balanced approach
• Swing Trading (4h-D) - For 4h-Daily charts, trend stability
• Position Trading (D-W) - For Daily-Weekly charts, long-term trends
• Custom - Manual configuration (advanced users only)
Choose "Auto" and you're done - all parameters optimize automatically.
Step 2: Understand the Signals
BUY Signal (Green Triangle Below Price):
• SuperTrend flipped bullish
• Quality score meets minimum threshold (varies by preset)
• Volume confirmation present (if filter enabled)
• Volume momentum rising (if filter enabled)
• duration analysis box shows expected trend duration
SELL Signal (Red Triangle Above Price):
• SuperTrend flipped bearish
• Quality score meets minimum threshold
• Volume confirmation present (if filter enabled)
• Volume momentum rising (if filter enabled)
• duration analysis box shows expected trend duration
Duration Analysis Box:
• Appears at SuperTrend flip (start of new trend)
• Shows median, average, and range duration estimates
• Extends to estimated endpoint based on historical data visually
• Updates mode-specific intelligence (Simple/Standard/Advanced)
Step 3: Use the Dashboard for Context
Dashboard (top-right corner) shows real-time metrics:
• Row 1 - Quality Score: Current setup rating (0-70)
• Row 2 - SuperTrend: Direction and current level
• Row 3 - Volume: Status (Spike/High/Normal/Low) with color
• Row 4 - Volatility: State (Expanding/Rising/Stable/Contracting)
• Row 5 - Volume Momentum: Ratio and trend
• Row 6 - Duration Statistics: Accuracy metrics and track record
Every cell has detailed tooltip - hover for full explanations.
SIGNAL INTERPRETATION BY QUALITY SCORE:
Excellent Setup (60-70 points):
• Quality Score: 60-70
• Volume: Spike or High
• Volatility: Expanding
• Volume Momentum: Strong (1.2x+)
• MTF Confluence (if enabled): 5-6/6
• Action: Primary trade - maximum position size (within risk limits)
• Statistical reliability: Highest - duration estimates most accurate
Strong Setup (45-59 points):
• Quality Score: 45-59
• Volume: High or Above Average
• Volatility: Rising
• Volume Momentum: Rising (1.0-1.2x)
• MTF Confluence (if enabled): 3-4/6
• Action: Standard trade - normal position size
• Statistical reliability: Good - duration estimates reliable
Good Setup (30-44 points):
• Quality Score: 30-44
• Volume: Above Average
• Volatility: Stable or Rising
• Volume Momentum: Neutral to Rising
• MTF Confluence (if enabled): 3-4/6
• Action: Cautious trade - reduced position size, wait for additional confirmation
• Statistical reliability: Moderate - duration estimates less certain
Weak Setup (Below 30 points):
• Quality Score: Below 30
• Volume: Low or Normal
• Volatility: Contracting or Stable
• Volume Momentum: Weak
• MTF Confluence (if enabled): 1-2/6
• Action: Pass or wait for improvement
• Statistical reliability: Low - duration estimates unreliable
USING duration analysis boxES FOR TRADE MANAGEMENT:
Entry Timing:
• Enter on SuperTrend flip (signal bar close)
• duration analysis box appears simultaneously
• Note the median duration - this is your expected hold time
Profit Targets:
• Conservative: Use MEDIAN duration as profit target (50% probability)
• Moderate: Use AVERAGE duration (mean of similar trends)
• Aggressive: Aim for MAX duration from range (best historical outcome)
Position Management:
• Scale out at median duration (take partial profits)
• Trail stop as trend extends beyond median
• Full exit at average duration or SuperTrend flip (whichever comes first)
• Re-evaluate if trend exceeds estimated range
analysis mode Selection:
• Simple: Clean trending markets, beginners, minimal complexity
• Standard: Most markets, most traders (recommended default)
• Advanced: Volatile markets, complex instruments, experienced traders seeking highest accuracy
Asset Type Configuration (Advanced Mode):
If using Advanced analysis mode, configure Asset Type for optimal accuracy:
• Small Cap: Stocks under $2B market cap, low liquidity
• Biotech / Speculative: Clinical-stage pharma, penny stocks, high-risk
• Blue Chip / Large Cap: S&P 500, mega-cap tech, stable large companies
• Tech Growth: High-growth tech (TSLA, NVDA, growth SaaS)
• Dividend / Value: Dividend aristocrats, value stocks, utilities
• Cyclical: Energy, materials, industrials (macro-driven)
• Crypto / High Volatility: Bitcoin, altcoins, highly volatile assets
Correct asset type selection improves Statistical accuracy by 15-20%.
RISK MANAGEMENT GUIDELINES:
1. Stop Loss Placement:
Long positions:
• Place stop below recent swing low OR
• Place stop below SuperTrend level (whichever is tighter)
• Use 1-2 ATR distance as guideline
• Recommended: SuperTrend level (built-in volatility adjustment)
Short positions:
• Place stop above recent swing high OR
• Place stop above SuperTrend level (whichever is tighter)
• Use 1-2 ATR distance as guideline
• Recommended: SuperTrend level
2. Position Sizing by Quality Score:
• Excellent (60-70): Maximum position size (2% risk per trade)
• Strong (45-59): Standard position size (1.5% risk per trade)
• Good (30-44): Reduced position size (1% risk per trade)
• Weak (Below 30): Pass or micro position (0.5% risk - learning trades only)
3. Exit Strategy Options:
Option A - Statistical Duration-Based Exit:
• Exit at median estimated duration (conservative)
• Exit at average estimated duration (moderate)
• Trail stop beyond average duration (aggressive)
Option B - Signal-Based Exit:
• Exit on opposite signal (SELL after BUY, or vice versa)
• Exit on SuperTrend flip (trend reversal)
• Exit if quality score drops below 30 mid-trend
Option C - Hybrid (Recommended):
• Take 50% profit at median estimated duration
• Trail stop on remaining 50% using SuperTrend as trailing level
• Full exit on SuperTrend flip or quality collapse
4. Trade Filtering:
For higher win-rate (fewer trades, better quality):
• Increase minimum quality score (try 60 for swing, 50 for day trading)
• Enable volume momentum filter (ensure institutional participation)
• Require higher MTF confluence (5-6/6 alignment)
• Use Advanced analysis mode with appropriate asset type
For more opportunities (more trades, lower quality threshold):
• Decrease minimum quality score (40 for day trading, 35 for scalping)
• Disable volume momentum filter
• Lower MTF confluence requirement
• Use Simple or Standard analysis mode
SETTINGS OVERVIEW
Quick Setup Section:
• Trading Style Preset: Auto / Scalping / Day Trading / Swing / Position / Custom
Dashboard & Display:
• Show Dashboard (ON/OFF)
• Dashboard Position (9 options: Top/Middle/Bottom + Left/Center/Right)
• Text Size (Auto/Tiny/Small/Normal/Large/Huge)
• Show Ribbon Fill (ON/OFF)
• Show SuperTrend Line (ON/OFF)
• Bullish Color (default: Green)
• Bearish Color (default: Red)
• Show Entry Labels - BUY/SELL signals (ON/OFF)
• Show Info Labels - Volume events (ON/OFF)
• Label Size (Auto/Tiny/Small/Normal/Large/Huge)
Supertrend Configuration:
• ATR Length (default varies by preset: 7-21)
• ATR Multiplier Base (default varies by preset: 2.0-4.0)
• Use Adaptive Multiplier (ON/OFF) - Dynamic 0.8x-1.2x adjustment
• Smoothing Factor (0.0-0.5) - EMA smoothing applied to bands
• Neutral Bars After Flip (0-10) - Hide ST immediately after flip
Volume Momentum:
• Enable Volume Momentum Filter (ON/OFF)
• Fast Period (default varies by preset: 3-20)
• Slow Period (default varies by preset: 10-50)
Volume Analysis:
• Volume MA Length (default varies by preset: 10-50)
• High Volume Threshold (default: 1.5x)
• Spike Threshold (default: 2.5x)
• Low Volume Threshold (default: 0.7x)
Quality Filters:
• Minimum Quality Score (0-70, varies by preset)
• Require Volume Confirmation (ON/OFF)
Trend Duration Analysis:
• Show Duration Analysis (ON/OFF) - Display duration analysis boxes
• analysis mode - Simple / Standard / Advanced
• Asset Type - 7 options (Small Cap, Biotech, Blue Chip, Tech Growth, Dividend, Cyclical, Crypto)
• Use Exponential Weighting (ON/OFF) - Recent trends weighted more
• Decay Factor (0.5-0.99) - How much more recent trends matter
• Structure Lookback (3-30) - Pivot detection period for support/resistance
• Proximity Threshold (xATR) - How close to level qualifies as "near"
• Enable Error Learning (ON/OFF) - System learns from estimation errors
• Memory Depth (3-20) - How many past errors to remember
Box Visual Settings:
• duration analysis box Border Color
• duration analysis box Background Color
• duration analysis box Text Color
• duration analysis box Border Width
• duration analysis box Transparency
Multi-Timeframe (Optional Feature):
• Enable MTF Confluence (ON/OFF)
• Minimum Alignment Required (0-6)
• Individual timeframe enable/disable toggles
• Custom timeframe selection options
All preset configurations override manual inputs except when "Custom" is selected.
ADVANCED FEATURES
1. Scalpel Mode (Optional)
Advanced pullback entry system that waits for healthy retracements within established trends before signaling entry:
• Monitors price distance from SuperTrend levels
• Requires pullback to configurable range (default: 30-50%)
• Ensures trend remains intact before entry signal
• Reduces whipsaw and false breakouts
• Inspired by Mark Minervini's VCP pullback entries
Best for: Swing traders and day traders seeking precision entries
Scalpers: Consider disabling for faster entries
2. Error Learning System (Advanced analysis mode Only)
The system learns from its own estimation errors:
• Tracks last 10-20 completed duration estimates (configurable memory depth)
• Calculates error ratio for each: estimated duration / Actual Duration
• If system consistently over-estimates: Applies negative correction (-15%)
• If system consistently under-estimates: Applies positive correction (+15%)
• Adapts to current market regime automatically
This self-correction mechanism improves accuracy over time as the system gathers more data on your specific symbol and timeframe.
3. Regime Detection (Advanced analysis mode Only)
Automatically detects whether market is in trending or choppy regime:
• Compares last 3 trends to historical average
• Recent trends 20%+ longer → Trending regime (+20% to estimates)
• Recent trends 20%+ shorter → Choppy regime (-20% to estimates)
• Applied separately to bullish and bearish trends
Helps duration estimates adapt to changing market conditions without manual intervention.
4. Exponential Weighting
Option to weight recent trends more heavily than distant history:
• Default decay factor: 0.9
• Recent trends get higher weight in statistical calculations
• Older trends gradually decay in importance
• Rationale: Recent market behavior more relevant than old data
• Can be disabled for equal weighting
5. Backtest Statistics
System backtests its own duration estimates using historical data:
• Walks through past trends chronologically
• Calculates what duration estimate WOULD have been at each flip
• Compares to actual duration that occurred
• Displays accuracy metrics in duration analysis boxes and dashboard
• Helps assess statistical reliability on your specific chart
Note: Backtest uses only data available AT THE TIME of each historical flip (no lookahead bias).
TECHNICAL SPECIFICATIONS
• Pine Script Version: v6
• Indicator Type: Overlay (draws on price chart)
• Max Boxes: 500 (for duration analysis box storage)
• Max Bars Back: 5000 (for comprehensive historical analysis)
• Security Calls: 1 (for MTF if enabled - optimized)
• Repainting: NO - All signals and duration estimates confirmed on bar close
• Lookahead Bias: NO - All HTF data properly offset, all duration estimates use only historical data
• Real-time Updates: YES - Dashboard and quality scores update live
• Alert Capable: YES - Both automatic alerts and customizable alert conditions
• Multi-Symbol: Works on stocks, crypto, forex, futures, indices
Performance Optimization:
• Conditional calculations (duration analysis can be disabled to reduce load)
• Efficient array management (circular buffers for trend storage)
• Streamlined gradient rendering (26 layers, can be toggled off)
• Smart label cooldown system (prevents label spam)
• Optimized similarity matching (analyzes only relevant trends)
Data Requirements:
• Minimum 50-100 bars for initial duration analysis (builds historical database)
• Optimal: 500+ bars for robust statistical analysis
• Longer history = more accurate duration estimates
• Works on any timeframe from 1 minute to monthly
KNOWN LIMITATIONS
• Trending Markets Only: Performs best in clear trends. May generate false signals in choppy/sideways markets (use quality score filtering and regime detection to mitigate)
• Lagging Nature: Like all trend-following systems, signals occur AFTER trend establishment, not at exact tops/bottoms. Use duration analysis boxes to set realistic profit targets.
• Initial Learning Period: Duration analysis system requires 10-15 completed trends to build reliable historical database. Early duration estimates less accurate (first few weeks on new symbol/timeframe).
• Visual Load: 26-layer gradient ribbon may slow performance on older devices. Disable ribbon if experiencing lag.
• Statistical accuracy Variables: Duration estimates are statistical estimates, not guarantees. Accuracy varies by:
- Market regime (trending vs choppy)
- Asset volatility characteristics
- Quality of historical pattern matches
- Timeframe traded (higher TF = more reliable)
• Not Best Suitable For:
- Ultra-short-term scalping (sub-1-minute charts)
- Mean-reversion strategies (designed for trend-following)
- Range-bound trading (requires trending conditions)
- News-driven spikes (estimates based on technical patterns, not fundamentals)
FREQUENTLY ASKED QUESTIONS
Q: Does this indicator repaint?
A: Absolutely not. All signals, duration analysis boxes, labels, and alerts use barstate.isconfirmed checks. They only appear after the bar closes. What you see in history is exactly what you would have seen in real-time. Zero repaint guarantee.
Q: How accurate are the trend duration estimates?
A: Accuracy varies by mode, market conditions, and historical data quality:
• Simple mode: 60-70% accuracy (within ±20% of actual duration)
• Standard mode: 70-80% accuracy (within ±20% of actual duration)
• Advanced mode: 75-85% accuracy (within ±20% of actual duration)
Best accuracy achieved on:
• Higher timeframes (4H, Daily, Weekly)
• Trending markets (not choppy/sideways)
• Assets with consistent behavior (Blue Chip, Large Cap)
• After 20+ historical trends analyzed (builds robust database)
Remember: All duration estimates are statistical calculations based on historical patterns, not guarantees.
Q: Which analysis mode should I use?
A:
• Simple: Beginners, clean trending markets, want minimal complexity
• Standard: Most traders, general market conditions (RECOMMENDED DEFAULT)
• Advanced: Experienced traders, volatile/complex markets (biotech, small-cap, crypto), seeking maximum accuracy
Advanced mode requires correct Asset Type configuration for optimal results.
Q: What's the difference between the trading style presets?
A: Each preset optimizes ALL parameters for a specific trading approach:
• Scalping: Ultra-sensitive (ATR 7, Mult 2.0), more signals, shorter holds
• Day Trading: Balanced (ATR 10, Mult 2.5), moderate signals, intraday holds
• Swing Trading: Stable (ATR 14, Mult 3.0), fewer signals, multi-day holds
• Position Trading: Very stable (ATR 21, Mult 4.0), rare signals, week/month holds
Auto mode automatically selects based on your chart timeframe.
Q: Should I use Auto mode or manually select a preset?
A: Auto mode is recommended for most traders. It automatically matches settings to your timeframe and re-optimizes if you switch charts. Only use manual preset selection if:
• You want scalping settings on a 15m chart (overriding auto-detection)
• You want swing settings on a 1h chart (more conservative than auto would give)
• You're testing different approaches on same timeframe
Q: Can I use this for scalping and day trading?
A: Absolutely! The preset system is specifically designed for all trading styles:
• Select "Scalping (1-5m)" for 1-5 minute charts
• Select "Day Trading (15m-1h)" for 15m-1h charts
• Or use "Auto" mode and it configures automatically
Volume momentum filter is auto-disabled in Scalping mode for faster signals.
Q: What is Volume Momentum and why does it matter?
A: Volume Momentum compares short-term volume (fast MA) to long-term volume (slow MA). It answers: "Is money flowing into this asset faster now than historically?"
Why it matters:
• Volume often leads price (early warning system)
• Confirms institutional participation (smart money)
• No lag like price-based indicators
• More intuitive than complex mathematical filters
When the ratio is above 1.2, you have strong evidence that institutions are accumulating (bullish) or distributing (bearish).
Q: How do I set up alerts?
A: Two options:
Option 1 - Automatic Alerts:
1. Right-click on chart → Add Alert
2. Condition: Select this indicator
3. Choose "Any alert() function call"
4. Configure notification method (app, email, webhook)
5. You'll receive detailed alerts on every BUY and SELL signal
Option 2 - Customizable Alert Conditions:
1. Right-click on chart → Add Alert
2. Condition: Select this indicator
3. You'll see three options in dropdown:
- "BUY Signal" (long signals only)
- "SELL Signal" (short signals only)
- "ANY Signal" (both BUY and SELL)
4. Choose desired option and customize message template
5. Uses TradingView placeholders: {{ticker}}, {{close}}, {{time}}, etc.
All alerts fire only on confirmed bar close (no repaint).
Q: What is Scalpel Mode and should I use it?
A: Scalpel Mode waits for healthy pullbacks within established trends before signaling entry. It reduces whipsaws and improves entry timing.
Recommended ON for:
• Swing traders (want precision entries on pullbacks)
• Day traders (willing to wait for better prices)
• Risk-averse traders (prefer fewer but higher-quality entries)
Recommended OFF for:
• Scalpers (need immediate entries, can't wait for pullbacks)
• Momentum traders (want to enter on breakout, not pullback)
• Aggressive traders (prefer more opportunities over precision)
Q: Why do some duration estimates show wider ranges than others?
A: Range width reflects historical trend variability:
• Narrow range: Similar historical trends had consistent durations (high confidence)
• Wide range: Similar historical trends had varying durations (lower confidence)
Wide ranges often occur:
• Early in analysis (fewer historical trends to learn from)
• In volatile/choppy markets (inconsistent trend behavior)
• On lower timeframes (more noise, less consistency)
The median and average still provide useful targets even when range is wide.
Q: Can I customize the dashboard position and appearance?
A: Yes! Dashboard settings include:
• Position: 9 options (Top/Middle/Bottom + Left/Center/Right)
• Text Size: Auto, Tiny, Small, Normal, Large, Huge
• Show/Hide: Toggle entire dashboard on/off
Choose position that doesn't overlap important price action on your specific chart.
Q: Which timeframe should I trade on?
A: Depends on your trading style and time availability:
• 1-5 minute: Active scalping, requires constant monitoring
• 15m-1h: Day trading, check few times per session
• 4h-Daily: Swing trading, check once or twice daily
• Daily-Weekly: Position trading, check weekly
General principle: Higher timeframes produce:
• Fewer signals (less frequent)
• Higher quality setups (stronger confirmations)
• More reliable duration estimates (better statistical data)
• Less noise (clearer trends)
Start with Daily chart if new to trading. Move to lower timeframes as you gain experience.
Q: Does this work on all markets (stocks, crypto, forex)?
A: Yes, it works on all markets with trending characteristics:
Excellent for:
• Stocks (especially growth and momentum names)
• Crypto (BTC, ETH, major altcoins)
• Futures (indices, commodities)
• Forex majors (EUR/USD, GBP/USD, etc.)
Best results on:
• Trending markets (not range-bound)
• Liquid instruments (tight spreads, good fills)
• Volatile assets (clear trend development)
Less effective on:
• Range-bound/sideways markets
• Ultra-low volatility instruments
• Illiquid small-caps (use caution)
Configure Asset Type (in Advanced analysis mode) to match your instrument for best accuracy.
Q: How many signals should I expect per day/week?
A: Highly variable based on:
By Timeframe:
• 1-5 minute: 5-15 signals per session
• 15m-1h: 2-5 signals per day
• 4h-Daily: 2-5 signals per week
• Daily-Weekly: 1-2 signals per month
By Market Volatility:
• High volatility = more SuperTrend flips = more signals
• Low volatility = fewer flips = fewer signals
By Quality Filter:
• Higher threshold (60-70) = fewer but better signals
• Lower threshold (30-40) = more signals, lower quality
By Volume Momentum Filter:
• Enabled = Fewer signals (only volume-confirmed)
• Disabled = More signals (all SuperTrend flips)
Adjust quality threshold and filters to match your desired signal frequency.
Q: What's the difference between entry labels and info labels?
A:
Entry Labels (BUY/SELL):
• Your primary trading signals
• Based on SuperTrend flip + all confirmations (quality, volume, momentum)
• Include quality score and confirmation icons
• These are actionable entry points
Info Labels (Volume Spike):
• Additional market context
• Show volume events that may support or contradict trend
• 8-bar cooldown to prevent spam
• NOT necessarily entry points - contextual information only
Control separately: Can show entry labels without info labels (recommended for clean charts).
Q: Can I combine this with other indicators?
A: Absolutely! This works well with:
• RSI: For divergences and overbought/oversold conditions
• Support/Resistance: Confluence with key levels
• Fibonacci Retracements: Pullback targets in Scalpel Mode
• Price Action Patterns: Flags, pennants, cup-and-handle
• MACD: Additional momentum confirmation
• Bollinger Bands: Volatility context
This indicator provides trend direction and duration estimates - complement with other tools for entry refinement and additional confluence.
Q: Why did I get a low-quality signal? Can I filter them out?
A: Yes! Increase the Minimum Quality Score in settings.
If you're seeing signals with quality below your preference:
• Day Trading: Set minimum to 50
• Swing Trading: Set minimum to 60
• Position Trading: Set minimum to 70
Only signals meeting the threshold will appear. This reduces frequency but improves win-rate.
Q: How do I interpret the MTF Confluence count?
A: Shows how many of 6 timeframes agree with current trend:
• 6/6 aligned: Perfect agreement (extremely rare, highest confidence)
• 5/6 aligned: Very strong alignment (high confidence)
• 4/6 aligned: Good alignment (standard quality setup)
• 3/6 aligned: Moderate alignment (acceptable)
• 2/6 aligned: Weak alignment (caution)
• 1/6 aligned: Very weak (likely counter-trend)
Higher confluence typically correlates with longer, stronger trends. However, MTF analysis is optional - you can disable it and rely solely on quality scoring.
Q: Is this suitable for beginners?
A: Yes, but requires foundational knowledge:
You should understand:
• Basic trend-following concepts (higher highs, higher lows)
• Risk management principles (position sizing, stop losses)
• How to read candlestick charts
• What volume and volatility mean
Beginner-friendly features:
• Auto preset mode (zero configuration)
• Quality scoring (tells you signal strength)
• Dashboard tooltips (hover for explanations)
• duration analysis boxes (visual profit targets)
Recommended for beginners:
1. Start with "Auto" or "Swing Trading" preset on Daily chart
2. Use Standard Analysis Mode (not Advanced)
3. Set minimum quality to 60 (fewer but better signals)
4. Paper trade first for 2-4 weeks
5. Study methodology references (Minervini, O'Neil, Zanger)
Q: What is the Asset Type setting and why does it matter?
A: Asset Type (in Advanced analysis mode) adjusts duration estimates based on volatility characteristics:
• Small Cap: Explosive moves, extended trends (+30-40%)
• Biotech / Speculative: Parabolic potential, news-driven (+40%)
• Blue Chip / Large Cap: Baseline, steady trends (0% adjustment)
• Tech Growth: Momentum-driven, longer trends (+20%)
• Dividend / Value: Slower, grinding trends (-20%)
• Cyclical: Macro-driven, variable (±10%)
• Crypto / High Volatility: Parabolic potential (+30%)
Correct configuration improves Statistical accuracy by 15-20%. Using Blue Chip settings on a biotech stock may underestimate trend length (you'll exit too early).
Q: Can I backtest this indicator?
A: Yes! TradingView's Strategy Tester works with this indicator's signals.
To backtest:
1. Note the entry conditions (SuperTrend flip + quality threshold + filters)
2. Create a strategy script using same logic
3. Run Strategy Tester on historical data
Additionally, the indicator includes BUILT-IN duration estimate validation:
• System backtests its own duration estimates
• Shows accuracy metrics in dashboard and duration analysis boxes
• Helps assess reliability on your specific symbol/timeframe
Q: Why does Volume Momentum auto-disable in Scalping mode?
A: Scalping requires ultra-fast entries to catch quick moves. Volume Momentum filter adds friction by requiring volume confirmation before signaling, which can cause missed opportunities in rapid scalping.
Scalping preset is optimized for speed and frequency - the filter is counterproductive for that style. It remains enabled for Day Trading, Swing Trading, and Position Trading presets where patience improves results.
You can manually enable it in Custom mode if desired.
Q: How much historical data do I need for accurate duration estimates?
A:
Minimum: 50-100 bars (indicator will function but duration estimates less reliable)
Recommended: 500+ bars (robust statistical database)
Optimal: 1000+ bars (maximum Statistical accuracy)
More history = more completed trends = better pattern matching = more accurate duration estimates.
New symbols or newly-switched timeframes will have lower Statistical accuracy initially. Allow 2-4 weeks for the system to build historical database.
IMPORTANT DISCLAIMERS
No Guarantee of Profit:
This indicator is an educational tool and does not guarantee any specific trading results. All trading involves substantial risk of loss. Duration estimates are statistical calculations based on historical patterns and are not guarantees of future performance.
Past Performance:
Historical backtest results and Statistical accuracy statistics do not guarantee future performance. Market conditions change constantly. What worked historically may not work in current or future markets.
Not Financial Advice:
This indicator provides technical analysis signals and statistical duration estimates only. It is not financial, investment, or trading advice. Always consult with a qualified financial advisor before making investment decisions.
Risk Warning:
Trading stocks, options, futures, forex, and cryptocurrencies involves significant risk. You can lose all of your invested capital. Never trade with money you cannot afford to lose. Only risk capital you can lose without affecting your lifestyle.
Testing Required:
Always test this indicator on a demo account or with paper trading before risking real capital. Understand how it works in different market conditions. Verify Statistical accuracy on your specific instruments and timeframes before trusting it with real money.
User Responsibility:
You are solely responsible for your trading decisions. The developer assumes no liability for trading losses, incorrect duration estimates, software errors, or any other damages incurred while using this indicator.
Statistical Estimation Limitations:
Trend Duration estimates are statistical estimates based on historical pattern matching. They are NOT guarantees. Actual trend durations may differ significantly from duration estimates due to unforeseen news events, market regime changes, or lack of historical precedent for current conditions.
CREDITS & ACKNOWLEDGMENTS
Methodology Inspiration:
• Mark Minervini - Volatility Contraction Pattern (VCP) concepts and pullback entry techniques
• William O'Neil - Volume analysis principles and CANSLIM institutional buying patterns
• Dan Zanger - Momentum breakout strategies and volatility expansion entries
Technical Components:
• SuperTrend calculation - Classic ATR-based trend indicator (public domain)
• Statistical analysis - Standard median, average, range calculations
• k-Nearest Neighbors - Classic machine learning similarity matching concept
• Multi-timeframe analysis - Standard request.security implementation in Pine Script
For questions, feedback, or support, please comment below or send a private message.
Happy Trading!

Unfilled ImbalancesUNFILLED IMBALANCES TRACKER - IDENTIFY HIGH-PROBABILITY REVERSAL ZONES
This advanced indicator automatically detects and tracks unfilled price imbalances (Fair Value Gaps/FVGs) between candle bodies, providing traders with crucial levels where price is likely to return.
METHODOLOGY
This indicator employs an approach to imbalance detection that differs from standard FVG indicators:
1. Body-to-Body Gap Detection: Unlike typical FVG indicators that use wicks, this system exclusively tracks gaps between candle bodies, filtering out noise and focusing on the most significant price inefficiencies.
2. Dynamic Partial Fill Tracking: Our unique algorithm continuously monitors and adjusts imbalance zones as they're partially filled, showing exactly how much of each gap remains unfilled in real-time. This feature helps traders identify the strongest remaining levels.
3. Dual Fill Detection Logic: Proprietary fill detection offers two distinct modes - Distal (gap filled when touched) and Through (requires complete price movement through the entire gap), allowing adaptation to different market behaviors.
KEY FEATURES
Real-Time Imbalance Detection
Identifies body-to-body gaps between consecutive candles
Tracks both bullish and bearish imbalances
Automatically removes filled imbalances from the chart
Advanced Fill Detection Modes
Distal Mode: Imbalance considered filled when price touches the near edge
Through Mode: Requires price to completely trade through the gap
Body Fill Option: Requires candle body (not just wick) to enter the gap zone
Partial Fill Visualization
Watch imbalances shrink in real-time as price partially fills them
Visual representation shows exact percentage of gap remaining
Critical for position sizing and risk management
Flexible Display Options
Full Box Mode: Shows complete imbalance zones
Line Mode: Displays only critical edge levels for cleaner charts
Customizable visual parameters (colors, transparency, line thickness)
Smart Extension Features
Auto-extends visual elements to current price bar
Optional extension into future (0-500 bars)
Statistics table showing active imbalances count and fill rates
TRADING METHODOLOGY
Unfilled imbalances represent areas where price moved too quickly, leaving behind inefficiencies that markets tend to revisit. This indicator helps identify:
High-probability entry zones for trend continuation trades
Logical take profit targets at unfilled gaps
Stop loss placement beyond strong imbalance zones
Market structure breaks when key imbalances are filled
Supply and demand zone identification
HOW TO USE
Apply the indicator to any timeframe (works best on 15m and above)
Configure fill detection mode based on your trading style
Watch for price approaching unfilled imbalance zones
Use partial fill information to gauge zone strength
Combine with your existing strategy for confirmation
TARGET AUDIENCE & BEST PRACTICES
This tool is designed for traders who understand price action and market structure. It works best on:
Liquid instruments with consistent volume
Trending markets where imbalances are more likely to be revisited
Higher timeframes for more reliable signals
LIMITATIONS & CONSIDERATIONS
Imbalances may not always be filled, especially in strong trending markets
Performance varies across different market conditions and instruments
Should be used in conjunction with other analysis methods, not as a standalone system
Gap detection is based on candle closes and may miss intrabar movements
Historical imbalances from many bars ago may lose relevance
SETTINGS EXPLANATION
The indicator includes multiple customization options:
Require Body Fill: Controls whether wicks or bodies must enter gaps
Fill Detection Mode: Choose between Distal or Through modes
Visual Display: Select between boxes or lines
Alert Configuration: Set minimum age before fill alerts trigger
Debug Mode: Learn how the algorithm works with visual feedback
This indicator represents months of research into price inefficiency patterns and provides a systematic approach to identifying and tracking these critical market levels.
Note: Works on all timeframes and markets. Best results on liquid instruments with consistent volume patterns.

PnL MonitorThe PnL Monitor is a customizable tool designed to help traders track the Profit and Loss (PnL) of up to 20 currency pairs or assets in real-time. This script provides a clear and organized table that displays the entry price, and PnL percentage for each pair, making it an essential tool for monitoring open positions or tracking potential trades.
Key Features:
Multi-Asset Tracking:
Monitor up to 20 currency pairs or assets simultaneously. Simply input the pair symbol and your entry price, and the script will calculate the PnL in real-time.
Dynamic Table Positioning:
Choose where the table appears on your chart with the Table Position input. Options include:
Top Left
Top Right
Bottom Left
Bottom Right
Real-Time PnL Calculation:
The script fetches the current price of each pair and calculates the PnL percentage based on your entry price. Positive PnL is highlighted in green, while negative PnL is highlighted in red.
Exchange and Pair Separation:
The script automatically separates the exchange name (if provided) from the pair symbol, making it easier to identify the source of the data.
Customizable Inputs:
Add or remove pairs as needed.
Leave the price field blank for pairs you don’t want to track.
How to Use:
Input Your Pairs:
In the script settings, input the symbol of the pair (e.g., NASDAQ:AAPL or BTCUSD) and your entry price. Leave the price field blank for pairs you don’t want to track.
Choose Table Position:
Select where you want the table to appear on your chart.
Monitor PnL:
The table will automatically update with the current price and PnL percentage for each pair.
Why Use This Script?
Efficiency: Track multiple pairs in one place without switching charts.
Clarity: Easily identify profitable and losing positions at a glance.
Flexibility: Customize the table to fit your trading style and preferences.
Ideal For:
Forex, crypto, and stock traders managing multiple positions.
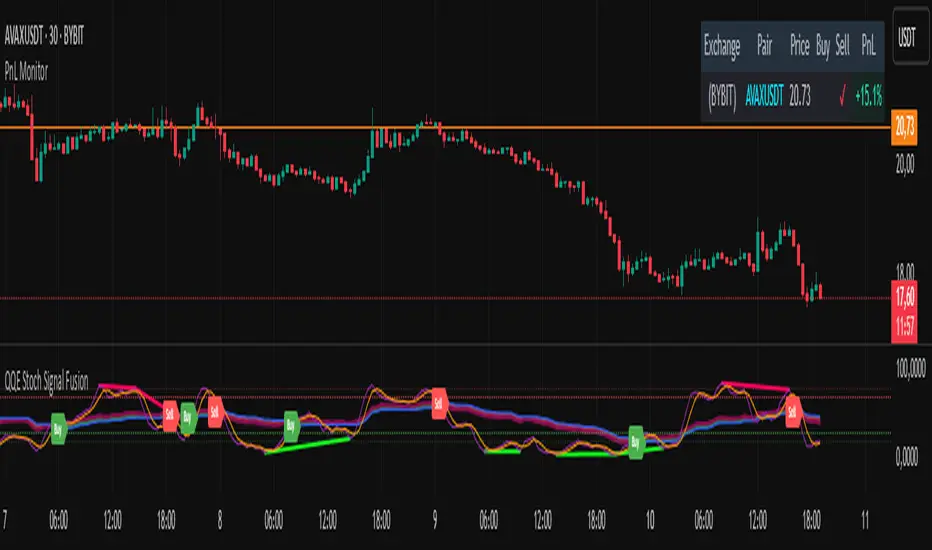
Majors Rotation [AlphaAlgos]Majors Rotation System
---
Overview
The Majors Rotation System is a trend-following strategy designed to dynamically allocate capital to the strongest-performing assets in the market. By leveraging long-term, medium-term, and equity curve trend filters, this system identifies the top assets and rotates between them based on prevailing market conditions. The system is defaulted for Bitcoin (BTC), Ethereum (ETH), and Solana (SOL) but is fully customizable and can be applied to any asset, trading pair, or asset class across various timeframes.
How It Works
At the core of this strategy are three key trend filters that help determine which assets to allocate capital to:
1. Long-Term Trend Filter:
- The long-term trend filter evaluates the broader market's direction. If the market is in a bullish phase, the system will engage with top assets, while in a bearish phase, it will exit positions to avoid unnecessary risk exposure.
2. Medium-Term Trend Filter:
- This filter assesses the market's momentum over a medium-term period. It ensures that the strategy stays aligned with short-to-medium-term market moves. When positive momentum is detected, the system adjusts its positions accordingly to capture these trends.
3. Equity Curve Trend Filter:
- The system continuously tracks the performance of its portfolio. If the equity curve (the overall portfolio value over time) is trending downward, the system will exit positions to mitigate losses. If the equity curve is trending upward, the system remains active and continues to rotate between top assets based on market strength.
These three filters work together to ensure that the system remains in assets only when market conditions are favorable, avoiding unnecessary risk during downturns while capitalizing on profitable trends.
Flexibility
While the Majors Rotation System is initially set up with BTC, ETH, and SOL, it is fully adaptable. Traders can apply the system to any assets they prefer, whether they’re trading cryptocurrencies, stocks, commodities, or forex. The system is defaulted for the one day timeframe, although, it is designed to be used on any timeframe, making it suitable for both short-term and long-term strategies. This versatility allows users to tailor the system to their specific trading style and asset preferences.
System Features
- Asset Selection and Rotation: The system ranks multiple assets based on the trend filters, allocating capital to the top performers and rotating out of weaker ones.
- Risk Management: Dynamic risk management is integrated, allowing the system to exit positions during unfavorable market conditions, ensuring that capital is only exposed to assets showing strength.
- Performance Metrics: Key metrics such as the Sharpe Ratio, Sortino Ratio, Omega Ratio, and Drawdowns are tracked to provide insight into the system’s performance and risk-adjusted returns.
- Equity Curve Tracking: The system displays the equity curve, allowing users to visualize how the strategy is performing over time and compare it to a simple buy-and-hold strategy.
- Customization: Traders can modify the system’s asset selection to match their trading preferences.
Performance Metrics and Comparison to Buy-and-Hold Bitcoin
The Majors Rotation System tracks several important performance metrics to help traders evaluate its effectiveness:
1. Sharpe Ratio:
- The Sharpe Ratio evaluates the risk-adjusted return, measuring how much excess return the system generates relative to its volatility. A higher Sharpe Ratio indicates that the system is delivering better returns for each unit of risk.
2. Sortino Ratio:
- Similar to the Sharpe Ratio, the Sortino Ratio focuses on downside risk (negative volatility), providing a more accurate measure of how the system generates returns while avoiding significant drawdowns.
3. Omega Ratio:
- The Omega Ratio evaluates both the upside and downside of the system’s performance. It measures the probability of achieving returns higher than a specified threshold, offering a clearer picture of how the strategy manages both risk and reward.
4. Equity Drawdown:
- This metric tracks the peak-to-trough decline in the portfolio’s value. It helps traders understand the worst-case scenario in terms of losses. Lower drawdowns indicate better risk management and smoother performance.
These metrics give traders a clear understanding of the risk-adjusted returns and overall stability of the system. By tracking these figures, traders can assess whether the Majors Rotation System aligns with their investment goals and risk tolerance.
Disclaimer
This script is a technical analysis tool designed to assist with asset rotation and portfolio management. While it uses real-time market data and trend-following strategies to generate asset recommendations, there are no guarantees regarding future performance. The system relies on historical and real-time data, which may not accurately predict future market behavior. Trading and investing inherently involve risk, and past performance is not indicative of future results.
Users should always conduct their own research, use proper risk management strategies, and consult with a qualified financial advisor before making investment decisions. This script is not intended as financial advice and should only be used as part of a broader investment strategy.
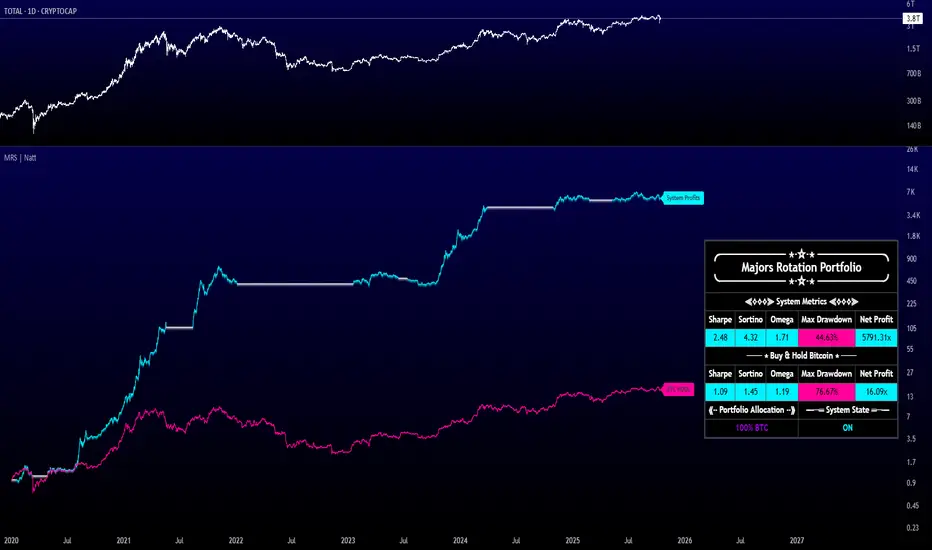
Globex Trap w/ percentage [SLICKRICK]Globex Trap w/ Percentage
Overview
The Globex Trap w/ Percentage indicator is a powerful tool designed to help traders identify high-probability trading opportunities by analyzing price action during the Globex (overnight) session and regular trading hours. By combining Globex session ranges with Supply & Demand zones, this indicator highlights potential "trap" areas where significant price reactions may occur. Additionally, it calculates the Globex session range as a percentage of the daily Average True Range (ATR), providing valuable context for assessing market volatility.
This indicator is ideal for traders in futures markets or other instruments traded during Globex sessions, offering a visual and analytical edge for spotting key price levels and potential reversals or breakouts.
Key Features
Globex Session Tracking:
Visualizes the high and low of the Globex session (default: 3:00 PM to 6:30 AM PST) with customizable time settings.
Displays a semi-transparent box to mark the Globex range, with labels for "Globex High" and "Globex Low."
Calculates the Globex range as a percentage of the daily ATR, displayed as a label for quick reference.
Supply & Demand Zones:
Identifies Supply & Demand zones during regular trading hours (default: 6:00 AM to 8:00 AM PST) with customizable time settings.
Draws semi-transparent boxes to highlight these zones, aiding in the identification of key support and resistance areas.
Trap Area Identification:
Highlights potential trap zones where Globex ranges and Supply & Demand zones overlap, indicating areas where price may reverse or consolidate due to trapped traders.
Customizable Settings:
Adjust Globex and Supply & Demand session times to suit your trading preferences.
Toggle visibility of Globex and Supply & Demand zones independently.
Customize box colors for better chart readability.
Set the lookback period (default: 10 days) to control how many historical zones are displayed.
Configure the ATR length (default: 14) for the percentage calculation.
PST Timezone Default:
All times are based on Pacific Standard Time (PST) by default, ensuring accurate session tracking for users in this timezone or those aligning with U.S. West Coast market hours.
Recommended Usage
Timeframes: Best used on 1-hour charts or lower (e.g., 15-minute, 5-minute) for precise entry and exit points.
Markets: Optimized for futures (e.g., ES, NQ, CL) and other instruments traded during Globex sessions.
Historical Data: Ensure at least 10 days of historical data for optimal visualization of zones.
Strategy Integration: Use the indicator to identify potential reversals or breakouts at Globex highs/lows or Supply & Demand zones. The ATR percentage provides context for whether the Globex range is significant relative to typical daily volatility.
How It Works
Globex Session:
Tracks the high and low prices during the user-defined Globex session (default: 3:00 PM to 6:30 AM PST).
When the session ends, a box is drawn from the start to the end of the session, capturing the high and low prices.
Labels are placed at the midpoint of the session, showing "Globex High," "Globex Low," and the range as a percentage of the daily ATR (e.g., "75.23% of Daily ATR").
Supply & Demand Zones:
Tracks the high and low prices during the user-defined regular trading hours (default: 6:00 AM to 8:00 AM PST).
Draws a box to mark these zones, which often act as key support or resistance levels.
ATR Percentage:
Calculates the Globex range (high minus low) and divides it by the daily ATR to express it as a percentage.
This metric helps traders gauge whether the overnight price movement is significant compared to the instrument’s typical volatility.
Time Handling:
Uses PST (UTC-8) for all time calculations, ensuring accurate session timing for users aligning with this timezone.
Properly handles overnight sessions that cross midnight, ensuring seamless tracking.
Input Settings
Globex Session Settings:
Show Globex Session: Enable/disable Globex session visualization (default: true).
Globex Start/End Time: Set the start and end times for the Globex session (default: 3:00 PM to 6:30 AM PST).
Globex Box Color: Customize the color of the Globex session box (default: semi-transparent gray).
Supply & Demand Zone Settings:
Show Supply & Demand Zone: Enable/disable zone visualization (default: true).
Zone Start/End Time: Set the start and end times for Supply & Demand zones (default: 6:00 AM to 8:00 AM PST).
Zone Box Color: Customize the color of the zone box (default: semi-transparent aqua).
General Settings:
Days to Look Back: Number of historical days to display zones (default: 10).
ATR Length: Period for calculating the daily ATR (default: 14).
Notes
All times are in Pacific Standard Time (PST). Adjust the start and end times if your market operates in a different timezone or if you prefer different session windows.
The indicator is optimized for instruments with active Globex sessions, such as futures. Results may vary for non-24/5 markets.
A typo in the label "Globe Low" (should be "Globex Low") will be corrected in future updates.
Ensure your TradingView chart is set to display sufficient historical data to view the full lookback period.
Why Use This Indicator?
The Globex Trap w/ Percentage indicator provides a unique combination of session-based range analysis, Supply & Demand zone identification, and volatility context via the ATR percentage. Whether you’re a day trader, swing trader, or scalper, this tool helps you:
Pinpoint key price levels where institutional traders may act.
Assess the significance of overnight price movements relative to daily volatility.
Identify potential trap zones for high-probability setups.
Customize the indicator to fit your trading style and market preferences.

SMT for Time-Based Sessions [ufo]SMT for Time-Based Sessions identifies when one asset breaks a session’s high/low while another correlated asset fails to do so. This imbalance often signals engineered liquidity grabs, reversals, or continuation setups. By focusing on divergences within specific trading sessions (London, New York AM, Lunch, New York PM, Asia, Daily or your own custom windows), the tool filters out noise and pinpoints only the most meaningful SMT divergences across multiple symbols in real-time.
Core Concept:
SMT (Smart Money Technique/Tool/Time) is a concept popularized by Inner Circle Trader (ICT) that suggests that when correlated or inversely correlated instruments fail to confirm each other's price movements (e.g., one breaks a high/low while the other doesn’t), it often indicates:
Liquidity manipulation by institutional players
Potential reversal points in the market
Weakness or strength in the current trend
Stop hunt operations before significant moves
This indicator identifies these divergences by comparing your chart symbol against up to two comparison symbols across different sessions and timeframes.
How Time-Based SMT Works:
Unlike basic divergence tools, this indicator is built specifically for Session-Based and Timeframe-Based SMT tracking. It continuously monitors intraday sessions and higher timeframes, then plots divergences the moment they occur.
Time-Based Session SMT
Session Tracking: Monitors highs and lows during each session
Post-Session Analysis: After a session ends, tracks whether price breaks session levels
Divergence Detection: When the main symbol breaks a high/low but comparison symbols don’t (or vice versa), an SMT signal is triggered
(e.g. Nasdaq traded above London high while S&P500 does not)
Visual Confirmation: Lines connect the session reference to the current extreme, with labels showing the diverging session, high/low, and symbol, this information is also displayed in the Info Panel
This will update if a new high/low extreme is made while the SMT is still valid, if invalidated these will be removed from the chart
Example:
This NQ chart includes ES and YM as comparison symbols. At 03:20 AM New York time, both ES and YM broke the Asia session low (20:00 – 00:00), while NQ did not. This creates a bullish session divergence , which the indicator immediately detects and plots.
Although the chart shows three symbols for illustration, you don’t need to manually monitor comparison charts when using this indicator, the SMT divergence will be plotted automatically as soon as it occurs
Consecutive Candle SMT (CC SMT)
Previous Candle Reference: Uses the previous candle's high/low from the selected timeframe
Real-Time Comparison: Monitors if current price breaks these levels across all symbols
Instant Detection: Triggers SMT immediately when divergence occurs
Dynamic Updates: Lines and labels update in real-time as new extremes form and are automatically removed if invalidated
Example:
Here I configured CC SMT Timeframe 1 to monitor the previous 4-hour candle’s high/low. On this NQ chart with ES as a comparison symbol, ES broke above the prior 4-hour high at 14:00 New York time, while NQ did not, showing relative weakness creating a bearish CC SMT divergence
This chart is just an illustration. The indicator will automatically plot SMT divergences on your main chart, regardless of the timeframe you’re viewing
How To Use:
This indicator is not a buy/sell signal on its own. Instead, it is designed to highlight Time-Based SMT divergences so you can combine them with your existing trading strategy or model. It should be used as an extra layer of confluence, helping you confirm trade ideas.
Select your comparison symbols
For example:
Futures: NQ vs ES/YM
Forex: EURUSD vs GBPUSD/DXY(inversely)
Crypto: BTC vs ETH
Commodities: Gold vs Silver
Choose which sessions or candle timeframes you want the indicator to monitor
Watch for divergences the indicator plots when one symbol breaks a high/low while the other does not
Use these divergences as confluence, alongside your own strategy and risk management rules
Key Features:
Multiple Comparison Symbols
Symbol 1 & Symbol 2: Compare your main chart against up to 2 correlated instruments
Symbol Inversion: Perfect for inversely correlated pairs (e.g., EURUSD vs DXY)
Session-Based SMT Tracking
Monitors 7 fully customizable trading sessions with the default being:
London Session (2:00-5:00 NY time)
NY AM Session (9:30-12:00 NY time)
Lunch Session (12:00-13:00 NY time)
NY PM Session (13:00-16:00 NY time)
Asia Session (20:00-00:00 NY time)
Custom Session 6 (if you want to add an extra session)
Daily Session (18:00-18:00 NY time)
Fully customizable session times and names
Automatically detects when the main symbol breaks a session high/low while comparison symbols don't (and vice versa)
Consecutive Candle SMT (CC SMT)
Monitors 3 customizable timeframes
Tracking of divergences based on specific timeframe candles (15min, 60min, 4 hour, weekly, etc.)
Identifies when the current price breaks the previous candle's high/low differently than comparison symbols
Maintains history of past SMTs (configurable)
Timeframe 3 supports custom time shifts for non-standard candle boundaries
Example: 90min timeframe with a +60 shift changes the candle range from:
00:00-01:30, 01:30-03:00 etc
to:
01:00-02:30, 02:30-04:00 etc
Visual Customization
Line Styles: Customize the line styles for different symbols
Colors: Unique color schemes for instant session identification
Adjustable Offsets: Fine-tune label positions with multiplier settings
Show/Hide Controls: Complete control over visual elements
Custom Labels: Customize the SMT labels for highs and lows
Information Panel
Active SMT Conditions: Live tracking of all current divergences
Session Names: Clear identification of which session created the SMT
Symbol Information: Shows which comparison symbol is diverging
Timestamps: Optional time display showing when SMT was first detected
Flexible Positioning: 8 different panel positions
Smart Display Modes: Options to hide inactive sessions/timeframes
Alert System
Configurable alerts for specific sessions or timeframes
Get notified when new divergences appear instantly
Clear, informative alert descriptions
How To Setup Alerts:
Enable the "Enable Alerts" in the settings
Choose which sessions/timeframes to receive alerts for by choosing it in the setting below
(If you select "All Sessions" you will only be alerted for all the sessions you have enabled in the indicator settings)
Create an alert (ALT+A shortcut) or click the the 3 dots on the indicator "Add alert on Session SMT "
- Condition = Session SMT
- Function = Any alert() function call
- Alert name (Message) = Anything you prefer (e.g. SMT Alert)
If you want to create another alert for different settings, first input the new settings in the indicator, then create a new alert.
Note: Previous alerts will continue to notify you based on the settings they were originally set for, even if you change the indicator setting.
How This Helps Your Trading:
This tool automates the heavy lifting of tracking divergences across multiple markets and sessions, continuously monitoring highs and lows in real time and plotting only the most meaningful SMT signals so you can focus on execution, not chart-watching.
ML Compressor Enhanced Trading Indicator# 🤖 ML Enhanced Trading Indicator - Advanced Market Analysis
## 📊 Overview
This is a comprehensive Machine Learning Enhanced Trading Indicator that combines multiple advanced analytical techniques to provide high-probability trading signals. The indicator uses artificial intelligence, pattern recognition, anomaly detection, and traditional technical analysis to identify optimal entry and exit points in the market.
## 🚀 Key Features
### 🧠 **Machine Learning Core**
- **Advanced Pattern Recognition**: Uses cosine similarity, Pearson correlation, and Spearman rank correlation to identify historical patterns
- **AI-Powered Predictions**: Implements multiple correlation methods to forecast price movements
- **Anomaly Detection**: Z-score based detection system for unusual market activities
- **Signal Confidence Scoring**: Reliability assessment for each trading signal
### 📈 **Technical Analysis Integration**
- **Multi-Timeframe RSI Analysis**: 14 and 21-period RSI with oversold/overbought detection
- **MACD Momentum**: Enhanced MACD histogram analysis for trend confirmation
- **Bollinger Bands Position**: Dynamic position tracking within BB channels
- **Volume Analysis**: Spike and dry volume detection with ratio calculations
- **Trend Strength Measurement**: EMA-based trend power analysis
### 🎯 **Perfect Zone Detection**
- **Ideal Buy Zone**: Identifies perfect buying opportunities when 7 conditions align:
- ML Score ≥ 0.60
- Bottom proximity detection
- RSI in 20-35 range
- Volume spike confirmation
- Positive price anomaly
- Bullish pattern match
- Positive MACD momentum
### 📊 **Comprehensive Display Table**
- **Real-time ML Analysis**: Complete breakdown of all indicators
- **Perfect Buy Conditions Tracker**: Visual checklist with completion percentage
- **Performance Metrics**: Win rate tracking and P&L analysis
- **Signal Strength Indicators**: Confidence levels for each signal
## 🔧 **Customizable Parameters**
### **ML Settings**
- **ML Lookback Period**: 20-500 bars (default: 100)
- **Anomaly Threshold**: 1.0-5.0 sensitivity (default: 2.0)
- **Pattern Similarity**: 0.5-0.99 matching threshold (default: 0.80)
- **AI Lookback Period**: 20-200 bars (default: 50)
### **AI Prediction Models**
- **Correlation Methods**: Spearman, Pearson, Cosine Similarity
- **Forecast Length**: 15-250 bars (default: 50)
- **Similarity Type**: Price or %Change analysis
### **Visual Options**
- **Table Position**: Top/Bottom Left/Right positioning
- **Table Size**: Small, Normal, Large options
- **Signal Display**: Toggle buy/sell signals on/off
- **AI Visualization**: Optional prediction paths and ZigZag
## 📋 **How to Use**
### **For Beginners**
1. Add the indicator to your chart
2. Look for "PERFECT BUY" signals in the table
3. Wait for completion percentage ≥ 85% for highest probability trades
4. Use the background color changes as visual confirmation
### **For Advanced Traders**
1. Analyze individual ML components in the detailed table
2. Monitor anomaly detection for unusual market conditions
3. Use pattern confidence levels for trade timing
4. Combine with your existing strategy for confirmation
### **Signal Interpretation**
- **🟢 PERFECT BUY**: All 7 conditions met - highest probability reversal
- **🟡 NEAR BOTTOM**: Close to ideal conditions - monitor closely
- **🔴 NOT READY**: Wait for better setup
- **Strong Buy/Sell Signals**: ML score-based entries with high confidence
## ⚠️ **Important Notes**
### **Risk Management**
- This indicator provides analysis and signals, not guaranteed outcomes
- Always use proper risk management and position sizing
- Consider market conditions and fundamental factors
- Backtest the strategy on your preferred timeframes and assets
### **Best Practices**
- Use multiple timeframe analysis for confirmation
- Combine with support/resistance levels
- Monitor volume confirmation for all signals
- Set appropriate stop-losses and profit targets
### **Performance Tracking**
- The indicator tracks its own performance with win rate calculations
- Monitor the "AI Prediction" accuracy percentage
- Use the P&L tracking to assess signal quality over time
## 🔄 **Updates and Improvements**
This indicator is continuously evolving with:
- Enhanced machine learning algorithms
- Improved pattern recognition capabilities
- Additional correlation methods for better accuracy
- Performance optimization for faster calculations
- New visualization features based on user feedback
## 📚 **Technical Details**
### **Machine Learning Implementation**
- **Pattern Matching**: 20-bar normalized price patterns with historical comparison
- **Correlation Analysis**: Mathematical similarity scoring between current and historical patterns
- **Anomaly Detection**: Statistical Z-score analysis across price, volume, and RSI
- **Signal Weighting**: Multi-factor scoring system with optimized weights
### **Algorithm Components**
1. **Feature Extraction**: Price, volume, momentum, volatility, and trend features
2. **Pattern Recognition**: Historical pattern database with similarity matching
3. **Anomaly Detection**: Multi-dimensional Z-score threshold analysis
4. **Signal Generation**: Weighted scoring system with confidence intervals
5. **Performance Tracking**: Real-time win rate and accuracy monitoring
### **Calculation Methods**
- **Trend Strength**: (EMA8 - EMA21) / EMA21 * 100
- **Volume Ratio**: Current Volume / 20-period SMA Volume
- **BB Position**: (Close - BB_Lower) / (BB_Upper - BB_Lower)
- **Anomaly Score**: Average of normalized Z-scores for price, volume, and RSI
## 🎨 **Visual Elements**
### **Background Colors**
- **Light Green**: Perfect buy zone detected
- **Light Red**: Perfect sell zone detected
- **Light Blue**: Near bottom proximity
- **Green/Red Transparency**: Price anomaly detection
### **Signal Shapes**
- **Green Triangle Up**: Strong buy signal
- **Red Triangle Down**: Strong sell signal
- **Aqua Diamond**: Perfect buy zone entry
- **Purple Diamond**: Perfect sell zone entry
### **Table Information**
- **ML Complete Analysis**: 16 comprehensive metrics
- **Perfect Buy Conditions**: 7-point checklist with status indicators
- **Real-time Values**: Live updating of all calculations
- **Color-coded Status**: Green (good), Yellow (moderate), Red (caution)
## 🔍 **Troubleshooting**
### **Common Issues**
- **Table Not Showing**: Enable "Show ML Table" in settings
- **No Signals Appearing**: Check "Show Buy/Sell Signals" option
- **Performance Issues**: Reduce ML Lookback Period for faster calculation
- **Too Many/Few Signals**: Adjust Anomaly Threshold sensitivity
### **Optimization Tips**
- **For Day Trading**: Use lower timeframes (1m, 5m, 15m) with reduced lookback periods
- **For Swing Trading**: Use higher timeframes (1h, 4h, 1D) with standard settings
- **For Scalping**: Enable only strong signals and reduce pattern similarity threshold
- **For Long-term**: Increase all lookback periods and use daily/weekly timeframes
## 📖 **Disclaimer**
This indicator is for educational and informational purposes only. It should not be considered as financial advice. Trading involves substantial risk of loss and is not suitable for all investors. Past performance does not guarantee future results.
### **Risk Warning**
- All trading involves risk of substantial losses
- Never risk more than you can afford to lose
- This indicator does not guarantee profitable trades
- Always use proper risk management techniques
- Consider consulting with a financial advisor
### **Liability**
The creator of this indicator is not responsible for any losses incurred from its use. Users should thoroughly test and understand the indicator before using it with real money.
### **Feature Requests**
- Suggest improvements through TradingView comments
- Report bugs with detailed descriptions
- Share successful strategies using the indicator
- Contribute to community discussions
## 🏆 **Credits and Acknowledgments**
This indicator builds upon various open-source libraries and mathematical concepts:
- TradingView ZigZag library for visualization
- Statistical correlation methods from academic research
- Machine learning concepts adapted for financial markets
- Community feedback and testing contributions
## 📈 **Performance Metrics**
The indicator includes built-in performance tracking:
- **Win Rate Calculation**: Percentage of profitable signals
- **Signal Accuracy**: ML prediction vs actual price movement
- **Drawdown Tracking**: Current unrealized P&L from last signal
- **Completion Percentage**: How many perfect conditions are met
## 🔬 **Mathematical Foundation**
### **Correlation Calculations**
- **Pearson**: Measures linear correlation between patterns
- **Spearman**: Rank-based correlation for non-linear relationships
- **Cosine Similarity**: Vector-based similarity for pattern matching
### **Statistical Methods**
- **Z-Score**: (Value - Mean) / Standard Deviation
- **Pattern Normalization**: Price / Price
- **Volatility Percentile**: Historical ranking of current volatility
- **Momentum Calculation**: Price change over multiple periods
## 🎯 **Trading Strategies**
### **Conservative Approach**
- Wait for Perfect Buy Zone (85%+ completion)
- Use higher timeframes for confirmation
- Set stop-loss at recent swing low
- Take profits at resistance levels
### **Aggressive Approach**
- Trade on Strong Buy/Sell signals
- Use lower completion thresholds (70%+)
- Tighter stop-losses with faster exits
- Higher position sizes with confirmed trends
### **Hybrid Strategy**
- Combine with other indicators for confirmation
- Use different settings for different market conditions
- Scale in/out based on signal strength
- Adjust parameters based on market volatility

0830-0845 High/Low Marker (Accurate Start + History)This indicator marks the high and low of the 15-minute candle between 08:30 and 08:45 (local time) of the trading session. The high and low are tracked dynamically, with the lines drawn once the 08:45 candle closes.
Key Features:
Session-based Tracking: Automatically tracks and records the high and low of the 15-minute period starting at 08:30 and ending at 08:45.
Excludes 08:45 High : If a high is created exactly at 08:45, the indicator will ignore it and use the highest value before 08:45, ensuring it only references the price action during the specified window.
Line Extension : The high and low lines are drawn and extended to the right for a user-defined number of bars, making them visible beyond the session's close.
Customizable Parameters : Adjust the start and end times of the session, line colors, and line width to fit your preferences.
Use Case :
Ideal for traders who focus on the price action during the early part of the trading session (08:30 to 08:45) and want to track significant levels of support and resistance from that period.
The extended lines help identify potential price zones for the rest of the session or the trading day.
Smarter Money Concepts - MTF IFVGs [PhenLabs]📊 Smarter Money Concepts - MTF IFVG
Version: PineScript™ v6
📌 Description
This multi-timeframe indicator identifies Inverse Fair Value Gaps (IFVGs) and their inversions across simultaneous chart intervals, helping traders spot liquidity voids and potential reversal zones. By analyzing price action through the lens of institutional order flow patterns, it solves the problem of manual gap tracking across timeframes while incorporating volatility-adjusted parameters and psychological level analysis for higher-probability setups.
🚀 Points of Innovation
• Multi-Timeframe Engine - Simultaneous analysis of 3 higher timeframes
• Adaptive Parameters - Auto-adjusts to market volatility conditions
• Quality Scoring System - Ranks gaps using RVI strength and size metrics
• Inversion Tracking - Monitors failed gaps for counter-trend signals
• Render Optimization - Prevents chart clutter with smart gap management
🔧 Core Components
FVG Detection Logic: Identifies gaps using customizable price source (Close/Wick)
Inversion Tracker: Manages failed gaps and generates counter signals
Multi-Timeframe Engine: Processes 3 independent higher timeframe analyses
Dashboard System: Real-time display of active gaps across all timeframes
🔥 Key Features
• Volatility-adjusted gap size filters (ATR-based)
• Customizable timeframe confluence analysis
• Color-coded quality scoring
• Non-repainting inversion signals
• Mobile-optimized visual rendering
🎨 Visualization
• Colored Boxes: Translucent zones show active gaps (green/bullish, red/bearish)
• Midline Plot: Dashed gray line marks gap midpoint for price targets
• Inversion Markers: Intense colors show failed gaps (dark red/bullish failure, bright green/bearish failure)
• HTF Differentiation: Higher timeframe gaps shown in blue/teal hues
📖 Usage Guidelines
Multi-Timeframe Settings
• Higher Timeframe 1
Default: 30 | Range: Any > Chart TF | Controls primary confluence timeframe
• Show All Timeframes
Default: True | Toggles multi-TF gap displays
Gap Settings
• Source
Default: Close | Options: | Determines gap measurement method
• RVI Period
Default: 14 | Range: 1-50 | Sets momentum confirmation sensitivity
• RVI Value
Default 0.1 | 0 to see all IFVGs | Increase min RVI to see the most powerful IFVGs
✅ Best Use Cases
• Identifying confluence across timeframes
• Spotting institutional order blocks
• High-probability reversal trading
• Trend continuation confirmation
• Volatility breakout setups
⚠️ Limitations
• Repaints historical gap zones
• Requires understanding of FVG concepts
• Higher timeframe data latency
• Quality scores rely on RVI/ATR settings
💡 What Makes This Unique
First FVG indicator with true multi-timeframe processing
Adaptive parameters that auto-adjust to volatility
Quantifiable quality scoring system
Professional-grade dashboard with HTF tracking
🔬 How It Works
Gap Detection: Identifies FVGs using price relationships and RVI confirmation
Inversion Tracking: Monitors price breaches to flag failed gaps
Quality Assessment: Scores gaps based on size, momentum, and location
Adaptive Filtering: Adjusts parameters using ATR-based volatility analysis
Multi-TF Synthesis: Correlates gaps across user-selected timeframes
Visual Rendering: Displays only relevant, active gaps to prevent clutter
💡 Note:
Start with default settings and gradually adjust parameters after observing market interactions. Focus on gaps with quality scores above 7 that align with higher timeframe trends. Combine with price action at psychological levels for highest-probability setups. Remember that higher timeframe gaps generally carry more significance than current chart gaps.

Multi-Sector Trend AnalysisThis script, titled "Multi-Sector Trend Analysis: Track Sector Momentum and Trends," is designed to assist traders and investors in monitoring multiple sectors of the stock market simultaneously. It leverages technical analysis by incorporating trend detection and momentum indicators like moving averages and the Relative Strength Index (RSI) to offer insights into the price action of various market sectors.
Core Features:
1. Sector-Based Analysis: The script covers 20 major sectors from the NSE (National Stock Exchange) such as Auto, Banking, Energy, FMCG, IT, Pharma, and others. Users can customize which sectors they wish to analyze using the available input fields.
Technical Indicators: The script uses two core technical indicators to detect trends and momentum:
2. Moving Averages: The script calculates both fast and slow exponential moving averages (EMAs). These are critical for identifying short- and long-term price trends and crossovers, helping detect shifts in momentum.
3. Relative Strength Index (RSI): A well-known momentum indicator that shows whether a stock is overbought or oversold. This script uses a 14-period RSI to gauge the strength of each sector.
4. Trend Detection: The script identifies whether the current market trend is "Up" or "Down" based on the relationship between the fast and slow EMAs (i.e., whether the fast EMA is above or below the slow EMA). It highlights this trend visually in a table format, allowing quick and easy trend recognition.
5. Gain/Loss Tracking: This feature calculates the percentage gain or loss since the last EMA crossover (a key point in trend change), giving users a sense of how much the price has moved since the trend shifted.
6. Customizable Table for Display: The script displays the analyzed data in a table format, where users can view each sector's:
Symbol
Trend (Up or Down)
RSI Value
Gain/Loss Since the Last EMA Crossover
This table is customizable in terms of size and color theme (dark or light), providing flexibility in presentation for different charting styles.
How It Works:
Sector Selection: Users can input up to 20 different sector symbols for analysis.
Moving Averages: Users can define the period lengths for both the fast and slow EMAs to suit their trading strategies.
Table Options: Choose between different table sizes and opt for a dark theme to enhance the visual appearance on charts.
How to Use:
Select the symbols (sectors) that you want to track. The script includes pre-configured symbols for major sectors on the NSE, but you can modify these to suit your needs.
Adjust the fast and slow EMA lengths to your preference. A common setting would be 3 for the fast EMA and 4 for the slow EMA, but more conservative traders might opt for higher values.
Customize the table size and theme based on your preference, whether you want a compact table or a larger one for easier readability.
Why Use This Script:
This script is ideal for traders looking to:
Monitor multiple market sectors simultaneously.
Identify key trends across sectors quickly.
Understand momentum and detect potential reversals through RSI and EMA crossovers.
Stay informed on sector performance using a clear visual table that tracks gains or losses.
By using this script, traders can gain better insights into sector-based trading strategies, improve their sector rotation tactics, and stay informed about the broader market environment. It provides a powerful yet easy-to-use tool for both beginner and advanced traders.

Aggressive VS Passive Orders Depletion @MaxMaserati 3.0Aggressive VS Passive Orders Depletion Indicator
Overview
This institutional-grade order flow analysis tool identifies and tracks limit order accumulation zones where significant buy and sell orders are placed in the market. It combines Highest Volume Candle Profile analysis with Market Structure detection to reveal where institutional traders have positioned their orders, and monitors in real-time whether these orders are being absorbed (depleted) or defended.
Core Concept: Order Block Detection & Depletion
This tool tracks the actual limit orders at key price levels and shows you:
Where institutional orders are placed (Buy Order Blocks vs Sell Order Blocks)
How strong these order zones are (original volume strength as %)
Real-time order flow activity (aggressive buyers vs aggressive sellers)
Depletion status (are the orders being consumed or defended?)
How It Works: Dual-Engine System
Engine 1: Volume Profile Analysis - Point of Control (POC) Detection
Divides price range into 25 horizontal levels (configurable)
Analyzes the last 120 bars (configurable lookback)
Distributes volume across price levels based on where each bar traded
Identifies the Point of Control (POC) - the price level with highest traded volume
Determines market bias: Bullish if price above POC, Bearish if below
Purpose: Shows where the majority of volume has been traded, indicating institutional accumulation zones and fair value areas.
Engine 2: Market Structure Analysis (PHL - Pivot High/Low)
Uses fractal pivot detection (configurable strength)
Identifies swing highs and lows that create market structure
Tracks Break of Structure (BOS) - price breaks recent swing in trend direction
Tracks Market Structure Shift (MSS) - price breaks swing points against trend
Maintains a trailing price at the most recent significant swing point
Purpose: Identifies where smart money is likely defending key structural levels with limit orders.
Key Innovation #1: Dynamic Confluence Zone Detection
When the Volume Profile POC and Market Structure trail price align within a configurable sensitivity threshold (default 1.0%), the indicator creates an Order Block Zone.
The Algorithm:
Monitors both engines continuously
Creates zones ONLY when POC is within X% of the structural swing point
Both engines must agree on the significance of the price level
Optional volume confirmation filter
This dual-confirmation approach filters out weak levels and highlights only the highest-probability zones where institutional orders are likely clustered.
Zone Types:
🟢 Buy Order Blocks (Support) - Created when confluence occurs with price above the zone. Represents accumulated buy limit orders waiting to support price.
🔴 Sell Order Blocks (Resistance) - Created when confluence occurs with price below the zone. Represents accumulated sell limit orders waiting to resist price.
Key Innovation #2: Real-Time Aggressive VS Passive Order Flow Analysis
The indicator performs sophisticated order flow decomposition on each candle that interacts with a zone, separating market activity into distinct categories:
Order Flow Categories:
1. Aggressive Orders - Market orders that consume liquidity
Aggressive Buy Volume: Market buys hitting sell limits (taking offers)
Aggressive Sell Volume: Market sells hitting buy limits (hitting bids)
Marked with (AGG) label when detected
Indicates urgent traders willing to pay the spread
2. Passive Orders - Limit orders adding liquidity
Passive Buy Volume: New buy limits being placed (making bids)
Passive Sell Volume: New sell limits being placed (making offers)
Shows patient traders providing liquidity
3. New Order Flow - Fresh buying/selling pressure
New Buyers: Total new buying activity (aggressive + passive)
New Sellers: Total new selling activity (aggressive + passive)
Net pressure indicator for zone health
Key Innovation #3: Advanced Order Flow Decomposition Algorithm
The indicator uses a proprietary candle analysis formula to separate aggressive from passive orders based on two key metrics:
Key Metrics:
Body Strength = |Close - Open| / (High - Low)
Close Position = (Close - Low) / (High - Low)
Bullish Candle Analysis:
Strong Aggressive Buying (Close Position ≥ 0.8 AND Body Strength ≥ 0.7):
90% aggressive buying, 10% passive selling, 90% new buyers
Moderate Aggressive Buying (Close Position ≥ 0.6 AND Body Strength ≥ 0.5):
70% aggressive buying, 20% passive selling, 80% new buyers, 20% new sellers
Weak Bullish (Close Position ≥ 0.5):
0-30% aggressive buying, 20-30% passive selling, 60% new buyers, 40% new sellers
Very Weak Bullish (Close Position < 0.5):
0% aggressive buying, 40% passive selling, 40% new buyers, 60% new sellers
Bearish Candle Analysis:
Strong Aggressive Selling (Close Position ≤ 0.2 AND Body Strength ≥ 0.7):
90% aggressive selling, 10% passive buying, 90% new sellers
Moderate Aggressive Selling (Close Position ≤ 0.4 AND Body Strength ≥ 0.5):
70% aggressive selling, 20% passive buying, 80% new sellers, 20% new buyers
Weak Bearish (Close Position ≤ 0.5):
0-30% aggressive selling, 20-30% passive buying, 60% new sellers, 40% new buyers
Very Weak Bearish (Close Position > 0.5):
0% aggressive selling, 40% passive buying, 40% new sellers, 60% new buyers
What This Reveals:
High close position + strong body = Aggressive buying overwhelming sellers
Low close position + strong body = Aggressive selling overwhelming buyers
Mid-range close = Battle between buyers and sellers
Small body = Passive orders dominating (limit orders being placed, not filled)
Key Innovation #4: Dynamic Depletion System with Intelligent Thresholds
The indicator adapts depletion thresholds based on zone strength:
High Liquidity Zones (>300% volume strength):
Depletion at 40% consumption - Massive clusters considered broken early because partial depletion indicates institutional withdrawal
Medium Liquidity Zones (150-300% volume strength):
Depletion at 60% consumption - Standard institutional behavior, majority must be consumed
Normal Liquidity Zones (75-150% volume strength):
Depletion at 80% consumption - Retail and smaller institutional zones need near-complete absorption
Low Liquidity Zones (<75% volume strength):
Depletion at 100% consumption - Weak zones must be fully absorbed before marked depleted
Why This Matters:
Strong zones failing early = powerful reversal signal (institutions gave up)
Weak zones holding = hidden strength (more orders being added)
Adaptive logic prevents false signals from fixed thresholds
Depletion Formula:
For Buy Order Zones:
Zone Liquidity % = (Original Buy Volume / Average Volume) × 100
Consumed % = (Sell Volume Absorbed / Average Volume) × 100
If Consumed Volume > Dynamic Threshold → Zone DEPLETED
For Sell Order Zones:
Zone Liquidity % = (Original Sell Volume / Average Volume) × 100
Consumed % = (Buy Volume Absorbed / Average Volume) × 100
If Consumed Volume > Dynamic Threshold → Zone DEPLETED
Key Innovation #5: Absorption Detection & Battle Analysis
The indicator identifies when one side is overwhelming the other using a configurable Absorption Threshold (default 1.5x = 50% more volume).
Battle States for Buy Order Blocks:
New Buyers Dominating (New Buyers > New Sellers × 1.5):
Label: ↑ New Buyers: +X% - Buy orders successfully defended
Sellers Attacking (New Sellers > New Buyers × 1.5):
Label: ↓ Sellers Attack: +X% (AGG) - Sell orders overwhelming the zone
Active Battle (Both active, <1.5x ratio):
Label: Battle: B+X% vs S+Y% - Active two-way order flow
Quiet Zone (Minimal activity):
Label: ↔ Quiet: X% - Zone untested or ignored
Battle States for Sell Order Blocks:
New Sellers Dominating (New Sellers > New Buyers × 1.5):
Label: ↓ New Sellers: +X% - Sell orders successfully defended
Buyers Absorbing (New Buyers > New Sellers × 1.5):
Label: ↑ Buyers Absorb: +X% (AGG) - Buy orders overwhelming the zone
Active Battle (Both active, <1.5x ratio):
Label: Battle: S+X% vs B+Y% - Active two-way order flow
Quiet Zone (Minimal activity):
Label: ↔ Quiet: X% - Zone untested or ignored
The (AGG) Marker:
Appears when aggressive market orders are detected (high body strength + extreme close position). Indicates institutional-sized urgency—someone is willing to pay market price NOW. Often precedes breakouts or strong continuations.
Label System Explained
No Label = Untested Zone
When a zone is first created, you see ONLY the colored box with NO label. This means:
Price has NOT yet reached this order block
The limit orders are still pending/resting
The zone is a future area of interest
Labels only appear after first price contact
Label Format (After First Touch):
Line 1: ● XX% Order Type
Line 2: Flow Analysis
Example Labels:
Buy Order Blocks:
● 150% Buy Orders + ↑ New Buyers: +85%
● 150% Buy Orders + ↑ New Buyers: +120% (AGG)
● 150% Buy Orders + Battle: B+45% vs S+38%
● 150% Buy Orders + ↓ Sellers Attack: +95% (AGG)
● 150% Buy Orders + ↓ Sellers Attack: +95% (AGG)
● 150% Buy Orders
Sell Order Blocks:
● 200% Sell Orders + ↓ New Sellers: +110%
● 200% Sell Orders + ↓ New Sellers: +140% (AGG)
● 200% Sell Orders + Battle: S+62% vs B+41%
● 200% Sell Orders + ↑ Buyers Absorb: +88% (AGG)
● 200% Sell Orders + ↑ Buyers Absorb: +88% (AGG)
● 200% Sell Orders
Status Indicators:
- Price penetrated through the zone
- Orders fully consumed, zone exhausted
Gray color - Zone no longer active
Directional Arrows:
↑ - Upward pressure (buyers stronger)
↓ - Downward pressure (sellers stronger)
↔ - Balanced/quiet (low activity)
↗ / ↘ - Mixed battle with bias
Point of Control (POC) Sub-Level Analysis
Each order block contains advanced volume distribution tracking:
Multi-Level Analysis (default 5 levels): Zones subdivided into horizontal price levels
Volume Distribution: Every candle's volume distributed across sub-levels based on price overlap
Buy/Sell Separation: Each level tracks buy vs sell volume independently
Dynamic POC Line: Marks the price level with highest traded volume within the zone
Real-Time Updates: POC adjusts as new volume enters, showing where "fairest price" is migrating
Style Options: Solid, Dashed, or Dotted lines (configurable width 1-5)
POC Trading Significance:
Represents the most accepted price within the order block
Often the best entry price for limit orders (highest liquidity)
POC migration shows whether zone is being "worked higher" or "worked lower"
Breaking through POC often signals zone failure
Key Settings
Volume Profile:
Lookback Period: 120 bars (historical period for POC)
Price Rows: 25 levels (granularity of volume distribution)
Volume Confirmation: Require structure breaks to align with volume bias
Market Structure:
Pivot Strength: 1 (swing detection sensitivity)
Show Trail: Optional trailing price visualization
Confluence Detection:
Sensitivity: 1.0% (distance threshold for POC/Structure alignment)
Lower = Stricter confluence, fewer zones
Higher = More zones detected
Order Flow Analysis:
Show Real-Time Order Flow: Live buyer/seller activity
Show Aggressive Markers: (AGG) labels for market orders
Show Directional Arrows: Price direction indicators (↑↓↔↗↘)
Absorption Threshold: 1.5x (when one side overwhelms the other)
1.5 = 50% more volume needed
2.0 = 100% more (stricter)
1.2 = 20% more (more sensitive)
Visual Options:
Hide Depleted Zones: Auto-remove exhausted blocks
Smart Bar Coloring: Color candles based on signal alignment
Zone Colors: Customize buy/sell colors
Label Text Size: Tiny, Small, Normal, Large
POC Settings:
Show POC Lines: Toggle Point of Control display
POC Analysis Levels: 3-10 levels
Line Width: 1-5 pixels
Line Style: Solid, Dashed, or Dotted
Trading Applications
1. Institutional Order Detection - Identify where large players positioned limit orders using Volume Profile POC + Market Structure confluence
2. Support/Resistance Validation - Dual confirmation filters weak levels, highlights high-probability reversal areas
3. Order Flow Imbalance Trading - Trade in direction of aggressive flow using (AGG) markers, fade zones showing absorption
4. Breakout/Breakdown Confirmation - and statuses validate moves through key levels
5. Liquidity Hunting - Track stop-loss clusters, anticipate stop runs based on depletion patterns
6. Entry Refinement - Use POC lines for precise limit placement at "fairest price" within zones
Combined Signal System
HVN Volume Profile × Market Structure Signals:
STRONG BUY: Both engines bullish + structure break up + volume confirmation
BUY: Bullish bias with partial confirmation
WEAK BUY: Early bullish signals
STRONG SELL: Both engines bearish + structure break down + volume confirmation
SELL: Bearish bias with partial confirmation
WEAK SELL: Early bearish signals
Alert Conditions:
Strong Buy/Sell signals (with volume confirmation)
Confluence zone activation (new order block created)
Order block depletion (zone exhausted)
What Makes This Indicator Unique
Industry-Standard Foundation:
Volume Profile POC detection + Market Structure analysis (swing pivots, BOS/MSS) + Point of Control tracking
Unique Innovations:
Dynamic Confluence Algorithm + Aggressive vs Passive Order Flow Decomposition + Adaptive Depletion Thresholds + Real-Time Absorption Detection + Battle Analysis with (AGG) markers + Complete Unified Methodology
Technical Excellence:
Resource-optimized (max 50 zones), comprehensive safety checks, multi-tier labeling, flexible customization
Best Practices
Wait for first touch - No label = untested zone
Watch (AGG) markers - Institutional urgency signal
Trust adaptive depletion - Strong zones failing early = major reversal
Use POC for entries - Best price within zone
Combine higher timeframes - Daily/4H zones strongest
Respect zones - Failed support becomes resistance
Follow battle labels - Contested areas show stop clusters
Adjust sensitivity - Tight ranges = lower %, trending = higher %
Performance Notes
Maximum Active Zones: 50 (automatic cleanup)
Maximum Lines: 400 (POC managed dynamically)
Lookback Cap: 1000 bars for optimization
Updates: All calculations on bar close for confirmed signals

Pressure Pivots - MPI (Strategy)⇋ PRESSURE PIVOTS — MARKET PRESSURE INDEX STRATEGY
A comprehensive reversal trading system that combines order flow pressure analysis, multi-factor confluence detection, and adaptive machine learning to identify high-probability turning points in liquid markets.
━━━━━━━━━━━━━━━━━━━━━━━━━━━━━━━━━━━━━
CORE INNOVATION: MARKET PRESSURE INDEX (MPI)
Traditional indicators measure price movement. The Market Pressure Index measures the force behind the movement.
How MPI Works:
Every bar tells two stories through volume distribution:
• Buy Pressure: Volume × (Close - Low) / (High - Low)
• Sell Pressure: Volume × (High - Close) / (High - Low)
• Net Pressure: Buy Pressure - Sell Pressure
This raw pressure is then normalized against baseline activity to create the bounded MPI (-1.0 to +1.0):
• Smooth Pressure: EMA(Net Pressure, period)
• Baseline Activity: SMA(|Net Pressure|, period × 2)
• MPI: (Smooth Pressure / Baseline) × Sensitivity
What MPI Reveals:
MPI > +0.7: Extreme buy pressure → Exhaustion potential
MPI = +0.2 to +0.7: Healthy bullish momentum
MPI = -0.2 to +0.2: Neutral/balanced pressure
MPI = -0.7 to -0.2: Healthy bearish momentum
MPI < -0.7: Extreme sell pressure → Exhaustion potential
Why It Works:
Two bars can both move 10 points, but if one closes at the high on high volume (aggressive buying) and the other closes mid-range on average volume (weak buying), only MPI distinguishes between sustainable momentum and exhaustion. This volume-weighted pressure analysis reveals conviction behind price moves—the key to timing reversals.
━━━━━━━━━━━━━━━━━━━━━━━━━━━━━━━━━━━━━
SEVEN-FACTOR CONFLUENCE SYSTEM
MPI extremes alone aren't enough. The system requires multiple independent confirmations through weighted scoring:
1. DIVERGENCE (Weight: 3.0) — Premium Signal Type: DIV
Price makes new high but MPI makes lower high (or inverse for bullish)
• Detection: Tracks pivots with 5-bar lookback, compares price vs MPI at pivot points
• Signal: Purple triangles, highest weight (pressure weakening while price extends)
2. LIQUIDITY SWEEP (Weight: 2.5) — Premium Signal Type: LIQ
Price breaks swing high/low within 0.3 ATR then reverses
• Detection: Break within tolerance + close back through level
• Signal: Orange triangles, second-highest weight (stop hunt reversal)
3. ORDER FLOW IMBALANCE (Weight: 2.0) — Premium Signal Type: OF
Aggressive buying/selling 50% above normal
• Detection: EMA(aggressive volume) vs SMA(imbalance) threshold
• Signal: Aqua triangles, institutional positioning
4. VELOCITY EXHAUSTION (Weight: 1.5)
Parabolic move (2+ ATRs in 3 bars) + extreme MPI
• Detection: |3-bar price change / ATR| > threshold + MPI > ±0.5
• Indicates: Momentum deceleration, blow-off top/bottom
5. WICK REJECTION (Weight: 1.5)
Single bar: wick > 60% of range, or sequence: 2 bars with 40% + 30% wicks
• Detection: Shooting stars (bearish) or hammers (bullish)
• Indicates: Intrabar rejection, battle won by opposing side
6. VOLUME SPIKE (Weight: 1.0)
Volume > 20-bar average × multiplier (default: 2.0x)
• Detection: Participation surge confirmation
• Lowest weight: Can be manipulated, better as confirmation
7. POSITION FACTOR (Weight: 1.0)
At 10-bar highest (bearish) or lowest (bullish)
• Detection: Structural positioning for reversal
• Base requirement: Must be at extreme to score
Scoring Logic:
Premium Signals (DIV/LIQ/OF): Must score ≥6.0 (default premiumThreshold)
Standard Signals (STD): Must score ≥4.0 (default standardThreshold)
Example Scoring:
Divergence (3.0) + Liquidity Sweep (2.5) + Volume (1.0) = 6.5 → FIRES (DIV signal)
Recent High (1.0) + Wick (1.5) + Volume (1.0) + Velocity (1.5) = 5.0 → FIRES (STD signal)
━━━━━━━━━━━━━━━━━━━━━━━━━━━━━━━━━━━━━
ADAPTIVE LEARNING ENGINE
Unlike static strategies, this system learns from every trade and optimizes itself.
Performance Tracking:
Every trade records:
• Entry Score: Confluence level at entry
• Signal Type: DIV / LIQ / OF / STD
• Win/Loss: Boolean outcome
• R-Multiple: (Exit - Entry) / (Entry - Stop)
• MAE: Maximum Adverse Excursion (worst drawdown)
• MFE: Maximum Favorable Excursion (best profit reached)
Three Adaptive Parameters:
1. Signal Threshold Adaptation
If Win Rate < Target (45%): RAISE threshold → fewer signals, better quality
If Win Rate > Target + 10% AND good R: LOWER threshold → more signals, profitable
2. Stop Distance Adaptation
If Avg MAE > 0.85 AND WR < 50%: WIDEN stops → reduce premature exits
If Avg MAE < 0.4 AND WR > 55%: TIGHTEN stops → reduce risk
3. Target Distance Adaptation
If Avg MFE > Target × 1.5: EXTEND targets → capture more of runners
If Avg MFE < Target × 0.7: SHORTEN targets → take profits faster
Signal Type Filtering:
The system tracks performance by type (DIV/LIQ/OF/STD):
• If Type WR < 40% AND Avg R < 0.8: Type DISABLED
• If Type WR ≥ 40% OR Avg R ≥ 0.8: Type RE-ENABLED
Example: If OF signals consistently lose while DIV signals win, system automatically stops taking OF signals and focuses on DIV.
Warmup Period:
First 30 trades (default) gather baseline data with relaxed thresholds. After warmup, full adaptation activates.
━━━━━━━━━━━━━━━━━━━━━━━━━━━━━━━━━━━━━
COMPLETE POSITION MANAGEMENT
Dynamic Position Sizing:
Base Contracts = (Equity × Risk%) / (Stop Distance × Point Value)
Then multiplied by:
• Score Bonus: Up to +50% for highest-scoring signals
• Signal Type Bonus: DIV signals +50%, LIQ signals +30%
• Streak Multiplier: After 3 losses: 50% reduction, After 3 wins: 25% increase
Example: High-scoring DIV signal on winning streak = 3-4× larger position than weak STD signal on losing streak
Entry Modes:
Single Entry: Full size at once, exit at TP2 (or partial at TP1)
Tiered Entry: 40% at TP1 (2R), 60% at TP2 (4R adaptive)
Stop Management (3 Modes):
Structural: Beyond recent 20-bar swing high/low + buffer
ATR: Fixed ATR multiplier (default: 2.0 ATR, then adapts)
Hybrid: Attempt structural, fallback to ATR if invalid
Plus:
• Breakeven: Move stop to entry ± 1 tick when 1R reached
• Trailing: Activate when 1.5R reached, trail 0.8R behind price
• Max Loss Override: Cap dollar risk regardless of calculation
Target Management:
Fixed Mode: TP1 = 2R, TP2 = 4R
Adaptive Mode: TP1 = 2R fixed, TP2 adapts based on MFE analysis
Partial Exits: Default 50% at TP1, remainder at TP2 or trailing stop
━━━━━━━━━━━━━━━━━━━━━━━━━━━━━━━━━━━━━
COMPREHENSIVE RISK CONTROLS
Daily Limits:
• Max Daily Loss: $2,000 default → HALT trading
• Max Daily Trades: 15 default → prevent overtrading
• Max Concurrent: 2 positions → limit correlation risk
Session Controls:
• Trading Hours: Specify start/end times + timezone
• Weekend Block: Optional (avoid crypto weekend volatility)
Prop Firm Protection (Live Trading Only):
• Daily Loss Limit: Stricter of general or prop limit ($1,000 default)
• Trailing Drawdown: Tracks high water mark, HALTS if breach ($2,500 default)
• Reset on Reload: Optional high water mark reset
Liquidity Filter (Optional):
• Time-Based: Avoid first/last X minutes of session
• Volume-Based: Require minimum volume ratio (0.5× average default)
Market Regime Filter (Optional):
• ADX-Based: Only trade when ADX > threshold (trending)
• Block: Consolidation (ADX < 20) or Transitional regimes
━━━━━━━━━━━━━━━━━━━━━━━━━━━━━━━━━━━━━
REAL-TIME DASHBOARD
MPI Gauge Section:
Shows current pressure: 🟢 STRONG BUY (+0.5 to +1.0), 🟩 BUY PRESSURE (+0.2 to +0.5), ⚪ NEUTRAL (-0.2 to +0.2), 🟥 SELL PRESSURE (-0.5 to -0.2), 🔴 STRONG SELL (-1.0 to -0.5)
Signal Status Section:
• Active Signals: "🔴 DIV SELL" (purple background), "🟢 LIQ BUY" (orange), "🔵 OF SELL" (aqua), "🟢 STD BUY" (green)
• Warnings: "⚠️ BEAR WARNING" / "⚠️ BULL WARNING" (yellow) — setup forming, not full signal
• Scanning: "⏳ SCANNING..." (gray) — no signal active
• Confidence Bar: Visual score display "██████░░░░" showing confluence strength
Divergence Indicator:
"🟣 BEARISH DIVERGENCE" or "🟡 BULLISH DIVERGENCE" when detected
Performance Statistics:
• Overall Win Rate: Wins/Total with visual bar (lime ≥70%, yellow 50-70%, red <50%)
• Directional: Bearish vs Bullish win rates separately
• By Signal Type: DIV / LIQ / OF / STD individual performance tracking
━━━━━━━━━━━━━━━━━━━━━━━━━━━━━━━━━━━━━
KEY PARAMETERS EXPLAINED
🎯 Pressure Engine:
• MPI Period (5-50, default: 14): Smoothing period — lower for scalping, higher for position trading
• MPI Sensitivity (0.5-5.0, default: 1.5): Amplification — lower compresses range, higher more extremes
🔍 Detection:
• Wick Threshold (0.3-0.9, default: 0.6): Minimum wick-to-range ratio for rejection
• Volume Spike (1.2-3.0x, default: 2.0): Multiplier above average for spike
• Aggressive Ratio (0.5-0.9, default: 0.65): Close position in range for aggressive orders
• Velocity Threshold (1.0-5.0 ATR, default: 2.0): ATR-normalized move for exhaustion
• MPI Extreme (0.5-0.95, default: 0.7): Level considered overbought/oversold
⚖️ Weights:
• Divergence: 3.0 (highest — pressure weakening)
• Liquidity: 2.5 (second — stop hunts)
• Order Flow: 2.0 (institutional positioning)
• Velocity: 1.5 (momentum exhaustion)
• Wick: 1.5 (rejection patterns)
• Volume: 1.0 (lowest — can be manipulated)
🎚️ Thresholds:
• Premium (4.0-15.0, default: 6.0): Score for DIV/LIQ/OF signals
• Standard (2.0-8.0, default: 4.0): Score for STD signals
• Warning Confluence (1-4, default: 2): Factors for yellow diamond warnings
🧬 Adaptive:
• Enable (true/false, default: true): Master learning switch
• Warmup Trades (5-100, default: 30): Data collection before adaptation
• Lookback (20-200, default: 50): Recent trades for performance calculation
• Adapt Speed (0.05-0.50, default: 0.15): Parameter adjustment rate
• Target Win Rate (30-70%, default: 45%): Optimization goal
• Target R-Multiple (0.5-5.0, default: 1.5): Risk/reward goal
💼 Position:
• Base Risk (0.1-10.0%, default: 1.5%): Equity risked per trade
• Max Contracts (1-100, default: 10): Hard position limit
• DIV Bonus (1.0-3.0x, default: 1.5): Size multiplier for divergence signals
• LIQ Bonus (1.0-3.0x, default: 1.3): Size multiplier for liquidity signals
🛡️ Stops:
• Mode (Structural/ATR/Hybrid, default: ATR): Stop placement method
• ATR Multiplier (0.5-5.0, default: 2.0): Stop distance in ATRs (adapts)
• Breakeven at (0.3-3.0R, default: 1.0R): When to move stop to entry
• Trail Trigger (0.5-5.0R, default: 1.5R): When to activate trailing
• Trail Offset (0.3-3.0R, default: 0.8R): Distance behind price
🎯 Targets:
• Mode (Fixed/Adaptive, default: Fixed): Target placement method
• TP1 (0.5-10.0R, default: 2.0R): First target for partial exit
• TP2 (1.0-15.0R, default: 4.0R): Final target (adapts in adaptive mode)
• Partial % (0-100%, default: 50%): Position percentage to exit at TP1
━━━━━━━━━━━━━━━━━━━━━━━━━━━━━━━━━━━━━
PROFESSIONAL USAGE PROTOCOL
Phase 1: Paper Trading (Weeks 1-4)
• Setup: Default settings, all adaptive features ON, 0.5% base risk
• Goal: 30+ trades for warmup, observe MPI behavior and signal frequency
• Adjust: MPI sensitivity if stuck near neutral or always at extremes
• Threshold: Raise/lower if too many/few signals
Phase 2: Micro Live (Weeks 5-8)
• Requirements: WR >43%, at least one type >55%, Avg R >0.8
• Setup: 10-25% intended size, 0.5-1.0% risk, 1 position max
• Focus: Execution quality, match dashboard performance
• Journal: Screenshot every signal, track outcomes
Phase 3: Full Scale (Month 3+)
• Requirements: WR >45% over 50+ trades, Avg R >1.2, drawdown <15%
• Progression: Months 3-4 (1.0-1.5% risk), 5-6 (1.5-2.0%), 7+ (1.5-2.5%)
• Maintenance: Weekly dashboard review, monthly deep analysis
• Warnings: Reduce size if WR drops >10%, consecutive losses >7, or drawdown >20%
━━━━━━━━━━━━━━━━━━━━━━━━━━━━━━━━━━━━━
DEVELOPMENT INSIGHTS
The Pressure Insight: Emerged from analyzing intrabar volume distribution. Within every candlestick, volume accumulates at different price levels. MPI deconstructs this to reveal conviction behind moves.
The Confluence Challenge: Early versions using MPI extremes alone achieved only 42% win rate. The seven-factor confluence system emerged from testing which combinations produced reliable reversals. Divergence + liquidity sweep became the strongest setup (68% win rate in isolation).
The Adaptive Breakthrough: Per-signal-type performance tracking revealed DIV signals winning at 71% while OF signals languished at 38%. Adaptive filtering disabled weak types automatically, recovering win rate from 39% to 54% during the 2022 volatility spike.
The Position Sizing Revelation: Dynamic sizing based on signal quality and recent performance increased Sharpe ratio from 1.2 to 1.9 while decreasing max drawdown from 18% to 12% over 500 trades. Bigger positions on better signals = geometric edge amplification.
The Risk Control Lesson: Testing with $50K accounts revealed catastrophic failure modes: daily loss cascades, overtrading commission bleed, weekend gap blowouts. Multi-layer controls (daily limits, concurrent caps, prop firm protection) became essential.
━━━━━━━━━━━━━━━━━━━━━━━━━━━━━━━━━━━━━
LIMITATIONS & ASSUMPTIONS
What This Is NOT:
• NOT a Holy Grail: Typical performance 52-58% WR, 1.3-1.8 avg R, probabilistic edge
• NOT Predictive: Identifies high-probability conditions, doesn't forecast prices
• NOT Market-Agnostic: Best on liquid auction-driven markets (futures, forex, major crypto)
• NOT Hands-Off: Requires oversight for news events, gaps, system anomalies
• NOT Immune to Regime Changes: Adaptive engine helps but cannot predict black swans
Critical Assumptions:
1. Volume reflects intent (valid for regulated markets, violated by wash trading)
2. Pressure extremes mean-revert (true in ranging/exhaustion, fails in paradigm shifts)
3. Stop hunts exist (valid in liquid markets, less in thin/random walk periods)
4. Past patterns persist (valid in stable regimes, fails when structure fundamentally changes)
Works Best On: Major futures (ES, NQ, CL), liquid forex pairs (EUR/USD, GBP/USD), large-cap stocks, BTC
Performs Poorly On: Low-volume stocks, illiquid crypto pairs, news-driven headline events
━━━━━━━━━━━━━━━━━━━━━━━━━━━━━━━━━━━━━
RISK DISCLOSURE
Trading futures, forex, and leveraged instruments involves substantial risk of loss and is not suitable for all investors. Past performance is not indicative of future results. This strategy is provided for educational purposes only and should not be construed as financial advice.
The adaptive engine learns from historical data—there is no guarantee that past relationships will persist. Market conditions change, volatility regimes shift, and black swan events occur. No strategy can eliminate the risk of loss.
Users must validate performance on their specific instruments and timeframes before risking capital. The developer makes no warranties regarding profitability or suitability. Users assume all responsibility for trading decisions and outcomes.
"The market doesn't care about your indicators. It only cares about pressure—who's willing to pay more, who's desperate to sell. Find the exhaustion. Trade the reversal. Let the system learn the rest."
Taking you to school. — Dskyz, Trade with insight. Trade with anticipation.

15-Min RSI Scalper [SwissAlgo]15-Min RSI Scalper
Tracks RSI Momentum Loss and Gain to Generate Signals
-------------------------------------------------------
WHAT THIS INDICATOR CALCULATES
This indicator attempts to identify RSI directional changes (RSI momentum) using a step-by-step "ladder" method. It reads RSI(14) from the next higher timeframe relative to your chart. On a 15-minute chart, it uses 1-hour RSI. On a 5-minute chart, it uses 15-minute RSI, and so on.
How the ladder logic works:
The indicator doesn't track RSI all the time. It only starts tracking when RSI crosses into potentially extreme territory (these are called "events" in the code):
For sell signals : when RSI crosses above a dynamic upper threshold (typically between 60-80, calculated as the 90th percentile of recent RSI)
For buy signals : when RSI crosses below a dynamic lower threshold (typically between 20-40, calculated as the 10th percentile of recent RSI)
Once tracking begins, RSI movement is divided into 2-point steps (boxes). The indicator counts how many boxes RSI climbs or falls.
A signal generates only when:
RSI reverses direction by at least 2 boxes (4 RSI points) from its extreme
RSI holds that reversal for 3 consecutive confirmed bars
Example: Dynamic threshold is at 68. RSI crosses above 68 → tracking starts. RSI climbs to 76 (4 boxes up). Then it drops back to 72 and stays below that level for 3 bars → sell signal prints. The buy signal works the same way in reverse.
-------------------------------------------------------
SIGNAL GENERATION METHODOLOGY
Sell Signal (Red Triangle)
RSI crosses above a dynamic start level (calculated as the 90th percentile of the last 1000 bars, constrained between 60-80)
Indicator tracks upward progression in 2-point boxes
RSI reverses and drops below a boundary 2 boxes below the highest box reached
RSI remains below that boundary for 3 confirmed bars
Red triangle plots above price
Reset condition: RSI returns below 50
Buy Signal (Green Triangle)
RSI crosses below a dynamic start level (10th percentile of last 1000 bars, constrained between 20-40)
Indicator tracks downward progression in 2-point boxes
RSI reverses and rises above a boundary 2 boxes above the lowest box reached
RSI remains above that boundary for 3 confirmed bars
Green triangle plots below price
Reset condition: RSI returns above 50
-------------------------------------------------------
TECHNICAL PARAMETERS
All parameters are hardcoded:
RSI Period: 14
Box Size: 2 RSI points
Reversal Threshold: 2 boxes (4 RSI points)
Confirmation Period: 3 bars
Reset Level: RSI 50
Sell Start Range: 60-80 (dynamic)
Buy Start Range: 20-40 (dynamic)
Lookback for Percentile: 1000 bars
Note: Since the code is open source, users can modify these hardcoded values directly in the script to adjust sensitivity. For example, increasing the confirmation period from 3 to 5 bars will produce fewer but more conservative signals. Decreasing the box size from 2 to 1 will make the indicator more responsive to smaller RSI movements.
-------------------------------------------------------
KEY FEATURES
Automatic Higher Timeframe RSI
When applied to a 15-minute chart, the indicator automatically reads 1-hour RSI data. This is the next standard timeframe above 15 minutes in the indicator's logic.
Dynamic Adaptive Start Levels
Sell signals use the 90th percentile of RSI over the last 1000 bars, constrained between 60-80. Buy signals use the 10th percentile, constrained between 20-40. These thresholds recalculate on each bar based on recent data.
Ladder Box System
RSI movements are tracked in 2-point boxes. The indicator requires a 2-box reversal followed by 3 consecutive bars maintaining that reversal before generating a signal.
Dual Signal Output
Red down-triangles plot above price when the sell signal conditions are met. Green up-triangles plot below the price when buy signal conditions are met.
-------------------------------------------------------
REPAINTING
This indicator does not repaint. All calculations use "barstate.isconfirmed" to ensure signals appear only on closed bars. The request.security() call uses lookahead=barmerge.lookahead_off to prevent forward-looking bias.
-------------------------------------------------------
INTENDED CHART TIMEFRAME
This indicator is designed for use on 15-minute charts. The visual reminder table at the top of the chart indicates this requirement.
On a 15-minute chart:
RSI data comes from the 1-hour timeframe
Signals reflect 1-hour momentum shifts
3-bar confirmation equals 45 minutes of price action
Using it on other timeframes will change the higher timeframe RSI source and may produce different behavior.
-------------------------------------------------------
WHAT THIS INDICATOR DOES NOT DO
Does not predict future price movements
Does not provide entry or exit advice
Does not guarantee profitable trades
Does not replace comprehensive technical analysis
Does not account for fundamental factors, news events, or market structure
Does not adapt to all market conditions equally
-------------------------------------------------------
EDUCATIONAL USE
This indicator demonstrates one approach to momentum reversal detection using:
Multi-timeframe analysis
Adaptive thresholds via percentile calculation
Step-wise momentum tracking
Multi-bar confirmation logic
It is designed as a technical study, not a trading system. Signals represent calculated conditions based on RSI behavior, not trade recommendations. Always do your own analysis before taking market positions.
-------------------------------------------------------
RISK DISCLOSURE
Trading involves substantial risk of loss. This indicator:
Is for educational and informational purposes only
Does not constitute financial, investment, or trading advice
Should not be used as the sole basis for trading decisions
Has not been tested across all market conditions
May produce false signals, late signals, or no signals in certain conditions
Past performance of any indicator does not predict future results. Users must conduct their own analysis and risk assessment before making trading decisions. Always use proper risk management, including stop losses and position sizing appropriate to your account and risk tolerance.
MIT LICENSE
This code is open source and provided as-is without warranties of any kind. You may use, modify, and distribute it freely under the MIT License.

Contrarian Market Structure BreakMarket Structure Break application was inspired and adapted from Market Structure Oscillator indicator developed by Lux Algo. So much credit to their work.
This indicator pairs nicely with the Contrarian 100 MA and can be located here:
Indicator Description: Contrarian Market Structure BreakOverview
The "Contrarian Market Structure Break" indicator is a versatile tool tailored for traders seeking to identify potential reversal opportunities by analyzing market structure across multiple timeframes. Built on Institutional Concepts of Structure (ICT), this indicator detects Break of Structure (BOS) and Change of Character (CHoCH) patterns across short-term, intermediate-term, and long-term swings, plotting them with customizable lines and labels. It generates contrarian buy and sell signals when price breaks key swing levels, with a unique "Blue Dot Tracker" to monitor consecutive buy signals for trend confirmation. Optimized for the daily timeframe, this indicator is adaptable to other timeframes with proper testing, making it ideal for traders of forex, stocks, or cryptocurrencies.
How It Works
The indicator combines three key components to provide a comprehensive view of market dynamics: Multi-Timeframe Market Structure Analysis: It identifies swing highs and lows across short-term, intermediate-term, and long-term periods, plotting BOS (continuation) and CHoCH (reversal) events with customizable line styles and labels.
Contrarian Signal Generation: Buy and sell signals are triggered when the price crosses below swing lows (buy) or above swing highs (sell), indicating potential reversals in overextended markets.
Blue Dot Tracker: A unique feature that counts consecutive buy signals ("blue dots") and highlights a "Hold Investment" state with a yellow background when three or more buy signals occur, suggesting a potential trend continuation.
Signals are visualized as small circles below (buy) or above (sell) price bars, and a table in the bottom-right corner displays the blue dot count and recommended action (Hold or Flip Investment), enhancing decision-making clarity.
Mathematical Concepts Swing Detection: The indicator identifies swing highs and lows by comparing price patterns over three bars, ensuring robust detection of pivot points. A swing high occurs when the middle bar’s high is higher than the surrounding bars, and a swing low occurs when the middle bar’s low is lower.
Market Structure Logic: BOS is detected when the price breaks a prior swing high (bullish) or low (bearish) in the direction of the current trend, while CHoCH signals a potential reversal when the price breaks a swing level against the trend. These are calculated across three timeframes for a multi-dimensional perspective.
Blue Dot Tracker: This feature counts consecutive buy signals and tracks the entry price. If three or more buy signals occur without a sell signal, the indicator enters a "Hold Investment" state, marked by a yellow background, until the price exceeds the entry price or a sell signal occurs.
Entry and Exit Rules Buy Signal (Blue Dot Below Bar): Triggered when the closing price crosses below a swing low on either the intermediate-term or long-term timeframe, suggesting an oversold condition and potential reversal upward. Short-term signals can be enabled but are disabled by default to reduce noise.
Sell Signal (White Dot Above Bar): Triggered when the closing price crosses above a swing high on either the intermediate-term or long-term timeframe, indicating an overbought condition and potential reversal downward.
Blue Dot Tracker Logic: After a buy signal, the indicator increments a blue dot counter and records the entry price. If three or more consecutive buy signals occur (blueDotCount ≥ 3), the indicator enters a "Hold Investment" state, highlighted with a yellow background, suggesting a potential trend continuation. The "Hold Investment" state ends when the price exceeds the entry price or a sell signal occurs, resetting the counter.
Exit Rules: Traders can exit buy positions when a sell signal appears, the price exceeds the entry price during a "Hold Investment" state, or based on additional confirmation from BOS/CHoCH patterns or other technical analysis tools. Always use proper risk management.
Recommended Usage
The indicator is optimized for the daily timeframe, where it effectively captures significant reversal and continuation patterns in trending or ranging markets. It can be adapted to other timeframes (e.g., 1H, 4H, 15M) with careful testing of settings, particularly enabling/disabling short-term structure analysis to suit market conditions. Backtesting is recommended to optimize performance for your chosen asset and timeframe.
Customization Options Market Structure Display: Toggle short-term, intermediate-term, and long-term structures on or off, with customizable line styles (solid, dashed, dotted) and colors for bullish and bearish breaks.
Labels: Enable or disable BOS/CHoCH labels for each timeframe to reduce chart clutter.
Signal Visibility: Hide buy/sell signals if desired for a cleaner chart.
Blue Dot Tracker: Monitor the blue dot count and action (Hold or Flip Investment) via the table display, which is fully customizable in terms of position and appearance.
Why Use This Indicator?
The "Contrarian Market Structure Break" indicator offers a robust framework for identifying high-probability reversal and continuation setups using ICT principles. Its multi-timeframe analysis, clear signal visualization, and innovative Blue Dot Tracker provide traders with actionable insights into market dynamics. Whether you're a swing trader or a day trader, this indicator’s flexibility and intuitive design make it a valuable addition to your trading arsenal.
Note for TradingView Moderators
This script complies with TradingView's House Rules by providing an educational and transparent description without performance claims or guarantees. It is designed to assist traders in technical analysis and should be used alongside proper risk management and personal research. The code is original, well-documented, and includes customizable inputs and clear visual outputs to enhance the user experience.
Tips for Users:
Backtest thoroughly on your chosen asset and timeframe to validate signal reliability. Combine with other indicators or price action analysis for confirmation of entries and exits. Adjust timeframe settings and enable/disable short-term structures to match market volatility and your trading style.
Hope the "Contrarian Market Structure Break" indicator enhances your trading strategy and helps you navigate the markets with confidence! Happy trading!

HMA Buy Sell Signals - Profit ManagerNote : Settings should be adjusted according to the selected time frame. Try to find the best setting according to the profitability rate
Overall Functionality
This script combines several trading tools to create a comprehensive system for trend analysis, trade execution, and performance tracking. Users can identify market trends using specific moving averages and RSI indicators while managing profit and loss levels automatically.
Trend Detection and Trade Signals
Hull Moving Averages (HMA):
Two HMAs (a faster one and a slower one) are used to determine the market trend.
A buy signal is generated when the faster HMA crosses above the slower HMA.
Conversely, a sell signal is triggered when the faster HMA crosses below the slower one.
Visual Feedback:
Trend lines on the chart change color to reflect the trend direction (e.g., green for upward trends and red for downward trends).
Trade Levels and Management
Entry, Take-Profit, and Stop-Loss Levels:
When the trend shifts upwards, the script calculates entry, take-profit, and stop-loss levels based on the opening price.
Similarly, for downward trends, these levels are determined for short trades.
Commission Tracking:
Each trade includes a commission cost, which is factored into net profit and loss calculations.
Dynamic Labels:
Entry, take-profit, and stop-loss levels are visually marked on the chart for easier tracking.
Performance Tracking
Profit and Loss Tracking:
The script keeps a running total of profits, losses, and commissions for both long and short trades.
It also calculates the net profit after all costs are considered.
Performance Table:
A table is displayed on the chart summarizing:
The number of trades.
Total profit and loss for long and short positions.
Commission costs.
Net profit.
Fractal Support and Resistance
Dynamic Lines:
The script identifies the most recent significant highs and lows using fractals.
It draws support and resistance lines that automatically update as new fractals form.
Simplified Visuals:
The chart always shows the last two support and resistance lines, keeping the visualization clean and focused.
RSI-Based Signals
Overbought and Oversold Levels:
RSI is used to identify overbought (above 80) and oversold (below 20) conditions.
The script generates buy signals at oversold levels and sell signals at overbought levels.
Chart Indicators:
Arrows and labels appear on the chart to highlight these RSI-based opportunities.
Customization
The script allows users to customize key parameters such as:
Moving average lengths for trend detection.
Take-profit and stop-loss percentages.
Timeframes for backtesting.
Starting capital and commission rates.
Conclusion
This script is a versatile tool for traders, combining trend detection, automated trade management, and visual feedback. It simplifies decision-making by providing clear signals and tracking performance metrics, making it suitable for both beginners and experienced traders.
* The most recently drawn fractals represent potential support and resistance levels. If the price aligns with these levels at the time of entering a trade, it may indicate a likelihood of reversal. In such cases, it’s advisable to either avoid entering the trade altogether or proceed with increased caution.

RTH Levels: VWAP + PDH/PDL + ONH/ONL + IBAlgo Index — Levels Pro (ONH/ONL • PDH/PDL • VWAP±Bands • IB • Gaps)
Purpose. A session-aware, non-repainting levels tool for intraday decision-making. Designed for futures and indices, with clean visuals, alerts, and a one-click Minimal Mode for screenshot-ready charts.
What it plots
• PDH/PDL (RTH-only) – Prior Regular Trading Hours high/low, computed intraday and frozen at the RTH close (no 24h mix-ups, no repainting).
• ONH/ONL – Prior Overnight high/low, held throughout RTH.
• RTH VWAP with ±σ bands – Volume-weighted variance, reset each RTH.
• Initial Balance (IB) – First N minutes of RTH, plus 1.5× / 2.0× extensions after IB completes.
• Today’s RTH Open & Prior RTH Close – With gap detection and “gap filled” alert.
• Killzone shading – NY Open (09:30–10:30 ET) and Lunch (11:15–13:30 ET).
• Values panel (top-right) – Each level with live distance in points & ticks.
• Right-edge level tags – With anti-overlap (stagger + vertical jitter).
• Price-scale tags – Native trackprice markers that always “stick” to the axis.
⸻
New in v6.4
• Minimal Mode: one click for a clean look (thinner lines, VWAP bands/IB extensions hidden, on-chart right-edge labels off; price-scale tags remain).
• Theme presets: Dark Hi-Contrast / Light Minimal / Futures Classic / Muted Dark.
• Anti-overlap controls: horizontal staggering, vertical jitter, and baseline offset to keep tags readable even when levels cluster.
⸻
Quick start (2 minutes)
1. Add to chart → keep defaults.
2. Sessions (ET):
• RTH Session default: 09:30–16:00 (US equities cash hours).
• Overnight Session default: 18:00–09:29.
Adjust for your market if you use different “day” hours (e.g., many use 08:20–13:30 ET for COMEX Gold).
3. Theme & Minimal Mode: pick a Theme Preset; enable Minimal Mode for screenshots.
4. Visibility: toggle PD/ON/VWAP/IB/References/Panel to taste.
5. Right-edge labels: turn Show Right-Edge Labels on. If they crowd, tune:
• Anti-overlap: min separation (ticks)
• Horizontal offset per tag (bars)
• Vertical jitter per step (ticks)
• Right-edge baseline offset (bars)
6. Alerts: open Add alert → Condition: and pick the events you want.
⸻
How levels are computed (no repainting)
• PDH/PDL: Intraday H/L are accumulated only while in RTH and saved at RTH close for “yesterday’s” values.
• ONH/ONL: Accumulated across the defined Overnight window and then held during RTH.
• RTH VWAP & ±σ: Volume-weighted mean and standard deviation, reset at the RTH open.
• IB: First N minutes of RTH (default 60). Extensions (1.5×/2.0×) appear after IB completes.
• Gaps: Today’s RTH open vs prior RTH close; “Gap Filled” triggers when price trades back to prior close.
⸻
Practical playbooks (how to trade around the levels)
1) PDH/PDL interactions
• Rejection: Price taps PDH/PDL then closes back inside → mean-reversion toward VWAP/IB.
• Acceptance: Close/hold beyond PDH/PDL with momentum → continuation to next HTF/IB target.
• Alert: PD Touch/Break.
2) ONH/ONL “taken”
• Often one ON extreme is taken during RTH. ONH Taken / ONL Taken → check if it’s a clean break or sweep & reclaim.
• Sweep + reclaim near VWAP can fuel rotations through the ON range.
3) VWAP ±σ framework
• Balanced: First tag of ±1σ often reverts toward VWAP.
• Trend: Persistent trade beyond ±1σ + IB break → target ±2σ/±3σ.
• Alerts: VWAP Cross and VWAP Reject (cross then immediate fail back).
4) IB breaks
• After IB completes, a clean IB break commonly targets 1.5× and sometimes 2.0×.
• Quick return inside IB = possible fade back to the opposite IB edge/VWAP.
• Alerts: IB Break Up / Down.
5) Gaps
• Gap-and-go: Opening drive away from prior close + VWAP support → trend until IB completion.
• Gap-fill: Weak open and VWAP overhead/underfoot → trade toward prior close; manage on Gap Filled alert.
Pro tip: Stack confluences (e.g., ONL sweep + VWAP reclaim + IB hold) and respect your execution rules (e.g., require a 5-minute close in direction, or your order-flow confirmation).
⸻
Inputs you’ll actually touch
• Sessions (ET): Session Timezone, RTH Session, Overnight Session.
• Visibility: toggles for PD/ON/VWAP/IB/Ref/Panel.
• VWAP bands: set σ multipliers (±1/±2/±3).
• IB: duration (minutes) and extension multipliers (1.5× / 2.0×).
• Style & Theme: Theme Preset, Main Line Width, Trackprice, Minimal Mode, and anti-overlap controls.
⸻
Alerts included
• PD Touch/Break — High ≥ PDH or Low ≤ PDL
• ONH Taken / ONL Taken — First in-RTH take of ONH/ONL
• VWAP Cross — Close crosses VWAP
• VWAP Reject — Cross then immediate fail back
• IB Break Up / Down — Break of IB High/Low after IB completes
• Gap Filled — Price trades back to prior RTH close
Setup: Add alert → Condition: Algo Index — Levels Pro → choose event → message → Notify on app/email.
⸻
Panel guide
The top-right panel shows each level plus live distance from last price:
LevelValue (Δpoints | Δticks)
Coloring: green if level is below current price, red if above.
⸻
Styling & screenshot tips
• Use Theme Preset that matches your chart.
• For dark charts, “Dark Hi-Contrast” with Main Line Width = 3 works well.
• Enable Trackprice for crisp axis tags that always stick to the right edge.
• Turn on Minimal Mode for cleaner screenshots (no VWAP bands or IB extensions, on-chart tags off; price-scale tags remain).
• If tags crowd, increase min separation (ticks) to 30–60 and horizontal offset to 3–5; add vertical jitter (4–12 ticks) and/or push tags farther right with baseline offset (bars).
⸻
Behavior & limitations
• Levels are computed incrementally; tables refresh on the last bar for efficiency.
• Right-edge labels are placed at bar_index + offset and do not track extra right-margin scrolling (TradingView limitation). The price-scale tags (from trackprice) do track the axis.
• “RTH” is what you define in inputs. If your market uses different day hours, change the session strings so PDH/PDL reflect your definition of “yesterday’s session.”
⸻
FAQ
Q: My PDH/PDL don’t match the daily chart.
A: By design this uses RTH-only highs/lows, not 24h daily bars. Adjust sessions if you want a different definition.
Q: Right-edge tags overlap or don’t sit at the far right.
A: Increase min separation / horizontal offset / vertical jitter and/or push tags farther with baseline offset. If you want markers that always hug the axis, rely on Trackprice.
Q: Can I change killzones?
A: Yes—edit the session strings in settings or request a version with user inputs for custom windows.
⸻
Disclaimer
Educational use only. This is not financial advice. Always apply your own risk management and confirmation rules.
⸻
Enjoy it? Please ⭐ the script and share screenshots using Minimal Mode + a Theme Preset that fits your style.
