Position Tracker by GG_ALGOPosition Tracker – Custom Stop Loss & Take Profit Calculator
This script is a position tracking tool designed to help traders automatically calculate Stop Loss (SL) and Take Profit (TP) levels based on a given Entry Price. It works across all markets, including Crypto, Forex, Indices, and Stocks.
How It Works :
1️⃣ Set Your Entry Price – Click on the chart to select your trade entry.
2️⃣ Choose Trade Direction – Select Long or Short in the settings.
3️⃣ Customizable Stop Loss & Take Profit
– Users can adjust SL and TP levels in the settings.
The default values are:
Stop Loss (SL): 0.5%
Take Profit (TP) 1: 1%
Take Profit (TP) 2: 2%
Take Profit (TP) 3: 3%
Why Use This Indicator?
✅ Fully Customizable – Adjust SL & TP percentages to match your trading strategy.
✅ Works for All Markets – Supports Crypto, Forex, Stocks, and Indices.
✅ Saves Time – No need for manual SL/TP calculations.
✅ User-Friendly – Just set the entry price and direction, and the script does the rest.
This tool helps traders quickly define risk-reward setups and execute trades efficiently.
Cari dalam skrip untuk "track"

Risk TrackerThis Risk Tracker Pine Script provides traders with a customizable tool for tracking and managing trade risk directly on their chart. The script is designed to accommodate both futures and crypto trades, allowing you to monitor risk and reward parameters, adjust contract sizes, and manage leverage in real-time.
Key Features:
1. Trade Direction and Risk-Reward Ratio:
• Select between Long or Short trade directions.
• Set a custom Risk-Reward Ratio (RRR) to calculate potential profit and loss levels based on your trade setup.
2. Customizable Parameters:
• Input fields for contract size, leverage, margin, and maximum drawdown allow you to adjust the risk settings depending on the market you are trading.
• You can toggle between using a dollar-based or percentage-based risk calculation depending on whether you’re trading futures (USD-based) or crypto.
3. Real-time Stop-Loss and Take-Profit Calculation:
• The script automatically calculates and draws the Stop-Loss (SL) and Take-Profit (TP) levels on the chart based on your entry price and selected risk settings.
• The color of the SL and TP lines is customizable, allowing you to visually distinguish profit and loss levels.
4. Historical Price Levels:
• If there is no active trade, the script scans historical price data to find the last instances when the price hit the predefined stop-loss or take-profit levels, helping you understand past price behavior.
5. Risk Management Table:
• A summary table is displayed on the chart, showing the key metrics of your trade, including:
• Tick value and Dollar value for futures.
• Margin and Leverage for crypto.
• Risk-Reward Ratio, Entry price, Risk and Profit in USD or percentage terms.
• The table dynamically updates based on the current trade status.
6. Extended Chart Visualization:
• Option to extend the SL and TP lines to the left of the chart, allowing you to easily view these levels across multiple timeframes and bars.
This script helps ensure you are always aware of your trade’s risk profile, providing a clear and visual representation of potential profit and loss, both in terms of percentage and dollar value. Ideal for futures and crypto traders who rely on precise risk management to maintain profitability.

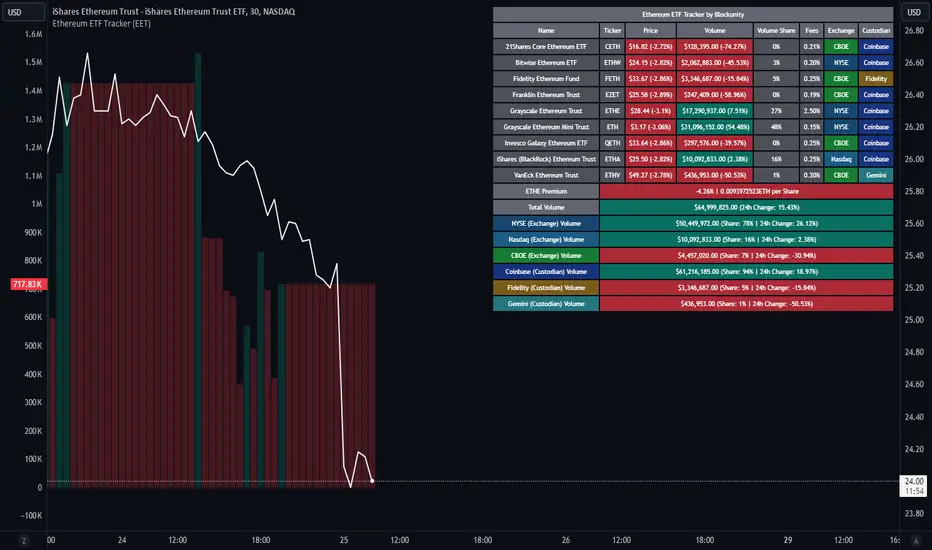
Ethereum ETF Tracker (EET)Get all the information you need about all the different Ethereum ETF.
With the Ethereum ETF Tracker, you can observe all possible Ethereum ETF data:
ETF name.
Ticker.
Price.
Volume.
Share of total ETF volume.
Fees.
Exchange.
Custodian.
At the bottom of the table, you'll find the ETHE Premium (and ETH per Share), and day's total volume.
In addition, you can see the volume for the different Exchanges, as well as for the different Custodians.
If you don't want to display these lines to save space, you can uncheck "Show Additional Data" in the indicator settings.
The Idea
The goal is to provide the community with a tool for tracking all Ethereum ETF data in a synthesized way, directly in your TradingView chart.
How to Use
Simply read the information in the table. You can hover above the Fees and Exchanges cells for more details.
The table takes space on the chart, you can remove the extra lines by unchecking "Show Additional Data" in the indicator settings or reduce text size by changing the "Table Text Size" parameter.
Aggregate volume can be displayed directly on the graph (this volume can be displayed on any asset, such as Ethereum itself). The display can be disabled in the settings.
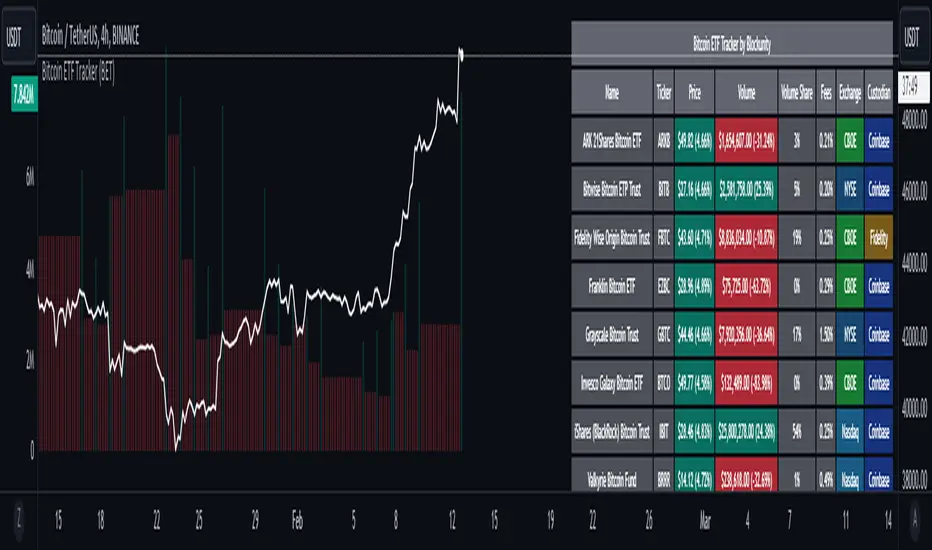
Bitcoin ETF Tracker (BET)Get all the information you need about all the different Bitcoin ETFs.
With the Bitcoin ETF Tracker, you can observe all possible Bitcoin ETF data:
The ETF name.
The ticker.
The price.
The volume.
The share of total ETF volume.
The ETF fees.
The exchange and custodian.
At the bottom of the table, you'll find the day's total volume.
In addition, you can see the volume for the different Exchanges, as well as for the different Custodians.
If you don't want to display these lines to save space, you can uncheck "Show Additional Data" in the indicator settings.
The Idea
The goal is to provide the community with a tool for tracking all Bitcoin ETF data in a synthesized way, directly in your TradingView chart.
How to Use
Simply read the information in the table. You can hover above the Fees and Exchanges cells for more details.
The table takes space on the chart, you can remove the extra lines by unchecking "Show Additional Data" in the indicator settings or reduce text size by changing the "Table Text Size" parameter.
Upcoming Features
As soon as we have a little more history, we'll add variation rates as well as plots to observe the breakdown between the various Exchanges and Custodians.
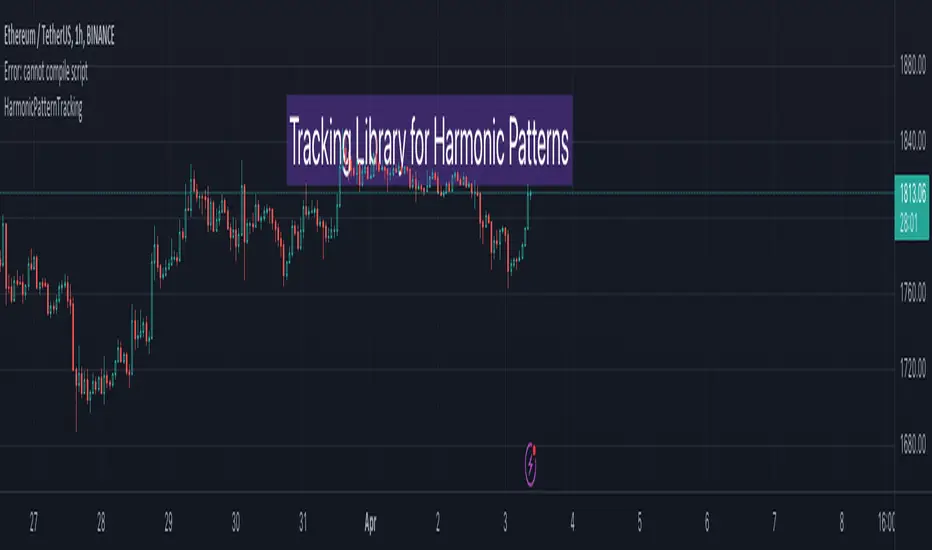
HarmonicPatternTrackingLibrary "HarmonicPatternTracking"
Library contains few data structures and methods for tracking harmonic pattern trades via pinescript.
method draw(this)
Creates and draws HarmonicDrawing object for given HarmonicPattern
Namespace types: HarmonicPattern
Parameters:
this (HarmonicPattern) : HarmonicPattern object
Returns: current HarmonicPattern object
method addTrade(this)
calculates HarmonicTrade and sets trade object for HarmonicPattern
Namespace types: HarmonicPattern
Parameters:
this (HarmonicPattern) : HarmonicPattern object
Returns: bool true if pattern trades are valid, false otherwise
method delete(this)
Deletes drawing objects of HarmonicDrawing
Namespace types: HarmonicDrawing
Parameters:
this (HarmonicDrawing) : HarmonicDrawing object
Returns: current HarmonicDrawing object
method delete(this)
Deletes drawings of harmonic pattern
Namespace types: HarmonicPattern
Parameters:
this (HarmonicPattern) : HarmonicPattern object
Returns: current HarmonicPattern object
HarmonicDrawing
Drawing objects of Harmonic Pattern
Fields:
xa (series line) : xa line
ab (series line) : ab line
bc (series line) : bc line
cd (series line) : cd line
xb (series line) : xb line
bd (series line) : bd line
ac (series line) : ac line
xd (series line) : xd line
x (series label) : label for pivot x
a (series label) : label for pivot a
b (series label) : label for pivot b
c (series label) : label for pivot c
d (series label) : label for pivot d
xabRatio (series label) : label for XAB Ratio
abcRatio (series label) : label for ABC Ratio
bcdRatio (series label) : label for BCD Ratio
xadRatio (series label) : label for XAD Ratio
HarmonicTrade
Trade tracking parameters of Harmonic Patterns
Fields:
initialEntry (series float) : initial entry when pattern first formed.
entry (series float) : trailed entry price.
initialStop (series float) : initial stop when trade first entered.
stop (series float) : current stop updated as per trailing rules.
target1 (series float) : First target value
target2 (series float) : Second target value
target3 (series float) : Third target value
target4 (series float) : Fourth target value
status (series int) : Trade status referenced as integer
retouch (series bool) : Flag to show if the price retouched after entry
HarmonicProperties
Display and trade calculation properties for Harmonic Patterns
Fields:
fillMajorTriangles (series bool) : Display property used for using linefill for harmonic major triangles
fillMinorTriangles (series bool) : Display property used for using linefill for harmonic minor triangles
majorFillTransparency (series int) : transparency setting for major triangles
minorFillTransparency (series int) : transparency setting for minor triangles
showXABCD (series bool) : Display XABCD pivot labels
lblSizePivots (series string) : Pivot label size
showRatios (series bool) : Display Ratio labels
useLogScaleForScan (series bool) : Use log scale to determine fib ratios for pattern scanning
useLogScaleForTargets (series bool) : Use log scale to determine fib ratios for target calculation
base (series string) : base on which calculation of stop/targets are made.
entryRatio (series float) : fib ratio to calculate entry
stopRatio (series float) : fib ratio to calculate initial stop
target1Ratio (series float) : fib ratio to calculate first target
target2Ratio (series float) : fib ratio to calculate second target
target3Ratio (series float) : fib ratio to calculate third target
target4Ratio (series float) : fib ratio to calculate fourth target
HarmonicPattern
Harmonic pattern object to track entire pattern trade life cycle
Fields:
id (series int) : Pattern Id
dir (series int) : pattern direction
x (series float) : X Pivot
a (series float) : A Pivot
b (series float) : B Pivot
c (series float) : C Pivot
d (series float) : D Pivot
xBar (series int) : Bar index of X Pivot
aBar (series int) : Bar index of A Pivot
bBar (series int) : Bar index of B Pivot
cBar (series int) : Bar index of C Pivot
dBar (series int) : Bar index of D Pivot
przStart (series float) : Start of PRZ range
przEnd (series float) : End of PRZ range
patterns (bool ) : array representing the patterns
patternLabel (series string) : string representation of list of patterns
patternColor (series color) : color assigned to pattern
properties (HarmonicProperties) : HarmonicProperties object containing display and calculation properties
trade (HarmonicTrade) : HarmonicTrade object to track trades
drawing (HarmonicDrawing) : HarmonicDrawing object to manage drawings
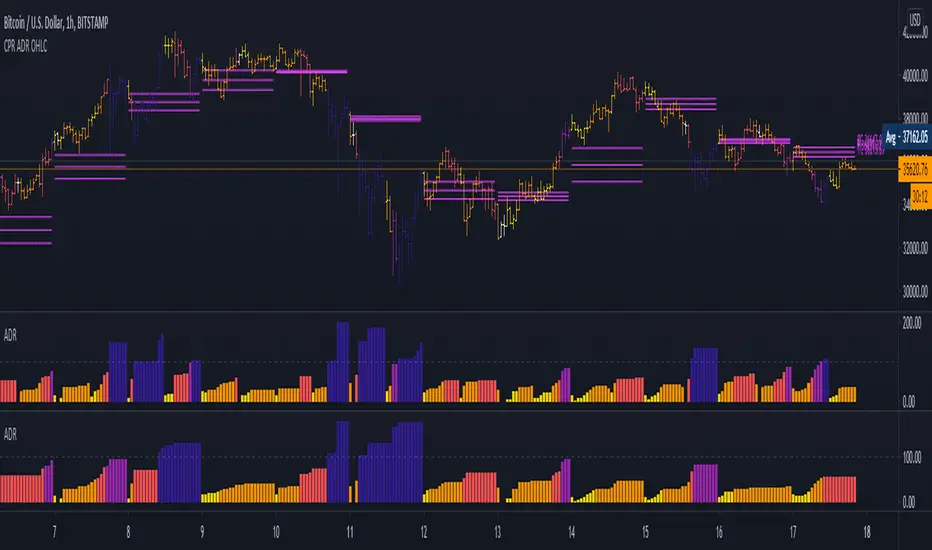
5 Day ADR ICT Intraday Tracker + Timeframes, Alerts, BarcolorsThis indicator gives you a hint on hypothetical room left for a trade by tracking todays current range as a percentage of the 5 Day ADR.
Look for entries in yellow and orange zones and exits on dark blue once the ADR is reached.
I just added a Timeframe, Alerts for High and Low Zones and an option to colorize the Bars/Candles to "5 Day ADR ICT Intraday Tracker" by BryceWH
RSI Season Tracker by KrisWatersSeason tracker identifies the momentum with tracking dominance and market capitalization data of Bitcoin , Altcoin and USDT .
With this indicator you can able to get know about Bitcoin, Altcoin and USDT dominance and market capitalization easily.
Backgrond Color Definations:
If the background color of indicator is ORANGE means that Bitcoin dominance is the most powerful. It is a good sign for Bitcoin.
If the background color of indicator is BLUE means that Altcoin dominance is the most powerful. It is a good sign for Altcoins.
If the background color of indicator is GREEN means that USDT dominance is the most powerful. It is a good sign for USDT.
Plus Sign (+) Meaning and Color Definations:
If ORANGE plus sign is visible on indicator means that market capitalization of Bitcoin is increasing. It is a good sign for Bitcoin.
If BLUE plus sign is visible on indicator means that market capitalization of Altcoin is increasing. It is a good sign for Altcoins.
If GREEN plus sign is visible on indicator means that market capitalization of Bitcoin and Altcoins are decreasing. It is not a good sign for both.
Light and Dark RSI Line Color Definations:
If the line of Bitcoin color is Orange means that, RSI value was increased compared with previous bar. It is one of the good sign of the momentum strength.
If the line of Bitcoin color is Yellow means that, RSI value was decreased compared with previous bar. It is not a good sign.
If the line of Altcoin color is Navy means that, RSI value was increased compared with previous bar. It is one of the good sign of the momentum strength.
If the line of Altcoin color is Blue means that, RSI value was decreased compared with previous bar. It is not a good sign.
If the line of USDT color is Green means that, RSI value was increased compared with previous bar. It is one of good the sign of the momentum strength.
If the line of USDT color is Lime means that, RSI value was decreased compared with previous bar. It is not a good sign.
Simple RSI rules are valid for this indicator.
RSI value is under 30 indicates that asset is OVERSOLD .
RSI value is upper 70 indicates that asset is OVERBOUGHT .
Important Notice: Dominance data is not correlated with price. For example; sometimes dominance is increasing but the price is not. And that's where the market capitalization comes in.
If the plus sign is not visible , you can get questioning for the movement. It is not a good sign at all.
If the plus sign is visible and RSI is increasing , It is a good sign for the strength of assets movement.
I recommended to use on DAILY timeframe . But you can use different timeframes as well.
Please leave comment below If you have any question or development idea.

Relative Performance Tracker [QuantAlgo]🟢 Overview
The Relative Performance Tracker is a multi-asset comparison tool designed to monitor and rank up to 30 different tickers simultaneously based on their relative price performance. This indicator enables traders and investors to quickly identify market leaders and laggards across their watchlist, facilitating rotation strategies, strength-based trading decisions, and cross-asset momentum analysis.
🟢 Key Features
1. Multi-Asset Monitoring
Track up to 30 tickers across any market (stocks, crypto, forex, commodities, indices)
Individual enable/disable toggles for each ticker to customize your watchlist
Universal compatibility with any TradingView symbol format (EXCHANGE:TICKER)
2. Ranking Tables (Up to 3 Tables)
Each ticker's percentage change over your chosen lookback period, calculated as:
(Current Price - Past Price) / Past Price × 100
Automatic sorting from strongest to weakest performers
Rank: Position from 1-30 (1 = strongest performer)
Ticker: Symbol name with color-coded background (green for gains, red for losses)
% Change: Exact percentage with color intensity matching magnitude
For example, Rank #1 has the highest gain among all enabled tickers, Rank #30 has the lowest (or most negative) return.
3. Histogram Visualization
Adjustable bar count: Display anywhere from 1 to 30 top-ranked tickers (user customizable)
Bar height = magnitude of percentage change.
Bars extend upward for gains, downward for losses. Taller bars = larger moves.
Green bars for positive returns, red for negative returns.
4. Customizable Color Schemes
Classic: Traditional green/red for intuitive interpretation
Aqua: Blue/orange combination for reduced eye strain
Cosmic: Vibrant aqua/purple optimized for dark mode
Custom: Full personalization of positive and negative colors
5. Built-In Ranking Alerts
Six alert conditions detect when rankings change:
Top 1 Changed: New #1 leader emerges
Top 3/5/10/15/20 Changed: Shifts within those tiers
🟢 Practical Applications
→ Momentum Trading: Focus on top-ranked assets (Rank 1-10) that show strongest relative strength for trend-following strategies
→ Market Breadth Analysis: Monitor how many tickers are above vs. below zero on the histogram to gauge overall market health
→ Divergence Spotting: Identify when previously leading assets lose momentum (drop out of top ranks) as potential trend reversal signals
→ Multi-Timeframe Analysis: Use different lookback periods on different charts to align short-term and long-term relative strength
→ Customized Focus: Adjust histogram bars to show only top 5-10 strongest movers for concentrated analysis, or expand to 20-30 for comprehensive overview

Coins Trend Tracker HTThe Coins Trend Tracker HT script provides a powerful tool for monitoring and comparing the trend signals of multiple cryptocurrencies based on their Exponential Moving Averages (EMAs). This script is particularly useful for traders who want to keep track of multiple coins across different timeframes and identify potential trading opportunities based on EMA crossovers.
Features:
Customizable Coin Selection: Users can select up to four different cryptocurrencies to monitor.
Flexible Timeframes: Users can choose two different timeframes for EMA calculations to suit their trading strategies.
Visual Trend Indicators: The script displays trend indicators (🚀 for bullish and 💀 for bearish) based on the EMA crossover status for each coin and timeframe.
Conditional Cell Coloring: Table cells are color-coded based on the EMA crossover conditions, helping users quickly identify bullish or bearish trends.
Opacity Control: Users can adjust the opacity of the table cell colors for better visualization on the chart.
How It Works:
Coin Selection: Users can select up to four different cryptocurrencies to monitor by entering their ticker symbols.
Timeframe Selection: Users can select two different timeframes for the EMA calculations. The script calculates the 5-period and 20-period EMAs for each coin and timeframe.
EMA Crossovers: The script checks for EMA crossovers (EMA 5 crossing above or below EMA 20) and updates the trend indicators and cell colors accordingly.
Table Display: The script displays a table with the selected coins, their current prices, and trend indicators for the chosen timeframes. The background color of the table cells changes based on the EMA crossover status.
Script Logic:
The get_price function retrieves the latest price of the selected coin for the specified timeframe.
The get_ema_cross function calculates the 5-period and 20-period EMAs and checks for crossover conditions.
The fill_row function populates the table with the coin data, trend indicators, and conditionally colored cells.
The table header and data rows are updated based on the user-selected coins, timeframes, and EMA crossover conditions.
Usage:
Add the script to your TradingView chart.
Customize the coin selection, timeframes, text color, default cell color, bullish and bearish cross colors, and cell opacity through the input settings.
The script will display a table with the selected coins, their current prices, and trend indicators based on the EMA crossovers for the chosen timeframes.

USDT Inflow TrackerUSDT INFLOW TRACKER
What does this script do? It looks for important inflow from USDT and write it below or above your chart.
Does it matter? Yes because Tether with planned USDT inflow highly manipulate the crypto market.
With this simple script you can study what and when something strange is going to happen on your favourite token.
HOW IT WORKS?
Pretty simple. It just continuosly check USDT (and USDC) Market Cap and verify if the last candle is way higher than last one. If it was way higher than expected it plot a green square and write a note with the total Inflow of USDT in the crypto market (not specifcially for your token)
Now you can see when an important inflow is done and start to plan your entry and exit strategy in the crypto market.
AUTOSET
With Autoset you can rely on standard values
5min TF : Inflow greater than of 15 mln (in 1 candle)
30min TF : Inflow greater than of 150 mln (in 1 candle)
60min TF : Inflow greater than of 300 mln (in 1 candle)
1Day TF : Inflow greater than of 900 mln (in 1 candle)
So you can check your favourite coin in no time looking for a good trading position
MANUAL SETTINGS
Otherwise you can set directly your Inflow to track based on your needs.
In the example below I've set to check everytime an Inflow of 25mln USDT or greater was done.
As you can see it highly influence the relative token.

ICT Algorithmic Macro Tracker° (Open-Source) by toodegreesDescription:
The ICT Algorithmic Macro Tracker° Indicator is a powerful tool designed to enhance your trading experience by clearly and efficiently plotting the known ICT Macro Times on your chart.
Based on the teachings of the Inner Circle Trader , these Time windows correspond to periods when the Interbank Price Delivery Algorithm undergoes a series of checks ( Macros ) and is probable to move towards Liquidity.
The indicator allows traders to visualize and analyze these crucial moments in NY Time:
- 2:33-3:00
- 4:03-4:30
- 8:50-9:10
- 9:50-10:10
- 10:50-11:10
- 11:50-12:10
- 13:10-13:50
- 15:15-15:45
By providing a clean and clutter-free representation of ICT Macros, this indicator empowers traders to make more informed decisions, optimize and build their strategies based on Time.
Massive shoutout to @reastruth for his ICT Macros Indicator , and for allowing to create one of my own, go check him out!
Indicator Features:
– Track ongoing ICT Macros to aid your Live analysis.
- Gain valuable insights by hovering over the plotted ICT Macros to reveal tooltips with interval information.
– Plot the ICT Macros in one of two ways:
"On Chart": visualize ICT Macro timeframes directly on your chart, with automatic adjustments as Price moves.
Pro Tip: toggle Projections to see exactly where Macros begin and end without difficulty.
"New Pane": move the indicator two a New Pane to see both Live and Upcoming Macro events with ease in a dedicated section
Pro Tip: this section can be collapsed by double-clicking on the main chart, allowing for seamless trading preparation.
This indicator is available only on the TradingView platform.
⚠️ Open Source ⚠️
Coders and TV users are authorized to copy this code base, but a paid distribution is prohibited. A mention to the original author is expected, and appreciated.
⚠️ Terms and Conditions ⚠️
This financial tool is for educational purposes only and not financial advice. Users assume responsibility for decisions made based on the tool's information. Past performance doesn't guarantee future results. By using this tool, users agree to these terms.

Railroad TracksThis script shows engulfing railroad indicators on your chart. These railroad tracks have to cross an EMA (13 by default).
These indicators can be used to predict continuations in a trend.
RR = Normal rail road tracks
BRR = Broken rail road tracks (second track is broken across two bars)
This can be used in all markets.

Cams TrackerCams Tracker is a tool which is used to track the statistical relationship between 2 securities. Can be used alongside other indicators as a confirmation of trend/expected volatility, etc

Normalized Portfolio TrackerThis script lets you create, visualize, and track a custom portfolio of up to 15 assets directly on TradingView.
It calculates a synthetic "portfolio index" by combining multiple tickers with user-defined weights, automatically normalizing them so the total allocation always equals 100%.
All assets are scaled to a common starting point, allowing you to compare your portfolio’s performance versus any benchmark like SPY, QQQ, or BTC.
🚀 Goal
This script helps traders and investors:
• Understand the combined performance of their portfolio.
• Normalize diverse assets into a single synthetic chart .
• Make portfolio-level insights without relying on external spreadsheets.
🎯 Use Cases
• Backtest your portfolio allocations directly on the chart.
• Compare your portfolio vs. benchmarks like SPY, QQQ, BTC.
• Track thematic baskets (commodities, EV supply chain, regional ETFs).
• Visualize how each component contributes to overall performance.
📊 Features
• Weighted Portfolio Performance : Combines selected assets into a synthetic value series.
• Base Price Alignment : Each asset is normalized to its starting price at the chosen date.
• Dynamic Portfolio Table : Displays symbols, normalized weights (%), equivalent shares (based on each asset’s start price, sums to 100 shares), and a total row that always sums to 100%.
• Multi-Asset Support : Works with stocks, ETFs, indices, crypto, or any TradingView-compatible symbol.
⚙️ Configuration
Flexible Portfolio Setup
• Add up to 15 assets with custom weight inputs.
• You can enter any arbitrary numbers (e.g. 30, 15, 55).
• The script automatically normalizes all weights so the total allocation always equals 100%.
Start Date Selection
• Choose any custom start date to normalize all assets.
• The portfolio value is then scaled relative to the main chart symbol, so you can directly compare portfolio performance against benchmarks like SPY or QQQ.
Chart Styles
• Candlestick chart
• Heikin Ashi chart
• Line chart
Custom Display
• Adjustable colors and line widths
• Optionally display asset list, normalized weights, and equivalent shares
⚙️ How It Works
• Fetch OHLC data for each asset.
• Normalizes weights internally so totals = 100%.
• Stores each asset’s base price at the selected start date.
• Calculates equivalent “shares” for each allocation.
• Builds a synthetic portfolio value series by summing weighted contributions.
• Renders as Candlestick, Heikin Ashi, or Line chart.
• Adds a portfolio info table for clarity.
⚠️ Notes
• This script is for visualization only . It does not place trades or auto-rebalance.
• Weight inputs are automatically normalized, so you don’t need to enter exact percentages.

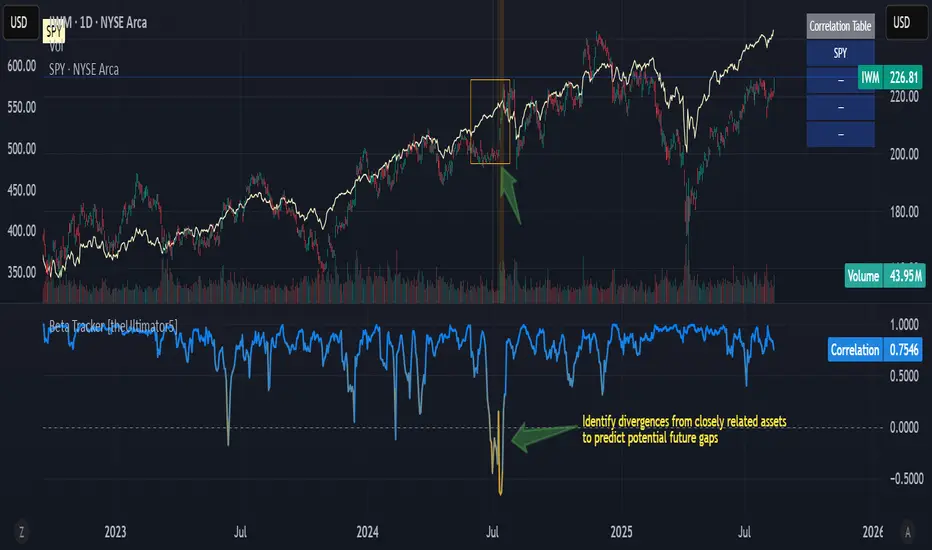
Beta Tracker [theUltimator5]This script calculates the Pearson correlation coefficient between the charted symbol and a dynamic composite of up to four other user-defined tickers. The goal is to track how closely the current asset’s normalized price behavior aligns with, or diverges from, the selected group (or basket)
How can this indicator be valuable?
You can compare the correlation of your current symbol against a basket of other tickers to see if it is moving independently, or being pulled with the basket.... or is it moving against the basket.
It can be used to help identify 'swap' baskets of stocks or other tickers that tend to generally move together and visually show when your current ticker diverges from the basket.
It can be used to track beta (or negative beta) with the market or with a specific ticker.
This is best used as a supplement to other trading signals to give a more complete picture of the external forces potentially pulling or pushing the price action of the ticker.
🛠️ How It Works
The current symbol and each selected comparison ticker are normalized over a custom lookback window, allowing fair pattern-based comparison regardless of price scale.
The normalized values from 1 to 4 selected tickers are averaged into a composite, which represents the group’s collective movement.
A Pearson correlation coefficient is computed over a separate correlation lookback period, measuring the relationship between the current asset and the composite.
The result is plotted as a dynamic line, with color gradients:
Blue = strongly correlated (near +1)
Orange = strongly inverse correlation (near –1)
Intermediate values fade proportionally
A highlighted background appears when the correlation drops below a user-defined threshold (e.g. –0.7), helping identify strong negative beta periods visually.
A toggleable info table displays which tickers are currently being compared, along with customizable screen positioning.
⚙️ User Inputs
Ticker 1–4: Symbols to compare the current asset against (blank = ignored)
Normalization Lookback: Period to normalize each series
Correlation Lookback: Period over which correlation is calculated
Negative Correlation Highlight: Toggle for background alert and threshold level
Comparison Table: Toggle and position controls for an on-screen summary of selected tickers
imgur.com
⚠️ Notes
The script uses request.security() to pull data from external symbols; these must be available for the selected chart timeframe.
A minimum of one valid ticker must be provided for the script to calculate a composite and render correlation.
Borrow Fee & Squeeze TrackerSqueeze tracker.
This script helps identify potential short squeeze setups by detecting two key indicators: unusual volume and significant price changes.
The script combines both volume and price changes to give a more reliable indication of potential squeeze opportunities. When both criteria are met, it signals that there may be unusual market activity. The script also allows you to set up automatic alerts when both the volume and price change exceed thresholds, so you can react quickly to potential opportunities without constantly monitoring the charts.
Once added, you can set an alert:
Click on the Alert button
In the "Condition" dropdown, select the Squeeze Alert that was created.
Set the alert options
Now, when the script detects both a volume spike and a price change spike, it will trigger an alert based on your settings.
Enjoy!

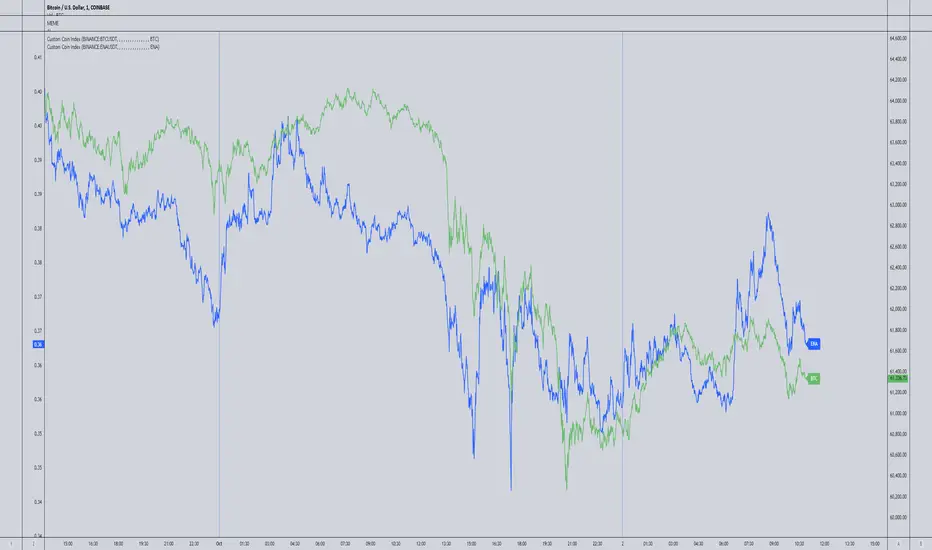
Spaghetti - Custom Cryptocurrency Index IndicatorDescription:
Spaghetti is a highly customizable cryptocurrency index indicator designed to let you track an average price of up to 15 different cryptocurrencies in one convenient line. Whether you're interested in a mix of meme coins, AI projects, or any other specific subset of coins, Spaghetti allows you to create your own personalized index.
Features:
Customizable Coin List: Input up to 15 different cryptocurrencies of your choice, allowing you to tailor the indicator to your preferred assets and strategies.
Dynamic Labeling: Features a label on the chart that displays a user-defined name, so you can personalize the indicator's label to match your theme or trading strategy.
Color Customization: The line color is fully customizable, enabling better visual integration with your charts.
Average Calculation: Calculates and plots the average price of all selected coins, providing an easy way to visualize overall market movement for your customized selection.
How to Use Spaghetti:
In the indicator settings, enter the tickers for up to 15 coins you want to include (e.g., BINANCE:BTCUSDT).
Customize the line color and the label text to match your style or preferences.
The indicator will plot the average price of all selected coins, with a dynamic label that follows the price for easy reference.
Spaghetti makes it easy to create and track custom crypto indices, providing a broader perspective of your selected market segments. Perfect for traders who want to stay on top of multiple assets without the clutter!
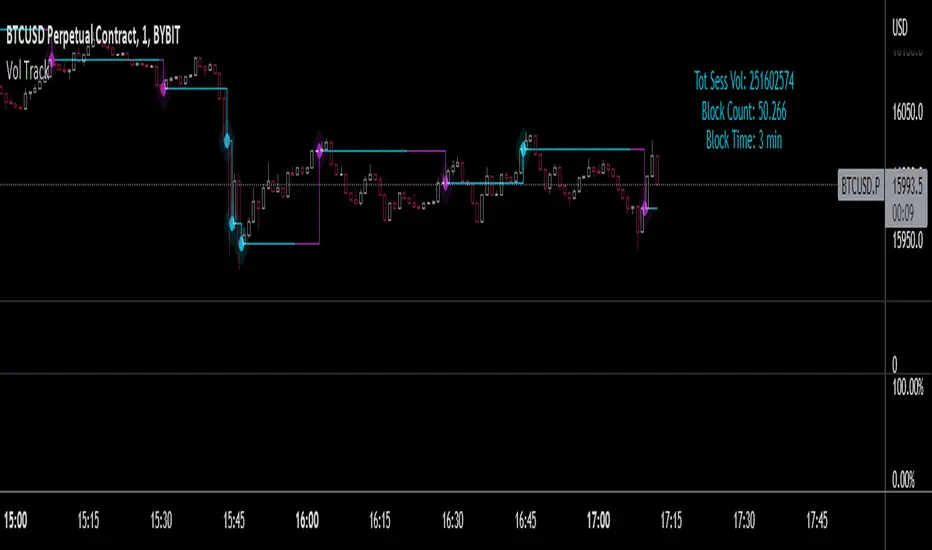
Volume Block Tracker- This script was developed to accompany order flow analysis on other platforms where volume candle charts can be tracked.
- The plot shows where volume blocks of a certain size have been completed, and a color change shows when they are getting close to completion.
- The accumulative volume count starts from zero at the beginning of each daily session.
- Alerts can be set for when each volume block is completed (or is partially completed).
- Alerts can also be set for when blocks are completed within a certain time such as fast 1 minute blocks.
- The indicator is optimized for use with BTCUSD but may work with others.
RaenonX - Manual PnL TrackerChange the "ticker" field in the settings to the ticker to track (for example, "SQQQ") before use.
Manually track the PnL of a single ticker.
The current PnL will be shown at the right bottom of the chart.

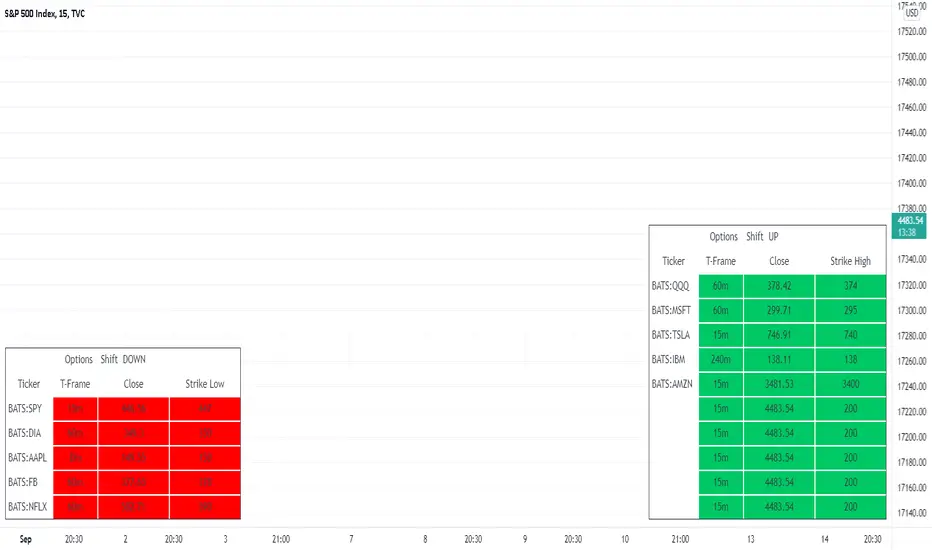
MTF - Options Strike Price - Screener & AlertsHi fellow traders ,
Pleased to share an MTF – Option Strike Price Screener.
It Screens 15 tickers for your set Strike Prices in the input column or you can also set the Stop Loss/target prices for your portfolio watch list in a single input window.
All you need to do is attach to any chart and set the periodicity of the to your desired alert() frequency requirement.
Now go to the input settings icon of the script and set your tickers, timeframe and option strike prices or if you would like to track your individual ticker stop loss or target prices!
Set the alert from the menu as usual click - Any alert() function call and bingo you are done!!
In all of 2-3 minutes you can set your Option Strike Alerts or TP’s or SL’s for 15 stocks of your portfolio..
Only a single alert() will track 15 tickers across multiple time frames..
Once your Alert is hit you may need to change the input settings and save as default and again set an alert() and delete the last alert()..
No more opening multiple charts and setting individual time consuming alerts().
Happy trading with TV..
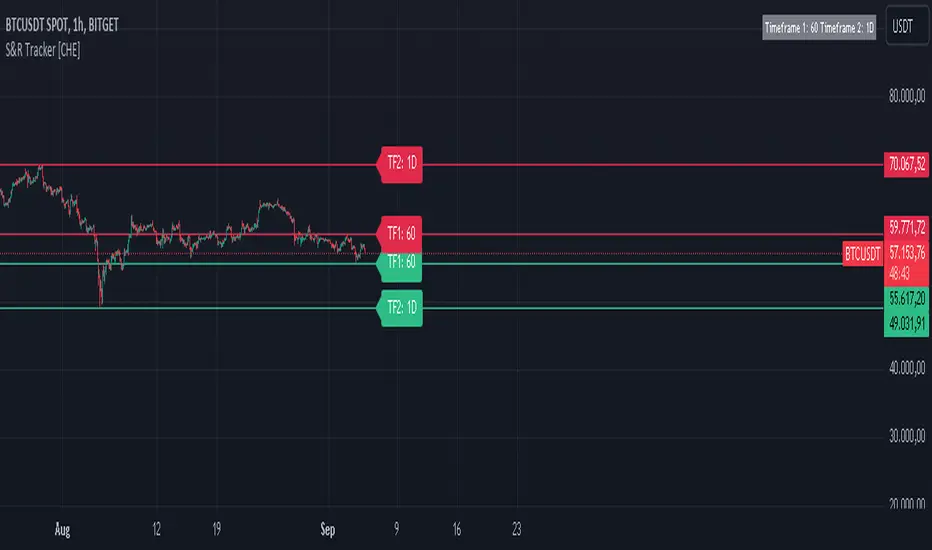
S&R Tracker [CHE]Dynamic S&R Tracker
1. Introduction to the Tool
Purpose:
The Dynamic S&R Tracker is a powerful TradingView tool designed to automatically detect and display support and resistance levels across multiple timeframes. It dynamically adjusts based on the current chart’s timeframe, making it easier for traders to identify key price levels for both shortterm and longterm analysis.
Key Features:
Dynamic adjustment of support and resistance levels based on realtime market conditions
Simultaneous visualization of support and resistance for two different timeframes
Automatic selection of optimal timeframes for accurate and efficient analysis
2. Functionality
Automatic Timeframe Selection:
The Dynamic S&R Tracker uses a smart function to automatically adjust the analysis timeframe based on the market’s current conditions. It selects the appropriate intervals (e.g., 1 hour, 1 day, 1 month) for displaying support and resistance levels, reducing the need for manual intervention.
Support and Resistance Identification:
The tool calculates and identifies key pivot highs and lows, which act as support and resistance levels. These levels are displayed for two timeframes at once, giving a comprehensive view of the market's shortterm and longterm trends.
3. Benefits
Efficiency:
With automatic adjustments, traders save time by not having to manually change timeframes or recalculate levels.
Enhanced Market Insight:
By analyzing two timeframes simultaneously, the tool provides a broader market perspective, helping traders spot potential reversal points and breakouts.
Customizability:
Though dynamic, the Dynamic S&R Tracker offers flexibility for manual adjustments, allowing traders to finetune the analysis based on personal preferences or market strategies.
4. Visualization
Support and Resistance Levels:
The tool uses clear visual markers—green for support and red for resistance—making it easy to spot critical price zones on the chart.
Informative Timeframe Display:
The tracker includes a customizable information box that shows the selected timeframes used in the analysis, keeping the user informed at all times.
5. Conclusion
The Dynamic S&R Tracker is an essential tool for traders seeking an automated, precise, and flexible way to analyze support and resistance across multiple timeframes. By offering dynamic adjustments and clear visual feedback, it simplifies the decisionmaking process and provides deeper market insights.
Ideal for traders who need a streamlined and adaptable solution to better navigate market trends.
100+ BTC Tracker + 182-Day Dormant (6-Month HODL)Instantly see what the biggest Bitcoin whales are doing — and exactly how much of the supply has been completely untouched for 6 full months or longer (182+ days), the strictest and most respected definition of true HODLing.
What this indicator shows you in real time:
Number of wallets holding ≥100 BTC (~15,800 whales)
Total Bitcoin controlled by these whales (~3.25 million BTC)
6-Month Dormant Supply — Bitcoin that hasn’t moved in 182+ days (~14.1 million BTC)
6-Month Dormant % — What percentage of circulating supply is truly locked away
Why 182 days matters:
The 6-month threshold (≈182 days) is the industry-standard cutoff used by Glassnode, CryptoQuant, and analysts worldwide to define ultra-long-term holders. These are the coins least likely to ever hit exchanges — the ultimate measure of conviction and scarcity.
Key features:Live or fallback? — Instantly know if you’re seeing real-time on-chain data (green) or verified backup values (yellow)
Works on free accounts — No paid data subscription required (though it becomes even more accurate with Glassnode/CryptoQuant add-ons)
Clean, non-intrusive design — Three bold plots + sleek dark table in the top-right corner
Always up to date — Fallback values manually verified as of November 21, 2025
Perfect for:
Spotting whale accumulation/distribution phases
Tracking real Bitcoin scarcity during bull or bear markets
Confirming long-term holder conviction before big moves
Add it to any BTC chart and instantly understand who really controls Bitcoin — and how much of it is locked away forever by the strongest hands in crypto.

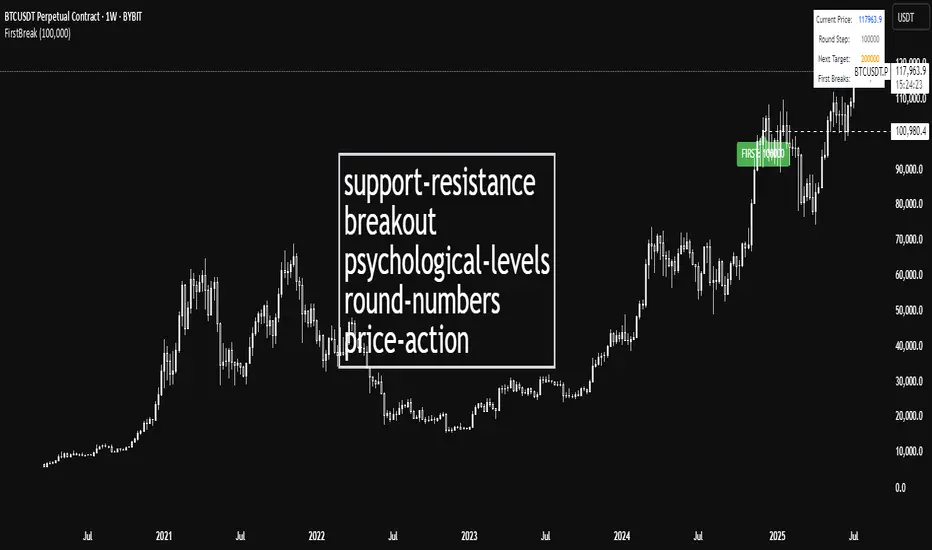
First Round Break TrackerA simple indicator that tracks the first-time breakouts of round number levels (psychological levels) on any chart. Clean interface with minimal configuration needed
First Breakout Only : Marks each round level only once when broken for the first time
Customizable Step Size : Adjustable round number intervals (e.g., 100, 1000, 10000 etc.)
Clean Visual Alerts : Green labels with "FIRST:" prefix appear exactly at breakout moments
Real-time Info Panel : Shows current price, next target level, and total breakouts count