🇰🇷 Kim'in Kim'out — Korean Premium TrackerKim’in Kim’out is a premium-tracking TradingView indicator that reveals Korean market sentiment by comparing real-time asset prices on Upbit (KRW) and Binance (USDT).
It detects when Korean traders are spot accumulating (Kim’in) or spot distributing (Kim’out) — enhanced by volume confirmation and trend context.
Perfect for crypto scalpers, swing traders, and arbitrage hunters.
⚙️ How It Works
Kimchi Premium: Measures how much more (or less) Koreans are paying on Upbit compared to Binance.
Volume Confirmation: Filters signals by comparing Upbit volume vs its moving average.
Signal Logic:
🔼 Kim’in: Premium exceeds the buy threshold + high volume
🔽 Kim’out: Premium drops below the sell threshold + high volume
Trend Context: Premium trend line gives insight into sustained interest/disinterest.
🎛️ Settings Overview
Input Description
Select Cryptocurrency Choose from supported coins (BTC, ETH, SOL, etc.)
Buy Threshold (%) How high the premium must be to trigger a Kim’in signal
Sell Threshold (%) How low the premium must be to trigger a Kim’out signal
Volume MA Period The number of candles for volume average
Volume Multiplier Volume spike ratio needed to confirm a signal
Show Info Table Toggle detailed premium stats in a side panel
Show Premium Zones Visual background zones (green/red/yellow)
Debug Mode Shows extra signals that trigger without volume confirmation
✅ How to Use It
Add the indicator to any chart (e.g. BTC/USDT)
Choose a coin from the dropdown (BTC, ETH, etc.)
Watch for:
Green Triangle Up (Kim’in) = Korean spot buy pressure confirmed
Red Triangle Down (Kim’out) = Korean selloff or disinterest
Use the Info Table (top-right) to see:
Premium %
Volume confirmation
Real-time KRW-USD exchange rate
Upbit vs Binance price comparison
Set Alerts:
Right-click on a signal → Add Alert on "Kim’in" or "Kim’out"
Or use the prebuilt alertconditions
🔔 Alert Messages
🇰🇷 Korean Premium BUY signal detected → Kim’in
🇰🇷 Korean Premium SELL signal detected → Kim’out
🧪 Best Practices
Use on 1H or 4H timeframe for best results
Confirm with broader market structure or confluence tools
Spot divergences between Binance and Upbit to predict regional flow shifts
🚫 Limitations
Works only with coins that have both Binance USDT & Upbit KRW pairs
Premium may be delayed by low liquidity or FX rate fluctuations (USDKRW)
Not suitable for lowcaps not listed on Upbit
Created by UKMC Crypto
Cari dalam skrip untuk "track"

MACD Liquidity Tracker Strategy [Quant Trading]MACD Liquidity Tracker Strategy
Overview
The MACD Liquidity Tracker Strategy is an enhanced trading system that transforms the traditional MACD indicator into a comprehensive momentum-based strategy with advanced visual signals and risk management. This strategy builds upon the original MACD Liquidity Tracker System indicator by TheNeWSystemLqtyTrckr , converting it into a fully automated trading strategy with improved parameters and additional features.
What Makes This Strategy Original
This strategy significantly enhances the basic MACD approach by introducing:
Four distinct system types for different market conditions and trading styles
Advanced color-coded histogram visualization with four dynamic colors showing momentum strength and direction
Integrated trend filtering using 9 different moving average types
Comprehensive risk management with customizable stop-loss and take-profit levels
Multiple alert systems for entry signals, exits, and trend conditions
Flexible signal display options with customizable entry markers
How It Works
Core MACD Calculation
The strategy uses a fully customizable MACD configuration with traditional default parameters:
Fast MA : 12 periods (customizable, minimum 1, no maximum limit)
Slow MA : 26 periods (customizable, minimum 1, no maximum limit)
Signal Line : 9 periods (customizable, now properly implemented and used)
Cryptocurrency Optimization : The strategy's flexible parameter system allows for significant optimization across different crypto assets. Traditional MACD settings (12/26/9) often generate excessive noise and false signals in volatile crypto markets. By using slower, more smoothed parameters, traders can capture meaningful momentum shifts while filtering out market noise.
Example - DOGE Optimization (45/80/290 settings) :
• Performance : Optimized parameters yielding exceptional backtesting results with 29,800% PnL
• Why it works : DOGE's high volatility and social sentiment-driven price action benefits from heavily smoothed indicators
• Timeframes : Particularly effective on 30-minute and 4-hour charts for swing trading
• Logic : The very slow parameters filter out noise and capture only the most significant trend changes
Other Optimizable Cryptocurrencies : This parameter flexibility makes the strategy highly effective for major altcoins including SUI, SEI, LINK, Solana (SOL) , and many others. Each crypto asset can benefit from custom parameter tuning based on its unique volatility profile and trading characteristics.
Four Trading System Types
1. Normal System (Default)
Long signals : When MACD line is above the signal line
Short signals : When MACD line is below the signal line
Best for : Swing trading and capturing longer-term trends in stable markets
Logic : Traditional MACD crossover approach using the signal line
2. Fast System
Long signals : Bright Blue OR Dark Magenta (transparent) histogram colors
Short signals : Dark Blue (transparent) OR Bright Magenta histogram colors
Best for : Scalping and high-volatility markets (crypto, forex)
Logic : Leverages early momentum shifts based on histogram color changes
3. Safe System
Long signals : Only Bright Blue histogram color (strongest bullish momentum)
Short signals : All other colors (Dark Blue, Bright Magenta, Dark Magenta)
Best for : Risk-averse traders and choppy markets
Logic : Prioritizes only the strongest bullish signals while treating everything else as bearish
4. Crossover System
Long signals : MACD line crosses above signal line
Short signals : MACD line crosses below signal line
Best for : Precise timing entries with traditional MACD methodology
Logic : Pure crossover signals for more precise entry timing
Color-Coded Histogram Logic
The strategy uses four distinct colors to visualize momentum:
🔹 Bright Blue : MACD > 0 and rising (strong bullish momentum)
🔹 Dark Blue (Transparent) : MACD > 0 but falling (weakening bullish momentum)
🔹 Bright Magenta : MACD < 0 and falling (strong bearish momentum)
🔹 Dark Magenta (Transparent) : MACD < 0 but rising (weakening bearish momentum)
Trend Filter Integration
The strategy includes an advanced trend filter using 9 different moving average types:
SMA (Simple Moving Average)
EMA (Exponential Moving Average) - Default
WMA (Weighted Moving Average)
HMA (Hull Moving Average)
RMA (Running Moving Average)
LSMA (Least Squares Moving Average)
DEMA (Double Exponential Moving Average)
TEMA (Triple Exponential Moving Average)
VIDYA (Variable Index Dynamic Average)
Default Settings : 50-period EMA for trend identification
Visual Signal System
Entry Markers : Blue triangles (▲) below candles for long entries, Magenta triangles (▼) above candles for short entries
Candle Coloring : Price candles change color based on active signals (Blue = Long, Magenta = Short)
Signal Text : Optional "Long" or "Short" text inside entry triangles (toggleable)
Trend MA : Gray line plotted on main chart for trend reference
Parameter Optimization Examples
DOGE Trading Success (Optimized Parameters) :
Using 45/80/290 MACD settings with 50-period EMA trend filter has shown exceptional results on DOGE:
Performance : Backtesting results showing 29,800% PnL demonstrate the power of proper parameter optimization
Reasoning : DOGE's meme-driven volatility and social sentiment spikes create significant noise with traditional MACD settings
Solution : Very slow parameters (45/80/290) filter out social media-driven price spikes while capturing only major momentum shifts
Optimal Timeframes : 30-minute and 4-hour charts for swing trading opportunities
Result : Exceptionally clean signals with minimal false entries during DOGE's characteristic pump-and-dump cycles
Multi-Crypto Adaptability :
The same optimization principles apply to other major cryptocurrencies:
SUI : Benefits from smoothed parameters due to newer coin volatility patterns
SEI : Requires adjustment for its unique DeFi-related price movements
LINK : Oracle news events create price spikes that benefit from noise filtering
Solana (SOL) : Network congestion events and ecosystem developments need smoothed detection
General Rule : Higher volatility coins typically benefit from very slow MACD parameters (40-50 / 70-90 / 250-300 ranges)
Key Input Parameters
System Type : Choose between Fast, Normal, Safe, or Crossover (Default: Normal)
MACD Fast MA : 12 periods default (no maximum limit, consider 40-50 for crypto optimization)
MACD Slow MA : 26 periods default (no maximum limit, consider 70-90 for crypto optimization)
MACD Signal MA : 9 periods default (now properly utilized, consider 250-300 for crypto optimization)
Trend MA Type : EMA default (9 options available)
Trend MA Length : 50 periods default (no maximum limit)
Signal Display : Both, Long Only, Short Only, or None
Show Signal Text : True/False toggle for entry marker text
Trading Applications
Recommended Use Cases
Momentum Trading : Capitalize on strong directional moves using the color-coded system
Trend Following : Combine MACD signals with trend MA filter for higher probability trades
Scalping : Use "Fast" system type for quick entries in volatile markets
Swing Trading : Use "Normal" or "Safe" system types for longer-term positions
Cryptocurrency Trading : Optimize parameters for individual crypto assets (e.g., 45/80/290 for DOGE, custom settings for SUI, SEI, LINK, SOL)
Market Suitability
Volatile Markets : Forex, crypto, indices (recommend "Fast" system or smoothed parameters)
Stable Markets : Stocks, ETFs (recommend "Normal" or "Safe" system)
All Timeframes : Effective from 1-minute charts to daily charts
Crypto Optimization : Each major cryptocurrency (DOGE, SUI, SEI, LINK, SOL, etc.) can benefit from custom parameter tuning. Consider slower MACD parameters for noise reduction in volatile crypto markets
Alert System
The strategy provides comprehensive alerts for:
Entry Signals : Long and short entry triangle appearances
Exit Signals : Position exit notifications
Color Changes : Individual histogram color alerts
Trend Conditions : Price above/below trend MA alerts
Strategy Parameters
Default Settings
Initial Capital : $1,000
Position Size : 100% of equity
Commission : 0.1%
Slippage : 3 points
Date Range : January 1, 2018 to December 31, 2069
Risk Management (Optional)
Stop Loss : Disabled by default (customizable percentage-based)
Take Profit : Disabled by default (customizable percentage-based)
Short Trades : Disabled by default (can be enabled)
Important Notes and Limitations
Backtesting Considerations
Uses realistic commission (0.1%) and slippage (3 points)
Default position sizing uses 100% equity - adjust based on risk tolerance
Stop-loss and take-profit are disabled by default to show raw strategy performance
Strategy does not use lookahead bias or future data
Risk Warnings
Past performance does not guarantee future results
MACD-based strategies may produce false signals in ranging markets
Consider combining with additional confluences like support/resistance levels
Test thoroughly on demo accounts before live trading
Adjust position sizing based on your risk management requirements
Technical Limitations
Strategy does not work on non-standard chart types (Heikin Ashi, Renko, etc.)
Signals are based on close prices and may not reflect intraday price action
Multiple rapid signals in volatile conditions may result in overtrading
Credits and Attribution
This strategy is based on the original "MACD Liquidity Tracker System" indicator created by TheNeWSystemLqtyTrckr . This strategy version includes significant enhancements:
Complete strategy implementation with entry/exit logic
Addition of the "Crossover" system type
Proper implementation and utilization of the MACD signal line
Enhanced risk management features
Improved parameter flexibility with no artificial maximum limits
Additional alert systems for comprehensive trade management
The original indicator's core color logic and visual system have been preserved while expanding functionality for automated trading applications.

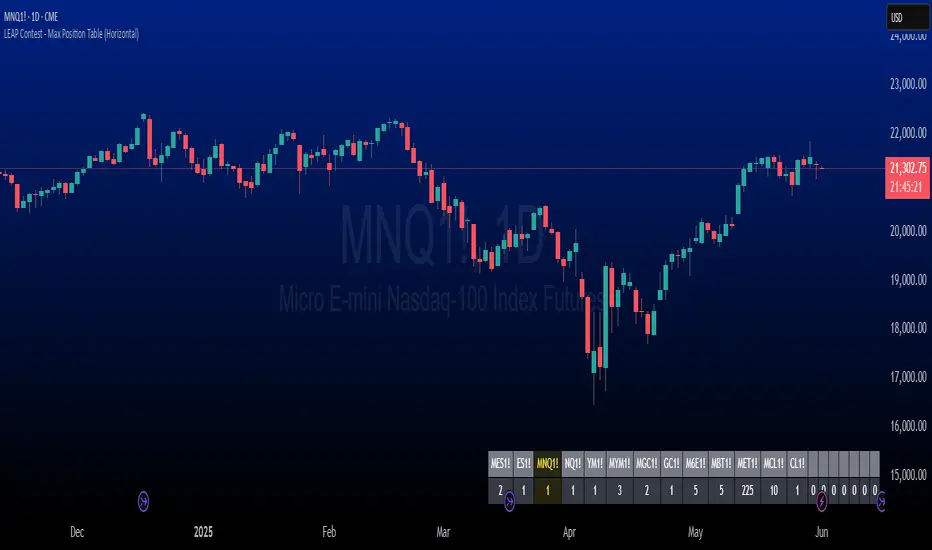
The LEAP Contest - Symbol & Max Position Table TrackerDescription:
This indicator tracks the maximum contracts allowed to be traded for TradingView’s *"The Leap"* Contest. It displays a horizontal table at the bottom right of your chart showing up to 20 symbols along with their maximum allowable open contract positions.
Use case:
Designed specifically for traders participating in *The Leap* Contest on TradingView.
Users need to enter the symbol and the maximum contracts allowed for that symbol in the settings menu for each new contest.
It provides a quick reference to ensure compliance with contest rules on maximum position sizes.
How it works:
The table shows two rows: the top row displays the symbol name, and the bottom row shows the max contract limit.
If the currently loaded chart symbol matches any symbol in the list, its text color changes to yellow .
Customization:
Symbols and limits must be updated in the indicator’s settings before each contest to reflect the current rules.
Intraday vs Overnight Change TrackerThis indicator tracks a synthetic price path based on either intraday or overnight return behavior, allowing users to analyze which component of daily price movement is contributing more to long-term performance.
***THIS INDICATOR ONLY WORKS ON THE DAILY TIMEFRAME***
Intraday mode compounds price change from market open to close: close / open
Overnight mode compounds price change from previous close to current open: open / close
The user can select one of these two modes using a dropdown input. The synthetic price series starts from the second bar of the chart and compounds forward bar-by-bar using the selected return type. The result is a line that reflects cumulative return based solely on either intraday or overnight activity.
⚙️ Inputs
Synthetic Price Type: Select between "Intraday" or "Overnight" to visualize the respective compounded price series.
📈 Usage Notes
This indicator is intended for visual comparison of intraday vs. overnight price dynamics over time. It can be useful for identifying behavioral patterns, session-based return anomalies, or testing session bias strategies.
Only one synthetic line is shown at a time based on user selection.
If you want to view both intraday and overnight lines, then you can add the indicator twice, which is shown above.

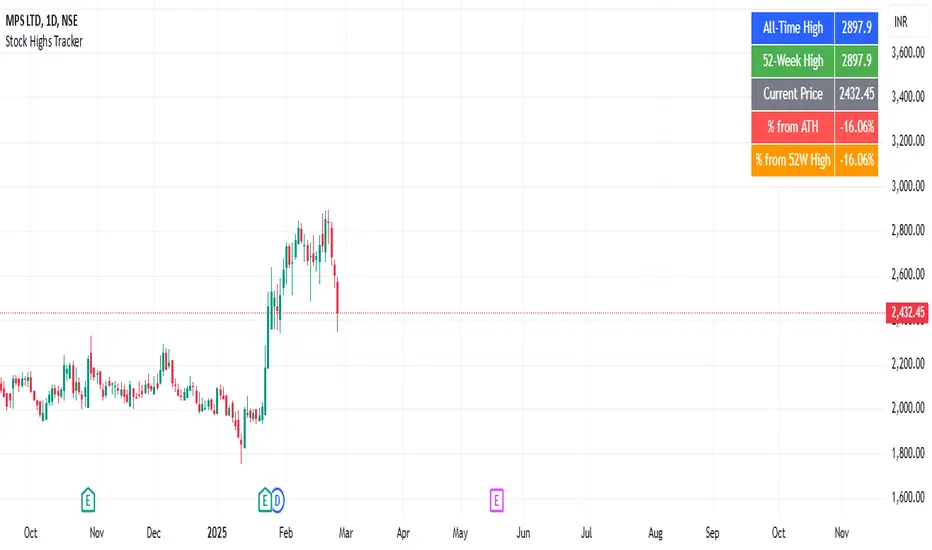
Stock Highs TrackerThis indicator tracks key stock price levels including the all-time high (ATH), 52-week high, and current price.
It calculates the percentage difference of the current price from both the ATH and 52-week high.
The data is displayed in a table at the top-right corner of the chart, allowing traders to quickly assess the stock’s performance relative to its historical highs.
This is useful for identifying stocks trading near their highs or experiencing significant pullbacks.
Position Tracker 1.0Position Tracker 1.0 allows users to input their position using USD, quantity, or a DCA approach while setting take profit (TP) and stop loss (SL) levels based on either fixed dollar values or percentages. The indicator provides optional markers for TP/SL crossings and an entry label showing key trade details. A live tracker can be enabled for real-time P&L updates, and all visual elements are customizable for clarity and preference.
Instructions for Position Tracker 1.0
1. Input Method & Position Details:
* Choose between USD, Quantity, or DCA.
* Enter your entry price, entry time, investment amount, or quantity as needed.
2. TP & SL Setup:
* For each TP (up to 5) and the SL, select whether to use a fixed dollar target or a percentage
target relative to your entry price.
* Enter the corresponding price (if using Dollar) or percentage (if using Percentage).
* For TPs, specify the percentage of your position to sell when the level is hit.
3. Marker & Display Options:
* Toggle the TP and SL crossing markers on or off.
* Adjust which details (Price, Diff, Sell for TP; Price, Diff, Loss for SL) are shown on the labels.
* The entry label always shows the Avg. Cost and can optionally include the quantity, invested
amount, and live tracker (real-time P&L).
4. Visual Customization:
* Change text size, marker size, and colors for profit, loss, TP, and SL lines as desired.

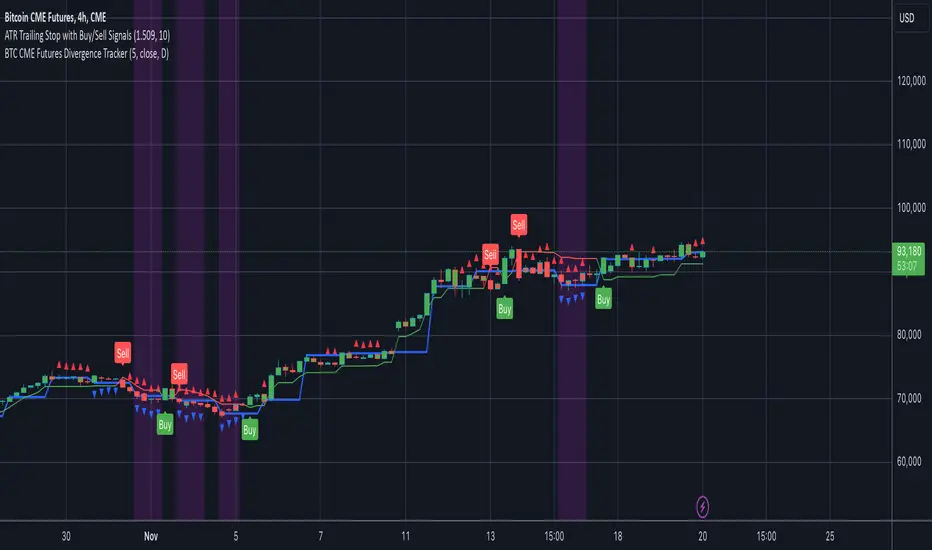
BTC CME Futures Divergence TrackerThis script tracks divergences between price action and open interest for the BTC CME Futures contract (symbol "BTC1!") using the following components:
Key Features:
1. Price Analysis: Identifies lower highs in the price over a specified lookback period. Marks these points with red upward-facing triangles above the bars.
2. Open Interest Analysis: Retrieves open interest (OI) data for the BTC CME Futures contract via request.security. Detects lower highs in open interest over the same lookback period. Highlights these points with blue downward-facing triangles below the bars.
3. Divergence Detection: A divergence is identified when both price and open interest form lower highs simultaneously. Highlights such occurrences with a purple background, indicating potential bearish sentiment or weakening momentum.
4. Alerts: If divergences are detected, an alert is triggered (if enabled), notifying the trader to take action.
5. Visualization: Open interest is plotted as a blue line in a separate pane for added context. Red and blue markers highlight significant points in price and open interest trends.
Use Cases:
- Spot Weakening Trends: Divergences between price and open interest may indicate a loss of momentum or bearish sentiment, allowing traders to preemptively adjust their strategies.
- Monitor Institutional Activity: Open interest changes reflect shifts in market participation, especially in derivative markets like CME Futures.
- Set Alerts for Key Signals: With automated alerts, traders can stay informed of potential divergence signals without constant monitoring.
Customization Options:
- Lookback Period: Adjust the number of bars used to detect lower highs.
- Timeframe: Choose the timeframe for fetching open interest data (e.g., daily, hourly).
- Alert Activation: Enable or disable alerts for divergences.
This tool combines price action with open interest dynamics to provide a robust method for identifying market trends and potential reversals in BTC CME Futures.
MM Sector Intraday TrackerWhat this script does:
This script tracks the percent that price has moved from the opening print of each of the 9 sector ETFs. It color codes the values so you can see which sectors are down (red color) and which sectors are up (green color). If a sector is only up or down half of one ATR, it the color will be light, but if it is beyond half of one ATR, it is a darker color.
How this script works:
It simply measures the distance that price has moved from the opening print today, and presents that information in an easy to read table on your chart.
How to use this script:
If all sectors are moving in one direction, it indicates that the entire market is in a trend day in that direction. You can use this information to decide which direction you should be trading (ie. with trend). For example, in order for there to be healthy bullish moves in the market, you would want this indicator to show you that all sectors are green, or at least that some sectors are green, which would indicate that there is healthy rotation of capital across the market sectors.
What makes this script original:
Most indicators and even the TradingView watchlist measure the percent changed on the day from the closing price of a stock on the prior trading day, essentially telling you what sentiment is since yesterday. This script tells you the sentiment today since it is priced from the opening print.

Short Interest Tracker [SS]This is a simple indicator that is designed to provide you with a synopsis of short interest on the daily, weekly and monthly timeframes.
How it works:
It pulls FINRA ticker data on short volume for whichever ticker you are on. It works with all tickers provided they are listed on FINRA (which is all tickers).
It will not work with futures, for futures, you would want to use a COT-based indicator, but for indices and equities, this indicator will provide you with the short volume information.
What it shows:
It breaks short volume down into current short volume, the 14-period SMA of short volume over the day, week and month, it also provides you with a short volume to SMA ratio. This is Short Volume divided by the SMA. Anything below 1 is good, it means short interest is low. Anything above 1 is not good, it means that short volume is above the SMA.
It also will show you the weekly, daily and monthly short volume change.
And last but not least, it will tell you whether short interest is falling, rising or steady. How it does this is by tracking whether the SMA is increasing, decreasing or stagnant.
Customization:
You can customize the SMA length and the assessment of whether short volume is increasing or decreasing. The default SMA length is 14 and the default assessment of rising/falling short volume is 4. This means, short volume has to rise or fall over a 4-period timeframe for it to register. So on the week, if it displays short volume increasing, it means that, over the past 4 weeks, the sma has steadily risen. Inverse if it decreases. If you want it to be more sensitive, you can reduce it to 2 or 3. If you want it to be more strict, you can increase it to 5 or 6.
NOTE:
If the volume information for a ticker is not available, it will return a runtime error indicating as such.
And that's the indicator!
I wanted something similar to COT data for equities and indices, so this was my attempt to bridge that gap.
Hope you enjoy and find it useful! Leave your suggestions below.
Take care everyone!

FlexiMA Variance Tracker - Strategy [presentTrading]█ Introduction and How It Is Different
The FlexiMA Variance Tracker by PresentTrading introduces a novel approach to technical trading strategies. Unlike traditional methods, it calculates deviations between a chosen indicator source (such as price or average) and a moving average with a variable length. This flexibility is achieved through a unique combination of a starting factor and an increment factor, allowing the moving average to adapt dynamically within a specified range. This strategy provides a more responsive and nuanced view of market trends, setting it apart from standard trading methodologies.
BTC 8h L/S
Local
█ Strategy, How It Works: Detailed Explanation
The FlexiMA Variance Tracker, developed by PresentTrading, stands at the forefront of trading strategies, distinguished by its adaptive and multifaceted approach to market analysis. This strategy intricately weaves various technical elements to construct a comprehensive trading logic. Here's an in-depth professional breakdown:
🔶Foundation on Variable-Length Moving Averages:
Central to this strategy is the concept of variable-length Moving Averages (MAs). Unlike traditional MAs with a fixed period, this strategy dynamically adjusts the length of the MA based on a starting factor and an incremental factor. This approach allows the strategy to adapt to market volatility and trend strength more effectively.
Each MA iteration offers a distinct temporal perspective, capturing short-term price movements to long-term trends. This aggregation of various time frames provides a richer and more nuanced market analysis, essential for making informed trading decisions.
🔶Deviation Analysis and Normalization:
The strategy calculates deviations of the price (or the chosen indicator source) from each of these MAs. These deviations are pivotal in identifying the immediate market direction relative to the average trend captured by each MA.
To standardize these deviations for comparability, they undergo a normalization process. The choice of normalization method (Max-Min or Absolute Sum) can significantly influence the interpretation of market conditions, offering distinct insights into price movements and trend strength.
🔹Normalization: Absolute Sum
🔶Composite Oscillator Construction:
A composite oscillator is derived from the median of these normalized deviations. The median serves as a balanced and robust central trend indicator, minimizing the impact of outliers and market noise.
Additionally, the standard deviation of these deviations is computed, providing a measure of market volatility. This volatility indicator is crucial for assessing market risk and can guide traders in setting appropriate stop-loss and take-profit levels.
🔶Integration with SuperTrend Indicator:
The FlexiMA strategy integrates the SuperTrend indicator, renowned for its effectiveness in identifying trend direction and reversals. The SuperTrend's incorporation enhances the strategy's ability to filter out false signals and confirm genuine market trends.
* The SuperTrend Toolkit is made by @QuantiLuxe
This combination of the variable-length MA oscillator with the SuperTrend indicator forms a potent duo, offering traders a dual-confirmation mechanism for trade signals.
🔹Supertrend's incorporation
🔶Strategic Trade Signal Generation:
Trade signals are generated when there is a confluence between the composite oscillator and the SuperTrend indicator. For example, a long position signal might be considered when the oscillator suggests an uptrend, and the SuperTrend flips to bullish.
The strategy's parameters are fully customizable, enabling traders to tailor the signal generation process to their specific trading style, risk tolerance, and market conditions.
█ Usage
To effectively employ the FlexiMA Variance Tracker strategy:
Traders should set their desired trade direction and fine-tune the starting and increment factors according to their market analysis and risk tolerance.
Indicator Length: 5
Indicator Length: 40
The strategy is suitable for a wide range of markets and can be adapted to different time frames, making it a versatile tool for various trading scenarios.
█ Default Settings Impact on Performance: FlexiMA Variance Tracker
1. Trade Direction (Configurable: Long, Short, Both): Determines trade types. 'Long' for buying, 'Short' for selling, 'Both' adapts to market trends.
2. Indicator Source: HLC3: Balances market sentiment by considering high, low, and close, providing comprehensive period analysis.
4. Indicator Length (Default: 10): Baseline for moving averages. Shorter lengths increase responsiveness but add noise, while longer lengths favor trends.
5. Starting and Increment Factor (Default: 1.0): Adjusts MA lengths range. Higher values capture broad market dynamics, lower values focus analysis.
6. Normalization Method (Options: None, Max-Min, Absolute Sum): Standardizes deviations. 'None' for raw deviations, 'Max-Min' for relative scaling, 'Absolute Sum' emphasizes relative strength.
7. SuperTrend Settings (ATR Length: 10, Multiplier: 15.0): Influences indicator sensitivity. Short ATR or high multiplier for short-term, long ATR or low multiplier for long-term trends.
8. Additional Settings (Mesh Style, Color Customization): Enhances visual clarity. Mesh style for detailed deviation view, colors for quick market condition identification.

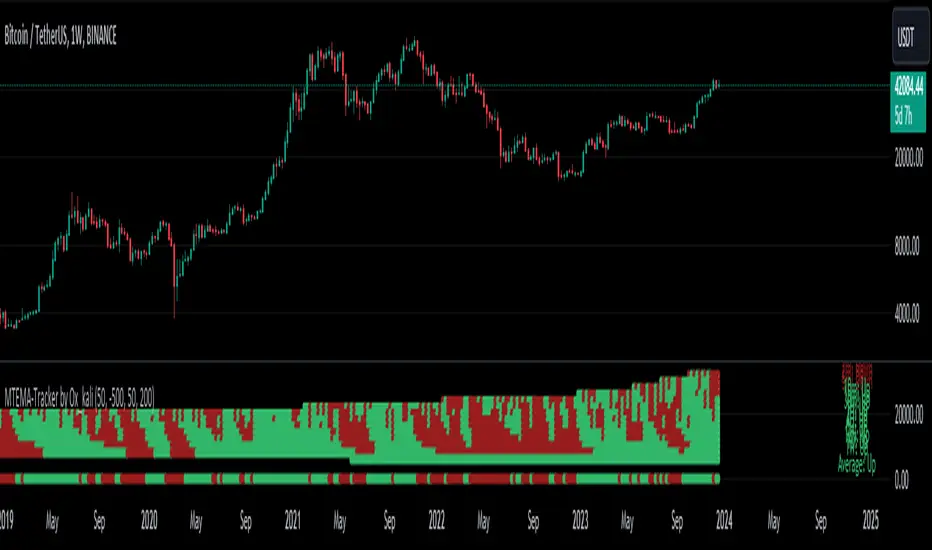
Multi-Timeframe EMA Tracker by Ox_kaliThis script is an advanced trend analysis indicator crafted for traders who seek a detailed and customizable view of market trends across multiple timeframes. This tool utilizes exponential moving averages (EMAs) to offer insights into market direction and momentum.
Key Features:
Multi-Timeframe Analysis: MTEMA-Tracker covers a wide range of timeframes, including 1, 2, 3, 5, 10, 15, 30 minutes; 1, 2, 4, 6, 12 hours; 1 day; and 1 week. This allows traders to analyze market trends from various perspectives, from short-term fluctuations to longer-term movements.
EMA-Based Trend Determination: The indicator employs two EMAs (50 and 200 periods) for each timeframe to ascertain the market trend. A higher EMA50 compared to EMA200 indicates an uptrend, while the opposite scenario suggests a downtrend.
User-Defined Trend Colors: Traders can personalize the appearance of the trend lines with custom colors for upward and downward trends, enhancing visual clarity and quick interpretation.
Selectable Timeframe Display: MTEMA-Tracker by Ox_kali offers the flexibility to choose which timeframes to display, enabling traders to focus on the most relevant data for their trading strategy.
Average Trend Calculation: A unique feature of MTEMA-Tracker is its ability to compute the average trend across all selected timeframes, providing a holistic view of the market's general direction.
List of Parameters:
Color of the trend: Customizable color settings for both upward and downward trends.
Settings for the Lengths of the EMAs: Options to set the lengths of the short and long-term EMAs.
Display Options for Each Timeframe's EMA Trend: Ability to activate or deactivate the display of EMAs for each selected timeframe.
Indicators and Financial Name Label settings: To ensure maximum clarity and understanding of the displayed trends, users should not hesitate to use the function to display "indicators and financial name labels" in their settings. This feature will help in identifying the legends for each trend, making it easier to interpret the market direction for the selected timeframes.
Please note that the MTEMA-Tracker is not a guarantee of future market performance and should be used in conjunction with proper risk management. Always ensure that you have a thorough understanding of the indicator’s methodology and its limitations before making any investment decisions. Additionally, past performance is not indicative of future results.
Bull Bear Correlation Tracker PaneThe Bull Bear Correlation Tracker is a versatile indicator designed to help traders identify the direction and strength of market trends by comparing the price action of multiple assets. It is particularly useful for those who are familiar with the carry trade principle, as it can detect when positively or negatively correlated assets move in favor or against the asset being traded. This indicator can be used for various markets, including crypto and forex, by simply adjusting the default options.
Key features of the Bull Bear Correlation Tracker include:
Multiple methods for determining trend direction: Supertrend, Pivot Point SuperTrend by LonesomeTheBlue, MACD - Zero Cross, and MACD - Grow/Shrink. These methods help traders identify the primary trend direction and potential trade opportunities.
Optional slow trend display for additional insights into market trends, allowing traders to analyze both short-term and long-term trends simultaneously.
Supports up to three symbols, enabling traders to analyze multiple assets simultaneously and better understand their correlation.
Assumed correlation settings to test traders' hypotheses about asset relationships, allowing traders to make informed decisions about potential correlations between different assets.
Customizable correlation period and smoothing settings to fine-tune the indicator's performance, providing traders with the ability to optimize the indicator based on their preferred trading style and market conditions.
Market hours filter to focus on specific trading hours, ensuring that the indicator only displays data during the hours specified.
Customizable color settings for easy visualization of trends, helping traders quickly identify the direction and strength of market trends.
Correlation histogram display to visualize asset relationships, providing traders with a clear visual representation of how different assets are correlated.
This indicator can be used to either force the correlation to be assumed positive or negative if the trader knows the correlation, or to use the actual data calculated between the traded asset and other assets if the correlation is broken often. This flexibility makes the Bull Bear Correlation Tracker suitable for trading various assets, including cryptocurrencies and forex, as well as for traders with different levels of experience.
By utilizing the Bull Bear Correlation Tracker, traders can gain valuable insights into market trends and correlations between different assets, helping them make more informed decisions and improve their trading strategies.
Note: I used back-testing for fine tuning do not base your trades on signals from the testing framework.

EMA Price Distance TrackerThis simple indicator tracks the distance that the price is from a moving average. This can be helpful when looking for reversals based on historical informaiton.


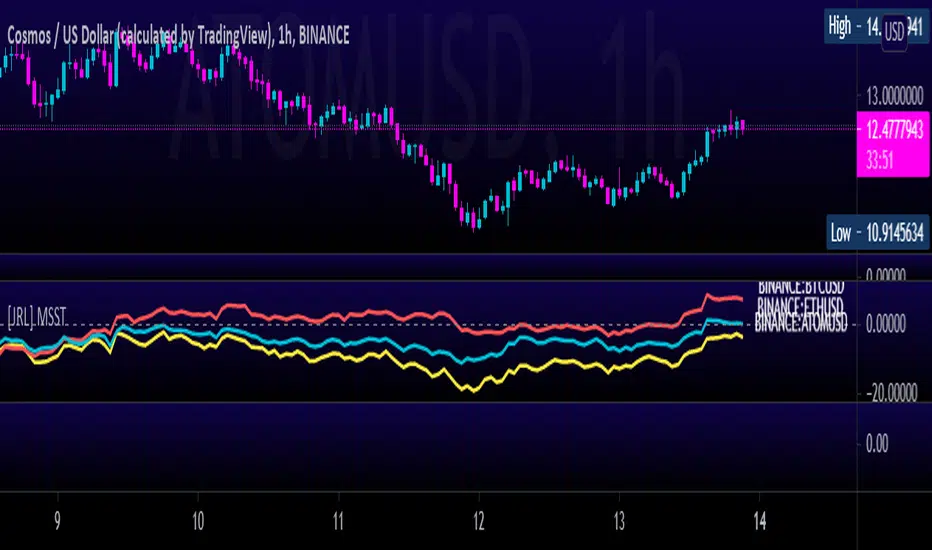
[JRL] Multi-Symbol Strength TrackerI created this script to compare cryptocurrencies that tend to be correlated, but it could also be used for forex or any other market. It is a fairly simple concept and compares price of each symbol to the specified period ema. This is helpful for tracking highly correlated symbols and visualizing moments when they are out of sync, perhaps signaling good times for buying or selling.
Vortex Trend TrackerThough it may sound complex, the Vortex Indicator is essentially an uptrend line and a downtrend line. The vortex indicator can be used for a variety of purposes, including tracking the strength of trends, identifying/anticipating reversals, and generating entry/exit signals. It’s calculation is shown in the open-source code below.
To reduce the number of whipsaws produced by the indicator, we used an Exponential Moving Average of vmPlus and vmNegative values with a default length of 10. Decreasing this length will result in a more responsive vortex at the cost of more whipsaws and false signals.
The chart shows the absolute value of the difference between the uptrend and downtrend line displayed as the main histogram.
If the uptrend line is greater than the downtrend (thus indicating positive movement), then the histogram bars will be either light green or dark green. If the uptrend line has just now crossed the downtrend line, then the bar will be dark green. Bars will also be dark green when the uptrend line is greater than the downtrend line and the uptrend line is increasing. This means the trend is increasing in strength still. If the uptrend line is greater than the downtrend line, but is decreasing, then the bars will be light green. This means that the upwards trend is losing strength.
If the downtrend line is greater than the uptrend line, then there is a negative trend occurring and the bars will be either red or light red. If the downtrend line has just crossed over the uptrend line or is increasing in value, then the bar will be red. If the downtrend line is greater than the uptrend line, but is decreasing in value, then the bars will be light red (meaning the downtrend is weakening).
One way to trade using this vortex is to enter a long position when the bar color changes from red to light red. This would mean that the downtrend is decreasing in strength and an upwards reversal is likely to occur soon. Then, traders can exit their long position when the bars change from dark green to light green. When that color change occurs it means that the uptrend is running out of steam and price is unlikely to continue its upwards climb.
Traders can also choose to have the uptrend and downtrend lines plotted as well in the input menu. This may make it easier to visualize the Vortex and its usefulness in identifying reversals.

5 Day ADR ICT Intraday TrackerPretty self explanatory, this indicator tracks todays current range as a % of the 5 Day ADR.
This is most useful for finding entries and looking for exits intraday, ie: how much hypothetical room is there for a trade to run? looking for entries in yellow and orange zones, exiting in blue once the ADR is reached etc.
Reset variable should be used for the end of day close. For forex on Oanda its 1700. Probably a way to do this programatically, if its obvious let me know and i can update it.
Can be set to clip output above 110% once the daily ADR has been fulfilled - this can be turned on or off.
Experimental mode for finding consolidations, based on the ADR for each day not been fulfilled and contracting. can be good for finding pending range expansion.
Code is pretty ugly, feel free to tweak.
current known issues: Indicator doesnt work for many non forex pairs, due to coding laziness. Indicator does not work on 1 minute timeframe.

Float Rotation TrackerFloat Rotation Tracker - Quick Reference Guide
What is Float Rotation?
Float Rotation = Cumulative Daily Volume ÷ Float
Example:
Float = 5,000,000 shares
Day Volume = 7,500,000 shares
Rotation = 7.5M ÷ 5M = 1.5x (150%)
When rotation hits 1x (100%), every available share has theoretically changed hands at least once during the trading day.
Why It Matters
RotationMeaningImplication0.5x50% of float tradedInterest building1.0x 🔥Full rotationExtreme interest confirmed2.0x 🔥🔥Double rotationVery high volatility3.0x 🔥🔥🔥Triple rotationRare - maximum volatility
Key insight: High rotation on a low-float stock = explosive potential
Float Classification
Float SizeClassificationRotation Impact≤ 2M🔥 MICROExtremely volatile, fast rotation≤ 5M🔥 VERY LOWExcellent momentum potential≤ 10MLOWGood for rotation plays> 10MNORMALNeeds massive volume to rotate
Rule of thumb: Focus on stocks with float under 10M for meaningful rotation signals.
Reading the Indicator
Rotation Line (Yellow)
Shows current rotation level
Rises throughout the day as volume accumulates
Crosses horizontal level lines at milestones
Level Lines
LineColorMeaning0.5Gray dotted50% rotation1.0Orange solidFull rotation2.0Red solidDouble rotation3.0Fuchsia solidTriple rotation
Volume Bars (Bottom)
ColorMeaningGrayBelow average volumeBlueNormal volume (1-2x avg)GreenHigh volume (2-5x avg)LimeExtreme volume (5x+ avg)
Milestone Markers
Circles appear when rotation crosses key levels
Labels show "50%", "1x", "2x", "3x🔥"
Background Color
Changes as rotation increases
Darker = higher rotation level
Info Table Explained
FieldDescriptionFloatShare count + classification (MICRO/LOW/NORMAL)SourceAuto ✓ = TradingView data / Manual = user enteredRotationCurrent rotation with emoji indicatorRotation %Same as rotation × 100Day VolumeCumulative volume todayTo XxVolume needed to reach next milestoneBar RVolCurrent bar's relative volumeMilestonesWhich levels have been hit todayPer RotationShares equal to one full rotationEst. TimeBars until next milestone (at current pace)
Trading with Float Rotation
Entry Signals
Early Entry (Higher Risk, Higher Reward)
Rotation approaching 0.5x
Strong price action (bull flag, breakout)
Rising relative volume bars
Confirmation Entry (Lower Risk)
Rotation at or above 1x
Price holding above VWAP
Continuous green/lime volume bars
Late Entry (Highest Risk)
Rotation above 2x
Only enter on clear pullback pattern
Tight stop required
Exit Signals
Warning Signs:
Rotation very high (2x+) with declining volume bars
Reversal candle after milestone
Price breaking below key support
Volume bars turning gray/blue after being green/lime
Take Profits:
Partial profit at each rotation milestone
Trail stop as rotation increases
Full exit on reversal pattern after 2x+ rotation
Best Setups
Ideal Float Rotation Play
✓ Float under 10M (preferably under 5M)
✓ Stock up 5%+ on the day
✓ News catalyst driving interest
✓ Rotation approaching or exceeding 1x
✓ Price above VWAP
✓ Volume bars green or lime
✓ Clear chart pattern (bull flag, flat top)
Red Flags to Avoid
✗ Float over 50M (hard to rotate meaningfully)
✗ Rotation high but price declining
✗ Volume bars turning gray after spike
✗ No clear catalyst
✗ Price below VWAP with high rotation
✗ Late in day (3pm+) after 2x rotation
Float Data Sources
If auto-detect doesn't work, get float from:
SourceHow to FindFinvizfinviz.com → ticker → "Shs Float"Yahoo FinanceFinance.yahoo.com → Statistics → "Float"MarketWatchMarketwatch.com → ticker → ProfileYour BrokerUsually in stock details/fundamentals
Note: Float can change due to offerings, buybacks, lockup expirations. Check recent data.
Settings Guide
Conservative Settings
Alert Level 1: 0.75 (75%)
Alert Level 2: 1.0 (100%)
Alert Level 3: 2.0 (200%)
Alert Level 4: 3.0 (300%)
High Vol Multiplier: 2.0
Extreme Vol Multiplier: 5.0
Aggressive Settings
Alert Level 1: 0.3 (30%)
Alert Level 2: 0.5 (50%)
Alert Level 3: 1.0 (100%)
Alert Level 4: 2.0 (200%)
High Vol Multiplier: 1.5
Extreme Vol Multiplier: 3.0
Alert Setup
Recommended Alerts
100% Rotation (1x) - Primary signal
Most important milestone
Confirms extreme interest
High Rotation + Extreme Volume
Combined condition
Very high probability signal
How to Set
Right-click chart → Add Alert
Condition: Float Rotation Tracker
Select desired milestone
Set notification (popup/email/phone)
Set expiration
Common Questions
Q: Why is my float showing "Manual (no data)"?
A: TradingView doesn't have float data for this stock. Enter the float manually in settings after looking it up on Finviz or Yahoo Finance.
Q: The rotation seems too high/low - is the float wrong?
A: Possibly. Cross-check float on Finviz. Recent offerings or share structure changes may not be reflected in TradingView's data.
Q: What if float rotates early in the day?
A: Early 1x rotation (within first hour) is very bullish - indicates massive interest. Watch for continuation patterns.
Q: High rotation but price is dropping?
A: This is distribution - large holders are selling into demand. High rotation doesn't guarantee price direction, just volatility.
Q: Can I use this for swing trading?
A: The indicator resets daily, so it's designed for intraday use. You could note multi-day rotation patterns manually.
Quick Decision Matrix
RotationPrice ActionVolumeDecision<0.5xStrong upHighWatch, early stage0.5-1xConsolidatingSteadyPrepare entry1x+Breaking outIncreasingEntry on pattern1x+DroppingHighAvoid - distribution2x+Strong upExtremePartial profit, trail stop2x+Reversal candleDecliningExit or avoid
Workflow Integration
MORNING ROUTINE:
1. Scan for gappers (5%+, high volume)
2. Check float on each candidate
3. Apply Float Rotation Tracker
4. Prioritize lowest float with building rotation
DURING SESSION:
5. Watch rotation levels on active trades
6. Enter on patterns when rotation confirms (0.5-1x)
7. Scale out as rotation increases
8. Exit or trail after 2x rotation
END OF DAY:
9. Note which stocks hit 2x+ rotation
10. Review rotation vs price action
11. Learn patterns for future trades
Combining with Other Indicators
IndicatorHow to Use Together5 PillarsScreen for low-float stocks firstGap & GoCheck rotation on gappersBull FlagEnter bull flags with 1x+ rotationVWAPOnly trade rotation plays above VWAPRSIWatch for divergence at high rotation
Key Takeaways
Float size matters - Lower float = faster rotation = more volatility
1x is the key level - Full rotation confirms extreme interest
Volume quality matters - Green/lime bars better than gray
Combine with price action - Rotation confirms, patterns trigger
Know when you're late - 2x+ rotation is late stage
Check your float data - Wrong float = wrong rotation calculation
Happy Trading! 🔥

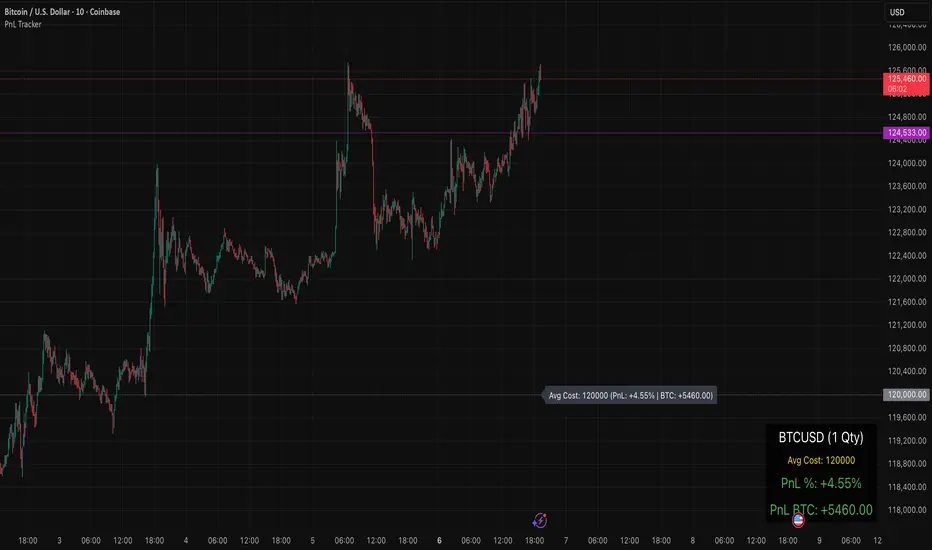
PnL TrackerThis script allows you to manually input the details for up to 64 unique positions in the settings, each requiring a Symbol, Average Cost, and Quantity (Qty).
Key Features:
Average Cost Line: Plots a horizontal line on the chart corresponding to your recorded Average Cost for the security currently being viewed.
Real-Time PnL Label: A dynamic label attached to the Average Cost line provides an instant summary of your PnL in both percentage and currency for the last visible bar.
Detailed PnL Box: Displays a consolidated, easy-to-read table in the bottom-right corner of the chart, clearly showing:
The Symbol and Quantity of your position.
Your Average Cost.
The current PnL in percentage (%) and base currency (e.g., USD, EUR).
Visibility Controls: Toggles in the settings allow you to show or hide the Average Cost line and the PnL summary box independently.
This tool is perfect for actively managing and visualizing your multi-asset portfolio positions without leaving your main trading chart. Simply enter your positions in the indicator's settings, and the script will automatically track the PnL for the symbol matching the current chart.
Customizable Dashboard (SIMPLE)This is a custom table where you can track any ticker and it's daily change. color coded to make things easy.

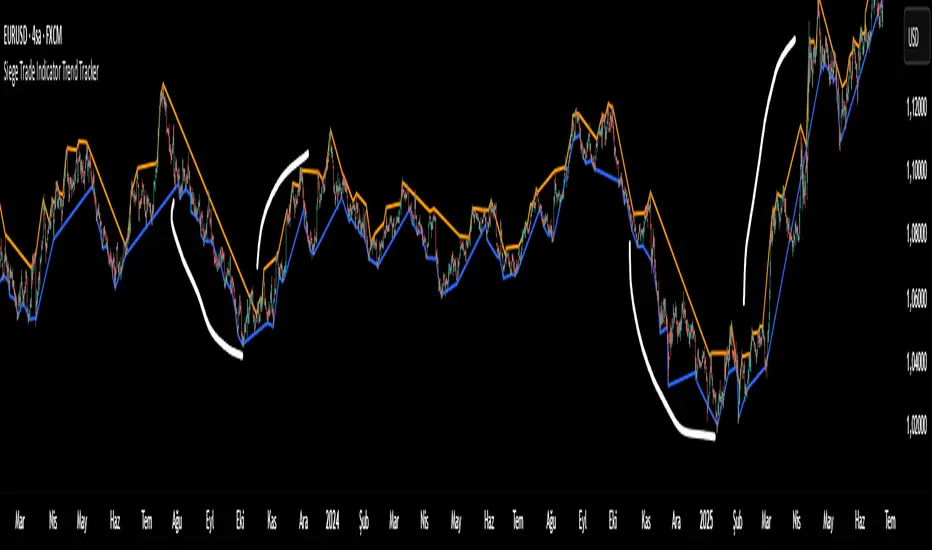
Siege Trend Tracker This indicator is designed to track market trends using pivot points and engulfing candles. The main pivot points highlight potential support and resistance levels for price movements, while the RSI provides additional insights into the trend's strength by identifying overbought and oversold conditions. The inclusion of engulfing candles helps to confirm potential trend reversals or continuations.
This tool assists you in better understanding the direction of the current trend and potential reversal points. It is especially useful for making more informed trading decisions when the price approaches pivot levels, and when engulfing patterns appear. It is an ideal tool for trend-following traders.
Like any other indicator, this one does not guarantee profits. It is only meant to assist you in your chart analysis.
Momentum TrackerMomentum Tracker - Advanced Multi-Timeframe Momentum Oscillator
Overview
The Momentum Tracker is a sophisticated momentum oscillator that employs a proprietary triple-layer exponential smoothing algorithm to measure market momentum with exceptional precision. This indicator transforms complex price movements into clear, actionable signals through an intuitive color-coded display system.
Key Features
• Advanced Calculation Engine
Triple-layer exponential smoothing for noise reduction
Proprietary momentum normalization algorithm
Oscillates smoothly between 0-100
• Multi-Timeframe Analysis (NEW!)
Analyze momentum from any timeframe on your current chart
Perfect for confirming higher timeframe trends on lower timeframe entries
Timeframe display badge for easy reference
• Dynamic Visual System
Blue: Rising momentum (bullish pressure)
Red: Falling momentum (bearish pressure)
Yellow: Neutral/consolidating (no clear direction)
• Reference Levels
90: Overbought zone
50: Equilibrium line
10: Oversold zone
• Professional Features
No repainting - uses only confirmed data
Works on all markets (Forex, Crypto, Stocks, Indices)
Compatible with all timeframes (1m to Monthly)
Clean, uncluttered display
How It Works
The Momentum Tracker uses a sophisticated multi-stage process:
Price Input: Calculates using typical price (HLC/3) for balanced market representation
Triple Smoothing: Applies three layers of adaptive exponential smoothing to filter market noise while preserving trend integrity
Momentum Normalization: Converts raw momentum into a bounded 0-100 oscillator
Dynamic Coloring: Instantly visualizes momentum direction through color changes
Trading Applications
1. Trend Identification
Blue line = Uptrend momentum
Red line = Downtrend momentum
Yellow line = Consolidation/indecision
2. Overbought/Oversold Conditions
Readings above 90 suggest overbought conditions
Readings below 10 suggest oversold conditions
Best used in conjunction with price action
3. Momentum Divergences
Spot regular and hidden divergences
Early warning of potential trend reversals
Confirmation tool for other signals
4. Multi-Timeframe Confirmation
View daily momentum on hourly charts
Confirm entry signals with higher timeframe momentum
Avoid trades against higher timeframe momentum
5. Entry/Exit Timing
Color changes can signal momentum shifts
Midline (50) crosses indicate trend bias changes
Extreme readings suggest potential reversal zones
Settings
• Timeframe: Select any timeframe for momentum calculation (leave empty for chart timeframe)
Best Practices
DO combine with price action and support/resistance levels
DO use multiple timeframe analysis for confirmation
DO wait for clear color changes before making decisions
DON'T use as a standalone trading system
DON'T trade solely based on overbought/oversold levels
DON'T ignore overall market context
Pro Tips
Divergence Trading: Look for momentum making lower highs while price makes higher highs (bearish divergence) or vice versa
Trend Following: Trade in the direction of the momentum color on higher timeframes
Range Trading: Use extreme readings (>90 or <10) for mean reversion trades in ranging markets
Confluence: Best signals occur when momentum aligns across multiple timeframes
Technical Details
Version: 6.0 (Pine Script v6)
Overlay: False (displays in separate pane)
Repainting: No
Calculation: Based on typical price (HLC/3)
Update Frequency: Real-time with each price tick
Risk Disclaimer
Trading financial instruments involves substantial risk and may result in loss of capital. This indicator is provided for informational and educational purposes only and should not be construed as investment advice. Always:
Use proper risk management
Updates
Latest Update: Added multi-timeframe functionality allowing momentum analysis from any timeframe on your current chart view.
Tags: #momentum #oscillator #trend #multitimeframe #norepaint #exponentialsmoothing #momentumindicator #technicalanalysis #trading #forex #crypto #stocks

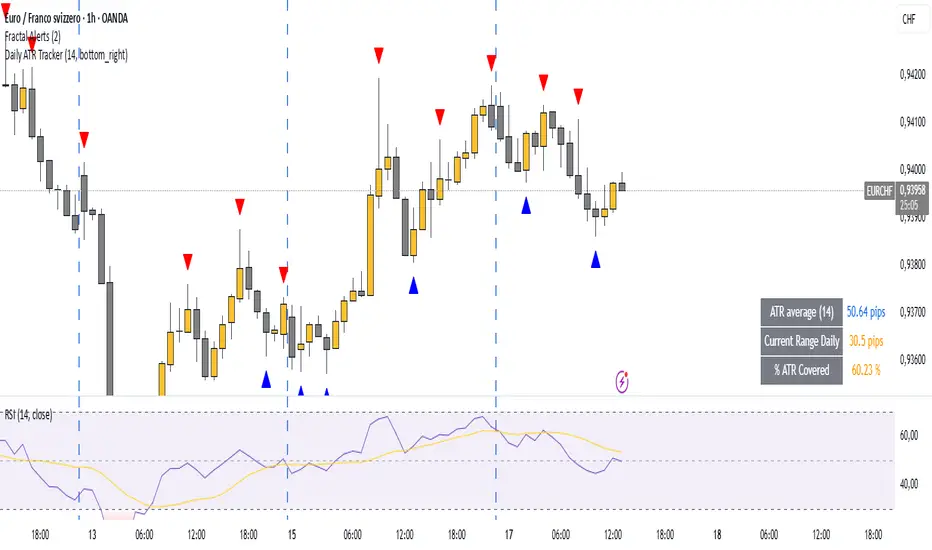
Daily ATR TrackerDaily ATR Tracker
The Daily ATR Tracker is a simple yet powerful tool designed to help traders monitor the daily price movement relative to the average daily range (ATR). This indicator provides an objective view of how much price has moved compared to its recent daily volatility.
🔎 Key Features:
Customizable ATR period (default 14 days)
Live calculation of the current day's price range
ATR value displayed in pips for clear reference
Percentage of ATR covered by the current day's range
Color-coded table for quick visual interpretation:
🟢 Green: less than 60% of ATR covered
🟠 Orange: 60% to 100% of ATR covered
🔴 Red: more than 100% of ATR covered
Alert condition when daily range exceeds 100% of the ATR average
Movable table position to fit your chart layout
🎯 Why use Daily ATR Tracker?
✅ Identify exhaustion zones: When price has already covered a large portion of its typical daily range, the odds of further strong movement may diminish, helping you to manage entries, exits, and risk.
✅ Objective daily bias: Get a quantitative sense of how "stretched" the market is in real time.
✅ Works with any timeframe: While designed for daily ranges, you can monitor intraday movements with this context in mind.
⚠️ Usage Note:
This tool does not provide buy or sell signals by itself. It is designed to complement your existing strategies by offering additional context regarding daily range exhaustion.