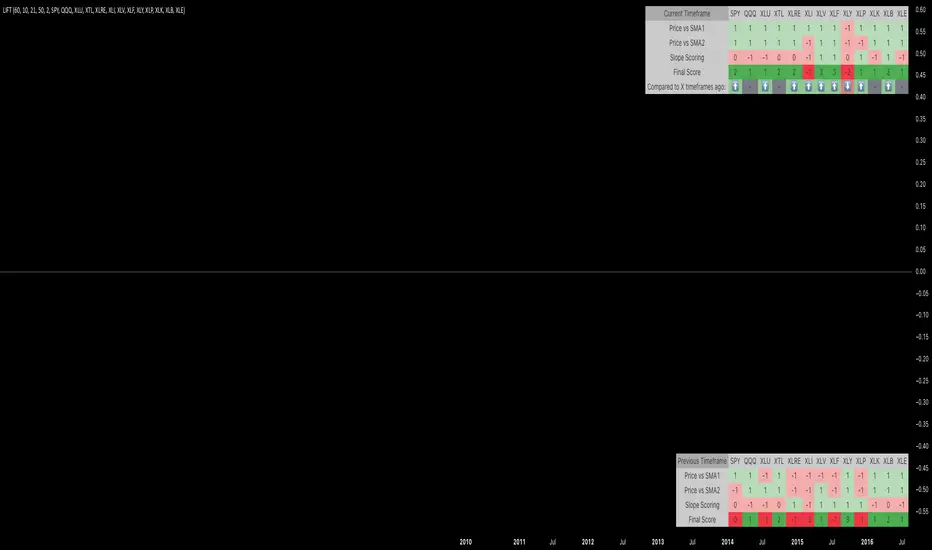
L.I.F.T. - Legaci Index Flow TrackerL.I.F.T. - Legaci Index Flow Tracker
The 'Legaci Index Flow Tracker' is a cutting-edge tool designed for traders and analysts who want to gain unparalleled insight into the strength and momentum of key market indices. This innovative indicator evaluates the relationship between 13 customisable indices and their respective Simple Moving Averages (SMAs), along with the slopes of those SMAs, to deliver a comprehensive market sentiment analysis.
Key Features:
Dynamic Scoring System :
Each index is evaluated across four categories, assigning a score of +1 (bullish) or -1 (bearish) based on price action and momentum.
Intuitive Table Display :
Scores for each index are presented in an easy-to-read table, highlighting:
The index ticker.
Individual scores for the 4 categories (price vs. SMA and slope).
A Final Score summarising the overall strength or weakness of each index.
Customisable Parameters :
Timeframe : Adapt to short-term, mid-term, or long-term trading strategies.
Lookback Period : Fine-tune slope calculations to capture precise market trends.
SMA Lengths : Adjust the moving average lengths to align with your trading methodology.
Index Selection : Choose from the 13 default indices or customise them to track your preferred market segments.
Why use the "L.I.F.T."?
This indicator is perfect for traders seeking a big-picture overview of market flow across multiple indices while maintaining the flexibility to drill down into specific trends. By tracking price action, SMA relationships, and momentum slopes in a unified framework, the Legaci Index Flow Tracker helps you:
Identify market trends at a glance.
Pinpoint the strongest and weakest indices in any timeframe.
Stay ahead of market shifts with actionable insights.
Whether you’re a day trader or a long-term strategist, the indicator is an essential addition to your toolkit, providing you with the clarity and precision needed to navigate today’s complex markets.
Cari dalam skrip untuk "track"
Memecoin TrackerMemecoin Z-Score Tracker with Buy/Sell Table - Technical Explanation
How it Works:
This indicator calculates the Z-scores of various memecoins based on their price movements, using historical funding rates across multiple exchanges. A Z-score measures the deviation of the current price from its moving average, expressed in standard deviations. This provides insight into whether a coin is overbought (positive Z-score) or oversold (negative Z-score) relative to its recent history.
Key Components:
- Z-Score Calculation
- The lookback period is dynamically adjusted based on the chart’s timeframe to ensure consistency across different time intervals:
- For lower timeframes (e.g., minutes), the base lookback period is scaled to match approximately 240 minutes.
- For daily and higher timeframes, the base lookback period is fixed (e.g., 14 bars).
Memecoin Selection:
The indicator tracks several popular memecoins, including DOGE, SHIB, PEPE, FLOKI, and others.
Funding rates are fetched from exchanges like Binance, Bybit, and MEXC using the request.security() function, ensuring accurate real-time price data.
Thresholds for Buy/Sell Signals:
Users can set custom Z-score thresholds for buy (oversold) and sell (overbought) signals:
Default upper threshold: 2.5 (indicates overbought condition).
Default lower threshold: -2.5 (indicates oversold condition).
When a memecoin’s Z-score crosses above or below these thresholds, it signals potential buy or sell conditions.
Buy/Sell Table:
A table with two columns (BUY and SELL) is dynamically populated with memecoins that are currently oversold (buy signal) or overbought (sell signal).
Each column can hold up to 20 entries, providing a clear overview of current market opportunities.
Visual Feedback:
The Z-scores of each memecoin are plotted as a line on the chart, with color-coded feedback:
Red for overbought (Z-score > upper threshold),
Green for oversold (Z-score < lower threshold),
Other colors indicate neutral conditions.
Horizontal lines representing the upper and lower thresholds are plotted for reference.
How to Use It:
Adjust Thresholds:
You can modify the upper and lower Z-score thresholds in the settings to customize sensitivity. Lower thresholds will increase the likelihood of triggering buy/sell signals for smaller price deviations, while higher thresholds will focus on more extreme conditions.
View Real-Time Signals:
The table shows which memecoins are currently oversold (buy column) or overbought (sell column), updating dynamically as price data changes. Traders can monitor this table to identify trading opportunities quickly.
Use with Different Timeframes:
The Z-score lookback period adjusts automatically based on the chart's timeframe, making this indicator suitable for intraday and long-term traders.
Use shorter timeframes (e.g., 1-minute, 5-minute charts) for faster signals, while longer timeframes (e.g., daily, weekly) may yield more stable, trend-based signals.
Who It Is For:
Short-Term Traders: Those looking to capitalize on short-term price imbalances (e.g., day traders, scalpers) can use this indicator to identify quick buy/sell opportunities as memecoins oscillate around their moving averages.
Swing Traders: Swing traders can use the Z-score tracker to identify overbought or oversold conditions across multiple memecoins and ride the reversals back toward equilibrium.
Crypto Enthusiasts and Memecoin Investors: Anyone involved in the volatile memecoin market can use this tool to better time entries and exits based on market extremes.
This indicator is for traders seeking quantitative analysis of price extremes in memecoins. By tracking the Z-scores across multiple coins and dynamically updating buy/sell opportunities in a table, it provides a systematic approach to identifying trade setups.

Forex Session Tracker [MacroGlide]Forex Session Tracker is a tool designed to track and visualize trading activity across the four key Forex market sessions: New York, London, Tokyo, and Sydney. The indicator helps traders see the time intervals of each session, their impact on price movements, and analyze volatility within these sessions.
Key Features:
• Session Visualization: The indicator highlights price ranges during the New York, London, Tokyo, and Sydney sessions using different colors, making data easier to visually interpret and analyze. Users can customize the color scheme for each session.
• Price Change Analysis: The indicator tracks the opening prices of each session and calculates the price changes by the session's close. This allows traders to assess market dynamics within each session and make informed trading decisions.
• Average Price Changes: The average price change for a specified number of sessions is calculated for each session, helping to identify trends and volatility levels.
• Time Zone Support: The indicator takes into account time zones, allowing users to adjust the display according to their location or use the market's time zone.
• Interactive Dashboard: The built-in dashboard shows the status of each session in real-time (active or inactive), recent price changes, and average changes, providing quick access to key information directly on the chart.
How to Use:
• Add the indicator to your chart and configure the displayed sessions according to your needs.
• Use color differentiation to easily identify active trading sessions and assess their impact on price movements.
• Monitor price changes in each session and analyze averages for a deeper understanding of market trends.
Methodology:
The indicator uses the time intervals of each trading session to calculate and display opening prices, price ranges, and price changes for the session. Based on this data, the Forex Session Tracker visualizes the session's high and low prices and calculates the average price change over the last several sessions. All data is displayed in real-time, considering the user's time zone settings or the market's time zone.
Originality and Usefulness:
Forex Session Tracker stands out for its ability to combine price change information from several key trading sessions into one indicator, providing traders with a simple and clear way to analyze market activity across different time zones.
Charts:
The indicator displays clean and clear charts, where each trading session is highlighted with its own color, making visual interpretation easier. The charts focus only on essential information for analysis: opening prices, session ranges, and price changes. The integrated dashboard provides quick access to key session metrics, such as activity status, recent price changes, and average values for the selected period. These features make the charts highly useful for rapid analysis and trading decision-making.
Enjoy the game!

ACAT Period Tracker (14-2000 Half-Res) [acatwithcharts]This is the corresponding period length tracker for ACAT (14-2000 Half-Res). The constraints of Pinescript make it necessary to plot a separate indicator in a separate window to actually read out the period numbers without massively skewing the chart by default.
Taking some lessons from how subscribers ended up making best use of the period length trackers for my prior scripts, I've set the default line widths wide so that it pairs well on the same window as 3D WAVE-PM. Notably, you would need to use both standard range coverage of 3D WAVE-PM and the Hi-Res 605-2000 period version to pair with this higher tracking range in that setup.
My volatility indicators are available by subscription in several packages through SharkCharts.live - and this is planned to be the first new one ready to add. I plan to release a video explaining how to use this indicator coinciding with launch, as there's a lot to talk about. Videos on my other indicators are currently hosted on DadShark's YouTube channel.
Current pricing and subscription details will be kept up-to-date on SharkCharts.live

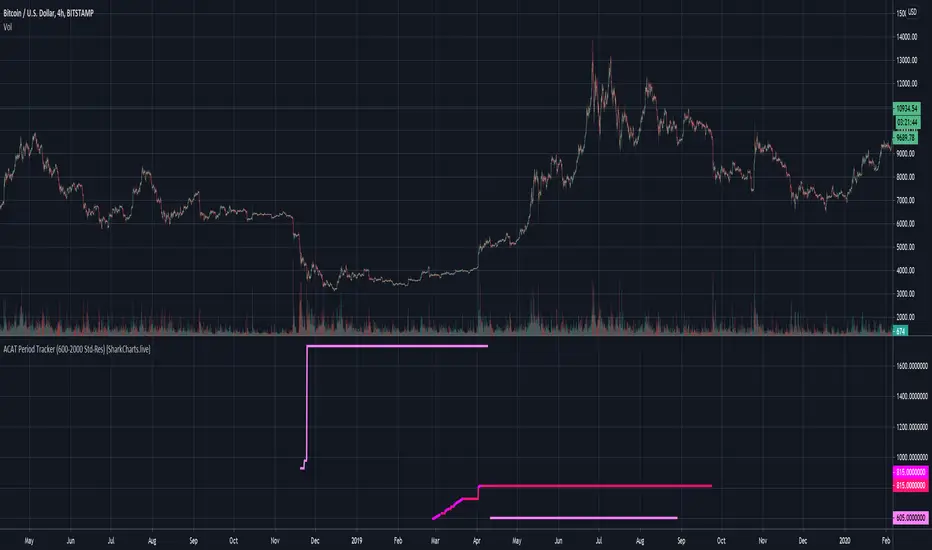
ACAT Period Tracker (600-2000 Std-Res) [acatwithcharts]This is the corresponding period length tracker for ACAT (600-2000 Std-Res). The constraints of Pinescript make it necessary to plot a separate indicator in a separate window to actually read out the period numbers without massively skewing the chart by default.
Taking some lessons from how subscribers ended up making best use of the period length trackers for my prior scripts, I've set the default line widths wide so that it pairs well on the same window as 3D WAVE-PM. Notably, you would need to use the Hi-Res 605-2000 period version to pair with this higher tracking range in that setup.
My volatility indicators are available by subscription in several packages through SharkCharts.live - and this is planned to be the first new one ready to add. I plan to release a video explaining how to use this indicator coinciding with launch, as there's a lot to talk about. Videos on my other indicators are currently hosted on DadShark's YouTube channel.
Current pricing and subscription details will be kept up-to-date on SharkCharts.live
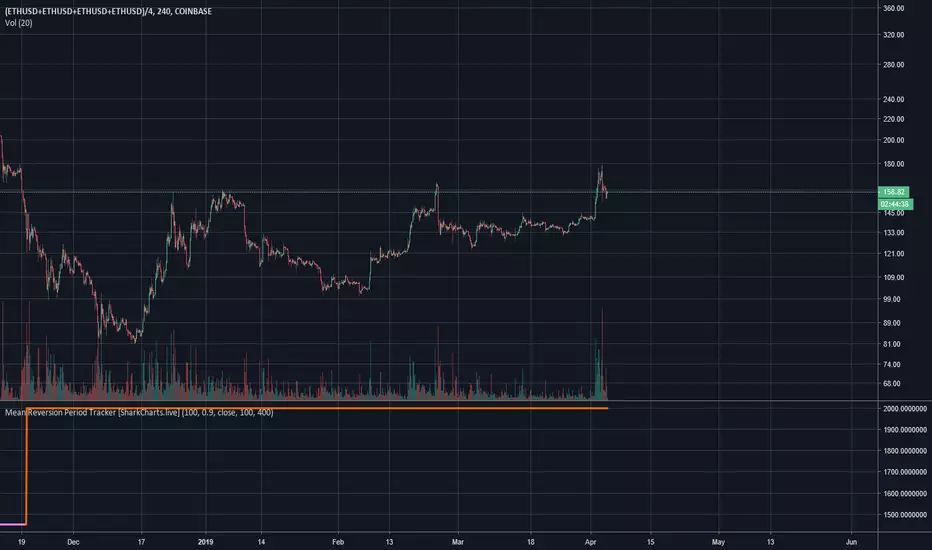
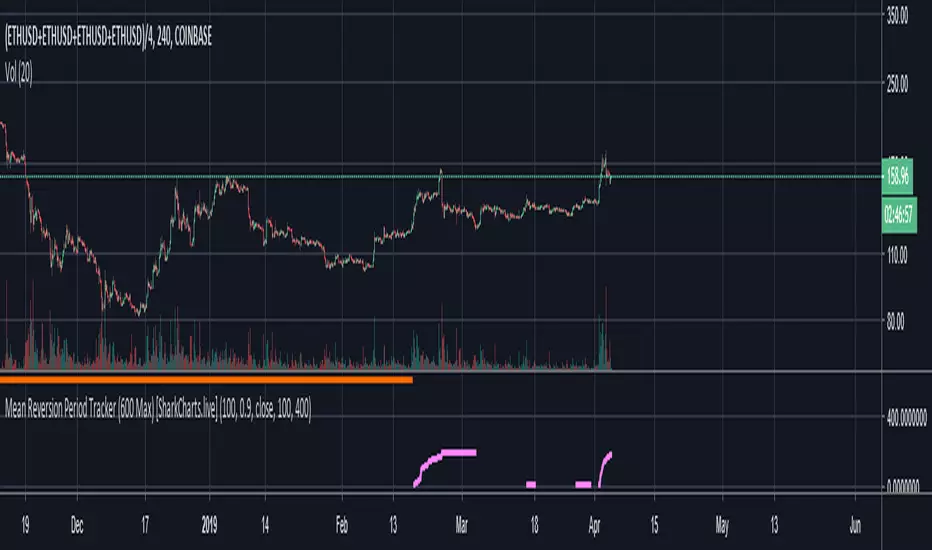
Mean Reversion Period Tracker [acatwithwithcharts]Mean Reversion MA is an experimental WIP -1.41% -indicator which tracks the furthest overexpanded period on a given timeframe as a target for eventual mean reversion. Mean Reversion Period Tracker is an adjunctive indicator for quickly determining which period length is currently being tracked.
This version caps the maximum period length at 2000 for the complete range of the full Mean Reversion MA indicator. The display color also changes to orange when the period is maxed out as a warning that the maximum has been reached and that the true further overexpanded period is likely to be further out.
I am posting this as invite-only and have a short list of collaborators in mind who will get access if they want it. It is not being made available to the general public as of this posting; I’m vaguely working towards eventually offering being able to offer some sort of paid indicator offering in the future.
Rather than shut the door entirely, I will say that if someone approaches me by PM with a really interesting idea on how they’d like to test this or my other indicators, I’m willing to consider giving access. I’m not giving this away just to anyone who asks and will, for my own time and sanity, probably just ignore requests by people who don't come to me already knowing what this indicator does and how they might want to use it.
Mean Reversion Period Tracker (600 Max) [acatwithwithcharts]Mean Reversion MA is an experimental WIP -indicator which tracks the furthest overexpanded period on a given timeframe as a target for eventual mean reversion. Mean Reversion Period Tracker is an adjunctive indicator for quickly determining which period length is currently being tracked.
This version caps the maximum period length at 600, an empirically-chosen number based on some testing to try to avoid picking overly distant targets. The display color also changes to orange when the period is maxed out as a warning that the maximum has been reached and that the true further overexpanded period is likely to be further out.
I am posting this as invite-only and have a short list of collaborators in mind who will get access if they want it. It is not being made available to the general public as of this posting; I’m vaguely working towards eventually offering being able to offer some sort of paid indicator offering in the future.
Rather than shut the door entirely, I will say that if someone approaches me by PM with a really interesting idea on how they’d like to test this or my other indicators, I’m willing to consider giving access. I’m not giving this away just to anyone who asks and will, for my own time and sanity, probably just ignore requests by people who don't come to me already knowing what this indicator does and how they might want to use it.
Enhanced 50% Level TrackerEnhanced 50% Level Support/Resistance Indicator
This Pine Script indicator automatically draws horizontal lines at the 50% level (midpoint) of each candlestick and tracks when price revisits these levels, providing comprehensive statistics on support and resistance effectiveness.
Key Features:
📊 Core Functionality:
Draws lines at the 50% level of bull/bear candles
Tracks when price touches these levels again
Real-time statistics on revisit rates and timing
🎨 Visual Customization:
Customizable line colors, styles, and widths
Smart labels showing creation date, price, and revisit count
Line strength coloring based on age and revisit frequency
Fade-over-time option for older lines
📈 Advanced Analytics:
97%+ revisit rate - shows how effective 50% levels are as S/R
Bull vs Bear performance - compares bullish vs bearish candle effectiveness
Timing analysis - tracks fastest/slowest revisit times
Multi-revisit tracking - identifies the strongest levels
⚙️ Smart Features:
Auto-deletion after X revisits to keep chart clean
Memory management for optimal performance
Separate label positioning for bull vs bear candles
Toggle between bars/hours/days time format
Practical Use:
Ideal for traders looking to identify high-probability support and resistance levels based on historical 50% retracement zones. The 97%+ revisit rate demonstrates that these midpoint levels are statistically significant areas where price tends to react.
Best for: Swing trading, support/resistance identification, and understanding market structure patterns.
Protected script
This script is published as closed-source. However, you can use it freely and without any limitations – learn more here.
Bostonshamrock
Disclaimer
The information and publications are not meant to be, and do not constitute, financial, investment, trading, or other types of advice or recommendations supplied or endorsed by

XTE+ Optimized Trend Tracker📊 XTE+ Optimized Trend Tracker (OTT)
XTE+ OTT is a powerful, trend-following indicator designed for traders who value clarity, precision, and advanced analytics. It offers not only accurate entry and exit signals but also visual zones, historical signal analysis, and real-time trend monitoring.
🧠 How It Works
XTE+ OTT is based on an improved version of the Optimized Trend Tracker. It utilizes multiple customizable moving average types (VAR, EMA, SMA, WMA, and more) combined with volatility filtering (ATR logic) to generate cleaner, more reliable trend-following signals.
✅ Features
Trend Direction Detection with automatic switch logic
Buy/Sell Signal Icons with distinct large markers
Entry/Exit Zones drawn visually on chart
Custom Take-Profit / Stop-Loss settings for Buy and Sell signals
Statistical Panel showing:
Current Trend (Up/Down)
Number of total signals
Number of winning trades
Win percentage
Configurable Display Options:
Show/hide signals
Show/hide trend zones
Show/hide OTT and MA lines
Supports multiple MA types including EMA, SMA, VAR, ZLEMA, TSF and more
Non-repainting logic — signals are confirmed at bar close
⚙️ Inputs and Customization
OTT Period & Sensitivity (%)
MA Type Selection (VAR, EMA, etc.)
Entry Zone Visualization On/Off
Trend Panel Display On/Off
TP/SL % per direction (Buy/Sell separately)
Option to disable MA or OTT line display
📈 Visuals
Signal icons: BUY (Green Up Label), SELL (Red Down Label)
Entry zones: circles near breakout levels
Trendlines change color dynamically (green for uptrend, red for downtrend)
Trend Panel is pinned in the top-right corner for quick reference
💡 Usage Tips
Best used on higher timeframes (15min, 1H, 4H+) for more meaningful trend signals
Combine with volume/volatility indicators or support/resistance zones for enhanced decision making
Use TP/SL logic to track signal success over time and optimize strategies
📌 Disclaimer
This script is for educational and informational purposes only. It is not financial advice. Always test and validate your strategy before applying it in live markets.

Donchian Channel Trend Tracker by KellyLikesCrypto### Overview
This indicator is written in Pine Script® (version 6) and is designed to overlay on a price chart. It combines the classic Donchian Channel—a tool popular among trend-following traders—with additional trend-tracking features. By identifying when the channel’s highs and lows are making new extreme values, the indicator helps signal potential trend shifts. It is especially suited for scalpers using 1-hour charts, as it provides clear, actionable signals for rapid entry and exit decisions.
---
### Key Components & Inputs
1. **User Inputs:**
- **Length:** The period over which the indicator calculates the highest high and the lowest low (default is 27 bars). This value can be adjusted to smooth or tighten the channel based on the trader’s preference.
- **Offset:** A parameter allowing the plotted lines to be shifted left or right on the chart, providing flexibility in aligning the indicator with price action.
2. **Donchian Channel Calculations:**
- **Lower Bound (`lower`):** Calculated using `ta.lowest(length)`, it identifies the lowest low over the defined period.
- **Upper Bound (`upper`):** Determined by `ta.highest(length)`, capturing the highest high during the same period.
- **Basis:** The midline of the channel, computed as the average of the upper and lower bounds. This line can serve as an equilibrium or reference point in the trend analysis.
---
### Visual Representation
- **Plotting the Channels:**
- The **basis** is plotted in a standout orange color (#FF6D00) to make the central trend reference easily visible.
- The **upper** and **lower** bounds are plotted in blue (#2962FF), creating clear boundaries for the price action.
- The area between these two lines is filled with a semi-transparent blue, enhancing the visual context of the channel and helping traders quickly assess whether price is near an extreme or within a normal range.
---
### Trend Identification Logic
Beyond plotting the basic Donchian Channel, the indicator introduces additional logic to track short-term trend changes:
1. **Higher Highs and Higher Lows:**
- **Higher High (`higherHigh`):** This condition checks if the current upper bound is greater than the previous bar’s upper bound, signaling a potential upward push.
- **Higher Low (`higherLow`):** Similarly, it checks if the current lower bound exceeds the previous bar’s lower bound, reinforcing an upward trend if the support level is rising.
2. **Lower Highs and Lower Lows:**
- **Lower High (`lowerHigh`):** This evaluates if the current upper bound is less than that of the previous bar, indicating a possible downward shift.
- **Lower Low (`lowerLow`):** It verifies if the current lower bound is lower than the previous bar’s, further confirming a bearish tendency.
The use of the `nz()` function ensures that on the very first bar—where no previous data exists—the code handles the values gracefully without causing errors.
---
### Visual Markers for Trend Signals
To make trend signals immediately apparent:
- **Markers are Plotted on the Chart:**
- **Green Labels ("HH" and "HL"):** These are placed on the chart when the indicator detects higher highs or higher lows, suggesting bullish momentum.
- **Red Labels ("LH" and "LL"):** These markers are shown when lower highs or lower lows are detected, indicating bearish pressure.
Each label is plotted either above or below the corresponding bar, ensuring that the chart remains uncluttered and that the trend signals are clear.
---
### Scalping Strategy on 1-Hour Charts
This indicator is specifically tailored for scalping strategies on 1-hour charts. Scalping involves capturing small, rapid profits from short-term price movements, and the clear trend signals provided by this tool can help traders pinpoint optimal entry and exit points. Here’s how it integrates into a scalping strategy:
- **Quick Trend Identification:** The green markers (HH and HL) suggest bullish conditions ideal for quick long entries, while the red markers (LH and LL) signal bearish conditions suitable for short entries.
- **Timing and Precision:** On a 1-hour chart, the indicator’s sensitivity to higher highs and lower lows allows traders to make rapid decisions aligned with the prevailing trend.
- **Complementary Analysis:** While the indicator provides fast signals, it is recommended to use it alongside additional tools (like oscillators or volume analysis) and strict risk management practices, ensuring that scalpers can confirm entries and exits efficiently.
By leveraging the indicator’s visual cues within a broader scalping framework, traders can enhance their ability to capture quick moves, thus optimizing their overall strategy on 1-hour timeframes.
---
### Conclusion
The “Donchian Channel Trend Tracker by KellyLikesCrypto” is a powerful tool for visualizing price extremes and trend direction. By combining the classical Donchian Channel with additional trend-tracking markers, it offers traders a clear and immediate way to assess whether the market is gaining bullish momentum or beginning to turn bearish. Its customizable parameters and clear visual signals make it particularly effective for a scalping strategy on 1-hour charts, where rapid decision-making is crucial.
This detailed breakdown should provide a comprehensive understanding of how each component of the indicator works together and how it can be effectively integrated into a short-term scalping strategy.

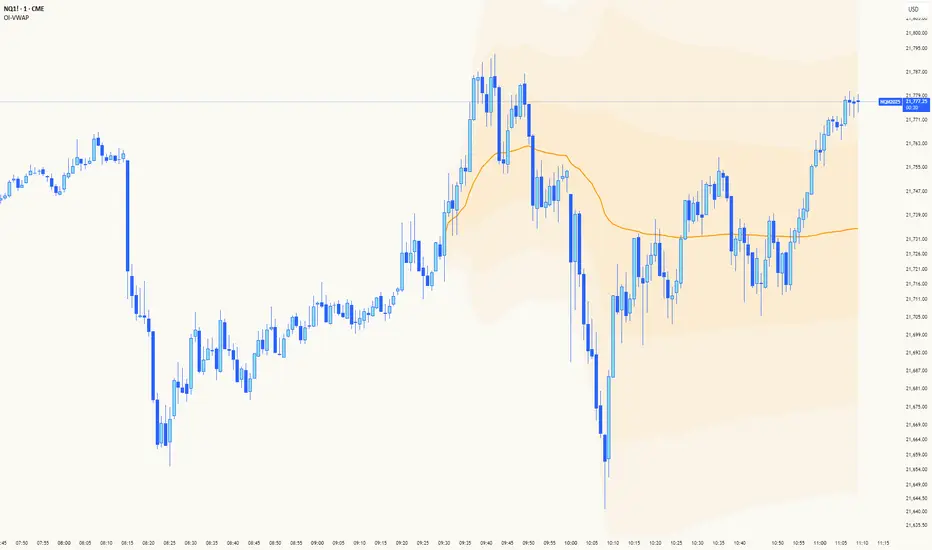
Big Money TrackerOI-Anchored VWAP: Big Money Position Tracker
Understanding VWAP in Big Money Trading
Volume Weighted Average Price (VWAP) is the benchmark most widely used by institutions to assess their execution quality and market timing. It represents the average price a security has traded at throughout the day, weighted by volume.
Why Institutions Care About VWAP:
Portfolio managers often mandate trades to be executed at or better than VWAP
Large orders are broken down and executed around VWAP to minimize market impact
Trading desks use VWAP as a neutral price to assess if they're buying too high or selling too low
Algorithmic trading systems use VWAP as a key reference for order execution
The OI-VWAP Edge
This indicator takes Big Money VWAP trading to the next level by anchoring VWAP calculations to significant Open Interest (OI) changes. This helps identify not just where institutions are trading, but where they're establishing significant positions in the crypto markets.
Key Features:
Dynamic OI-based VWAP anchoring that identifies where large positions are established
Previous VWAP level tracking to monitor historical Big Money interest points
Smart sweep detection system for both current and previous VWAP levels
Standard deviation bands for volatility context
What Makes This Indicator Unique:
Uses aggregated Open Interest data from major exchanges (Binance, BitMEX, Bybit, Kraken)
Automatically detects significant OI increases to anchor VWAP levels
Tracks both current and previous Big Money reference prices
Identifies potential stop runs and liquidity sweeps
Trading Applications:
The indicator helps identify where large positions are established and how they might influence price action:
Defense Zones: When price approaches a VWAP level with high OI, institutions often defend their positions
Liquidation Levels: Previous VWAP levels can become liquidation targets for trapped positions
Stop Runs: Sweep detection helps identify when large players might be hunting stops or creating liquidity
Mean Reversion: SD bands help identify potential reversal zones around Big Money average prices
Best Practices:
Look for price reaction at current VWAP when OI is increasing
Monitor sweeps of previous VWAP levels for potential reversals
Use SD bands to gauge volatility expansion/contraction around Big Money positions
Pay attention to failed sweeps as they often indicate strong position defense
Trading Scenarios:
// Bullish Position Defense:
// 1. High OI increase creates new VWAP (Big Money entry)
// 2. Price tests VWAP from above (retest of entry)
// 3. Failed bearish sweeps = shorts trapped
// 4. Strong defense + trapped shorts = potential squeeze
// Bearish Liquidation:
// 1. Previous VWAP level above current price
// 2. High OI trapped at higher prices
// 3. Price sweeps above then fails = more trapped longs
// 4. Break below = potential cascading liquidations
ICT Macro Zone Boxes w/ Individual H/L Tracking v3.1ICT Macro Zones (Grey Box Version
This indicator dynamically highlights key intraday time-based macro sessions using a clean, minimalistic grey box overlay, helping traders align with institutional trading cycles. Inspired by ICT (Inner Circle Trader) concepts, it tracks real-time highs and lows for each session and optionally extends the zone box after the session ends — making it a precision tool for intraday setups, order flow analysis, and macro-level liquidity sweeps.
### 🔍 **What It Does**
- Plots **six predefined macro sessions** used in Smart Money Concepts:
- AM Macro (09:50–10:10)
- London Close (10:50–11:10)
- Lunch Macro (11:30–13:30)
- PM Macro (14:50–15:10)
- London SB (03:00–04:00)
- PM SB (15:00–16:00)
- Each zone:
- **Tracks high and low dynamically** throughout the session.
- **Draws a consistent grey shaded box** to visualize price boundaries.
- **Displays a label** at the first bar of the session (optional).
- **Optionally extends** the box to the right after the session closes.
### 🧠 **How It Works**
- Uses Pine Script arrays to define each session’s time window, label, and color.
- Detects session entry using `time()` within a New York timezone context.
- High/Low values are updated per bar inside the session window.
- Once a session ends, the box is optionally closed and fixed in place.
- All visual zones use a standardized grey tone for clarity and consistency across charts.
### 🛠️ **Settings**
- **Shade Zone High→Low:** Enable/disable the grey macro box.
- **Extend Box After Session:** Keep the zone visible after it ends.
- **Show Entry Label:** Display a label at the start of each session.
### 🎯 **Why This Script is Unique**
Unlike basic session markers or colored backgrounds, this tool:
- Focuses on **macro moments of liquidity and reversal**, not just open/close times.
- Uses **per-session logic** to individually track price behavior inside key time windows.
- Supports **real-time high/low tracking and clean zone drawing**, ideal for Smart Money and ICT-style strategies.
Perfect — based on your list, here's a **bundle-style description** that not only explains the function of each script but also shows how they **work together** in a Smart Money/ICT workflow. This kind of cross-script explanation is exactly what TradingView wants to see to justify closed-source mashups or interdependent tools.
---
📚 ICT SMC Toolkit — Script Integration Guide
This set of advanced Smart Money Concept (SMC) tools is designed for traders who follow ICT-based methodologies, combining liquidity theory, time-based precision, and engineered confluences for high-probability trades. Each indicator is optimized to work both independently and synergistically, forming a comprehensive trading framework.
---
First FVG Custom Time Range
**Purpose:**
Plots the **first Fair Value Gap (FVG)** that appears within a defined session (e.g., NY Kill Zone, Custom range). Includes optional retest alerts.
**Best Used With:**
- Use with **ICT Macro Zones (Grey Box Version)** to isolate FVGs during high-probability times like AM Macro or PM SB.
- Combine with **Liquidity Levels** to assess whether FVGs form near swing points or liquidity voids.
---
ICT SMC Liquidity Grabs and OB s
**Purpose:**
Detects **liquidity grabs** (stop hunts above/below swing highs/lows) and **bullish/bearish order blocks**. Includes optional Fibonacci OTE levels for sniper entries.
**Best Used With:**
- Use with **ICT Turtle Soup (Reversal)** for confirmation after a liquidity grab.
- Combine with **Macro Zones** to catch order blocks forming inside timed macro windows.
- Match with **Smart Swing Levels** to confirm structure breaks before entry.
ICT SMC Liquidity Levels (Smart Swing Lows)
**Purpose:**
Automatically marks swing highs/lows based on user-defined lookbacks. Tracks whether those levels have been breached or respected.
**Best Used With:**
- Combine with **Turtle Soup** to detect if a swing level was swept, then reversed.
- Use with **Liquidity Grabs** to confirm a grab occurred at a meaningful structural point.
- Align with **Macro Zones** to understand when liquidity events occur within macro session timing.
ICT Turtle Soup (Liquidity Reversal)
**Purpose:**
Implements the classic ICT Turtle Soup model. Looks for swing failure and quick reversals after a liquidity sweep — ideal for catching traps.
Best Used With:
- Confirm with **Liquidity Grabs + OBs** to identify institutional activity at the reversal point.
- Use **Liquidity Levels** to ensure the reversal is happening at valid previous swing highs/lows.
- Amplify probability when pattern appears during **Macro Zones** or near the **First FVG**.
ICT Turtle Soup Ultimate V2
**Purpose:**
An enhanced, multi-layer version of the Turtle Soup setup that includes built-in liquidity checks, OTE levels, structure validation, and customizable visual output.
**Best Used With:**
- Use as an **entry signal generator** when other indicators (e.g., OBs, liquidity grabs) are aligned.
- Pair with **Macro Zones** for high-precision timing.
- Combine with **First FVG** to anticipate price rebalancing before explosive moves.
---
## 🧠 Workflow Example:
1. **Start with Macro Zones** to focus only on institutional trading windows.
2. Look for **Liquidity Grabs or Swing Sweeps** around key highs/lows.
3. Check for a **Turtle Soup Reversal** or **Order Block Reaction** near that level.
4. Confirm confluence with a **Fair Value Gap**.
5. Execute using the **OTE level** from the Liquidity Grabs + OB script.
---
Let me know which script you want to publish first — I’ll tailor its **individual TradingView description** and flag its ideal **“Best Used With” partners** to help users see the value in your ecosystem.

Prop Firm Guard: Risk & Sizing Tracker by TFTProp Firm Guard: Risk & Sizing Tracker by TFT
Overview:
This script is designed to help prop firm traders stay within risk rules and avoid emotional overtrading. It tracks your max loss limits, daily loss rules, and gives real-time position sizing suggestions based on your account status.
This tool is especially helpful for newer traders navigating prop firm challenges and rules like trailing drawdowns and daily stopouts.
Key Features:
✅ Real-time tracking of max loss and daily loss limits
✅ Supports both Intraday and End-of-Day (EOD) drawdown styles
✅ Calculates remaining “distance” to max/daily loss levels
✅ Automatically locks max loss once it trails up to starting balance
✅ Provides smart, tier-based position sizing suggestions (5%–50%)
✅ Shows profit target progress and live daily P&L
Use Case Example:
Let’s say you’re trading a $50,000 prop account with a $2,000 max drawdown limit.
If you're using Intraday Drawdown:
• You start the day at $50,000.
• During the day, your balance grows to $51,000 (including unrealized profits).
• The drawdown logic will trail this intraday high — so your new max loss limit becomes $49,000 (51K - 2K).
• If your balance drops to $49,400, this tool will show you’re $400 away from breaching the limit.
• Sizing suggestions will adjust accordingly to keep you in a safe range.
If you're using End-of-Day (EOD) Drawdown:
• The same scenario (account grows to $51,000 intraday) won’t affect your max loss limit immediately.
• EOD drawdown is only updated based on your end-of-day closing balance.
• So even if you hit $51K intraday, your max loss limit still remains at $48,000 (50K - 2K) until the trading day closes and updates your best equity.
• This mode offers more flexibility during the day — and the tool reflects this in how it calculates distances and sizing.
📌 It will then suggest a conservative sizing range — maybe 5–10% of your allowed contract size — until you're safer again.
📌 Make sure you update your current balance after each trade and follow your risk settings.
Inputs Explained (with Tips):
• Overall Account Starting Balance: Your full prop account size (e.g., 50000 or 100000, 150000, 300000, so on)
• Day Start Balance: What your balance was when the trading day started
• Daily Max Loss: How much you’re allowed to lose in one day (used only for EOD drawdown)
• Daily Profit Target: Your goal for the day (e.g., 500 or 1000 or so on)
• Allowed Overall Drawdown: Usually 4% for prop firms — like 2000 on 50K, or 6000 on 300K
• Drawdown Mode:
→ Intraday: Includes floating/unrealized profits in drawdown logic
→ EOD: Uses only end-of-day equity for drawdown logic
• Best Day High: Your highest balance to date. If not above your starting balance, this is ignored
• Intraday High (Manual): Optional override if your peak balance isn’t same as equity (used only for intraday drawdown mode)
• Current Equity: Update this during the session to reflect your live balance — everything else updates automatically
What You’ll See on the Chart:
🟩 Equity Section: Start balance, current balance, intraday high, best day high
🟥 Risk Section:
• Max loss limit (based on trailing logic)
• Distance from current balance to that limit
• Daily loss limit and distance (EOD mode only)
🟦 Performance Metrics:
• Daily P&L in $ and %
• Progress to profit target (shows ✅ Accomplished when goal is hit)
📦 Sizing Suggestion:
Based on how close you are to a drawdown breach, and your total drawdown tier.
Ranges from ⚠️ 5–10% to ✅ 40–50% of your max allowed contract size.
Who It's Best For:
• Built and optimized for 50K prop firm accounts
• Works well with 100K, 150K, or even 300K — but the sizing logic is most precise at 50K
• Best suited for futures or forex prop firm traders using account challenge-style rules
Manual Input Required:
Due to TradingView limitations, we cannot read your actual trades or live balance.
You'll need to update the Current Equity field yourself — but the rest is auto-calculated from there.
Most inputs (like overall balance and drawdown) are set once and rarely changed.
Beta Notice:
This tool is currently in beta and under testing. It's free for now and designed to help the trading community — but accuracy may vary.
Please send feedback if you'd like to suggest improvements or report bugs.
Disclaimer:
This tool is for educational purposes only and does not provide trading advice or signal any trades.
Always trade according to your firm’s rules. The author is not responsible for losses resulting from use of this script.

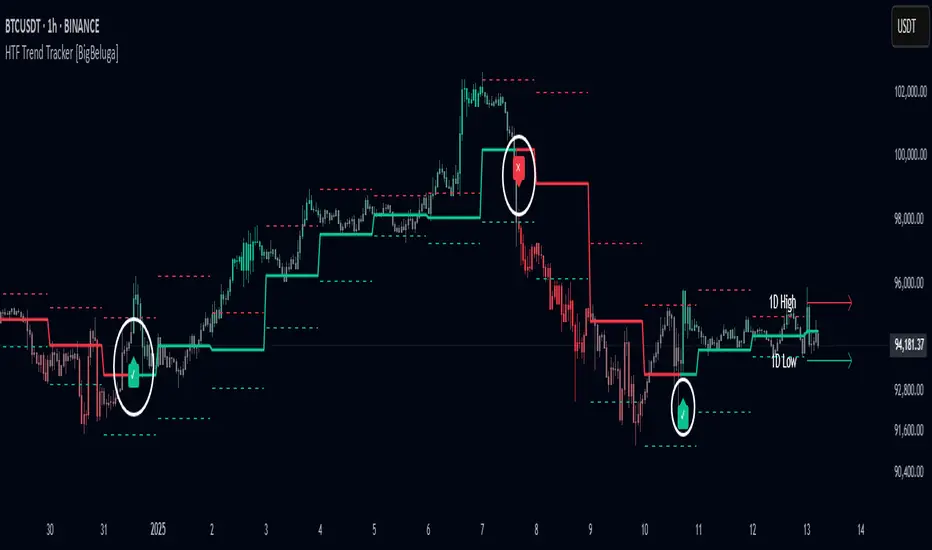
HTF Trend Tracker [BigBeluga]HTF Trend Tracker is a higher timeframe (HTF) trend tracking indicator designed to help traders identify significant trends, key levels, and market sentiment. The indicator dynamically adapts to the current price action, using HTF highs and lows to display trend direction and strength with detailed visuals.
🔵 Key Features:
Dynamic Trend Detection:
Uptrend is identified when the price closes above the HTF high.
Downtrend is detected when the price closes below the HTF low.
Midline changes color dynamically based on the trend direction:
Bullish Green: Indicates an uptrend.
Bearish Red: Indicates a downtrend.
Historical and Active HTF Levels:
Historic HTF highs and lows are displayed as dotted lines.
Current active HTF high and low levels are shown as solid lines.
Timeframe labels (e.g., "1D High" or "1D Low") mark the active levels for clarity.
Trend Change Signals:
A green checkmark (✓) is plotted when an uptrend starts.
A red cross (✕) appears when a downtrend begins.
Trend-Based Candle Coloring:
Candle colors change dynamically based on the trend and the price's distance from the midline:
Intense Bullish Green: Price is far above the midline during an uptrend.
Intense Bearish Red: Price is far below the midline during a downtrend.
Neutral Gray: Price is near the midline.
Users can customize the colors to suit their preferences.
🔵 Usage:
Identify uptrends and downtrends using the midline's color and the position of the close relative to the HTF levels.
Use solid lines and timeframe labels to track current HTF high and low levels.
Observe dotted lines for historical HTF levels to understand past price behavior.
Watch for checkmark (✓) and cross (✕) signals to spot trend changes and key market shifts.
Monitor candle colors to gauge trend intensity and proximity to the midline:
Intense colors signal strong trends, while neutral gray indicates consolidation near the midline.
HTF Trend Tracker is an essential tool for traders aiming to follow higher timeframe trends, identify key levels, and make data-driven decisions based on price dynamics and trend strength. Its customizable features allow for flexible integration into any trading strategy.
Pump, Dump and Accumulation Tracker (VIP User)ThunderTrader : ThunderLight
ThunderLight is indicator to track or calculate hidden consolidation or accumulation where the whales prepare for next pump
ThunderTrader : ThunderRainbow
ThunderLight is indicator to track or calculate hidden demand, supply and accumulation where the whales prepare for next pump or next dump
Time Frame Rules:
It works for any timeframes below 1W, but some times it will not work for new listing until sufficient data are appeared
TF 30m is very good for entry plan
TF 1H is very good daily tracking
TF 4H is very good for weekly tracking
Disclaimer:
The high demand or high accumulation signal will not immediately trigger the pump. It can take some times, usually TF 1H will trigger the action from 8 to 24 hours.
The high demand or high accumulation signal is not always pump identification but also mini rally or uptrend
The high supply is not alway high dump or end of trend, if it's followed by supply it can continue to pump rally
Alert System:
You can integrate ThunderRainbow or ThunderLight to your Alert System, so that you will not miss the pump by the whales
This is for VIP membership, if you want trial version, please visit:

FOMC Federal Fund Rate Tracker [MHA Finverse]The FOMC Rate Tracker is a comprehensive indicator that visualizes Federal Reserve interest rate decisions and tracks market behavior during FOMC meeting periods. This tool helps traders analyze historical rate changes and anticipate market movements around Federal Open Market Committee announcements.
Key Features:
• Visual FOMC Periods - Automatically highlights each FOMC meeting period with colored boxes spanning from announcement to the next meeting
• Complete Rate Data - Displays actual rates, forecasts, previous rates, and rate differences for every meeting from 2021-2026
• Multiple Color Modes - Choose between cycle colors for visual distinction or rate difference colors (green for hikes, red for cuts, gray for holds)
• Smart Filtering - Filter periods by rate hikes only, cuts only, no change, or surprise moves to focus on specific market conditions
• Performance Metrics - Track average returns during rate hikes, cuts, and holds to identify historical patterns
• Volatility Analysis - Measure and compare price volatility across different FOMC periods
• Statistical Dashboard - View total hikes, cuts, holds, surprises, and longest hold streaks at a glance
• Built-in Alerts - Get notified 1 day before FOMC meetings, on meeting day, or when rates change
How It Works:
The indicator divides your chart into distinct periods between FOMC meetings, with each period showing a labeled box containing the meeting date, actual rate, forecast, previous rate, and rate difference. Future meetings are marked as "UPCOMING" to help you prepare for scheduled announcements.
Use Cases:
- Analyze how markets typically react to rate hikes vs. cuts
- Identify volatility patterns around FOMC announcements
- Backtest strategies based on monetary policy cycles
- Plan trades around upcoming Federal Reserve meetings
- Study the impact of surprise rate decisions on price action
Customization Options:
- Adjustable box transparency and outlines
- Customizable label sizes and colors
- Toggle individual dashboards on/off
- Filter specific types of rate decisions
- Configure alert preferences
This indicator is ideal for traders who incorporate fundamental analysis and monetary policy into their trading decisions. The historical data provides context for understanding market reactions to Federal Reserve actions.

FiboBot Position TrackerManual position tracking overlay with Fibonacci levels, ATR-based stops, and Chandelier trailing stop. Visualizes entries, targets, stop losses with real-time P&L and R:R calculations.
#### Features
Position Visualization
- Two entry levels with average entry calculation
- Two target levels (T1 and T2)
- Original pivot points display (SP1/SP2 for shorts, LP1/LP2 for longs)
Stop Loss Management
- Fixed initial stop loss (typically ATR-based)
- Chandelier Trailing Stop - Activates after Target 1 is hit
- Automatic breakeven protection after T1
- Visual distinction between fixed and trailing stops
### Chandelier Trailing Stop Logic
The Chandelier stop provides dynamic trailing protection after your first target is hit:
For SHORT positions:
- Tracks the lowest low since position opened
- Stop = Lowest Low + (ATR × Chandelier Multiple)
- Only moves down (in your favor), never up
For LONG positions:
- Tracks the highest high since position opened
- Stop = Highest High - (ATR × Chandelier Multiple)
- Only moves up (in your favor), never down
After T1 Hit:
- Stop automatically moves to at least breakeven
- Chandelier can trail beyond breakeven if price continues favorably

VIX Spike/Drop TrackerWhat It Does
Core Functionality:
Monitors daily VIX percentage changes and identifies significant spikes (fear increases) and drops (fear decreases)
Backtests historical SPY performance following VIX events across multiple timeframes (1-day, 2-day, 3-day, and 1-week)
Calculates win rates and average returns for each scenario
Provides real-time VIX statistics including percentile rankings, distance from moving average, and momentum
Key Features:
Historical Analysis: Analyzes up to 2,500 bars of historical data to build robust statistical profiles
Dual Event Tracking: Separate statistics for VIX spikes (fear events) and VIX drops (fear subsiding)
Performance Metrics: Shows average SPY returns and win rates at 1, 2, 3, and 5-day intervals
VIX Context: Real-time VIX level, daily change, moving average distance, percentile rank, and 3-day momentum
Smart Predictions: Context-aware signals based on VIX patterns and consecutive spike/drop days
Visual Alerts: Chart annotations and background highlighting for significant events
How to Use It
Setup:
Add the indicator to your chart (works on any timeframe, but analyzes daily data)
Adjust the VIX threshold (default 10%) to define what constitutes a "significant" move
Set the historical lookback period (500 bars = ~2 years of data)
Reading the Statistics Table:
Left side: Statistics for VIX spikes (when fear increases)
Right side: Statistics for VIX drops (when fear decreases)
D1/D2/D3/Wk columns: Average SPY returns 1, 2, 3, and 5 days after the VIX event
Win %: Percentage of time SPY was positive at each interval
n: Sample size (number of historical events analyzed)
Bottom row: Current VIX statistics and market positioning
Interpreting Predictions:
🔴 "FEAR SPIKE - SPY LIKELY DOWN": VIX spiking, historical data shows negative SPY tendency
🟢 "FEAR SUBSIDING - SPY LIKELY UP": VIX dropping, historical data shows positive SPY tendency
🟠 "VIX ELEVATED - MEAN REVERSION DUE": VIX extended above its moving average
🟡 "VIX SUPPRESSED - COMPLACENCY RISK": VIX unusually low, potential volatility expansion ahead
Best Practices
Use this as a statistical context tool, not a standalone trading signal
Combine with your own technical analysis and risk management
Pay attention to win rates alongside average returns for edge assessment
Monitor consecutive spike/drop days for potential mean reversion setups
Higher sample sizes (n) provide more reliable statistics
Customization
Fully customizable colors, threshold levels, table size, and VIX moving average period. Enable/disable chart labels based on your preference for clean charts.
This indicator provides historical statistical context and does not guarantee future performance. Past results do not predict future outcomes.

Real Time UVXY Spike Level TrackerKey Features
Real Time All-Time Low Tracking: Continuously updates the ATL using daily timeframe data.
Multiple Spike Levels: Displays +20%, +50%, +75%, and +100% levels above the ATL.
Real-Time Spike Percentage: Shows current distance from ATL in an easy-to-read table.
Understanding the Chart Lines
Red Line (ATL): The all-time low baseline. This is your reference point for measuring volatility spikes.
Yellow Line (+20%): First level of moderate volatility increase. Minor market stress or routine volatility expansion.
Blue Line (+50%): Significant volatility event. Indicates elevated market concern or technical dislocation.
Purple Line (+75%): Major volatility spike. Typically coincides with substantial market selloffs or uncertainty.
Fuchsia Line (+100%): Extreme volatility event. Rare occurrences associated with market crashes, black swan events, or severe panic.
The Data Table Displays: Current Spike %: Real-time percentage showing how far price is above the ATL (highlighted in green)
Level Column: Each spike threshold level
Price Column: Exact price at each level for quick reference
Understanding UVXY spike levels is valuable for several reasons:
Market Timing & Entry/Exit Points UVXY typically experiences extreme spikes during market panics or crashes. Knowing historical spike levels helps you:
Identify extreme fear levels - When UVXY hits unusually high levels, it often signals peak panic and potential market bottoms
Avoid chasing volatility - Understanding what constitutes an "extreme" spike prevents buying in after the move is already exhausted Mean Reversion Trading
UVXY has a strong tendency to decay over time due to its leveraged structure and the contango in VIX futures. Spike levels matter because:
High probability reversals - When UVXY reaches extreme levels (say 2-3x normal), there's historically been a high probability of reversion
Risk/reward assessment - You can better evaluate whether a short position or volatility-selling strategy makes sense Leveraged ETF enthusiasts and volatility traders often use specific spike percentages as triggers to open short positions. For example, some traders might short when UVXY spikes 5-50%+ in a week or reaches certain percentage thresholds, betting on the inevitable decay back down

Price Imbalance Flow Tracker (PIFT)Price Imbalance Flow Tracker (PIFT)
PIFT is a visual volatility and structure indicator that maps market imbalance zones using dynamic envelope logic. It plots three sets of envelope bands derived from different moving averages — short, medium, and long — with volatility-based offsets scaled by ATR. These envelopes adapt in real time to reflect momentum expansion, compression, and directional pressure.
- The system highlights only the dominant envelope layer at any given moment (short cancels medium/long, medium cancels long) to reduce clutter and help you focus on the most reactive structure.
- There’s also a central yellow zone representing the core trend channel — a tighter band derived from the short MA, helping you track price containment and breakout zones.
- The green and red fills show where price is expanding beyond core levels, acting as pressure zones. These fills compress during consolidations and widen during impulse moves, giving you a clean read on momentum shifts.
You can toggle:
- Full grid view (all envelopes)
- Core channel only
- Price tracks (moving averages)
- Dynamic pressure zones
Use PIFT to:
- Identify clean trend continuation inside the yellow zone
- Spot momentum exhaustion when price rides the outer bands
- Filter false moves when fills contract but price keeps drifting
- See structure shifts before standard indicators like Bollinger Bands react
This isn’t just another moving average overlay. It’s a dynamic envelope hierarchy built for traders who want to read price flow — not just lagging trend direction.
See the following images for a more in-depth breakdown.
1.)
2.)
3.)
4.)
5.)
6.)
7.)
8.)
9.)
10.)
11.)
12.)
13.)
14.)

London Breakout Tracker - Box Style📊 London Breakout Tracker (Pine Script v6)
This script is designed to track the Asian session range and identify breakout opportunities when the London session begins. It highlights high-probability trade setups and helps avoid fakeouts or overly wide ranges.
🧱 1. Session Time Definitions (Adjusted for Kenyan Time)
The Asian session is defined as:
3:00 AM to 11:00 AM (Kenyan Time)
🔐 2. Asian Session High & Low
During the Asian session:
The script tracks the highest high and lowest low to define the range.
These are stored in variables: asianHigh and asianLow.
🧊 3. Box Drawing for the Asian Range
Once the Asian session ends:
A visual box is drawn around the session using box.new().
This box spans from the session start to end bars and from the high to low.
It helps visually see the range price must break out from.
🚨 4. Breakout Signals
After the Asian session:
A Long Breakout signal is generated if:
The candle closes above the Asian High.
A Short Breakout signal is generated if:
The candle closes below the Asian Low.
This corresponds to 00:00 to 08:00 UTC
These are shown with:
✅ Green up label for long breakouts
❌ Red down label for short breakouts
🧯 5. Fakeout Detection
If price breaks out but closes back inside the Asian range, it’s marked as a Fakeout:
Long Fakeout: Price breaks above high, then closes back below.
Short Fakeout: Price breaks below low, then closes back above.
These are marked with orange X-crosses above or below candles.
⚠️ 6. Wide Range Filter
If the Asian session range is too wide (e.g. > 40 pips), a gray background is drawn.
This warns you not to trade that day since breakouts from wide ranges are unreliable.
📣 7. Alert Conditions
The script can trigger alerts in TradingView when:
🔔 A Long or Short Breakout occurs
⚠️ A Fakeout is detected
You can set these up via the TradingView alert system.
🎯 Overall Purpose:
The script helps you:
Clearly see the Asian session range
Identify breakout opportunities at the London open
Avoid trading during fakeouts or wide-range sessions
Get alerted when breakout/fakeout conditions occur

POA Volume TrackerCustomizable Volume Tracker Indicator
This custom TradingView indicator tracks and displays volume data across three key market sessions: Pre-Market, Open Market, and After-Hours. It is designed to give traders insights into the volume activity during these distinct trading periods, helping them make more informed decisions.
Key Features:
Pre-Market Volume (PMV): Shows the total volume of trades during the pre-market session.
Open Market Volume (OMV): Displays the total volume during regular market hours.
After-Hours Volume (AHV): Shows the total volume in the after-hours session.
All three values are displayed in an easy-to-read format, and the script includes the following customization options:
Adjustable Label Position: Choose between placing the label Above the current candle or to the Right side of the candle.
Customizable Offsets: Adjust the vertical and horizontal positioning of the label to suit your preferences.
Volume Formatting: The script automatically formats the volume values for easier readability, displaying large volumes with suffixes like "k" for thousands and "M" for millions.
Customization Options:
Text Size: Choose the size of the text used in the label.
Text and Background Colors: Adjust the color of the label text and background to match your chart style.
Positioning: Move the label up or down, and adjust how far to the right (or left) it appears next to the current candle.
Volume Formatting: Automatically formats volume values to be more readable (e.g., 1,250,000 becomes 1.25M).
This indicator is perfect for traders who want to keep track of volume data for different market sessions and adjust how that data is displayed on their charts in a clear and customizable manner.
How to Use:
Add this script to your chart, and choose your desired market session timeframes.
Use the input options to adjust the label’s position and appearance.
View the real-time volume data for Pre-Market, Open Market, and After-Hours, all in one place.
You wanna catch some gainz? pair this with the Market Cap indicator for some solid TA and catch some $ with the big boys.

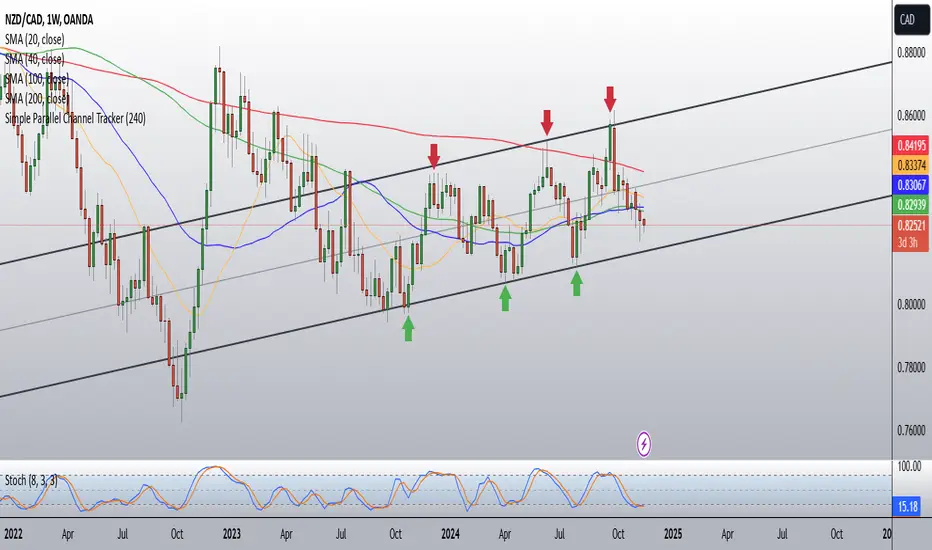
Simple Parallel Channel TrackerThis script will automatically draw price channels with two parallel trends lines, the upper trendline and lower trendline. These lines can be changed in terms of appearance at any time.
The Script takes in fractals from local and historic price action points and connects them over a certain period or amount of candles as inputted by the user. It tracks the most recent highs and lows formed and uses this data to determine where the channel begins.
The Script will decide whether to use the most recent high, or low, depending on what comes first.
Why is this useful?
Often, Traders either have no trend lines on their charts, or they draw them incorrectly. Whichever category a trader falls into, there can only be benefits from having Trend lines and Parallel Channels drawn automatically.
Trends naturally occur in all Markets, all the time. These oscillations when tracked allow for a more reliable following of Markets and management of Market cycles.