Volumes on CandleThis script uses standard deviation of volume from the mean to color the candles.
IMPORTANT: Hide original candle, clicking in the "eye" near title.
I prefer use large Length input for more stability at mean and standard deviation values.
Uses 5 colors, by default:
Red = Volume >= 4 stdev;
Orange = 4 stdev > Volume >= 2.5 stdev;
Yellow = 2.5 stdev > Volume >= 1 stdev;
White = 1 stdev > Volume >= -0.5 stdev;
Aqua = -0.5 stdev > Volume.
I coded another script, called "Colored Volumes Histogram". It uses the same idea, but color directly the volume histogram.
Cari dalam skrip untuk "volume"

Volume Pressure and PercentVPP Volume Pressure and Percentage Indicator with a Volume Trendline that indicates which side is driving the flow.
Features:
1. Buy/Sell Pressure Bars (Core Volume Split)
The indicator separates each candle’s volume into buy volume (green) above the zero line and sell volume (red) below it. This gives you a real-time visualization of which side is more aggressive within the current bar. Instead of waiting for prices to move or candles to close, you can instantly see whether buyers or sellers are stepping in.
2. Dynamic Total Volume (Invisible Histogram + Status Line Color)
The total volume of each bar is tracked behind the scenes and displayed in the pinned status line using a dynamic color—green when buyers dominate, red when sellers dominate. The histogram for total volume is invisible to keep the chart clean, but the total volume figure stays visible and changes color based on who is in control. This gives you instant confirmation of whether institutional-sized volume supports the direction shown by the buy/sell pressure, which is especially valuable when evaluating the risk or conviction behind a potential entry.
3. Percentage Mode (% of Bar Volume)
When toggled on, the indicator converts each bar into percent buy vs percent sell, normalizing all flow to a 0–100% scale. This mode is incredibly useful when comparing pressure across different times of day, gaps, or varying volume conditions—such as early morning spikes versus lunchtime chop. By removing absolute volume from the equation, you gain a clean look at the actual imbalance between buyers and sellers.
4. 70% Pressure Band (Imbalance Threshold Zone)
In percentage mode, the indicator displays a subtle 70% band (a light gray zone) above and below the zero line, showing where buy or sell pressure reaches extreme dominance (≥70%). When a bar’s buy or sell percentage enters this zone, it highlights moments of exhaustion, acceleration, or potential reversal. The band acts like a real-time overbought/oversold gauge specifically for volume imbalance, not price.
5. Trend Line (Net Pressure Trend / Reversal Detector)
The trend line smooths out the net volume pressure (buy volume minus sell volume or its percentage equivalent) and shows the overall direction of order flow. When the line slopes upward, buyers are gaining control; when it slopes downward, sellers are taking over. This trend line acts as a real-time momentum indicator based directly on flow rather than price. Because it reacts quickly to intrabar shifts in buy/sell pressure, it often turns before price does—giving you a measurable timing edge.
6. Auto-Selecting Trend Source (Volume Net, Percent Net, or CVD)
The indicator lets you choose how the trend line is calculated: Volume Net (buy minus sell volume), Percent Net (normalized imbalance), or CVD (Cumulative Volume Delta) for long-term flow bias. The default “Auto” mode automatically switches between Volume Net and Percent Net depending on which view you’re using. This flexibility allows the trend line to remain meaningful whether you’re analyzing raw volume or normalized percentage data.
7. Pinned (Status Line) Totals in K/M/B Format
Regardless of whether you’re in volume or percentage mode, the indicator always displays Total Volume, Buy Volume, and Sell Volume in the status line using abbreviated K, M, B formatting. These values update in real time and are color-coded: green for bullish dominance, red for bearish. This gives you a concise snapshot of order flow strength on every bar.
---------------------
How To Use:
Support Level Zones
• Watch for Buy bars increasing + Trend line flipping up right at or slightly below support.
• This often signals absorption — market makers filling large buy orders before reversal.
• Confirmation: Price reclaims VWAP ... enter calls / longs.
Resistance Level Zones
• Watch for Sell bars increasing + Trend line flattening/turning down near resistance.
• This signals distribution or stop runs.
• Confirmation: Price rejects VWAP ... enter puts / shorts.
Breakout Traps
• Sometimes you’ll see price break a level, but the flow doesn’t confirm (buy volume doesn’t expand).
• That’s a false breakout — fade it with options opposite the move.

Volume Cluster Heatmap [BackQuant]Volume Cluster Heatmap
A visualization tool that maps traded volume across price levels over a chosen lookback period. It highlights where the market builds balance through heavy participation and where it moves efficiently through low-volume zones. By combining a heatmap, volume profile, and high/low volume node detection, this indicator reveals structural areas of support, resistance, and liquidity that drive price behavior.
What Are Volume Clusters?
A volume cluster is a horizontal aggregation of traded volume at specific price levels, showing where market participants concentrated their buying and selling.
High Volume Nodes (HVN) : Price levels with significant trading activity; often act as support or resistance.
Low Volume Nodes (LVN) : Price levels with little trading activity; price moves quickly through these areas, reflecting low liquidity.
Volume clusters help identify key structural zones, reveal potential reversals, and gauge market efficiency by highlighting where the market is balanced versus areas of thin liquidity.
By creating heatmaps, profiles, and highlighting high and low volume nodes (HVNs and LVNs), it allows traders to see where the market builds balance and where it moves efficiently through thin liquidity zones.
Example: Bitcoin breaking away from the high-volume zone near 118k and moving cleanly through the low-volume pocket around 113k–115k, illustrating how markets seek efficiency:
Core Features
Visual Analysis Components:
Heatmap Display : Displays volume intensity as colored boxes, lines, or a combination for a dynamic view of market participation.
Volume Profile Overlay : Shows cumulative volume per price level along the right-hand side of the chart.
HVN & LVN Labels : Marks high and low volume nodes with color-coded lines and labels.
Customizable Colors & Transparency : Adjust high and low volume colors and minimum transparency for clear differentiation.
Session Reset & Timeframe Control : Dynamically resets clusters at the start of new sessions or chosen timeframes (intraday, daily, weekly).
Alerts
HVN / LVN Alerts : Notify when price reaches a significant high or low volume node.
High Volume Zone Alerts : Trigger when price enters the top X% of cumulative volume, signaling key areas of market interest.
How It Works
Each bar’s volume is distributed proportionally across the horizontal price levels it touches. Over the lookback period, this builds a cumulative volume profile, identifying price levels with the most and least trading activity. The highest cumulative volume levels become HVNs, while the lowest are LVNs. A side volume profile shows aggregated volume per level, and a heatmap overlay visually reinforces market structure.
Applications for Traders
Identify strong support and resistance at HVNs.
Detect areas of low liquidity where price may move quickly (LVNs).
Determine market balance zones where price may consolidate.
Filter noise: because volume clusters aggregate activity into levels, minor fluctuations and irrelevant micro-moves are removed, simplifying analysis and improving strategy development.
Combine with other indicators such as VWAP, Supertrend, or CVD for higher-probability entries and exits.
Use volume clusters to anticipate price reactions to breaking points in thin liquidity zones.
Advanced Display Options
Heatmap Styles : Boxes, lines, or both. Boxes provide a traditional heatmap, lines are better for high granularity data.
Line Mode Example : Simplified line visualization for easier reading at high level counts:
Profile Width & Offset : Adjust spacing and placement of the volume profile for clarity alongside price.
Transparency Control : Lower transparency for more opaque visualization of high-volume zones.
Best Practices for Usage
Reduce the number of levels when using line mode to avoid clutter.
Use HVN and LVN markers in conjunction with volume profiles to plan entries and exits.
Apply session resets to monitor intraday vs. multi-day volume accumulation.
Combine with other technical indicators to confirm high-probability trading signals.
Watch price interactions with LVNs for potential rapid movements and with HVNs for possible support/resistance or reversals.
Technical Notes
Each bar contributes volume proportionally to the price levels it spans, creating a dynamic and accurate representation of traded interest.
Volume profiles are scaled and offset for visual clarity alongside live price.
Alerts are fully integrated for HVN/LVN interaction and high-volume zone entries.
Optimized to handle large lookback windows and numerous price levels efficiently without performance degradation.
This indicator is ideal for understanding market structure, detecting key liquidity areas, and filtering out noise to model price more accurately in high-frequency or algorithmic strategies.

Volume Spikes + Daily VWAP SD BandsVolume Spikes + Daily VWAP SD Bands
This indicator combines volume spike detection to help traders identify potential absorption zones with daily VWAP and standard deviation bands , key price levels, continuation opportunities, and possible institutional bias.
Features:
Volume Spike Detection
Highlights candles with unusually high volume relative to a configurable SMA.
Optional filters:
Local highs/lows only (Only Use Valid Highs & Lows)
Candle shapes: Hammer / Shooter only
Candle color match: bullish spikes on green, bearish on red
Plots small circles above/below bars for bullish and bearish volume spikes.
Alerts available for both bullish and bearish spikes.
Interpretation: Volume spikes at local highs/lows can indicate absorption, where one side absorbs aggressive buying/selling pressure.
Daily VWAP
Calculates volume-weighted average price (VWAP) for the current day.
Optionally shows previous day’s VWAP for reference.
Plot lines are customizable with optional circles on lines for visual clarity.
Labels on the last bar show exact VWAP values.
Institutional Bias Insight: Price above both current and previous VWAPs may indicate bullish positioning; price below both VWAPs may indicate bearish positioning. Many professional traders consider this a clue to institutional bias, but it’s not guaranteed. Always confirm with volume, delta, or orderflow analysis.
Standard Deviation Bands
Optional x1 and x2 SD bands around the daily VWAP.
Visual fill between bands shows price volatility zones.
Can be used to identify potential support/resistance or absorption zones.
Use Case: Price bounces off first SD band may indicate continuation signals, especially when volume spikes occur at those levels.
Customizable Visuals
Colors for bullish and bearish volume spikes
VWAP and SD band colors and thickness
Optional circles and filled bands for better readability
Alerts
Bullish / Bearish Volume Spikes
Supports TradingView alert system for automated notifications
Advanced Use Cases:
Combine with Cumulative Delta or Orderflow tools to confirm true absorption zones.
Identify high-volume rejection candles signaling possible trend continuation.
Use VWAP positioning relative to price to assess potential institutional bias, keeping in mind it is probabilistic, not guaranteed.
Visualize intraday VWAP levels and volatility with SD bands for better trade timing.
Settings: Fully customizable, including volume multiplier, SMA length, session filter, candle shape, color options, and VWAP/SD display preferences.

Volume Delta DashboardHow It Works:
This script creates a Volume Delta Dashboard on TradingView, which helps traders visualize the balance between buying and selling volume (Volume Delta) directly on the chart. Here's a breakdown of the key components:
Volume Delta Calculation:
The script calculates the Volume Delta by comparing the volume of bars where the price closed higher (buying pressure) to those where the price closed lower (selling pressure).
Positive Volume Delta (green background) indicates more buying activity than selling, suggesting upward price movement. Negative Volume Delta (red background) indicates more selling than buying, signaling a potential downward move.
Smoothing with EMA:
To make the volume delta trend smoother and more consistent, an Exponential Moving Average (EMA) of the Volume Delta is used. This helps to reduce noise and highlight the prevailing buying or selling pressure over a 14-period.
Dynamic Position Selection:
The user can choose where the Volume Delta dashboard table will appear on the chart by selecting a position: top-left, top-right, bottom-left, or bottom-right. This makes the indicator adaptable to different chart setups.
Coloring:
The background of the table changes color based on the value of the Volume Delta. Green indicates a positive delta (more buyers), and Red indicates a negative delta (more sellers).
Use of This Strategy:
This Volume Delta Dashboard strategy is particularly useful for traders who want to:
Monitor Market Sentiment:
By observing the volume delta, traders can get a sense of whether there is more buying or selling pressure in the market. Positive volume delta can indicate a bullish sentiment, while negative delta can point to bearish sentiment.
Confirm Price Action:
The Volume Delta can be used alongside price action to confirm the strength of a price move. For example, if the price is moving up and the volume delta is positive, it suggests that the price increase is supported by buying pressure.
Identify Divergences:
Volume delta can help traders spot divergences between price and volume. For example, if the price is moving higher but the volume delta is negative, it may suggest a weakening trend and a potential reversal.
Optimize Entry/Exit Points:
By understanding the relationship between price movement and volume, traders can make more informed decisions about entering or exiting positions. For instance, a sudden increase in buying volume (positive delta) may indicate a good entry point for a long position.
Overall, the Volume Delta Dashboard can serve as a powerful tool for improving decision-making, by providing real-time insights into market dynamics and trading sentiment.

Volume Zones Internal Visualizer [LuxAlgo]The Volume Zones Internal Visualizer is an alternate candle type intended to reveal lower timeframe volume activity while on a higher timeframe chart.
It displays the candle's range, the highest and lowest zones of accumulated volume throughout the candle, and the Lower Timeframe (LTF) candle close, which contained the most volume in the session (Candle Session).
🔶 USAGE
The indicator is intended to be used as its own independent candle type. It is not a replacement for traditional candlesticks; however, it is recommended that you hide the chart's display when using this indicator. Another option is to display this indicator in an additional pane alongside the normal chart, as displayed above.
The display consists of candle ranges represented by outlined boxes, within the ranges you will notice a transparent-colored zone, a solid-colored zone, and a line.
Each of these displays different points of volume-related information from an analysis of LTF data.
In addition to this analysis, the indicator also locates the LTF candle with the highest volume, and displays its close represented by the line. This line is considered as the "Peak Activity Level" (PAL), since throughout the (HTF) candle session, this candle's close is the outcome of the most volume transacted at the time.
We are further tracking these PALs by continuing to extend them into the future, looking towards them for potential further interaction. Once a PAL is crossed, we are removing it from display as it has been mitigated.
🔶 DETAILS
The indicator aggregates the volume data from each LTF candle and creates a volume profile from it; the number of rows in the profile is determined by the "Row Size" setting.
With this profile, it locates and displays the highest (solid area) and lowest (transparent area) volume zones from the profile created.
🔶 SETTINGS
Row Size: Sets the number of rows used for the calculation of the volume profile based on LTF data.
Intrabar Timeframe: Sets the Lower Timeframe to use for calculations.
Show Last Unmitigated PALs: Choose how many Unmitigated PALs to extend.
Style: Toggle on and off features, as well as adjust colors for each.

Volume Profile [ZeroHeroTrading]Volume Profile by ZeroHeroTrading provides Volume Profile information fully leveraging the high/low values associated with the volume. As such, it closely aligns with the price action.
You can change the indicator settings as you see fit to achieve the best results for your use case.
Algorithm Notes
The indicator retrieves high/low/volume data within the set lookback period (number of bars back). It then sorts high/low boundaries, and accumulates the volume within the boundaries. Finally, it draws the Volume Profile as a filled out polyline joining all the boundaries together with the relevant accumulated volume proportion, and the POC as a box between the boundaries with the highest accumulated volume starting from the lookback.
When the lookback period is based on days back (instead of bars back), the indicator first dynamically calculates the number of bars to look back within the set number of days.
Please note that the lookback upper limit is 1000 bars back regardless of the settings. For instance, if the requested number of days results in the calculated bars back count (relative to the chart's timeframe) to be higher than 1000, the effective lookback will be 1000 bars back.
Features
It draws the Volume Profile and POC on the chart.
It allows for setting the number of bars or days to look back for retrieving the volume information.
It allows for setting the length of the Volume Profile being displayed (as a number of bars).
It allows for setting the offset from the last bar for the Volume Profile being displayed (as a number of bars).
It allows for setting the orientation of the Volume Profile being displayed from right to left and vice versa.
It allows for setting the colors for the Volume Profile and POC.
It allows for turning the POC functionality on/off.
Settings
Volume Lookback field: Sets number of bars or days to look back for retrieving the volume information. If the Volume Lookback field is set to 0, the volume data is retrieved for the current day regardless of the Bar(s)/Day(s) selection. Default is 200. Minimum is 0 and maximum is 1000.
Volume Lookback dropdown: If Bar(s) is selected, the volume data is retrieved for the set number of bars back. If Day(s) is selected, the volume data is retrieved for the current day plus the set number of day(s) back. Default is Bar(s).
Profile Bar Length field: Sets length of the Volume Profile being displayed as a number of bars. Default is 50. Minimum is 10 and maximum is 100.
Profile Bar Offset field: Sets offset from the last bar for the Volume Profile being displayed as a number of bars. Default is 10. Minimum is 0 and maximum is 100.
Profile Orientation dropdown: Selects Volume Profile orientation. Left is -right to left- and Right is -left to right-. Default is Left.
Profile Color select: Selects Volume Profile color. Default is blue (100% opacity).
Show POC checkbox: Turns on/off POC. Default is on.
POC Color select: Selects POC color. Default is orange (80% opacity).

Volume 20% Above 100-day Avg & Below 200-day MAThis custom indicator is designed to assist cryptocurrency traders in identifying potential trading opportunities based on volume and moving average analysis. It highlights tokens that meet specific criteria, helping users to gauge potential market strength and reversals.
Features:
Volume Above 100-day Average: The indicator plots the 100-day volume average on the chart (blue line) and displays the percentage change in volume from the average (gray line). Green columns indicate volumes that are 20% or more above the 100-day average.
Below 200-day Moving Average: The indicator calculates and plots the 200-day moving average (orange line) of the token's closing price. This moving average acts as a long-term trend reference.
Market Conditions Highlighting: When the token's volume is above the 100-day average and the closing price is below the 200-day moving average, the indicator highlights the bars in the chart with a transparent red color. This condition can be indicative of potential reversal opportunities.
How to Use:
Volume Strength: Observe the green columns on the chart, which indicate periods of higher-than-average volume. These spikes can suggest increased market interest and potential price movements.
Long-Term Trend: Monitor the position of the closing price concerning the 200-day moving average. Prices below the moving average suggest a potential downtrend, while prices above the moving average imply a potential uptrend.
Reversal Opportunities: Focus on bars highlighted with a transparent red color. These are instances when the token's volume is above the 100-day average, while the closing price is below the 200-day moving average. Such situations may indicate potential reversal points.
Please note that this indicator should not be used in isolation for trading decisions. It is essential to combine it with other technical and fundamental analysis tools to form a comprehensive trading strategy.
Remember to backtest this indicator on historical data and adjust the input parameters to suit your trading preferences and risk tolerance.
Disclaimer: Trading cryptocurrencies involves significant risk, and past performance does not guarantee future results. Always exercise caution and perform your research before making any trading decisions.

Volume Spike Scanner█ OVERVIEW
This script adds a volume spike scanner table to the top-right of the chart space. Table cells light up with colored signals when volume spikes occur on the associated tickers on a low timeframe. The colored signals correspond to different levels of volume spike intensity and the table columns are continuously sorted so that the tickers with the most intense volume spikes are always at the top. One table can have up to 40 tickers (this is a pine script limitation) and the indicator comes with 7 pre-load ticker lists. (6 stock lists and 1 crypto list) Add the indicator several times and use all the pre-load lists to scan 280 stocks and 40 cryptocurrencies simultaneously.
By monitoring so many tickers simultaneously for volume spikes you will have early awareness of tickers that are reacting to catalysts/news. In some cases there may be no known catalyst, but the ticker is still making a significant move with high volume. Getting to these charts early in the move can provide trade-able opportunities.
█ SIGNALS
There are 6 signals for increasing levels of volume spike intensity
Orange - Most Intense
Yellow
Green
Light Green
Blue
Pink - Least Intense
█ USER INPUTS
Alerts
Check the boxes in the Alerts section next to the color signals you want alerts for. Then after closing the user inputs pane right-click on the table and select "Add Alert on ..."
Filters
Currently the only filter available is the Minimum Volume Filter. More filters may be added on future updates.
When this filter is turned on any signals that are generated by a spike that has volume below the set value will be filtered out and will not show up on the scanner.
The default value of 10,000 is recommended for stocks. There is no recommendation for crypto.
Positioning
• Compact Mode - Reduces the table width to about half size to conserve screen space.
• Table Number - Table number 1 is the farthest right position. Each increase in this value by 1 will move the table roughly one table space inward from the right side of the chart.
• Move Down - Each increment of 1 will move the table downward roughly the height of one table row.
Usually the lowest rows of the table are insignificant so it's okay to move the table down and have these rows offscreen.
• Left/Right Spacing - Each increment of 1 or -1 will move the table slightly left and right respectively. This is for fine tuning the left/right positioning if you like all your tables equally spaced.
Ticker Lists
• Pre-Built List # - The first release of this script contains seven pre-built lists each containing 40 tickers. Lists 1 thru 6 are all stocks. List 7 is all crypto.
For day trading stocks and options add the indicator 6 times to the chart, set the tables side by side, and set a different pre-built list number for each table.
• Symbol Lists - The pre-built lists can all be customized to your preference. Remove tickers you don't like and replace with ones you like. Save your lists as the new default.
Also not every table has to contain 40 tickers. You can uncheck the boxes next to the tickers to shorten the list.
█ TIPS
General
1 — Use news alert/notification services to add context to volume spikes and resulting price movements.
2 — When a ticker goes straight to the highest two signals (Orange and Yellow) that is usually noteworthy
and worth looking at the ticker's chart to see how the volume inflow is affecting price.
3 — When the lowest signals (Pink and Blue) appear for a ticker that is often not noteworthy except in the most liquid tickers
4 — It is best to use a multi-chart layout with one chart in the layout dedicated to the scanner.
This will allow you to switch tickers on the other charts without re-rendering the tables each time.
Set the chart dedicated to the scanner to the 3m timeframe or lower due to an issue mentioned lower down.
To make the scanner easier to see you can turn off visibility of all chart features on this chart.
Stocks
1 — Very liquid stocks such as AAPL, AMZN, MSFT, TSLA, NVDA, NFLX, BA, GOOGL, META, etc. rarely have volume spikes that give the highest signals (Orange and Yellow).
For these tickers the lower signals are significant. To prevent them from getting lost at the bottom of a 40 ticker table you can give them their own dedicated table
along with other favorite stocks to ensure they are always easily visible. You can set alerts for the lower level signals on this table.
2 — To use all 6 pre-loaded stock lists and scan 240 stocks simultaneously add the indicator 6 times.
Each time you add the indicator customize the user incrementing the Table Number and Pre-Load List #. This will give you 6 tables side-by-side with 40 tickers each.
3 — The Minimum Volume Filter is recommended to be set on and at the default value for the stock pre-load lists.
Crypto
1 — The Minimum Volume Filter is recommended to be set off for the crypto list.
2 — Use mobile app notifications to get 24/7 crypto volume spike alerts to your phone.
█ KNOWN ISSUES
Alerts are sometimes given more than once for the same volume spike signal.
The table does not display when using higher timeframes. It is recommended to use a split chart layout and dedicate one section of the layout to this indicator. Set the timeframe on this section to 3m or lower.
If fixes are found for the above issues they will be included in future updates.
█ SPECIAL THANKS
With permission this script utilizes some of the logic from the open-source script "Screener for 40+ instruments" by QuantNomad.

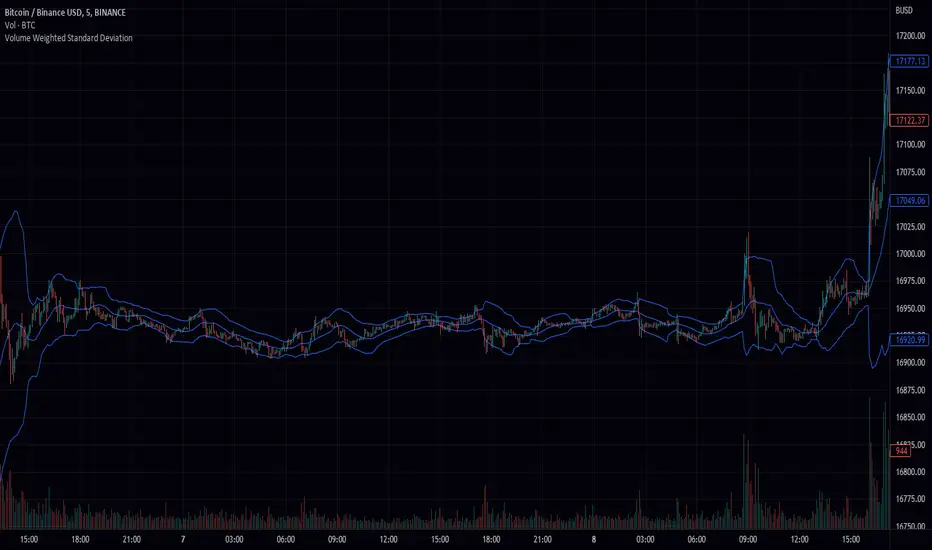
Volume Weighted Standard Deviation (VWSD)The Volume Weighted Standard Deviation indicator is a custom technical analysis tool that uses the volume of trading to calculate the standard deviation of a stock's price. This indicator takes the source of data, the length of data, and the deviation as inputs, and calculates the volume weighted standard deviation using the values.
The indicator first calculates the mean price and mean volume by using simple moving average over the given length of data. Then it calculates the squared difference between the mean price and the actual price, multiplied by the volume. This gives a volume-weighted squared difference. The indicator then calculates the square root of the sum of the volume-weighted squared differences divided by the sum of the volumes over the given length of data. This gives the volume weighted standard deviation.
The indicator then plots the standard deviation and deviation as a band around the simple moving average of the source data, providing a clear view of the volatility of the stock.
In summary, the Volume Weighted Standard Deviation indicator is a powerful tool for measuring the volatility of a stock by taking into account the volume of trading. It uses the volume of trading to calculate the standard deviation of a stock's price, giving a more accurate representation of the volatility of the stock. It can be useful for traders to identify entry and exit points and make more informed trading decisions.
Volume CVD and Open Interest HeatmapTaking Volume and Open Interest data to the next level of visualization I created a 'heatmap'. The indicator uses a colour gradient and plots boxes from the source candle to the current candle with one of the following data sources:
- Volume - the total volume of transactions, buys and sells
- Up Volume - the total volume from buys only
- Down Volume - the total volume from sells only
- Up/Down Volume (Net) - the difference in the Buy Volume and Sell Volume
- Cumulative Delta - the sum of the up/down volume for the previous 14 bars
- Cumulative Delta EMA - a smoothed average of the sum of the up/down volume for the previous 14 bars, over a 14 period EMA
- Open Interest - a user defined ticker, whose value is added to the plot, while this is designed to be used with Open Interest tickers, you can actually choose any ticker you want, perhaps you want to see DXY while charting Bitcoin!
You can define the lookback period, though you should make sure your timeframe for volume source data, is high enough to accommodate the lookback. TradingView will only fetch 5000 candles worth of data, so at 1 min volume data, you can only lookback 83 hours.
While similar, Volume and Open Interest are not the same. To me the simplest explanation is Volume shows the trades that have been executed and the buy/sell direction, while Open Interest shows the value of open trades that are yet to be completed.
Volume shows strength, sentiment and volatility .
Open Interest does not show direction, but does indicate momentum and liquidity in the market.
With this novel way of visualizing these, you can also now determine where all that liquidity and positions came from and therefore might have resting liquidity below.

Volume Pace & Pressure TableHave you ever wanted to know if a particular tickers volume is above or below average while still in the trading day? This indicator displays an easy-to-read table that informs the user exactly what is occurring in intraday volume. And a whole lot more!
Description
This indicator displays a variable table with either two or three columns and always three rows. It packs everything a user needs to know about volume in one small table. The table shows:
Current trading days volume
Average daily volume
Volume Pace
Volume Pressure (Buying & Selling)
Volume Pace
Volume Pace is a mathematical calculation invented by the author, Infinity_Trading . The problem was to figure out a way to know if the current days volume was below average or above average while still in the trading day. Calculations like Percent Daily Volume don’t work during the intraday trading hours. For example, say SPY has a 20-day volume average of 100 million shares. If in the first hour SPY has only traded 10 million shares then dividing the current volume into the average daily volume doesn’t tell the user anything when there is still 5.5 hours of trading left in the trading day. There had to be a better way! The solution was to chop up the trading day into evenly divisible time periods (i.e. <= 30 minutes). The Volume Pace algorithm takes the average daily volume and chops it up into small time periods based upon the charts current timeframe. This is the average volume per smaller time period. Then use the current days volume and the number of time periods that have occurred in the trading day so far (at the current moment in time i.e. the current candlestick) to form a calculation that returns the volume above or below the average volume up to that point in time.
Volume Pace Equations
Intraday Vol. Pace = Today’s Current Vol. - ( ( Average Daily Vol. / Time periods in trading day ) * Time periods that have occurred so far in trading day )
Postday Vol. Pace = Today’s Trading Vol. - Average Daily Vol.
^ Vol. = Volume (because TradingViews pine tags are dumb)
Volume Pace Definitions
Volume Pace is the difference in cumulative volume between todays current volume and the average daily volume up to same time of the day
Volume Pace Usage
If the Volume Pace is a positive number then it means that up to the current trading time the volume is that amount greater than the average daily volume over that same intraday time span.
If the Volume Pace is a negative number then it means that up to the current trading time the volume is that amount smaller than the average daily volume over that same intraday time span.
If the Volume Pace is positive during the intraday then the volume is on track to be an above average volume trading day.
If the Volume Pace is negative during the intraday then the volume is on track to be a below average volume trading day.
The Percent Volume Pace is the percent increase or decrease of the current volume compared to the average volume up to the same time of day. Or the Percent Volume Pace is the Volume Pace expressed as a percentage.
After the trading day is complete the Volume Pace will be the difference between the Daily Volume and the Average Daily Volume. And the same thing applies to the Percent Volume Pace.
Volume Pressure
The author, Infinity_Trading, did not invent the calculations for Volume Pressure but the definitions and explanations of Volume Pressure are their own creations. In specific terms, Volume Pressure is a mathematical calculation that uses the direction and distances of individual candlesticks bodies and wicks to assign a numerical value to volume.
buyingPressure = vol * (close - low) / (high - low)
sellingPressure = vol * (high - close) / (high - low)
^ vol = Volume (because TradingViews pine tags are dumb)
The author wants to make clear that volume “pressure” isn’t a real thing. Trades in any market require a buyer and a seller. So there is always an equal number of buyers and sellers. Thus, the idea that there are more buyers or more sellers isn’t rooted in reality. BUT the author believes that the calculation and understanding of “volume pressure” takes a very complex subject (price moment in a market) and condenses into something that intuitively makes sense to humans (pressure) and places it onto something that is already on everyone’s charts (volume bars).
The calculation for Buying Pressure is really calculating the upward distance between the low and the close of the candle. While Selling Pressure is measuring the downward distance from the high to the close. And both are using volume bars to express these measurements. So if an individual candle goes down then the red Selling Pressure will be more on the stacked bar chart than the green Buying Pressure. And vice versa for candles that went up. If a Volume Pressure bar is completely one color then it means, for a downward candle, the low and close were equivalent, and for an upward candle, the high and the close were the same. Lastly, the Buying & Selling Pressure will always add up to 100%.
Inputs and Style
In the Input section the user can set the number of days to use for all of the average calculations. All aspects of the table can be controlled. The background color, text color, border widths, and border colors. Also, the table can be moved to 9 unique locations around the chart for complete user control. Also, the user can use their cursor to hover over each cell in the table to reveal a tooltip definition of the calculation in the cell.
Special Notes
The volume table won’t display when the chart timeframe is weekly or monthly because the logic uses “daily” volume.
The Volume Pace column in the table disappears when the timeframe is greater than 30 minutes. Because for Volume Pace to work the time periods must be equally divisible into 6.5 hours (the duration of trading day).

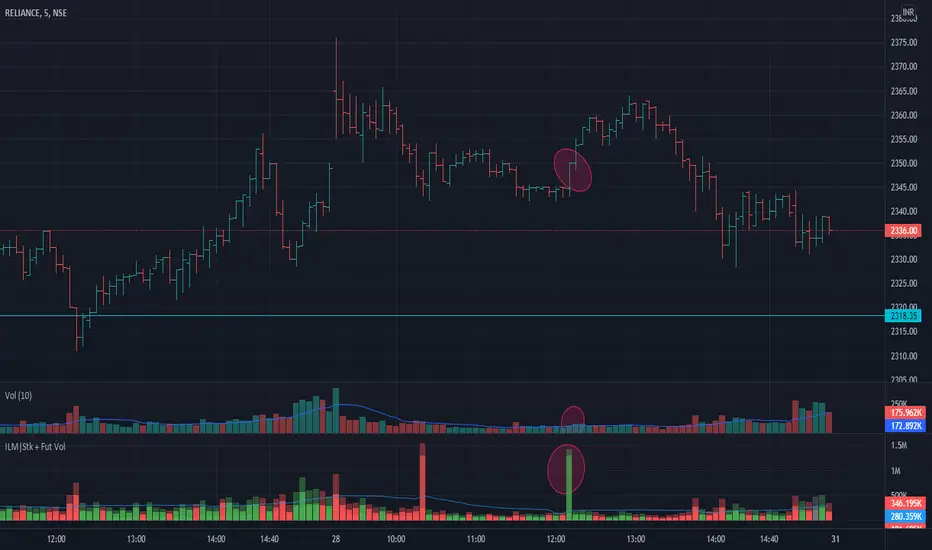
Volume Indicator NSE + BSE + Future Current & Next MonthThis indicator combines all the volumes from both the NSE & BSE exchanges as well as Future volumes ( Current Month & Next Month) if the symbol is available in FnO
Indicator shows 3 volumes
Total Volume = NSE + BSE + Current Month + Next Month
Stock Volume = NSE + BSE
Future volume = Current Month + Next Month
Benefits
As shown in the chart above, price shot up as the volume appeared in BSE but not NSE. These conditions can be caught easily and right decisions can be made
Since Future volumes are also combined, it gives an accurate picture of volumes on any given instrument during last of week of monthly expiries when contract rollovers happen
Volume Average % Cross - ChartVolume Average Percentage Cross Indicator - Chart
This version is specialized for notifications on your chart. If you wish to see notifications on your volume bars please choose "Volume Average Percentage Cross Indicator - Default".
What is the Volume Average % Cross - Chart Indicator you might ask yourself - what is it for?
I will tell you!
Use Case:
In my Indicator you have an Input to set the period for the volume average period.
Once the volume average period is calculated it is now necessary to choose the percentage value.
What is the percentage value?
The percentage value multiplies the past volume bar with a positive percentage value and a negative percentage value. I give this calculation the name "VolPercentage".
If the volume average is below the negative VolPercentage Value it means that the last volume bar is stronger than the volume average period by the percentage you set the percentage value input at.
If the volume average is above the positive VolPercentage Value it means that the last volume bar is weaker than the volume average period by the percentage you set the percentage value input at.
That means that if for example the percentage value would be 20 it would require the volume average to be 20% above the past volume bar.
That means that if for example the percentage value would be 20 it would require the volume average to be 20% lower than the past volume bar.
Once I uploaded my 100 Indicators I will accurately describe each indicator with videos, this will be huge!
Interpretation:
Volume is the amount of market participants who bought in a candlestick bar a set amount of shares at varying prices from within the bar itself.
If volume decreases it means that there has been fewer market participants and if it increases it means that there is an increase of market participants.
If this is used with candlestick patterns it helps tremendously to identify strong or weak doji candlesticks.

Poor man's volume clustersVolume clusters created from candlestick volumes.
See also "Poor man's volume profile" .
The code is generated using a template. To change the settings, you may need to regenerate the code. The code has a link to the repository with the template.

Volume on bar VSA - signalЭтот индикатор сравнивает объем со средним его значением и обозначает бар в зависимости от того какой хвост на баре, бычий или медвежий.
В настройках можно задать сигнальную линию (чувствительность) для подкрашивания объемов, если он превышает эту линию. (на графике красная линия)
Сигнальная линия задаётся в процентах от среднего объема за указанный период.
Серым цветом показан средний объем.
Google translate.
This indicator compares the volume with its average value and designates a bar depending on which tail on the bar is bullish or bearish.
In the settings, you can set a signal line (sensitivity) for tinting volumes, if it exceeds this line. (red line on the chart)
The signal line is set as a percentage of the average volume for the specified period.
Gray indicates the average volume.

Volume on bar VSA - indicatorЭтот индикатор сравнивает объем со средним его значением и подкрашивает его в зависимости от того какой хвост на баре, бычий или медвежий.
В настройках можно задать сигнальную линию (чувствительность) для подкрашивания объемов, если он превышает эту линию. (на графике красная линия)
Сигнальная линия задаётся в процентах от среднего объема за указанный период.
Серым цветом показан средний объем.
Google translate
This indicator compares the volume with its average value and tints it depending on which tail on the bar is bullish or bearish.
In the settings, you can set a signal line (sensitivity) for tinting volumes, if it exceeds this line. (red line on the chart)
The signal line is set as a percentage of the average volume for the specified period.
Gray indicates the average volume.

Volume Squeeze Momentum by HypesterTradingview is basically composed by reskins of many great contributors such as Chrismood, Lazybear, RicardoSandos and a few others. Without those guys I would not be able to learn how to code PINE - since the "documentation" is horrible and support is basically also non-existent. So thank you!
So here is another contribution to the community, which I chose to not disclose the code since the community usually reskin the code and do not give credit and this code is 100% mine.
I believe that the volume tools available are poor and lagging so here is my contribution.
I use this tool to filter noise and eliminate fake reversal signals, momentum readings and trend changes on my Spectro M. Use at your own risk.
I've added some pre-set volume profiles and trend configs. Also, the bar colors for ease of use, and all of that can be easily turned on/off and changed in the config menu.
Let me know what you think!

Volume Plus (Volume+)View Total Volume, Bull Volume, and/or Bear Volume. View Volume Effectiveness to reveal how Volume has effected the price. View the Moving Average of any of the above metrics, selecting one or more types of moving averages(SMA, EMA, RMA, SWMA, VWMA, WMA, or ALMA). Create nearly infinite crossovers by activating the Secondary Moving Average and choosing a longer or shorter Length. Use the highlighter to quickly filter out noise and focus the events you're searching for, by choosing one or more highlight-scenarios from the Highlighting Menu. Use the Average Amplifier to fine tune your Highlighting results.
Use as an ordinary Volume Indicator
Show the Bullish volume within Total Volume
Show the Bearish volume within Total Volume
Show the Bullish and Bearish volume simultaneously within Total Volume
Create crossovers like this one, Bullish Volume Average with Bearish Volume Average
Show the gas mileage of volume, the Volume Effectiveness
Create crossovers like this, Volume Effectiveness 14 with Volume Effectiveness 60
Use Amplifiers to show things that are usually out of scale with one another, like Volume Effectiveness with Volume
Use the Highlighter to show anything, like here, when Bearish Volume was above average AND Volume Effectiveness was under average
From left to right, the Indicator Values are as follows:
1) Total True Volume (red, green, or gray when viewed alongside Bulls/Bears)
2) Volume Winner - Bulls v/s Bears (red or green)
3) Volume Loser - Bulls v/s Bears (red or green)
4) Volume Effectiveness (blue)
5) Design Spacer - Ignore This (green)
6) Design Spacer - Ignore This (red)
7) Total True Volume Primary Moving Average (dark gray)
8) Total True Volume Secondary Moving Average (dark gray)
9) Inferred Bullish Volume Primary Moving Average (dark green)
10) Inferred Bullish Volume Secondary Moving Average (dark green)
11) Inferred Bearish Volume Primary Moving Average (dark red)
12) Inferred Bearish Volume Secondary Moving Average (dark red)
13) Volume Effectiveness Primary Moving Average (blue)
14) Volume Effectiveness Secondary Moving Average (blue)
Click the sprocket and you'll find the following settings (which are explained below):
Total True Volume - This is your everyday, ordinary volume indicator, a total sum of the volume from each candle.
Inferred Bullish Volume - This subtracts Bearish Volume out of the Total True Volume. But without the bull-volume data from the exchange, we can only forensically infer the bullish volume by evaluating OHLC data to guess what ratio of upward v/s downward movement happened within the candle.
Inferred Bearish Volume - This subtracts Bullish Volume out of the Total True Volume. But without the bear-volume data from the exchange, we can only forensically infer the bearish volume by evaluating OHLC data to guess what ratio of downward v/s upward movement happened within the candle.
Volume Effectiveness - This shows how much price movement occurred for each unit of Volume, by dividing the Price Change of each candle by the Total True Volume of each candle. If this volume were gas-mileage, then Volume would be the gas and Price would be the mileage.
• Inferred Effectiveness - Rather than using the Price Change divided by the Total True Volume, this method of determining Volume Effectiveness uses the Total Price-Mileage divided by the Total True Volume. The Total Price-Mileage is determined by figuring the high minus low, the wick times two, and the tail times two, and ad

Volume Delta + Bandas de Bollinger📊 Volume Delta + Bollinger Bands Indicator
Characteristics
• Volume Delta Histogram
• Shows the difference between buying and selling pressure.
• Green bars indicate positive delta (buyers dominating).
• Red bars indicate negative delta (sellers dominating).
• The histogram oscillates around the zero line, which represents balance between buyers and sellers.
• Bollinger Bands applied to Delta
• A moving average (basis line) of the delta is calculated.
• Upper and lower bands are plotted using standard deviation.
• These bands highlight periods when the delta moves to statistically extreme levels.
• Helps identify unusual buying or selling pressure compared to recent history.
• Zero Line Reference
• A horizontal line at zero shows equilibrium.
• Crossing above zero suggests net buying pressure.
• Crossing below zero suggests net selling pressure.
How to Use
• Identify Buyer/Seller Dominance
• Green histogram bars above zero → buyers are stronger.
• Red histogram bars below zero → sellers are stronger.
• Spot Extremes with Bollinger Bands
• When delta touches or exceeds the upper band, it signals unusually strong buying pressure.
• When delta touches or exceeds the lower band, it signals unusually strong selling pressure.
• These extremes can precede reversals or mark continuation if confirmed by price action.
• Combine with Price Analysis
• Use delta signals together with price trends and support/resistance levels.
• For example, if price is at resistance and delta spikes into the upper band, it may indicate exhaustion of buyers.
• If price is at support and delta spikes into the lower band, it may indicate exhaustion of sellers.
• Trading Strategy Ideas
• Reversal setups: Look for delta extremes against key price levels.
• Trend confirmation: Sustained delta above zero supports bullish trends; sustained delta below zero supports bearish trends.
• Volatility filter: Bollinger Bands help filter out normal fluctuations and highlight significant imbalances.
👉 In short, this indicator combines order flow pressure (delta) with volatility context (Bollinger Bands), making it useful for spotting moments when buying or selling activity becomes unusually strong compared to recent history.

Volume Matrix Pro [ChartNation]Volume Matrix Pro is a comprehensive volume profile indicator that combines delta-colored volume distribution analysis with adaptive pivot detection and automated volume node identification. The indicator visualizes where institutional volume accumulated at specific price levels, providing traders with precise entry zones backed by actual trading data.
KEY FEATURES:
Delta-Colored Volume Profile: Displays volume distribution across price bins with automatic delta coloring - green bins show buyer dominance, red bins show seller control at each price level
High Volume Nodes (HVN) Detection: Automatically identifies and marks price levels with ≥80% of POC volume using yellow diamond markers - these act as magnetic support/resistance zones where institutions built positions
Low Volume Nodes (LVN) Detection: Marks thin volume areas with gray diamond markers - zones where price moves quickly with minimal friction, ideal for breakout targets
Adaptive Smart Pivots: ATR-based pivot detection that automatically adjusts length based on market volatility - catches more swings in low volatility, filters to major reversals in high volatility
Point of Control (POC) Line: Identifies the price level with maximum traded volume - the market's center of gravity. Line colors by delta: green when buyers dominated, red when sellers controlled the level
Value Area Lines: Dotted lines marking the 70% value area (configurable 50-98%) with delta-based coloring showing cumulative buyer/seller pressure within the range
Circle Pivot Markers: Clean visual markers at confirmed pivot points with translucent horizontal lines extending to current bar
Extend-Until-Touch: Pivot lines automatically retract when price touches them, keeping charts clean and showing active levels only
Dual Profile Modes: Left-side profile (default) or right-pinned bars ahead of price with fully customizable width and padding
Volume-Filtered Pivots: Only displays pivots with significant volume backing (≥20% of POC by default) - institutional turning points, not noise
HOW IT WORKS:
The indicator divides the lookback range (default 200 bars) into volume bins (default 50) and calculates total volume and delta (buying vs selling pressure) at each price level. Each bin is colored green if buyers dominated (close > open majority) or red if sellers controlled (close < open majority).
High Volume Nodes mark price levels where the most trading occurred - these become magnetic support/resistance zones. The Point of Control identifies the single price with maximum volume, acting as the market's gravitational center.
Smart Pivots use ATR to adapt to changing volatility, then filter against the volume profile. Only pivots with substantial volume backing are displayed, ensuring you see institutional turning points, not random noise.
RECOMMENDED SETTINGS:
Scalping (1-5 min): 100 lookback bars, 40 bins, 5-7 pivot length
Day Trading (15 min - 1 hour): 200 lookback bars, 50 bins, 10 pivot length (default)
Swing Trading (4 hour - Daily): 300-500 lookback bars, 60 bins, 15-20 pivot length
USAGE TIPS:
Enter long when price touches green HVN zones with adaptive pivot confirmation
Enter short when price reaches red HVN zones with pivot confirmation
Use POC as first target when entering below it, or as support backup when entering above
Watch for LVN zones as potential breakout acceleration areas
Combine green delta bins + HVN + pivot for highest-probability setups
WHAT MAKES THIS DIFFERENT:
Unlike traditional volume profiles, Volume Matrix Pro colors each bin individually by delta, giving granular insight into buyer/seller control at every price level. The adaptive pivot system adjusts automatically to volatility, while volume-filtering ensures only institutionally-backed turning points are displayed. High/Low Volume Node detection is fully automated with visual markers.
IMPORTANT NOTES:
This is a volume analysis tool - use with trend analysis and risk management
High Volume Nodes show where volume accumulated historically, not future support/resistance guarantees
Adaptive pivots adjust to volatility automatically but can still produce false signals in choppy markets
Best used as confirmation alongside price action, not as a standalone system
Profile recalculates on each bar to reflect current lookback range

Volume GrabdTraderVol GrandTrader — Advanced Volume Indicator
Vol GrandTrader is an enhanced version of the standard volume indicator that shows not only regular chart volume but also higher-timeframe (HTF) volume and highlights significant volume spikes.
Key Features
🔹 HTF Volume
Display volume from a higher timeframe to better understand larger market flows and institutional activity.
🔹 Volume Spike Detection
The indicator highlights bars where volume exceeds the average of the last N candles by a chosen multiplier — helping you spot strong moves, breakouts, and aggressive entries.
Settings
Volume Timeframe (HTF) — select a higher timeframe for additional volume.
Average Volume Length — period for calculating average volume.
Spike Multiplier — threshold for detecting volume spikes.
Why Traders Use It
Better visibility of major market participants
Clear detection of abnormal volume events
Useful for day traders, scalpers, and swing traders
A simple yet powerful tool for deeper volume analysis.

Volume-Price Shift Box (Lite Version)Description
This indicator is a clean and intuitive visual tool designed to help traders quickly assess the current balance of bullish and bearish forces in the market.
It combines volume, price movement, VWAP, and OBV dynamics into a compact on-chart table that updates in real time.
This version focuses on the core logic and visualization of momentum and volume shifts, making it ideal for traders who want actionable insight without complex configuration.
How It Works
The script measures the combined strength of multiple market components:
VWAP trend indicates price bias relative to fair value.
OBV (On-Balance Volume) tracks volume flow to confirm or contradict price movement.
Volume ratio compares current volume to its recent average.
Momentum evaluates directional price movement over a configurable lookback period.
Accumulation / Distribution (A/D) Line estimates buying or selling pressure within each candle:
↑ — A/D is rising (buying pressure is increasing)
↑↑ — A/D is rising faster than before (acceleration of buying)
↓ — A/D is falling (selling pressure is increasing)
↓↓ — A/D is falling faster than before (acceleration of selling)
Each of these components contributes to an overall shift score.
Depending on this score, the box displays:
🟢 Bullish Shift — strong upward alignment
🔴 Bearish Shift — downward alignment
⚪ Neutral — mixed or indecisive conditions
Key Features
Compact on-chart information box with color-coded parameters
Combined volume-price relationship model
Configurable lookback and sensitivity controls
Real-time shift strength and trend duration tracking
Adjustable EMA/SMA smoothing for all averages
Lightweight design optimized for clarity
Inputs Overview
Box Position / Size – Place and scale the on-chart info box
Lookback Period – Number of bars used for calculations
VWAP Lookback – Period for VWAP distance smoothing
Shift Sensitivity – Adjusts reaction strength of bullish/bearish shifts
Neutral Zone Threshold – Defines when the market is considered neutral
EMA or SMA – Choose exponential or simple moving averages
Component Weights – Set the influence of VWAP, OBV, Volume, and Momentum on the shift score
Display Toggles – Enable or disable metrics shown in the box (Strength, Volume, VWAP, Duration, OBV)
How to Use
Apply the indicator to any symbol and timeframe.
Observe the box on the chart — it updates dynamically.
Look for transitions between Neutral → Bullish or Neutral → Bearish shifts.
Combine with your existing price action or confirmation tools (e.g., support/resistance, trendlines).
Use the “Strength” and “Duration” values to assess consistency and momentum quality.
(This indicator is not a buy/sell signal generator — it is designed as a contextual analysis and confirmation tool.)
How It Helps
Merges several key volume and price metrics into a single view
Highlights transitions in market control between buyers and sellers
Reduces clutter by presenting only relevant context data
Works on any market and timeframe, from scalping to swing trading
⚠️Disclaimer:
This script is provided for educational and informational purposes only. It is not financial advice and should not be considered a recommendation to buy, sell, or hold any financial instrument. Trading involves significant risk of loss and is not suitable for every investor. Users should perform their own due diligence and consult with a licensed financial advisor before making any trading decisions. The author does not guarantee any profits or results from using this script, and assumes no liability for any losses incurred. Use this script at your own risk.
