Early Relative Volume"Buy or Sell when you see a spike in volume" is advice that you often hear, the problem for me was that you only find out that volume is spiking after the fact. So that's why I created the Early Relative Volume indicator.
The Early Relative Volume indicator takes the amount of time that has passed for the current bar, let's say 10 seconds, and compares the volume of that first 10 seconds to the average volume in 10 seconds of the previous candle.
That means that it will tell you if the volume thus far in the current candle is more or less than the relative volume of the previous candle, so that you can potentially get an indication that the volume of the current candle is going to be greater or less than the previous candle.
This approach is of course not perfect, and obviously the values update as the current candle progresses, but I've found it useful to identify early breakout candles.
There is also an option to do the same calculation with the size of the body of the candle, by enabling the "Blue bars if candle body and volume bigger" option. It will only turn blue of both the volume and the size of the candle's body is calculated to be bigger.
I hope this helps you in your trading!
Cari dalam skrip untuk "volume"
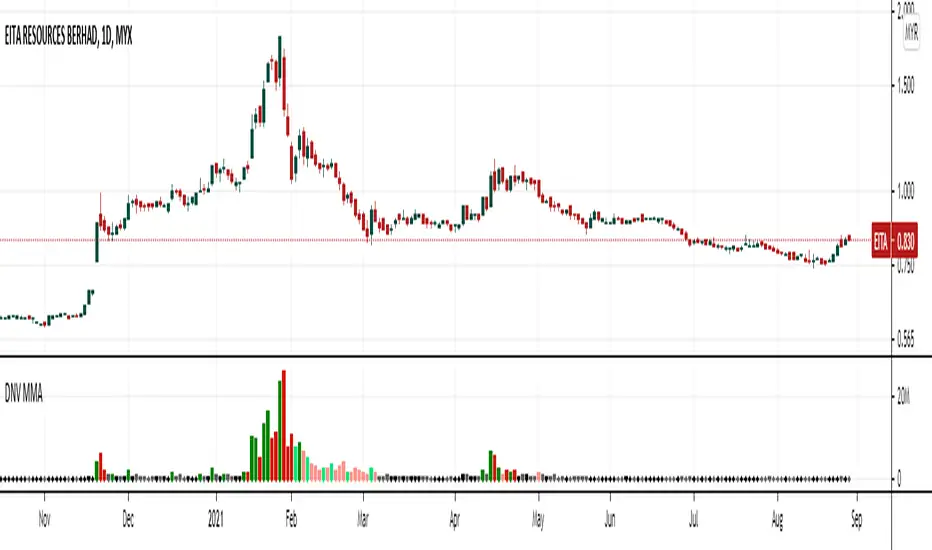
Average Dollar Normalize Volume//-------------------------------------------------------------------------------
//Brief Explanation
//--Instead of using Volume Indicator that show the volume in quantity
//--this indicator will show the volume in dollar transaction
//Indicator Value:
//-- A B C D E
//--
//Formula
//--Average Dollar Normalize Volume = Average Price x Volume
//--ADNV Ratio = ADNV / ADNV Moving Average
//--Volume Ratio = Volume / Volume Moving Average
//Setting Moving Average (used by ADNV MA & Volume MA)
//--Type: SMA : EMA
//--Length: 20 : 1 : 200
//Setting Minimum Dollar Value
//--Value: 1 : 1 : 900
//--Unit: Million : Thousand
// Bar Color Setting
//--Grow above ADNVMA : Dark Green
//--Grow but below ADNVMA: Light Green
//--Fall and above ADNVMA: Dark Red
//--Fall but below ADNVMA: Light Red
//--Grow but less than Minimum Dollar Value: Dark Black
//--Fall but less than Minimum Dollar Value: Grey
//-------------------------------------------------------------------------------
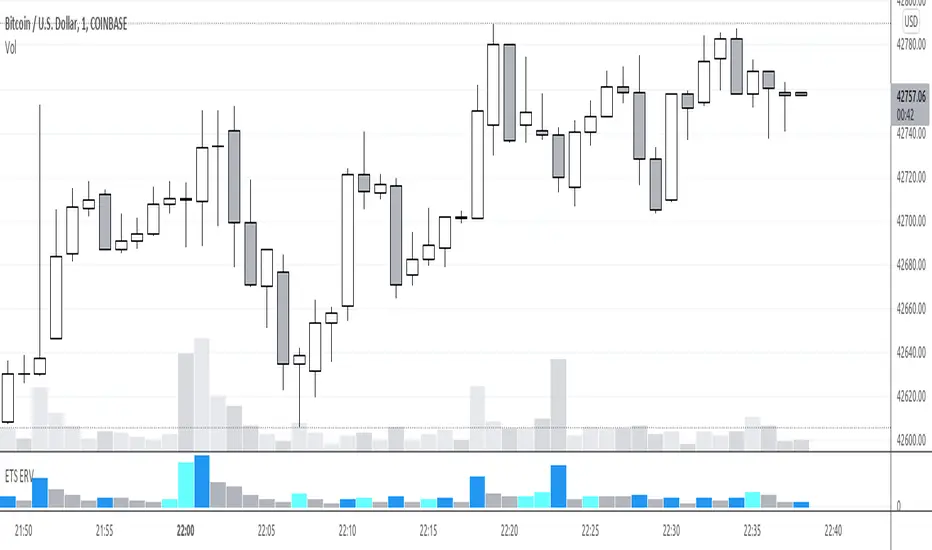
Realtime Delta Volume Action [LucF]█ OVERVIEW
This indicator displays on-chart, realtime, delta volume and delta ticks information for each bar. It aims to provide traders who trade price action on small timeframes with volume and tick information gathered as updates come in the chart's feed. It builds its own candles, which are optimized to display volume delta information. It only works in realtime.
█ WARNING
This script is intended for traders who can already profitably trade discretionary on small timeframes. The high cost in fees and the excitement of trading at small timeframes have ruined many newcomers to trading. While trading at small timeframes can work magic for adrenaline junkies in search of thrills rather than profits, I DO NOT recommend it to most traders. Only seasoned discretionary traders able to factor in the relatively high cost of such a trading practice can ever hope to take money out of markets in that type of environment, and I would venture they account for an infinitesimal percentage of traders. If you are a newcomer to trading, AVOID THIS TOOL AT ALL COSTS — unless you are interested in experimenting with the interpretation of volume delta combined with price action. No tool currently available on TradingView provides this type of close monitoring of volume delta information, but if you are not already trading small timeframes profitably, please do not let yourself become convinced that it is the missing piece you needed. Avoid becoming a sucker who only contributes by providing liquidity to markets.
The information calculated by the indicator cannot be saved on charts, nor can it be recalculated from historical bars.
If you refresh the chart or restart the script, the accumulated information will be lost.
█ FEATURES
Key values
The script displays the following key values:
• Above the bar: ticks delta (DT), the total ticks for the bar, the percentage of total ticks that DT represents (DT%)
• Below the bar: volume delta (DV), the total volume for the bar, the percentage of total volume that DV represents (DV%).
Candles
Candles are composed of four components:
1. A top shaped like this: ┴, and a bottom shaped like this: ┬ (picture a normal Japanese candle without a body outline; the values used are the same).
2. The candle bodies are filled with the bull/bear color representing the polarity of DV. The intensity of the body's color is determined by the DV% value.
When DV% is 100, the intensity of the fill is brightest. This plays well in interpreting the body colors, as the smaller, less significant DV% values will produce less vivid colors.
3. The bright-colored borders of the candle bodies occur on "strong bars", i.e., bars meeting the criteria selected in the script's inputs, which you can configure.
4. The POC line is a small horizontal line that appears to the left of the candle. It is the volume-weighted average of all price updates during the bar.
Calculations
This script monitors each realtime update of the chart's feed. It first determines if price has moved up or down since the last update. The polarity of the price change, in turn, determines the polarity of the volume and tick for that specific update. If price does not move between consecutive updates, then the last known polarity is used. Using this method, we can calculate a running volume delta and ticks delta for the bar, which becomes the bar's final delta values when the bar closes (you can inspect values of elapsed realtime bars in the Data Window or the indicator's values). Note that these values will all reset if the script re-executes because of a change in inputs or a chart refresh.
While this method of calculating is not perfect, it is by far the most precise way of calculating volume delta available on TradingView at the moment. Calculating more precise results would require scripts to have access to tick data from any chart timeframe. Charts at seconds timeframes do use exchange/broker ticks when the feeds you are using allow for it, and this indicator will run on them, but tick data is not yet available from higher timeframes. Also, note that the method used in this script is far superior to the intrabar inspection technique used on historical bars in my other "Delta Volume" indicators. This is because volume and ticks delta here are calculated from many more realtime updates than the available intrabars in history. Unfortunately, the calculation method used here cannot be used on historical bars, where intrabar inspection remains, in my opinion, the optimal method.
Inputs
The script's inputs provide many ways to personalize all the components: what is displayed, the colors used to display the information, and the marker conditions. Tooltips provide details for many of the inputs; I leave their exploration to you.
Markers
Markers provide a way for you to identify the points of interest of your choice on the chart. You control the set of conditions that trigger each of the five available markers.
You select conditions by entering, in the field for each marker, the number of each condition you want to include, separated by a comma. The conditions are:
1 — The bar's polarity is up/dn.
2 — `close` rises/falls ("rises" means it is higher than its value on the previous bar).
3 — DV's polarity is +/–.
4 — DV% rises (↕).
5 — POC rises/falls.
6 — The quantity of realtime updates rises (↕).
7 — DV > limit (You specify the limit in the inputs. Since DV can be +/–, DV– must be less than `–limit` for a short marker).
8 — DV% > limit (↕).
9 — DV+ rises for a long marker, DV– falls for a short.
10 — Consecutive DV+/DV– on two bars.
11 — Total volume rises (↕).
12 — DT's polarity is +/–.
13 — DT% rises (↕).
14 — DT+ rises for a long marker, DT– falls for a short.
Conditions showing the (↕) symbol do not have symmetrical states; they act more like filters. If you only include condition 4 in a marker's setup, for example, both long and short markers will trigger on bars where DV% rises. To trigger only long or short markers, you must add a condition providing directional differentiation, such as conditions 1 or 2. Accordingly, you would enter "1,4" or "2,4".
For a marker to trigger, ALL the conditions you specified for it must be met. Long markers appear on the chart as "Mx▲" signs under the values displayed below candles. Short markers display "Mx▼" over the number of updates displayed above candles. The marker's number will replace the "x" in "Mx▲". The script loads with five markers that will not trigger because no conditions are associated with them. To activate markers, you will need to select and enter the set of conditions you require for each one.
Alerts
You can configure alerts on this script. They will trigger whenever one of the configured markers triggers. Alerts do not repaint, so they trigger at the bar's close—which is also when the markers will appear.
█ HOW TO USE IT
As a rule, I do not prescribe expected use of my indicators, as traders have proved to be much more creative than me in using them. Additionally, I tend to think that if you expect detailed recommendations from me to be able to use my indicators, it's a sign you are in a precarious situation and should go back to the drawing board and master the necessary basics that will allow you to explore and decide for yourself if my indicators can be useful to you, and how you will use them. I will make an exception for this thing, as it presents fairly novel information. I will use simple logic to surmise potential uses, as contrary to most of my other indicators, I have NOT used this one to actually trade. Markets have a way of throwing wrenches in our seemingly bullet-proof rationalizing, so drive cautiously and please forgive me if the pointers I share here don't pan out.
The first thing to do is to disable your normal bars. You can do this by clicking on the eye icon that appears when you hover over the symbol's name in the upper-left corner of your chart.
The absolute value and polarity of DV mean little without perspective; that's why I include both total volume for the bar and the percentage that DV represents of that total volume. I interpret a low DV% value as indecision. If you share that opinion, you could, let's say, configure one of the markers on "DV% > 80%", for example (to do so you would enter "8" in the condition field of any marker, and "80" in the limit field for condition 8, below the marker conditions).
I also like to analyze price action on the bar with DV%. Small DV% values should often produce small candle bodies. If a small DV% value occurs on a bar with much movement and high volume, I'm thinking "tough battle with potential explosive power when one side wins". Conversely, large bodies with high DV% mean that large volume is breaching through multiple levels, or that nobody is suddenly willing to take the other side of a normal volume of trades.
I find the POC lines really interesting. First, they tell us the price point where the most significant action (taking into account both price occurrences AND volume) during the bar occurred. Second, they can be useful when compared against past values. Third, their color helps us in figuring out which ones are the most significant. Unsurprisingly, bunches of orange POCs tend to appear in consolidation zones, in pauses, and before reversals. It may be useful to often focus more on POC progression than on `close` values. This is not to say that OHLC values are not useful; looking, as is customary, for higher highs or lower lows, or for repeated tests of precise levels can of course still be useful. I do like how POCs add another dimension to chart readings.
What should you do with the ticks delta above bars? Old-time ticker tape readers paid attention to the sounds coming from it (the "ticker" moniker actually comes from the sound they made). They knew activity was picking up when the frequency of the "ticks" increased. My thinking is that the total number of ticks will help you in the same way, since increasing updates usually mean growing interest—and thus perhaps price movement, as increasing volatility or volume would lead us to surmise. Ticks delta can help you figure out when proportionally large, random orders come in from traders with other perspectives than the short-term price action you are typically working with when you use this tool. Just as volume delta, ticks delta are one more informational component that can help you confirm convergence when building your opinions on price action.
What are strong bars? They are an attempt to identify significance. They are like a default marker, except that instead of displaying "Mx▲/▼" below/above the bar, the candle's body is outlined in bright bull/bear color when one is detected. Strong bars require a respectable amount of conditions to be met (you can see and re-configure them in the inputs). Think of them as pushes rather than indications of an upcoming, strong and multi-bar move. Pushes do, for sure, often occur at the beginning of strong trends. You will often see a few strong bars occur at 2-3 bar intervals at the beginning or middle of trends. But they also tend to occur at tops/bottoms, which makes their interpretation problematic. Another pattern that you will see quite frequently is a final strong bar in the direction of the trend, followed a few bars later by another strong bar in the reverse direction. My summary analyses seemed to indicate these were perhaps good points where one could make a bet on an early, risky reversal entry.
The last piece of information displayed by the indicator is the color of the candle bodies. Three possible colors are used. Bull/bear is determined by the polarity of DV, but only when the bar's polarity matches that of DV. When it doesn't, the color is the divergence color (orange, by default). Whichever color is used for the body, its intensity is determined by the DV% value. Maximum intensity occurs when DV%=100, so the more significant DV% values generate more noticeable colors. Body colors can be useful when looking to confirm the convergence of other components. The visual effect this creates hopefully makes it easier to detect patterns on the chart.
One obvious methodology that comes to mind to trade with this tool would be to use another indicator like Technical Ratings at a higher timeframe to identify the larger context's trend, and then use this tool to identify entries for short-term trades in that direction.
█ NOTES AND RAMBLINGS
Instant Calculations
This indicator uses instant values calculated on the bar only. No moving averages or calculations involving historical periods are used. The only exception to this rule is in some of the marker conditions like "Two consecutive DV+ values", where information from the previous bar is used.
Trading Small vs Long Timeframes
I never trade discretionary at the 5sec–5min timeframes this indicator was designed to be used with; I trade discretionary at 1D, 1W and 1M timeframes, and let systems trade at smaller timeframes. The higher the timeframe you trade at, the fewer fees you will pay because you trade less and are not churning trading volume, as is inevitable at smaller timeframes. Trading at higher timeframes is also a good way to gain an instant edge on most of the trading crowd that has its nose to the ground and often tends to forget the big picture. It also makes for a much less demanding trading practice, where you have lots of time to research and build your long-term opinions on potential future outcomes. While the future is always uncertain, I believe trades riding on long-term trends have stronger underlying support from the reality outside markets.
To traders who will ask why I publish an indicator designed for small timeframes, let me say that my main purpose here is to showcase what can be done with Pine. I often see comments by coders who are obviously not aware of what Pine is capable of in 2021. Since its humble beginnings seven years ago, Pine has grown and become a serious programming language. TradingView's growing popularity and its ongoing commitment to keep Pine accessible to newcomers to programming is gradually making Pine more and more of a standard in indicator and strategy programming. The technical barriers to entry for traders interested in owning their trading practice by developing their personal tools to trade have never been so low. I am also publishing this script because I value volume delta information, and I present here what I think is an original way of analyzing it.
Performance
The script puts a heavy load on the Pine runtime and the charting engine. After running the script for a while, you will often notice your chart becoming less responsive, and your chart tab can take longer to activate when you go back to it after using other tabs. That is the reason I encourage you to set the number of historical values displayed on bars to the minimum that meets your needs. When your chart becomes less responsive because the script has been running on it for many hours, refreshing the browser tab will restart everything and bring the chart's speed back up. You will then lose the information displayed on elapsed bars.
Neutral Volume
This script represents a departure from the way I have previously calculated volume delta in my scripts. I used the notion of "neutral volume" when inspecting intrabar timeframes, for bars where price did not move. No longer. While this had little impact when using intrabar inspection because the minimum usable timeframe was 1min (where bars with zero movement are relatively infrequent), a more precise way was required to handle realtime updates, where multiple consecutive prices often have the same value. This will usually happen whenever orders are unable to move across the bid/ask levels, either because of slow action or because a large-volume bid/ask level is taking time to breach. In either case, the proper way to calculate the polarity of volume delta for those updates is to use the last known polarity, which is how I calculate now.
The Order Book
Without access to the order book's levels (the depth of market), we are limited to analyzing transactions that come in the TradingView feed for the chart. That does not mean the volume delta information calculated this way is irrelevant; on the contrary, much of the information calculated here is not available in trading consoles supplied by exchanges/brokers. Yet it's important to realize that without access to the order book, you are forfeiting the valuable information that can be gleaned from it. The order book's levels are always in movement, of course, and some of the information they contain is mere posturing, i.e., attempts to influence the behavior of other players in the market by traders/systems who will often remove their orders when price comes near their order levels. Nonetheless, the order book is an essential tool for serious traders operating at intraday timeframes. It can be used to time entries/exits, to explain the causes of particular price movements, to determine optimal stop levels, to get to know the traders/systems you are betting against (they tend to exhibit behavioral patterns only recognizable through the order book), etc. This tool in no way makes the order book less useful; I encourage all intraday traders to become familiar with it and avoid trading without one.

OP VolumeOP Volume
This indicator show the original volume for bullish or bearish
Green = bullish candle but volume lower than average
Blue = bullish candle with above average volume
Purple = bearish candle with below average volume
Red = bearish candle with above average volume
The upper line that is >=0 represents average up volume
The lower line that is <= 0 represents the average down volume
By default, the lookback period for average volume is 7.

[sylence175] Alpha Volume FlowDescription
The Volume Flow Indicator (VFI) was originally introduced by Markos Katsanos in June 2004 in the article Technical Analysis of STOCKS & COMMODITIES .
The VFI is based on the popular On Balance Volume (OBV) but with three very important modifications:
Unlike the OBV, indicator values are no longer meaningless. Positive readings are bullish and negative bearish .
The calculation is based on the day’s median instead of the closing price.
A volatility threshold takes into account minimal price changes and another threshold eliminates excessive volume .
The indicator takes into account only the latest 6 month volume action and not the entire data loaded in the chart.
A simplified interpretation of the VFI is that values above zero indicate a bullish state and the crossing of the zero line is the trigger or buy signal.
The strongest signal with all money flow indicators is of course divergence.
The classic form of divergence is when the indicator refuses to follow the price action and makes lower highs while price makes higher highs (negative divergence).
If price reaches a new low but the indicator fails to do so, then price probably traveled lower than it should have. In this instance, you have positive divergence. This indicator is also very useful for improving performance results in trading system design.
Additions
I used the code from Markos Katsanos and implemented it in PineScript.
EMA of the VFI which acts as reversal signal.
color-gradient filling (PineCoders framework) for the range between the VFI and the signal EMA.
The bull & bear colors for the indicator are momentum based and configurable through user inputs.
Parameters:
VFI Length
Volatility threshold
Volume threshold
EMA Signal length
Smoothing
Bull color
Bear color
FTX:BTCPERP 1D
FTX:ETHPERP 4H
Sources
precisiontradingsystems.com
mkatsanos.com

VSA Volume IndicatorThis indicator is build around volume (Ticks) and abnormalities:
The indicator consists of a
- Histogram
- A wave above the histogram
- Colored circles in the top of the indicator pane
- Colored squares below the histogram
- Colored Background
The volume histogram:
Black volume : difference between open and close is less then 0.1 pip
Blue : price movement is bullish
Red : price movement is bearish
Pink : volume is less then previous 2 bars
The Wave above the histogram
Based upon the settings:
Lookback period - standard at 10
Period for the SMA - standard at 14
Factor bottom Wave - standard at 2.2
Factor top Wave - standard at 3.5
A pink wave is plotted above the volume bars, the main driver of this wave is a relation/calculation between the factors, the lookback period and the SMA to the volume
Additional 2 black lines are plotted using the standard deviation as a basis
Colored circles in the top of the indicator pane
In the top of the indicator pane circles are plotted with the following rational
For each 1min the indicator calculates if the volume belongs to a bullish or bearish price movement and sums this for the selected time frame.
as example if the time frame is set to 60min :
for the 60x 1min candles the volume is added to bears or bulls
if of the total volume 53% or more belongs to bears or bulls a circle is plotted. The 53% can be adjusted in the settings
Red for Bears
Green for Bulls
If their is a contradiction the price candles body becomes hollow
Contradiction :
Volume for the selected timeframe is concluded to be Bullish but the price is Bearish => price candle will be hollow
Volume for the selected timeframe is concluded to be Bearish but the price is Bullish => price candle will be hollow
Colored squares below the histogram
the average volume is calculated of the 5 previous candles of that time. If this volume is higher then the actual volume and the actual volume is labelled UHV a blue square is plotted
as example on a 1hr time frame
- 17:00 volume 1.000
- the average of the last 5 times at 17:00 the volume is 1.200
- the current volume crosses the bottom of the wave => UHV
An orange square is plotted as an indication of an abnormality being UHV but the volume is below the average volume of the last 5x volume bars at that time
A red line is plotted to indicate the average of the '5 day - specific time' volume
A black square is plotted when:
- UHV condition is met : volume crosses the bottom of the wave
- 3x consecutive volume increase with 3x consecutive bullish or bearish price movement.
This as an indication that the background color as explained below is 'special'
Colored Background
If volume crosses the bottom wave, Ultra High Volume (UHV) has been detected and the background is colored.
Light red : UHV on bearish price movement
Light blue : UHV on bullish price movement
If volume increases 3 times consecutive and price is bearish 3 x consecutive then the background is colored Orange
If volume increases 3 times consecutive and price is bullish 3 x consecutive then the background is colored Dark Blue
Any feedback is welcome

Daily Real-Time Relative Volume *Eastern Time Zone Only*Calculates the current relative volume in real-time compared to the inputted moving average length.
*VOLUME MUST CHANGE on the current chart, once loaded, with the indicator before the script activates and presents the current relative volume*
On high volume stocks the script should activate almost immediately on low volume stocks it may take a little while.
Relative Volume that equals or exceeds the High Volume Threshold set will color the column either red or green (based on current and previous days close).
Relative Volume that is below the Low Volume Threshold set will color the column yellow.
Relative volume between the Low and High Volume Thresholds set will color the column black.

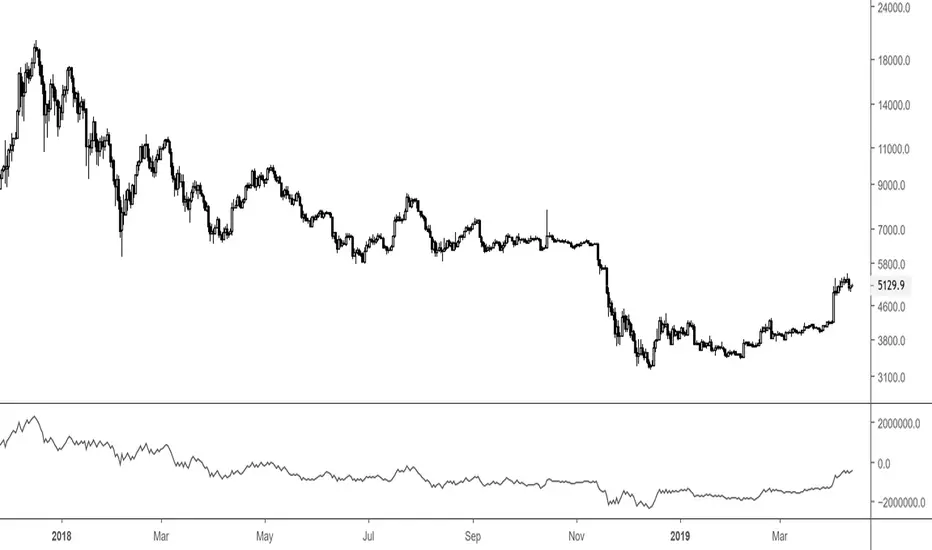
Big 9 Real volume exchanges - On Balance VolumeHere is an On Balance Volume indicator using only volume data from the 9 biggest exchanges trading BTC/USD or BTC/USDT. These 9 exchanges were chosen based on the report by Bitwise Invest stating that 95% of the volume on CoinMarketCap is fake. On these 9 exchanges, however, volume data appears to be reliable. Please note BitFlyer was not included because it does not trade in USD. Please note also that data on all 9 exchanges is only available from August 2017. A separate volume indicator indicator is available at
Anyone is welcome to share and modify.
- stargazer
Color Bars VolumeThe bars are colored exclusively according to volume average:
Ultra high Volume = Volume > Mean Volume * 3.5;
Very high Volume = Volume > (Mean Volume * 2.5) and Volume <= (Mean Volume * 3.5);
High Volume = Volume > (Mean Volume * 1.5) and Volume <= (Mean Volume *2.5);
Medium Volume = Volume > (Mean Volume * 0.5) and volume <= (Mean Volume *1.5);
Low Volume = (Volume > (Mean Volume * 0.5).

BTC Volume Index [v2018-11-21] @ LekkerCryptisch.nlIndicates the volume trend:
~50 = short term volume is the same as long term volume
> 50 = short term volume is higher than long term volume (i.e. trend is rising volume)
< 50 = short term volume is lower than long term volume (i.e. trend is declining volume)


Premarket&Regular Session VolumeThis script provides a clean and practical overview of premarket cumulative volume compared with regular session volume, helping traders instantly identify unusual early-session liquidity.
Features
Tracks total premarket volume from 4:00–9:30 ET
Shows cumulative premarket buildup as a smooth line
Helps detect early liquidity spikes that often lead to halts, gap-ups or momentum runs
Designed for intraday scalpers and small-cap/momentum traders
Why It’s Useful
Premarket activity frequently reveals hidden demand long before the opening bell.
When premarket volume significantly exceeds average daily levels, the probability of early spikes, volatility events, or continuation moves increases.
This indicator offers a simple but powerful visual tool for evaluating market interest before the open and comparing it with regular session volume

Buy vs Sell Volume EMA + Smart Momentum Shift (Crypto)This is a volume-based momentum indicator for crypto that:
Splits total volume into buy vs. sell volume based on candle direction.
Applies EMAs to buy/sell volume and tracks slope and acceleration of those EMAs.
Looks for moments where buyer volume momentum is improving and seller momentum is fading.
Optionally requires RSI and/or MACD confirmation, a “near recent low” location filter, and a score threshold based on several micro-conditions.
Outputs:
Colored background depending on whether buy or sell volume dominates.
EMA crossover arrows (“Buy” and “Sell”) for simpler regime shifts.
Green dots (“Strong Buy Momentum Shift”) when all filters are satisfied.
Alert conditions for the above signals.
It runs in a separate pane (overlay=false) and is explicitly designed for crypto, but works on any symbol/interval.

Regular Volume Indicator with 30-Day Average PointsRegular Volume Indicator with past 30-days average lines.
If the day's trading volume is more than that, it will have a dot pop out.


MOEX Day Volume24-hour trading volume indicator for a security in rubles with data on correlation with the Moscow Exchange Index

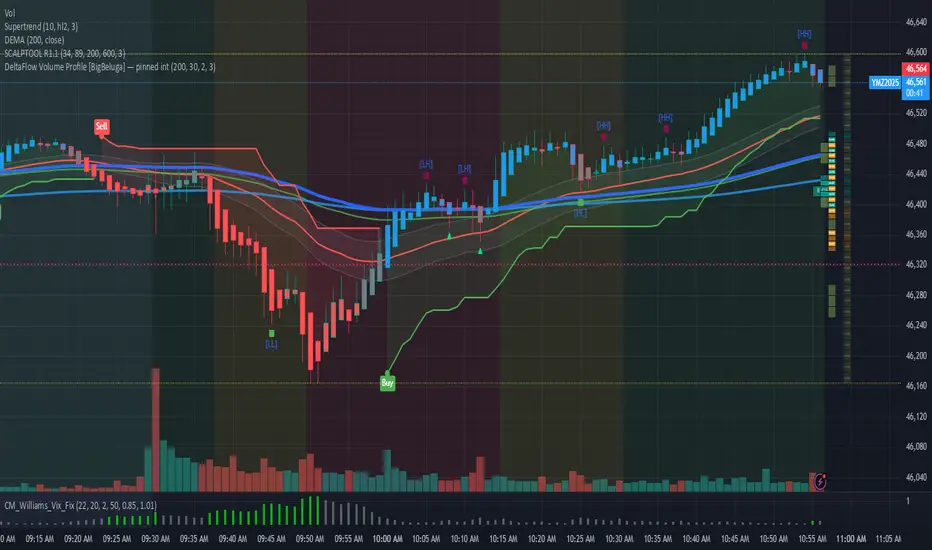
DeltaFlow Volume Dr.Ryan [Beluga Port]This is a delta volume profile copy I have made for tracking volume flow.
Better Volume PRO v2.0 (Enhanced + Stats)Better Volume PRO v2.0 is an advanced volume analysis indicator for TradingView that estimates buying versus selling pressure on each candle, assigns a Confidence Score to each signal, and filters out market noise to display only high-quality trading opportunities.

DMV Volume Volume Radar SIMPLEThis indicator helps identify early signs of accumulation, breakout, and distribution by analyzing relative volume and price action within defined ranges.
It detects:
🔵 ACCUM: High relative volume with buying pressure near support (early accumulation)
🟢 BRK: High relative volume near range high with bullish price action (potential breakout)
🔴 DIST: High relative volume with selling pressure near range high (distribution / potential reversal)
How it works:
Measures relative volume vs. a moving average
Builds a dynamic price range using recent swing highs/lows
Looks for wick behavior + location in range to validate signals
Color-codes candles and adds labels for quick visualization
Optional alert conditions are baked in for automated notifications
Perfect for:
Pre-breakout positioning
Spotting smart-money accumulation
Identifying distribution zones for exits or reversals
Works best on 15m–4h timeframes for crypto and alts

Advanced Volume indicator This indicator shows 4H volume on the 1H chart.
I am using this one for my swing trade system on the 1H chart, which I will also publish later.
My entry signal is a extraordinary volume candle, a red threshold line can mark “very high volume” zones (SMA × multiplier).

LTF Volume Bubbles on HTFLTFVB HTF plots lower-timeframe volume “bubbles” directly on your higher-timeframe chart, so you can see where and how strong real intrabar activity is without dropping down a timeframe.

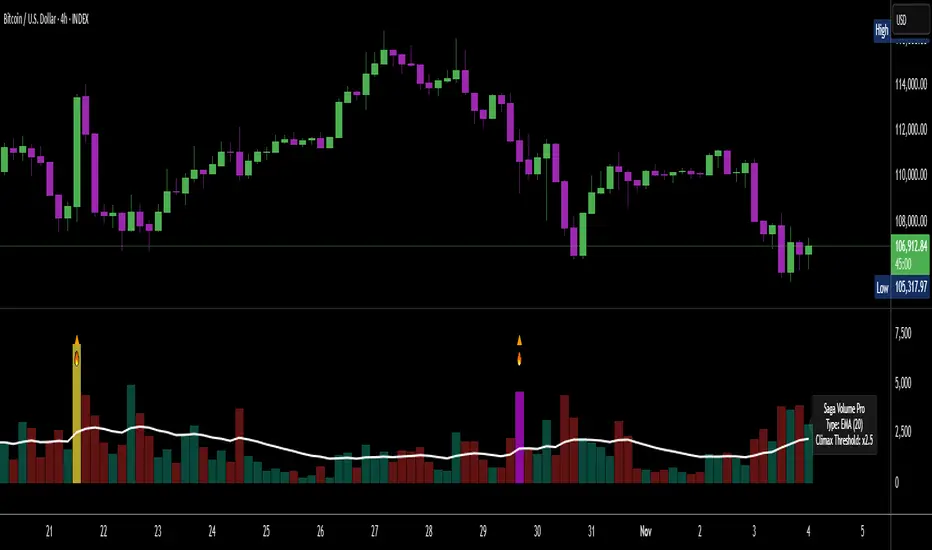
[Saga Trading] Volume Pro (EMA/SMA + Climax + Alerts) Volume Pro is an advanced volume indicator designed to detect spikes in institutional activity by analyzing volume variations relative to their moving average.
It helps identify Climax Volume zones—moments when large accumulation or distribution orders occur—in order to anticipate potential trend reversals or continuations.
This indicator is optimized for crypto, indices, forex, and futures markets, and fits seamlessly into a multi-timeframe, order-flow, and institutional behavior analysis.
✅ Built-in alerts!
For optimized settings, feel free to contact me!
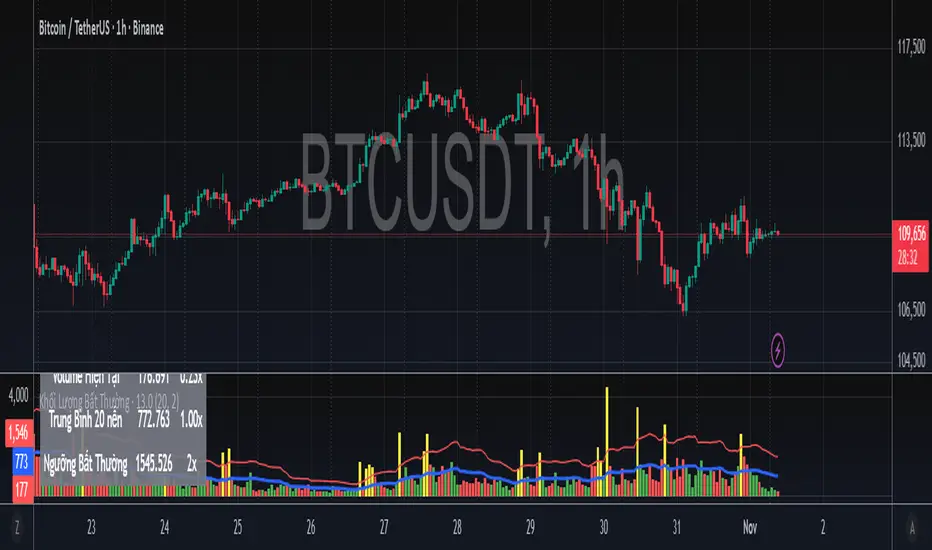
Khối Lượng Bất Thường - Volume Spike Detector - By LetoanThis indicator helps you detect when the total volume (both buy and sell from many exchanges) is unusually higher than the previous (x) candles. You can set up the value (x) to suit your system in buying and selling decisions.