Cari dalam skrip untuk "volume"


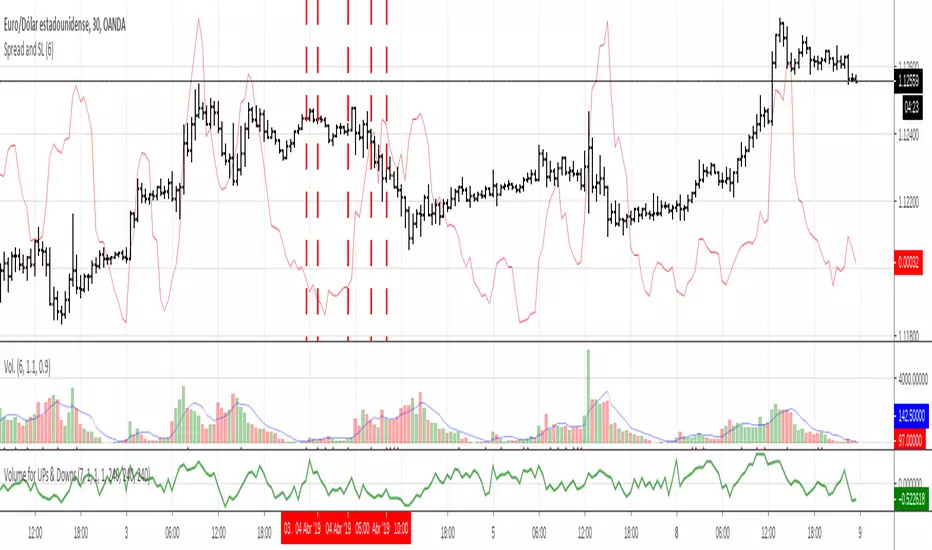
Volume controlvolume control based on average, you can only open deals when volume is closer to average, otherwise you can fall in high or low volatility and the trade will be seen affected . check on rows on below volume bars, you can change values limit, but i suggest use fixed values proposed.


Volume of BTC (BitMEX/bitfinex/bitFlyer)Volume of BTC
BitMEX : red
bitfinex : green
bitFlyer : blue
For details in Japanese on my website


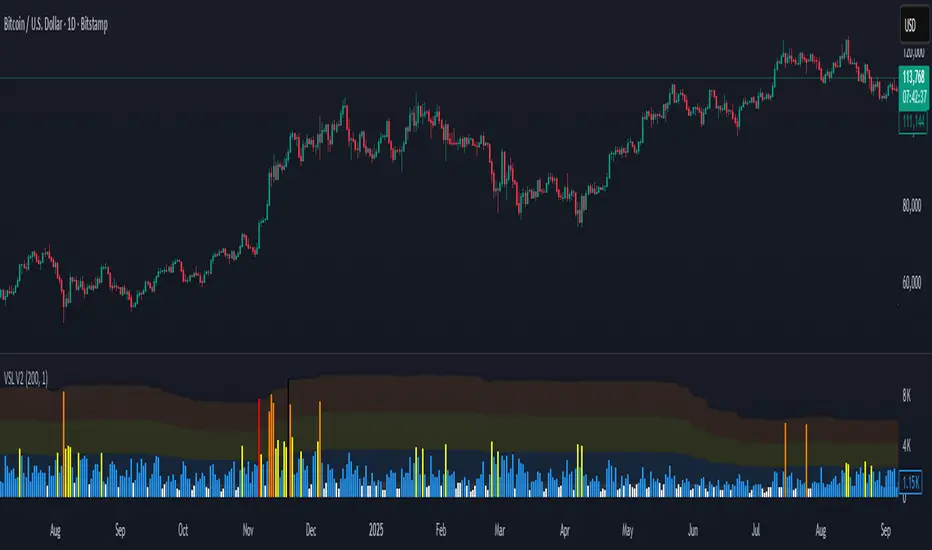
Volume Stress Level V2Volume Stress Level V2, is designed to provide a nuanced view of "RECENT" trading volume by identifying different levels of volume stress relative to a smoothed average.
Key Features:
Dynamic Volume Stress Calculation: The indicator calculates volume stress based on a Simple Moving Average (SMA) of volume and its standard deviation. The length of the SMA and the multiplier for the standard deviation are fully customizable, allowing you to adapt the indicator to different market conditions and trading styles.
Visual Volume Zones: The script visually categorizes volume into distinct zones:
Low Volume Zone: Represented by a white background, indicating periods of lower-than-average trading activity.
Normal Volume Zone: Highlighted in blue, signifying typical trading volume.
Medium Volume Zone: Displayed in yellow, denoting a moderate increase in volume.
High Volume Zone: Shown in orange, indicating significant volume spikes.
Spike Volume Zone: Marked in black, representing extreme volume events.
Customizable Background: You have the option to enable or disable the colored background fill for these volume zones, providing flexibility in how you visualize the data.
Bar Coloring: The volume bars themselves are color-coded according to the identified volume stress level, offering an immediate visual cue on your chart.
Adjustable Parameters:
VSL Length: Controls the lookback period for the SMA and standard deviation calculations.
Multiplier: Adjusts the sensitivity of the standard deviation bands, thereby influencing the width of the volume zones.
How to Use:
This indicator can be valuable for identifying potential shifts in market sentiment, confirming breakouts, or spotting periods of accumulation and distribution. By observing the transitions between volume zones, traders can gain insights into the conviction behind price movements.
Volume ScoreVolume Score Indicator (VSCR)
The Volume Score Indicator (VSCR) is a powerful tool designed to enhance your trading analysis by evaluating volume activity relative to historical levels. This indicator provides valuable insights into volume trends, highlighting significant volume spikes and their implications for price movements.
Key Features:
1. Volume Analysis:
a.) Volume (RVol): Calculates the relative volume based on the 50-day simple
moving average.
b.) High Volume Conditions: Identifies conditions where volume is significantly higher
than historical levels, including:
b1.) Highest Volume in 1 Year (HV1Y): Volume exceeds the highest volume of
the year.
b2.) Highest Volume in 3 Months (HVQ): Volume exceeds the highest volume of
the past 3 months.
c.) Pocket Pivot Volume (PPV):
c1.) High Relative Volume: Volume is at least twice the 50-day moving average
volume.
c2.) Pocket Pivot Volume: Latest bar volume is higher than the highest down
volume bar of the last 10 days.
2.Volume Score Calculation:
a.) Computes a cumulative volume score (VSCR) based on the frequency and magnitude
of identified high-volume conditions over a user-defined look-back period (default:
90 days).
b.) Adds points to the volume score based on relative volume (RVol). For example, if
the current day's relative volume is 500% of the 50-day average volume, 5 points
will be added to the volume score.
Formula: Volume Score = Volume Score + (RVol / 100)
3. Customizable Plotting:
a.) High Volume Plotting (HV): Option to plot circles above bars when HV1Y or HVQ
conditions are met.
b.) Pocket Pivot Volume Plotting (PPV): Option to plot circles above bars when any of
the Pocket Pivot Volume conditions are met.
4.Interactive Table Display:
a.) Configurable table to display key volume metrics and scores.
b.) Customizable table layout (horizontal or vertical) and positioning (top, middle,
bottom; left, center, right).
c.) Dynamic Background Coloring: The table cells are color-coded to highlight
significant volume levels and scores:
c1.) Blue: Indicates a very high volume score or count, signaling exceptionally
strong volume activity (e.g., count >= 15, score >= 50).
c2.) Green: Represents a high but not extreme volume level, suggesting notable
volume activity (e.g., 10 <= count < 15, 40 <= score < 50).
c3.) Orange: Marks moderate volume activity, which is still above average but
less pronounced (e.g., 7 <= count < 10, 25 <= score < 40).
c4.) Red: Signifies relatively low volume activity, potentially indicating less
significant volume changes (e.g., count < 7, score < 25).
5.How to Use:
a.) Input Parameters:
a1.) Plot HV: Toggle to plot high volume i.e. HV1Y and HVQ conditions on the
chart. When enabled green plot will appear above the price bars on the
chart.
a2.) Plot PPV: Toggle to plot pocket pivot volume conditions on the chart. When
enabled orange plot will appear above the price bars on the chart.
a3.) Look Back Period: Define the period for looking back to calculate volume
conditions and scores (default: 90 days).
b.) Table Display:
b1.) Panel Options: Customize the table's position, layout, text size, and colors
to suit your preferences.
b2.) Volume Metrics: The table displays counts of high-volume events (HV1Y,
HVQ & PPV) and the cumulative volume score, color-coded based on
thresholds for easy interpretation.
c.) Practical Applications:
c1.) Volume Spike Detection: Quickly identify significant volume spikes that
may indicate institutional buying.
c2.) Historical Volume Context: Understand current volume activity in the
context of historical volume patterns.
c3.) Enhanced Decision Making: Use volume insights to make informed trading
decisions, particularly around areas of significant volume changes.
This indicator is an essential tool for traders looking to incorporate volume analysis into their trading strategy, providing clear and actionable insights into volume dynamics.
***Note***
Candlestick Exclusion: The indicator ignores any candles where the closing price is less than the opening price. All calculations and analysis are based on candles where the closing price is higher than the opening price.

Volume Threshold Levels - Crypto LidyaVolume Threshold Levels – Crypto Lidya
Understanding volume behavior is one of the most effective ways to detect trend changes, manipulation candles, aggressive entries, and institutional activity.
Volume Threshold Levels (VTL) not only displays raw volume but also calculates dynamic volume thresholds (2x – 3x – 4x) based on the moving average, allowing you to identify statistically meaningful volume anomalies with precision.
📌 1. Volume Columns
The indicator plots each bar’s volume using traditional column-style visualization.
Green: Bullish candle
Red: Bearish candle
Gray: Neutral candle
This helps traders clearly understand the relationship between price and volume.
📌 2. Average Volume Area
VTL offers two types of moving averages for volume:
SMA (Simple Moving Average)
EMA (Exponential Moving Average)
The average volume is drawn as a soft yellow area across the chart.
This area acts as the baseline for normal volume levels.
📌 3. Dynamic Threshold Lines (2x / 3x / 4x)
The script calculates and displays multipliers of the average volume:
2x Average
3x Average
4x Average
These levels appear as bright yellow lines.
They are extremely useful for identifying breakouts, traps, and aggressive institutional entries.
📌 4. Volume Spike Detection (Alerts)
VTL identifies upward crossovers where volume breaks above key levels:
1x Volume Signal
2x Volume Signal
3x Volume Signal
4x Volume Signal
These can be used directly as TradingView alerts.
This allows you to automate detection of high-impact volume spikes.
📌 5. Use Cases
The indicator performs exceptionally well in:
Breakout confirmation
Liquidity sweep analysis
Detecting manipulation candles
Combining with OB, FVG, or other SMC structures
Scalping and low-timeframe aggressive volume interpretation
Algorithmic filters for volume-based strategies
📌 6. Summary
VTL delivers:
✔ Dynamic average volume baseline
✔ Clear 2x–3x–4x volume thresholds
✔ Accurate detection of upside volume explosions
✔ A strong tool for traders who rely on volume confirmation
Completely open-source and ready to be extended.

Volume Buy/Sell Signals [EdgeTerminal]Volume Signals is an indicator based on volume moving averages and divergence to provide different types of information.
The first signal is the peak volume box shown in red or green, showing the volume peak in an uptrend or downtrend. This usually is a sign of reversal or a slowdown in the trend, depending on the direction of the price.
Peak zones assume that a movement has reached your end for the time being or a new movement is initiated. This cannot be verified by simple volume alone, that's why we have a buy/sell signal feature based on divergence.
The narrow box indicates a continuation of the trend but can be used as support or resistance.
Medium box size usually means the price is in an accumulation phase. This can act as both support and resistance, meaning if the price pushes above, a long position can be taken, and if the price drops below, a short position can be taken.
Large box size indicates a range in which the price will stay shortly. This is usually a sign of high volume volatility and depending on the direction, the price can revisit the area and drop back down or go back up fast. For example, if the large green box appears after a major volume peak and if the price goes above the box, there is a major chance that the price will revisit the box zone and will drop as fast as it went up.
The second signal is a buy/sell signal generated based on the volume divergence and volume numbers compared to average volume values. If the volume is showing signs of lower lows or higher highs, the signal will appear. This indicator is great at generating early entry and exit signals.
Additionally, the script can generate LP (lower possibility) buy/sell signals. Usually, the script looks for two moving average lower lows in volume to generate a signal but when this is turned on, the indicator will also show single confirmed (we call them lower possibility) signals. This is useful when there are not enough signals generated on screen and you want to see more data points.
The settings:
Volume Peak MA: Sets the moving average of the volume peak,
Volume Peak Box Length: Defines the box display length of the volume box across the chart
Volume Box Threshold: Threshold of volume peak detection. A lower number generates more signals and a higher number generates fewer.
First Signal MA Length: First moving average length used in the calculation of the volume signals
Second Signal MA length: Second moving average length used in the calculation of the volume signals
Volume Lookback Right: How many bars to look back on the right side (forward) to confirm the signal
Volume Lookback Left: How many bars to look back on the left side (behind) to confirm the signal
Max Lookback Range: Max lookback range for the KNN machine learning volume data of signal generation.
Min Lookback Range: Minimum lookback range for the KNN machine learning volume data of signal generation.
Show Buy Signals: It shows or hides buy signals.
Show LP Buys: It shows or hides lower possibility buy signals.
Show Sell Signals: It shows or hides sell signals.
Show LP Sells: It shows or hides lower possibility sell signals.

Volume Spikes & Growing Volume Signals With Alerts & ScannerVOLUME SPIKES & GROWING VOLUME SIGNALS WITH ALERTS & SCANNER
This indicator shows arrows when there is a volume spike. It also paints the background when volume is growing. There is also a volume scanner for 8 tickers that will change color in real time when your other favorite tickers see volume growth and spikes.
You can customize the length of DMI, the number of bars to calculate the current volume average from, the number of bars back to get the overall volume average from, the multiple that needs to be hit to give a signal, the position of the scanner table and which tickers are used in the scanner. There are detailed directions as tooltips in the indicator settings you can read to understand exactly what each input does.
All features are customizable as well as which tickers the screener uses.
***HOW TO USE***
Watch for volume to pick up before placing trades as this will help you stay out of the markets when price is choppy. Volume usually brings volatility so watch for the volume signals to show up on the chart. Typically when price has made a big move one direction or is consolidating and you see the volume indicator start giving signals, the market is ready to reverse or continue its current trend but move faster in that direction.
Volume Spikes
When there is a volume spike that is larger than the average of volume over the last 100+ bars(depending on your settings) multiplied by the volume amount multiplier(in your settings) then an arrow will show up on the chart. This arrow will be green if DMI is bullish and red if DMI is bearish.
Volume Growth
A Background color will appear when the average volume over the last 5 bars(depending on your settings) is higher than the average volume over the last 100+ bars(depending on your settings) and is greater than your multiple. It will also paint the background when the volume moving average has increased over the last 3 bars consecutively. The background colors will be red or green depending on buy & sell pressure(DMI). If the background color appears, then you know volume is growing and volatility is near.
Volume Scanner
The scanner can be customized to have all of your favorite tickers by changing the tickers used in the indicator settings at the bottom. When no volume growth or spikes are detected, the ticker will show as light blue. When volume spikes or growth is detected, the ticker will turn orange to notify you.
Alerts
You can set up alerts as well when there is volume growth, bullish volume spikes and bearish volume spikes on any chart or timeframe.
Indicator Settings
Settings will need to be adjusted across different tickers as some have large swings in volume and some stay pretty even, so make sure to set up different chart layouts with settings that work for each ticker and save them individually so you don’t have to reset these values every time you switch charts.
***MARKETS***
This indicator can be used as a signal on all markets, including stocks, crypto, futures and forex as long as Tradingview has volume and DMI data for that ticker.
***TIMEFRAMES***
This volume spike indicator can be used on all timeframes as long as there is enough data for Tradingview to use for calculations.
***TIPS***
Try using numerous indicators of ours on your chart so you can instantly see the bullish or bearish trend of multiple indicators in real time without having to analyze the data. Some of our favorites are our Auto Fibonacci, Volume Profile, Momentum, Auto Support And Resistance and Money Flow Index in combination with this Volume Growth indicator. They all have real time Bullish and Bearish labels as well so you can immediately understand each indicator's trend.

Volume Spread Analysis [TANHEF]Volume Spread Analysis: Understanding Market Intentions through the Interpretation of Volume and Price Movements.
█ Simple Explanation:
The Volume Spread Analysis (VSA) indicator is a comprehensive tool that helps traders identify key market patterns and trends based on volume and spread data. This indicator highlights significant VSA patterns and provides insights into market behavior through color-coded volume/spread bars and identification of bars indicating strength, weakness, and neutrality between buyers and sellers. It also includes powerful volume and spread forecasting capabilities.
█ Laws of Volume Spread Analysis (VSA):
The origin of VSA begins with Richard Wyckoff, a pivotal figure in its development. Wyckoff made significant contributions to trading theory, including the formulation of three basic laws:
The Law of Supply and Demand: This fundamental law states that supply and demand balance each other over time. High demand and low supply lead to rising prices until demand falls to a level where supply can meet it. Conversely, low demand and high supply cause prices to fall until demand increases enough to absorb the excess supply.
The Law of Cause and Effect: This law assumes that a 'cause' will result in an 'effect' proportional to the 'cause'. A strong 'cause' will lead to a strong trend (effect), while a weak 'cause' will lead to a weak trend.
The Law of Effort vs. Result: This law asserts that the result should reflect the effort exerted. In trading terms, a large volume should result in a significant price move (spread). If the spread is small, the volume should also be small. Any deviation from this pattern is considered an anomaly.
█ Volume and Spread Analysis Bars:
Display: Volume and/or spread bars that consist of color coded levels. If both of these are displayed, the number of spread bars can be limited for visual appeal and understanding, with the spread bars scaled to match the volume bars. While automatic calculation of the number of visual bars for auto scaling is possible, it is avoided to prevent the indicator from reloading whenever the number of visual price bars on the chart is adjusted, ensuring uninterrupted analysis. A displayable table (Legend) of bar colors and levels can give context and clarify to each volume/spread bar.
Calculation: Levels are calculated using multipliers applied to moving averages to represent key levels based on historical data: low, normal, high, ultra. This method smooths out short-term fluctuations and focuses on longer-term trends.
Low Level: Indicates reduced volatility and market interest.
Normal Level: Reflects typical market activity and volatility.
High Level: Indicates increased activity and volatility.
Ultra Level: Identifies extreme levels of activity and volatility.
This illustrates the appearance of Volume and Spread bars when scaled and plotted together:
█ Forecasting Capabilities:
Display: Forecasted volume and spread levels using predictive models.
Calculation: Volume and Spread prediction calculations differ as volume is linear and spread is non-linear.
Volume Forecast (Linear Forecasting): Predicts future volume based on current volume rate and bar time till close.
Spread Forecast (Non-Linear Dynamic Forecasting): Predicts future spread using a dynamic multiplier, less near midpoint (consolidation) and more near low or high (trending), reflecting non-linear expansion.
Moving Averages: In forecasting, moving averages utilize forecasted levels instead of actual levels to ensure the correct level is forecasted (low, normal, high, or ultra).
The following compares forecasted volume with actual resulting volume, highlighting the power of early identifying increased volume through forecasted levels:
█ VSA Patterns:
Criteria and descriptions for each VSA pattern are available as tooltips beside them within the indicator’s settings. These tooltips provide explanations of potential developments based on the volume and spread data.
Signs of Strength (🟢): Patterns indicating strong buying pressure and potential market upturns.
Down Thrust
Selling Climax
No Effort → Bearish Result
Bearish Effort → No Result
Inverse Down Thrust
Failed Selling Climax
Bull Outside Reversal
End of Falling Market (Bag Holder)
Pseudo Down Thrust
No Supply
Signs of Weakness (🔴): Patterns indicating strong selling pressure and potential market downturns.
Up Thrust
Buying Climax
No Effort → Bullish Result
Bullish Effort → No Result
Inverse Up Thrust
Failed Buying Climax
Bear Outside Reversal
End of Rising Market (Bag Seller)
Pseudo Up Thrust
No Demand
Neutral Patterns (🔵): Patterns indicating market indecision and potential for continuation or reversal.
Quiet Doji
Balanced Doji
Strong Doji
Quiet Spinning Top
Balanced Spinning Top
Strong Spinning Top
Quiet High Wave
Balanced High Wave
Strong High Wave
Consolidation
Bar Patterns (🟡): Common candlestick patterns that offer insights into market sentiment. These are required in some VSA patterns and can also be displayed independently.
Bull Pin Bar
Bear Pin Bar
Doji
Spinning Top
High Wave
Consolidation
This demonstrates the acronym and descriptive options for displaying bar patterns, with the ability to hover over text to reveal the descriptive text along with what type of pattern:
█ Alerts:
VSA Pattern Alerts: Notifications for identified VSA patterns at bar close.
Volume and Spread Alerts: Alerts for confirmed and forecasted volume/spread levels (Low, High, Ultra).
Forecasted Volume and Spread Alerts: Alerts for forecasted volume/spread levels (High, Ultra) include a minimum percent time elapsed input to reduce false early signals by ensuring sufficient bar time has passed.
█ Inputs and Settings:
Display Volume and/or Spread: Choose between displaying volume bars, spread bars, or both with different lookback periods.
Indicator Bar Color: Select color schemes for bars (Normal, Detail, Levels).
Indicator Moving Average Color: Select schemes for bars (Fill, Lines, None).
Price Bar Colors: Options to color price bars based on VSA patterns and volume levels.
Legend: Display a table of bar colors and levels for context and clarity of volume/spread bars.
Forecast: Configure forecast display and prediction details for volume and spread.
Average Multipliers: Define multipliers for different levels (Low, High, Ultra) to refine the analysis.
Moving Average: Set volume and spread moving average settings.
VSA: Select the VSA patterns to be calculated and displayed (Strength, Weakness, Neutral).
Bar Patterns: Criteria for bar patterns used in VSA (Doji, Bull Pin Bar, Bear Pin Bar, Spinning Top, Consolidation, High Wave).
Colors: Set exact colors used for indicator bars, indicator moving averages, and price bars.
More Display Options: Specify how VSA pattern text is displayed (Acronym, Descriptive), positioning, and sizes.
Alerts: Configure alerts for VSA patterns, volume, and spread levels, including forecasted levels.
█ Usage:
The Volume Spread Analysis indicator is a helpful tool for leveraging volume spread analysis to make informed trading decisions. It offers comprehensive visual and textual cues on the chart, making it easier to identify market conditions, potential reversals, and continuations. Whether analyzing historical data or forecasting future trends, this indicator provides insights into the underlying factors driving market movements.

Volume Spectrum Candles"Volume Spectrum Candles" is a visually intuitive trading indicator that enhances candlestick charts by incorporating trading volume directly into the color of each candle.
Purpose and Utility:
This tool assigns a unique color gradient to candlesticks, which varies from light to dark based on the volume of trades executed. This feature allows traders to immediately recognize and differentiate periods of varying trading activity at a glance.
Target User:
It is specifically designed for traders who integrate volume analysis into their trading strategies, offering a seamless blend of visual cues and technical data.
Benefits:
By providing a visual representation of volume intensity, traders can more effectively identify key market movements, helping to determine optimal entry and exit points. The color gradation adds a layer of quick analysis, making it easier to spot trends in trading volume without the need for additional indicators.
Application and Versatility:
Whether used by day traders to capture short-term price movements or by long-term investors to gauge broader market sentiment, "Volume Spectrum Candles" serves as a valuable addition to any trading setup.

Volume Profile Free Pro (25 Levels Value Area VWAP) by RRBVolume Profile Free Pro by RagingRocketBull 2019
Version 1.0
All available Volume Profile Free Pro versions are listed below (They are very similar and I don't want to publish them as separate indicators):
ver 1.0: style columns implementation
ver 2.0: style histogram implementation
ver 3.0: style line implementation
This indicator calculates Volume Profile for a given range and shows it as a histogram consisting of 25 horizontal bars.
It can also show Point of Control (POC), Developing POC, Value Area/VWAP StdDev High/Low as dynamically moving levels.
Free accounts can't access Standard TradingView Volume Profile, hence this indicator.
There are 3 basic methods to calculate the Value Area for a session.
- original method developed by Steidlmayr (calculated around POC)
- classical method using StdDev (calculated around the mean VWAP)
- another method based on the mean absolute deviation (calculated around the median)
POC is a high volume node and can be used as support/resistance. But when far from the day's average price it may not be as good a trend filter as the other methods.
The 80% Rule: When the market opens above/below the Value Area and then returns/stays back inside for 2 consecutive 30min periods it has 80% chance of filling VA (like a gap).
There are several versions: Free, Free Pro, Free MAX. This is the Free Pro version. The Differences are listed below:
- Free: 30 levels, Buy/Sell/Total Volume Profile views, POC
- Free Pro: 25 levels, +Developing POC, Value Area/VWAP High/Low Levels, Above/Below Area Dimming
- Free MAX: 50 levels, packed to the limit
Features:
- Volume Profile with up to 25 levels (3 implementations)
- POC, Developing POC Levels
- Buy/Sell/Total/Side by Side View modes
- Side Cover
- Value Area, VAH/VAL dynamic levels
- VWAP High/Low dynamic levels with Source, Length, StdDev as params
- Show/Hide all levels
- Dim Non Value Area Zones
- Custom Range with Highlighting
- 3 Anchor points for Volume Profile
- Flip Levels Horizontally
- Adjustable width, offset and spacing of levels
- Custom Color for POC/VA/VWAP levels and Transparency for buy/sell levels
Usage:
- specify max_level/min_level for a range (required in ver 1.0/2.0, auto/optional in ver 3.0 = set to highest/lowest)
- select range (start_bar, range length), confirm with range highlighting
- select mode Value Area or VWAP to show corresponding levels.
- flip/select anchor point to position the buy/sell levels, adjust width and spacing as needed
- select Buy/Sell/Total/Side by Side view mode
- use POC/Developing POC/VA/VWAP High/Low as S/R levels. Usually daily values from 1-3 days back are used as levels for the current day.
- Green - buy volume of a specific price level in a range, Red - sell volume. Green + Red = Total volume of a price level in a range
There's no native support for vertical histograms in Pinescript (with price axis as base)
Basically, there are 4 ways to plot a series of horizontal bars stacked on top of each other:
1. plotshape style labeldown (ver 0 prototype discarded)
- you can have a set of fixed width/height text labels consisting of a series of underscores and moving dynamically as levels. Level offset controls visible length.
- you can move levels and scale the base width of the volume profile histogram dynamically
- you can calculate the highest/lowest range values automatically. max_level/min_level inputs are optional
- you can't fill the gaps between levels/adjust/extend width, height - this results in a half baked volume profile and looks ugly
- fixed text level height doesn't adjust and looks bad on a log scale
- fixed font width also doesn't scale and can't be properly aligned with bars when zooming
2. plot style columns + hist_base (ver 1.0)
- you can plot long horizontal bars using a series of small adjacent vertical columns with level offsets controlling visible length.
- you can't hide/move levels of the volume profile histogram dynamically on each bar, they must be plotted at all times regardless - you can't delete the history of a plot.
- you can't scale the base width of the volume profile histogram dynamically, can't set show_last from input, must use a preset fixed width for each level
- hist_base can only be a static const expression, can't be assigned highest/lowest range values automatically - you have to specify max_level/min_level manually from input
- you can't control spacing between columns - there's an equalizer bar effect when you zoom in, and solid bars when you zoom out
- using hist_base for levels results in ugly load/redraw times - give it 3-5 sec to finalize its shape after each UI param change
- level top can be properly aligned with another level's bottom producing a clean good looking histogram
- columns are properly aligned with bars automatically
3. plot style histogram + hist_base (ver 2.0)
- you can plot long horizontal bars using a series of small vertical bars (horizontal histogram) instead of columns.
- you can control the width of each histogram bar comprising a level (spacing/horiz density). Large enough width will cause bar overlapping and give level a "solid" look regardless of zoom
- you can only set width <= 4 in UI Style - custom textbox input is provided for larger values. You can set width and plot transparency from input
- this method still uses hist_base and inherits other limitations of ver 2.0
4. plot style lines (ver 3.0)
- you can also plot long horizontal bars using lines with level offsets controlling visible length.
- lines don't need hist_base - fast and smooth redraw times
- you can calculate the highest/lowest range values automatically. max_level/min_level inputs are optional
- level top can't be properly aligned with another level's bottom and have a proper spacing because line width uses its own units and doesn't scale
- fixed line width of a level (vertical thickness) doesn't scale and looks bad on log (level overlapping)
- you can only set width <= 4 in UI Style, a custom textbox input is provided for larger values. You can set width and plot transparency from input
Notes:
- hist_base for levels results in ugly load/redraw times - give it 3-5 sec to finalize its shape after each UI param change
- indicator is slow on TFs with long history 10000+ bars
- Volume Profile/Value Area are calculated for a given range and updated on each bar. Each level has a fixed width. Offsets control visible level parts. Side Cover hides the invisible parts.
- Custom Color for POC/VA/VWAP levels - UI Style color/transparency can only change shape's color and doesn't affect textcolor, hence this additional option
- Custom Widh for levels - UI Style supports only width <= 4, hence this additional option
- POC is visible in both modes. In VWAP mode Developing POC becomes VWAP, VA High and Low => VWAP High and Low correspondingly to minimize the number of plot outputs
- You can't change buy/sell level colors (only plot transparency) - this requires 2x plot outputs exceeding max 64 limit. That's why 2 additional plots are used to dim the non Value Area zones
- Use Side by Side view to compare buy and sell volumes between each other: base width = max(total_buy_vol, total_sell_vol)
- All buy/sell volume lengths are calculated as % of a fixed base width = 100 bars (100%). You can't set show_last from input
- Sell Offset is calculated relative to Buy Offset to stack/extend sell on top of buy. Buy Offset = Zero - Buy Length. Sell Offset = Buy Offset - Sell Length = Zero - Buy Length - Sell Length
- If you see "loop too long error" - change some values in UI and it will recalculate - no need to refresh the chart
- There's no such thing as buy/sell volume, there's just volume, but for the purposes of the Volume Profile method, assume: bull candle = buy volume, bear candle = sell volume
- Volume Profile Range is limited to 5000 bars for free accounts
P.S. Cantaloupia Will be Free!
Links on Volume Profile and Value Area calculation and usage:
www.tradingview.com
stockcharts.com
onlinelibrary.wiley.com

Volume Profile Free MAX SLI (50 Levels Value Area VWAP) by RRBVolume Profile Free MAX SLI by RagingRocketBull 2019
Version 1.0
All available Volume Profile Free MAX SLI versions are listed below (They are very similar and I don't want to publish them as separate indicators):
ver 1.0: style columns implementation
ver 2.0: style histogram implementation
ver 3.0: style line implementation
This indicator calculates Volume Profile for a given range and shows it as a histogram consisting of 50 horizontal bars.
It can also show Point of Control (POC), Developing POC, Value Area/VWAP StdDev High/Low as dynamically moving levels.
Free accounts can't access Standard TradingView Volume Profile, hence this indicator.
There are several versions: Free Pro, Free MAX SLI, Free History. This is the Free MAX SLI version. The Differences are listed below:
- Free Pro: 25 levels, +Developing POC, Value Area/VWAP High/Low Levels, Above/Below Area Dimming
- Free MAX SLI: 50 levels, packed to the limit, 2x SLI modes for Buy/Sell or even higher res 150 levels
- Free History: auto highest/lowest, historic poc/va levels for each session
Features:
- High-Res Volume Profile with up to 50 levels (3 implementations)
- 20-30x faster than the old Pro versions especially on lower tfs with long history
- 2x SLI modes for even higher res: 150 levels with 3x vertical SLI, 50 buy/sell levels with 2x horiz SLI
- Calculate Volume Profile on full history
- POC, Developing POC Levels
- Buy/Sell/Total volume modes
- Side Cover
- Value Area, VAH/VAL dynamic levels
- VWAP High/Low dynamic levels with Source, Length, StdDev as params
- Show/Hide all levels
- Dim Non Value Area Zones
- Custom Range with Highlighting
- 3 Anchor points for Volume Profile
- Flip Levels Horizontally
- Adjustable width, offset and spacing of levels
- Custom Color for POC/VA/VWAP levels and Transparency for buy/sell levels
Usage:
- specify max_level/min_level/spacing (required)
- select range (start_bar, range length), confirm with range highlighting
- select volume type: Buy/Sell/Total
- select mode Value Area/VWAP to show corresponding levels
- flip/select anchor point to position the buy/sell levels
- use Horiz SLI mode for 50 Buy/Sell or Vertical SLI for 150 levels if needed
- use POC/Developing POC/VA/VWAP High/Low as S/R levels. Usually daily values from 1-3 days back are used as levels for the current day.
SLI:
- use SLI modes to extend the functionality of the indicator:
- Horiz Buy/Sell 2x SLI lets you view 50 Buy/Sell Levels at the same time
- Vertical Max_Vol 3x SLI lets you increase the resolution to 150 levels
- you need at least 2 instances of the indicator attached to the same chart for SLI to work
1) Enable Horiz SLI:
- attach 2 indicator instances to the chart
- make sure all instances have the same min_level/max_level/range/spacing settings
- select volume type for each instance: you can have a buy/sell or buy/total or sell/total SLI. Make sure your buy volume instance is the last attached to be displayed on top of sell/total instances without overlapping.
- set buy_sell_sli_mode to true for indicator instances with volume_type = buy/sell, for type total this is optional.
- this basically tells the script to calculate % lengths based on total volume instead of individual buy/sell volumes and use ext offset for sell levels
- Sell Offset is calculated relative to Buy Offset to stack/extend sell after buy. Buy Offset = Zero - Buy Length. Sell Offset = Buy Offset - Sell Length = Zero - Buy Length - Sell Length
- there are no master/slave instances in this mode, all indicators are equal, poc/va levels are not affected and can work independently, i.e. one instance can show va levels, another - vwap.
2) Enable Vertical SLI:
- attach the first instance and evaluate the full range to roughly determine where is the highest max_vol/poc level i.e. 0..20000, poc is in the bottom half (third, middle etc) or
- add more instances and split the full vertical range between them, i.e. set min_level/max_level of each corresponding instance to 0..10000, 10000..20000 etc
- make sure all instances have the same range/spacing settings
- an instance with a subrange containing the poc level of the full range is now your master instance (bottom half). All other instances are slaves, their levels will be calculated based on the max_vol/poc of the master instance instead of local values
- set show_max_vol_sli to true for the master instance. for slave instances this is optional and can be used to check if master/slave max_vol values match and slave can read the master's value. This simply plots the max_vol value
- you can also attach all instances and set show_max_vol_sli to true in all of them - the instance with the largest max_vol should become the master
Auto/Manual Ext Max_Vol Modes:
- for auto vertical max_vol SLI mode set max_vol_sli_src in all slave instances to the max_vol of the master indicator: "VolumeProfileFree_MAX_RRB: Max Volume for Vertical SLI Mode". It can be tricky with 2+ instances
- in case auto SLI mode doesn't work - assign max_vol_sli_ext in all slave instances the max_vol value of the master indicator manually and repeat on each change
- manual override max_vol_sli_ext has higher priority than auto max_vol_sli_src when both values are assigned, when they are 0 and close respectively - SLI is disabled
- master/slave max_vol values must match on each bar at all times to maintain proper level scale, otherwise slave's levels will look larger than they should relative to the master's levels.
- Max_vol (red) is the last param in the long list of indicator outputs
- the only true max_vol/poc in this SLI mode is the master's max_vol/poc. All poc/va levels in slaves will be irrelevant and are disabled automatically. Slaves can only show VWAP levels.
- VA Levels of the master instance in this SLI mode are calculated based on the subrange, not the whole range. Cross check with the full range.
WARNING!
- auto mode max_vol_sli_src is experimental and may not work as expected
- you can only assign auto mode max_vol_sli_src = max_vol once due to some bug with unhandled exception/buffer overflow in Tradingview. Seems that you can clear the value only by removing the indicator instance
- sometimes you may see a "study in error state" error when attempting to set it back to close. Remove indicator/Reload chart and start from scratch
- volume profile may not finish to redraw and freeze in an ugly shape after an UI parameter change when max_vol_sli_src is assigned a max_vol value. Assign it to close - VP should redraw properly, but it may not clear the assigned max_vol value
- you can't seem to be able to assign a proper auto max_vol value to the 3rd slave instance
- 2x Vertical SLI works and tested in both auto/manual, 3x SLI - only manual seems to work
Notes:
- This code is 20x-30x faster (main for cycle is removed) especially on lower tfs with long history - only 2-3 sec load/redraw time vs 30-60 sec of the old Pro versions
- Instead of repeatedly calculating the total sum of volumes for the whole range on each bar, vol sums are now increased on each bar and passed to the next in the range making it a per range vs per bar calculation that reduces time dramatically
- hist_base for levels still results is ugly redraw
- if you don't see a volume profile check range settings: min_level/max_level and spacing, set spacing to 0 (or adjust accordingly based on the symbol's precision, i.e. 0.00001)
- you can view either of Buy/Sell/Total volumes, but you can't display Buy/Sell levels at the same time using a single instance (this would 2x reduce the number of levels). Use 2 indicator instances in horiz buy/sell sli mode for that.
- Volume Profile/Value Area are calculated for a given range and updated on each bar. Each level has a fixed length. Offsets control visible level parts. Side Cover hides the invisible parts.
- Custom Color for POC/VA/VWAP levels - UI Style color/transparency can only change shape's color and doesn't affect textcolor, hence this additional option
- Custom Width - UI Style supports only width <= 4, hence this additional option
- POC is visible in both modes. In VWAP mode Developing POC becomes VWAP, VA High and Low => VWAP High and Low correspondingly to minimize the number of plot outputs
- You can't change buy/sell level colors from input (only plot transparency) - this requires 2x plot outputs => 2x reduces the number of levels to fit the max 64 limit. That's why 2 additional plots are used to dim the non Value Area zones
- All buy/sell volume lengths are calculated as % of a fixed base width = 100 bars (100%). You can't set show_last from input to change it
- There's no such thing as buy/sell volume, there's just volume, but for the purposes of the Volume Profile method, assume: bull candle = buy volume, bear candle = sell volume
P.S. Gravitonium Levels Are Increasing. Unobtainium is nowhere to be found!
Links on Volume Profile and Value Area calculation and usage:
www.tradingview.com
stockcharts.com
onlinelibrary.wiley.com

Volume Profile Free Ultra SLI (100 Levels Value Area VWAP) - RRBVolume Profile Free Ultra SLI by RagingRocketBull 2019
Version 1.0
This indicator calculates Volume Profile for a given range and shows it as a histogram consisting of 100 horizontal bars.
This is basically the MAX SLI version with +50 more Pinescript v4 line objects added as levels.
It can also show Point of Control (POC), Developing POC, Value Area/VWAP StdDev High/Low as dynamically moving levels.
Free accounts can't access Standard TradingView Volume Profile, hence this indicator.
There are several versions: Free Pro, Free MAX SLI, Free Ultra SLI, Free History. This is the Free Ultra SLI version. The Differences are listed below:
- Free Pro: 25 levels, +Developing POC, Value Area/VWAP High/Low Levels, Above/Below Area Dimming
- Free MAX SLI: 50 levels, 2x SLI modes for Buy/Sell or even higher res 150 levels
- Free Ultra SLI: 100 levels, packed to the limit, 2x SLI modes for Buy/Sell or even higher res 300 levels
- Free History: auto highest/lowest, historic poc/va levels for each session
Features:
- High-Res Volume Profile with up to 100 levels (line implementation)
- 2x SLI modes for even higher res: 300 levels with 3x vertical SLI, 100 buy/sell levels with 2x horiz SLI
- Calculate Volume Profile on full history
- POC, Developing POC Levels
- Buy/Sell/Total volume modes
- Side Cover
- Value Area, VAH/VAL dynamic levels
- VWAP High/Low dynamic levels with Source, Length, StdDev as params
- Show/Hide all levels
- Dim Non Value Area Zones
- Custom Range with Highlighting
- 3 Anchor points for Volume Profile
- Flip Levels Horizontally
- Adjustable width, offset and spacing of levels
- Custom Color for POC/VA/VWAP levels, Transparency for buy/sell levels
WARNING:
- Compilation Time: 1 min 20 sec
Usage:
- specify max_level/min_level/spacing (required)
- select range (start_bar, range length), confirm with range highlighting
- select volume type: Buy/Sell/Total
- select mode Value Area/VWAP to show corresponding levels
- flip/select anchor point to position the buy/sell levels
- use Horiz Buy/Sell SLI mode with 100 or Vertical SLI with 300 levels if needed
- use POC/Developing POC/VA/VWAP High/Low as S/R levels. Usually daily values from 1-3 days back are used as levels for the current day.
SLI:
use SLI modes to extend the functionality of the indicator:
- Horiz Buy/Sell 2x SLI lets you view 100 Buy/Sell Levels at the same time
- Vertical Max_Vol 3x SLI lets you increase the resolution to 300 levels
- you need at least 2 instances of the indicator attached to the same chart for SLI to work
1) Enable Horiz SLI:
- attach 2 indicator instances to the chart
- make sure all instances have the same min_level/max_level/range/spacing settings
- select volume type for each instance: you can have a buy/sell or buy/total or sell/total SLI. Make sure your buy volume instance is the last attached to be displayed on top of sell/total instances without overlapping.
- set buy_sell_sli_mode to true for indicator instances with volume_type = buy/sell, for type total this is optional.
- this basically tells the script to calculate % lengths based on total volume instead of individual buy/sell volumes and use ext offset for sell levels
- Sell Offset is calculated relative to Buy Offset to stack/extend sell after buy. Buy Offset = Zero - Buy Length. Sell Offset = Buy Offset - Sell Length = Zero - Buy Length - Sell Length
- there are no master/slave instances in this mode, all indicators are equal, poc/va levels are not affected and can work independently, i.e. one instance can show va levels, another - vwap.
2) Enable Vertical SLI:
- attach the first instance and evaluate the full range to roughly determine where is the highest max_vol/poc level i.e. 0..20000, poc is in the bottom half (third, middle etc) or
- add more instances and split the full vertical range between them, i.e. set min_level/max_level of each corresponding instance to 0..10000, 10000..20000 etc
- make sure all instances have the same range/spacing settings
- an instance with a subrange containing the poc level of the full range is now your master instance (bottom half). All other instances are slaves, their levels will be calculated based on the max_vol/poc of the master instance instead of local values
- set show_max_vol_sli to true for the master instance. for slave instances this is optional and can be used to check if master/slave max_vol values match and slave can read the master's value. This simply plots the max_vol value
- you can also attach all instances and set show_max_vol_sli to true in all of them - the instance with the largest max_vol should become the master
Auto/Manual Ext Max_Vol Modes:
- for auto vertical max_vol SLI mode set max_vol_sli_src in all slave instances to the max_vol of the master indicator: "VolumeProfileFree_MAX_RRB: Max Volume for Vertical SLI Mode". It can be tricky with 2+ instances
- in case auto SLI mode doesn't work - assign max_vol_sli_ext in all slave instances the max_vol value of the master indicator manually and repeat on each change
- manual override max_vol_sli_ext has higher priority than auto max_vol_sli_src when both values are assigned, when they are 0 and close respectively - SLI is disabled
- master/slave max_vol values must match on each bar at all times to maintain proper level scale, otherwise slave's levels will look larger than they should relative to the master's levels.
- Max_vol (red) is the last param in the long list of indicator outputs
- the only true max_vol/poc in this SLI mode is the master's max_vol/poc. All poc/va levels in slaves will be irrelevant and are disabled automatically. Slaves can only show VWAP levels.
- VA Levels of the master instance in this SLI mode are calculated based on the subrange, not the whole range and may be inaccurate. Cross check with the full range.
WARNING!
- auto mode max_vol_sli_src is experimental and may not work as expected
- you can only assign auto mode max_vol_sli_src = max_vol once due to some bug with unhandled exception/buffer overflow in Tradingview. Seems that you can clear the value only by removing the indicator instance
- sometimes you may see a "study in error state" error when attempting to set it back to close. Remove indicator/Reload chart and start from scratch
- volume profile may not finish to redraw and freeze in an ugly shape after an UI parameter change when max_vol_sli_src is assigned a max_vol value. Assign it to close - VP should redraw properly, but it may not clear the assigned max_vol value
- you can't seem to be able to assign a proper auto max_vol value to the 3rd slave instance
- 2x Vertical SLI works and tested in both auto/manual, 3x SLI - only manual seems to work (you can have a mixed mode: 2nd instance - auto, 3rd - manual)
Notes:
- This code uses Pinescript v3 compatibility framework
- This code is 20x-30x faster (main for cycle is removed) especially on lower tfs with long history - only 4-5 sec load/redraw time vs 30-60 sec of the old Pro versions
- Instead of repeatedly calculating the total sum of volumes for the whole range on each bar, vol sums are now increased on each bar and passed to the next in the range making it a per range vs per bar calculation that reduces time dramatically
- 100 levels consist of 50 main plot levels and 50 line objects used as alternate levels, differences are:
- line objects are always shown on top of other objects, such as plot levels, zero line and side cover, it's not possible to cover/move them below.
- all line objects have variable lengths, use actual x,y coords and don't need side cover, while all plot levels have a fixed length of 100 bars, use offset and require cover.
- all key properties of line objects, such as x,y coords, color can be modified, objects can be moved/deleted, while this is not possible for static plot levels.
- large width values cause line objects to expand only up/down from center while their length remains the same and stays within the level's start/end points similar to an area style.
- large width values make plot levels expand in all directions (both h/v), beyond level start/end points, sometimes overlapping zero line, making them an inaccurate % length representation, as opposed to line objects/plot levels with area style.
- large width values translate into different widths on screen for line objects and plot levels.
- you can't compensate for this unwanted horiz width expansion of plot levels because width uses its own units, that don't translate into bars/pixels.
- line objects are visible only when num_levels > 50, plot levels are used otherwise
- Since line objects are lines, plot levels also use style line because other style implementations will break the symmetry/spacing between levels.
- if you don't see a volume profile check range settings: min_level/max_level and spacing, set spacing to 0 (or adjust accordingly based on the symbol's precision, i.e. 0.00001)
- you can view either of Buy/Sell/Total volumes, but you can't display Buy/Sell levels at the same time using a single instance (this would 2x reduce the number of levels). Use 2 indicator instances in horiz buy/sell sli mode for that.
- Volume Profile/Value Area are calculated for a given range and updated on each bar. Each level has a fixed length. Offsets control visible level parts. Side Cover hides the invisible parts.
- Custom Color for POC/VA/VWAP levels - UI Style color/transparency can only change shape's color and doesn't affect textcolor, hence this additional option
- Custom Width - UI Style supports only width <= 4, hence this additional option
- POC is visible in both modes. In VWAP mode Developing POC becomes VWAP, VA High and Low => VWAP High and Low correspondingly to minimize the number of plot outputs
- You can't change buy/sell level colors from input (only transparency) - this requires 2x plot outputs => 2x reduces the number of levels to fit the max 64 limit. That's why 2 additional plots are used to dim the non Value Area zones
- You can change level transparency of line objects. Due to Pinescript limitations, only discrete values are supported.
- Inverse transp correlation creates the necessary illusion of "covered" line objects, although they are shown on top of the cover all the time
- If custom lines_transp is set the illusion will break because transp range can't be skewed easily (i.e. transp 0..100 is always mapped to 100..0 and can't be mapped to 50..0)
- transparency can applied to lines dynamically but nva top zone can't be completely removed because plot/mixed type of levels are still used when num_levels < 50 and require cover
- transparency can't be applied to plot levels dynamically from script this can be done only once from UI, and you can't change plot color for the past length bars
- All buy/sell volume lengths are calculated as % of a fixed base width = 100 bars (100%). You can't set show_last from input to change it
- Range selection/Anchoring is not accurate on charts with time gaps since you can only anchor from a point in the future and measure distance in time periods, not actual bars, and there's no way of knowing the number of future gaps in advance.
- Adjust Width for Log Scale mode now also works on high precision charts with small prices (i.e. 0.00001)
- in Adjust Width for Log Scale mode Level1 width extremes can be capped using max deviation (when level1 = 0, shift = 0 width becomes infinite)
- There's no such thing as buy/sell volume, there's just volume, but for the purposes of the Volume Profile method, assume: bull candle = buy volume, bear candle = sell volume
P.S. I am your grandfather, Luke! Now, join the Dark Side in your father's steps or be destroyed! Once more the Sith will rule the Galaxy, and we shall have peace...

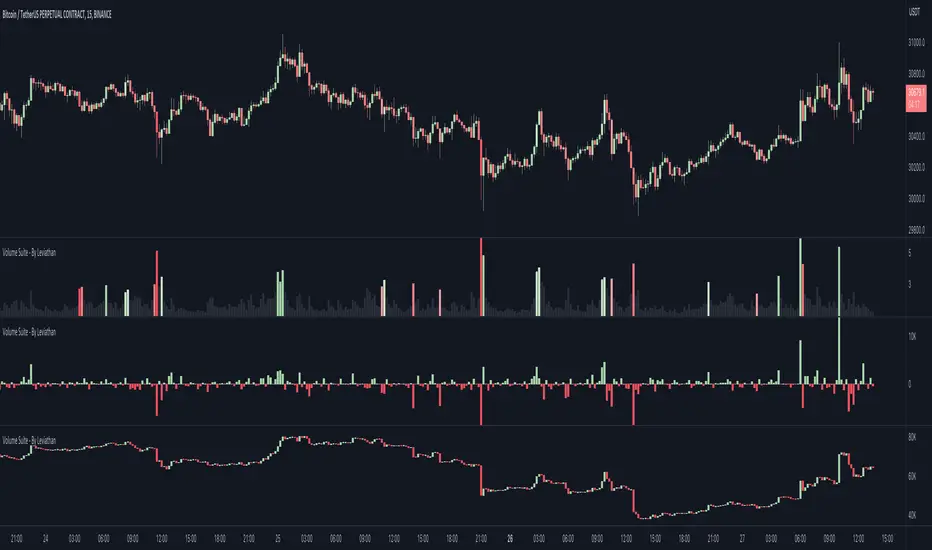
Volume Suite - By Leviathan (CVD, Volume Delta, Relative Volume)Volume Suite is an all-in-one script that includes several volume-based indicators such as CVD, Volume Delta, Relative Volume, Buy/Sell Volume, Cumulative Relative Volume and more. Additionally, it offers fully customisable appearance and features for improved data visualization, such as highlights for high volume activity, small price changes with high volume, or large price changes with low volume and more.
Data available in version 1:
- Volume Delta
Volume Delta is the net difference between Buy Volume and Sell Volume at a given bar. Positive Delta indicates that Buy Volume > Sell Volume, while Negative Delta means that Sell Volume > Buy Volume. As there is not way to get tick data on Tradingview, calculating Volume Delta is improvised by using the direction of lower timeframe candles and their volume.
- Cumulative Volume Delta (CVD)
CVD is a running total/cumulation of Volume Delta values, where positive VD gets added to the sum and negative VD gets subtracted from the sum. It can be used for trend strength analysis, divergence strategies, sentiment, etc.
- Buy/Sell Volume
Buy and Sell Volume provides an insight into volume activity in a given bar by estimating the buying/selling volume based on the direction of lower timeframe candles and their volume.
- Relative Volume
Relative Volume is used to compare current trading volume to past trading volume over a given period. For instance, a relative volume of 1.0 indicates that volume is at an average level, while a relative volume of 2.0 suggests that the volume is twice as high as the average.
- Cumulative Relative Volume (CRVOL)
CRVOL is a running total/cumulation of Relative Volume values, where RVOL at close>open gets added to the sum and RVOL at close