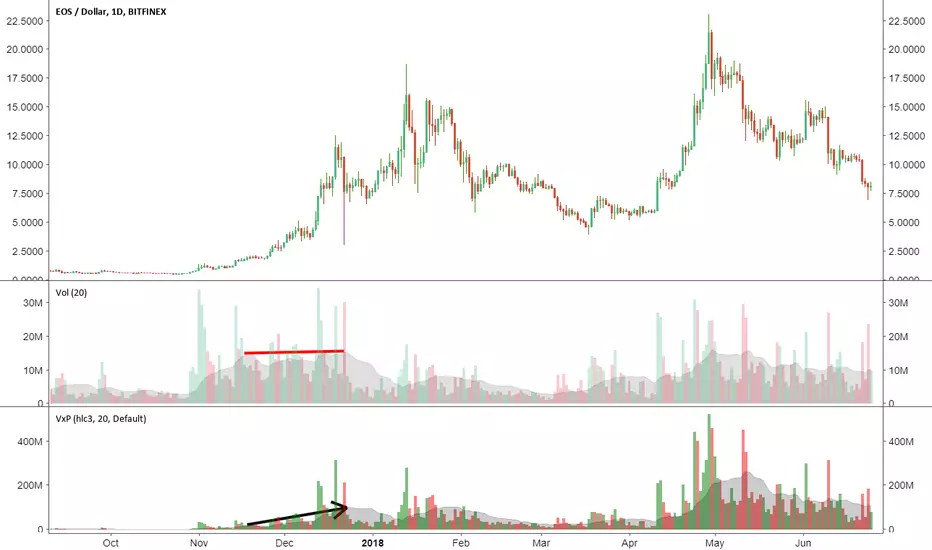
Volume x PriceThis is a simple indicator that calculates volume times price (money volume). Both asset volume and money volume are important indicators in TA. As you can see in the chart above, money volume (moving average) was increasing while the asset volume was not during late 2017. This could have led to wrong interpretations. Money volume becomes more important to consider when the difference in asset price is 'relatively' high.
Features:
- In addition to default options on volume indicator, it is possible to color volume bars based on "money flow multiplier" sign (close-(low+high)/2)
- Money factor can be disabled to show regular volume
Note: Most exchanges show asset volume but there are some like Bitmex that show money volume. Using this indicator on Bitmex type tickers should be avoided.
PS: I couldn't find any indicator for money volume so I had to develop this.
Your feedback is very welcome. If you know similar indicators, please let me know.
Cari dalam skrip untuk "volume"
Volumes on BarEste indicador colore as cores do candle de acordo com o volume.
Desabilitar a visibilidade do candle original.
Volume-Based Candle Shading Pro [LTS]Overview
Volume-Based Candle Shading Pro is a visual aid that highlights how “unusual” each bar’s volume is compared to recent activity. It adjusts candle colors based on whether volume is above, below, or near its average, helping you quickly spot high-activity pushes and quiet rotations on any symbol or timeframe.
How it works
For each bar, the script calculates a simple moving average of volume over a user-defined lookback. It then compares the current bar’s volume to that average.
Bullish candles start from a bullish base color, and bearish candles from a bearish base color. Depending on the volume ratio, that base color is blended toward a “high volume mix” color when volume is elevated, or toward a “low volume mix” color when volume is muted. The strength of the blend increases as the bar’s volume moves further away from the average, so extreme volume stands out visually while average bars remain close to the base colors.
Colors are applied with the built-in barcolor() function, so the indicator only affects candle appearance; it does not modify price, volume, or any other chart values.
Inputs
Bullish Base Color / Bearish Base Color
Primary colors used for up and down candles when volume is close to its average.
High Volume Mix Color
Color that is blended into the base color when volume is above its moving average. This is typically chosen as a darker or more intense shade to make heavy-volume bars stand out.
Low Volume Mix Color
Color that is blended into the base color when volume is below its moving average. Many users choose a lighter shade to visually de-emphasize low-participation bars.
Volume MA Length
Number of previous bars used to compute the average volume. Shorter lengths make the shading respond more quickly to recent changes in activity; longer lengths provide a smoother, more stable baseline.
Typical use cases
Highlighting high-volume breakouts, breakdowns, or rejection candles without adding extra panels or indicators.
Distinguishing between strong, well-participated moves and low-volume drifts that may be less significant.
Combining with your existing price-action tools to visually filter which candles deserve more attention based on relative volume.
All calculations are based on historical volume and the current bar only; the script does not use future data or repaint past candles. It is intended as a visual aid and should be combined with your own analysis and risk management.

Volume Weekdays/WeekendsShow weekend volumes in a difference colour and calculate two separate moving averages over the lookback period.

Volume Ratio(出来高比率)This bar chart shows the ratio of volume.
It is a ratio to the number of shares issued, and floating shares.
You will need to enter number of shares issued, and floating shares.
The value to be entered is in millions.
If the volume continues to exceed the float, there is a possibility that some kind of major movement will occur.
この棒グラフは発行済株式、浮動株に対する出来高の比率を示します。
利用には発行済株式数、浮動株数を入力する必要があります。
浮動株を上回るような出来高が続く場合、何かしらの大きな動きが起こる可能性があります。

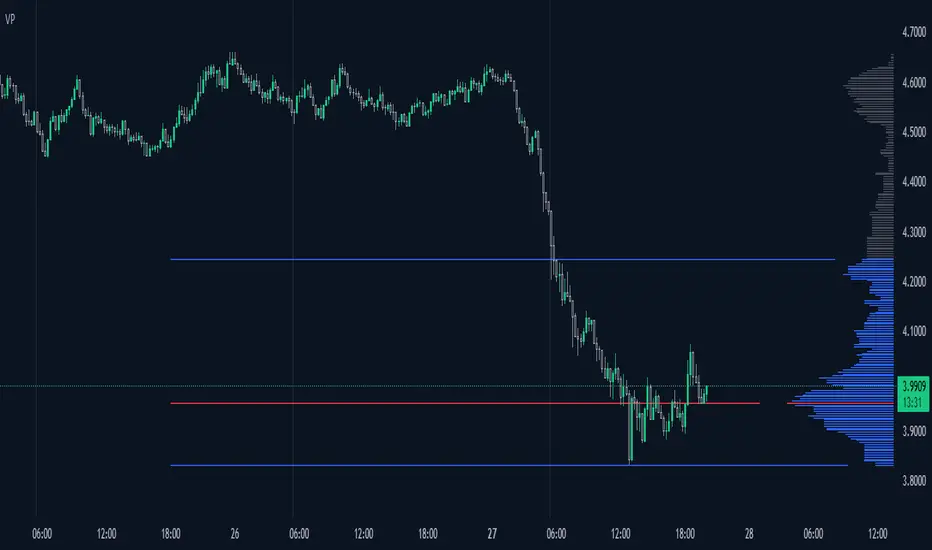
Volume ProfileThis is a Volume Profile based on pine script arrays.
The main idea behind this script is from the user @IldarAkhmetgaleev .
He created an awesome piece of code for free users on tradingview.
Here are some changes to the main script:
0. Used Pine Script Arrays for doing/storing calculations.
1. The bar labels are replaced with lines.
2. Added a POC line.
3. Bar growing directions changed from right to left.
4. Added an option to change bar width.
Inputs:
0. Volume Lookback Depth : Number of bars to look back for volume calculations.
1. Bar Length Multiplier : Bar length multiplier to make bar long or short.
2. Bar Horizontal Offset : Horizontal distance from the current bar in the right direction.
3. Bar Width : Width of the bars.
4. Show POC Line : Show or hide the POC line.
Happy trading.

Volume/Price Alert (idea from a dear TV trader)Simple code that finds a sell candle following a buy candle that has higher volume.

Montosca's Volume Delta Volume Delta Montosca - Indicator Summary
Volume Delta Montosca is a specialized Pine Script indicator for TradingView designed to analyze buying and selling pressure within each candle. It focuses on identifying high-impact volume events combined with strong directional dominance.
Key Features
1. Volume Delta Visualization
Displays volume bars split into Buy Volume (Blue) and Sell Volume (Red).
Includes centered text labels inside the bars showing the exact percentage of buy and sell volume for clear readability.
2. Signal Generation Logic (Triangles)
The indicator generates Buy (Blue Triangle) and Sell (Red Triangle) signals based on two strict criteria that must be met simultaneously:
Criterion A: Significant Volume (SMA Filter)
The current candle's volume must exceed a dynamic threshold.
This threshold is calculated using a Simple Moving Average (SMA) of the volume (e.g., 20 periods) multiplied by a user-defined Adjustment Factor (e.g., 150%).
Example: If the factor is 150%, the volume must be 1.5x higher than the average.
Criterion B: Directional Dominance
The candle must show strong internal conviction.
The Buy Percentage (for long signals) or Sell Percentage (for short signals) must exceed a specific Dominance Threshold (e.g., 70%).
3. Simplified Analysis
Alerts: Integrated alert conditions for both Buy and Sell signals for automated trading or notifications.
Volume breakdownThis indicator is not granted for buying and selling confirmation, it is only for analysis. Enter or exist buy or sell is your decision and under your responsibility.
explanation:
1- Blue color is the average buy volume in current used timeframe.
- When blue color start to appear, the cal volume is begin.
- As blue color rise, the buy volume is increasing.
- When blue color switched to light blue, cal volume will start to decrease.
- When blue color decline and disappear, cal considered to end.
2- Orange color is the average sell volume in current used timeframe.
- When orange color appears without blue color, put volume is begin.
- As orange color rise, the sell volume is increasing.
- When orange color start to decline, put volume will start to decrease.
- When blue color appears, put considered to end.
3- Green color is the actual buy volume in current used timeframe.
4- Red color is the actual sell volume in current used timeframe.
5- The volume numbers on the right is very important for accuracy.

Volume High Alert by ToledoCandelariaThis custom TradingView indicator visualizes volume activity by plotting colored boxes under each bar, highlighting different volume levels relative to a moving average. It helps traders identify significant volume spikes or drops, which can signal potential market moves or reversals.Key Features:Volume Analysis: The indicator compares the current bar's volume to a user-defined Simple Moving Average (SMA) of volume, calculated over a customizable period (default: 30 bars).
Color-Coded Boxes: Each bar is represented by a box with a color indicating its volume strength:Purple: Ultra-high volume (exceeds the SMA by a user-set multiplier, default: 2.0x).
Yellow: High volume (exceeds the SMA by a smaller multiplier, default: 1.5x, but below ultra-high).
Blue: Low volume (below the SMA by a user-set multiplier, default: 0.5x).
Green: Normal volume (falls within the defined thresholds).
Customizable Settings:Adjust the SMA length to fine-tune the volume baseline.
Modify the multipliers for ultra-high, high, and low volume thresholds.
Set the width of the boxes (in bars) for visual clarity.
Limit the number of displayed boxes (default: 500) to manage chart performance.
Alerts: The indicator includes an alert condition that triggers when a high-volume (yellow) bar is detected, allowing traders to stay informed of significant volume spikes in real-time.
How to Use:
Add the indicator to your TradingView chart (not as an overlay) and adjust the input settings to match your trading strategy. Watch for purple and yellow boxes to spot potential breakout or reversal signals, and use blue boxes to identify periods of low activity. Enable the alert to receive notifications for high-volume bars.This indicator is ideal for traders looking to monitor volume surges and lulls, providing a clear visual representation of market activity directly on the chart.
I hope that helps!
by Excalibur

Volume mura visionOverview
A simple, readable volume tool that highlights volume spikes relative to a moving-average baseline. Bars are color-coded:
Spike UP (price closed up)
Spike DOWN (price closed down)
Below-average volume
Near/above MA but not a spike (neutral)
Optional: plot the selected Volume MA as a line.
How it works
1. Compute a Volume MA (SMA/EMA/RMA/WMA) over Volume MA Length.
2. A spike occurs when Volume ≥ MA × (1 + Spike threshold%).
3. Bar color:
Spike + up candle → Spike UP color
Spike + down candle → Spike DOWN color
Volume < MA → Below-MA grey
Otherwise → Base grey
4. The MA line can be shown/hidden.
Inputs
Volume MA Length (len) — lookback for the volume moving average.
Spike threshold (%) over MA (thr_pct) — how far above the MA a bar must be to count as a spike.
MA Type (ma_type) — SMA / EMA / RMA / WMA for the volume baseline.
Show MA line (showMA) — toggle the MA overlay on the volume pane.
Colors
Base grey — volume near/above MA but below spike threshold.
Below-MA grey — volume below the MA.
Spike UP — spike on an up candle (close ≥ open).
Spike DOWN — spike on a down candle.
Alert
Volume spike — fires when Volume ≥ MA × (1 + threshold).
Usage tips
Lower the threshold to catch more activity; raise it to see only major bursts.
Shorter MA length reacts faster (more spikes); longer length smooths noise.
Combine with price action (breakouts, reversals) to confirm whether spikes signal participation or exhaustion.
Disclaimer
Educational tool, not financial advice. Trading involves risk.

Volume Stack with Dollar Volume ScoreThis script is designed to analyze candles for buy/sell pressure, volume flows, and generate intuitive emoji-based signals. Its core function is to help traders visually and quantitatively interpret price and volume behavior for potential bullish, bearish, or neutral market states.
Key Features and Logic
Price Range Analysis: Calculates the candle's price range and determines the proportion of volume attributed to buyers and sellers using buy_percent and sell_percent.
Market State Classification:
Bullish/Bearish/Neutral: Based on buy/sell percentage comparisons.
Strong Signals: Flags when buy/sell pressure exceeds defined thresholds (≥0.75).
Transitions: Detects when states shift sharply (e.g., from bull to strong bear).
Visual Cue System:
Uses different emojis (📈, 📉, 🚀, 🔥, 💎, 💀, ❌) to mark normal, strong, transition, and neutral signals for easy chart interpretation.
Dollar Volume Calculation: Multiplies close price by volume to derive "dollar volume" per bar. Normalizes this with a moving average for context-sensitive spike detection.
Scoring Mechanism:
Dollar Volume Score: Evaluates the normalized change in dollar volume, assigning scores for strong (±2), mild (±1), or neutral (0) changes.
Buy/Sell Pressure Score: Calculates a simple pressure score based on buy/sell proportions for each candle.
Composite Score: Combines both scores to define the overall bullish/bearish/neutral state.
State & Emoji Plotting:
Plots respective emojis at the chart bottom depending on composite score and state (bullish, bearish, strong moves, transitions, neutral).
Alerts:
Sends alerts for key transitions (like bull-to-strong-bear), strong moves, and neutral states, aiding automated signal handling and decision-making.
What This Script Helps You Achieve
Quick Visual Insights: Instantly see important market states and transitions with chart emojis.
Volume Context Awareness: Incorporates both price action and normalized volume changes for more reliable signals.
Automated Alerts: Supports smart trading decisions via pop-up notifications on major shifts or important conditions.
This script provides a layered analysis approach for volume and price action, blending quantifiable scores with intuitive chart markers and automated alerts, making it highly suited for traders who rely on both visual and quantitative cues in their strategy.
Volume Pulse Pro📊 Volume Pulse Pro – Advanced Volume Spike Detector
🔍 What is it?
Volume Pulse Pro is an advanced tool designed to detect and highlight significant volume spikes in real-time. This indicator helps traders:
✅ Identify strong market momentum shifts.
✅ Spot institutional activity and market maker moves.
✅ Avoid fake breakouts by filtering volume anomalies.
✅ Receive instant alerts for critical volume changes without staring at the chart.
⚙️ How does it work?
The indicator analyzes volume relative to a 50-period SMA and dynamically colors volume bars based on their significance:
🔵 Moderate Volume Spike (Lvl 1) → Volume exceeds 1.3x the average.
🟠 Strong Volume Spike (Lvl 2) → Volume exceeds 2.5x the average.
🔴 Extreme Volume Spike (Lvl 3) → Volume exceeds 3.5x the average.
Each threshold can be customized and enabled/disabled in the settings, allowing full control over alerts and visual display.
🚀 Why use Volume Pulse Pro?
✅ Flexible customization – choose which volume spikes to track.
✅ Real-time alerts – never miss a critical volume event.
✅ Clear visual representation – gradient-colored bars for easy interpretation.
✅ Perfect for scalpers & swing traders – filter out noise and focus on key moves.
🎯 How to Use It?
1️⃣ Add the indicator to your TradingView chart.
2️⃣ Adjust the volume thresholds and enable alerts for key levels.
3️⃣ Trade with confidence by spotting high-impact volume surges instantly.
🔥 Volume Pulse Pro gives traders a clear edge by revealing hidden volume signals that drive the market! 📈💰
📢 Get started now and take your trading to the next level! 🚀
Volume Spike IndicatorThe Volume Spike Indicator is designed to identify significant volume spikes in the market. This tool helps traders recognize unusual trading activity, which may indicate potential reversals, breakouts, or increased volatility. The indicator uses a simple moving average (SMA) of volume over a specified period and highlights bars where the current volume exceeds a multiple of this average.
Features:
Volume SMA Calculation:
The indicator calculates the SMA of volume over a customizable period (default: 20 bars).
Spike Multiplier:
A threshold multiplier (default: 4) determines what qualifies as a "spike."
Spikes occur when the current volume is greater than the SMA multiplied by this threshold.
Visual Alerts:
If a spike is detected, a red cross ( Cross ) and X-shape ( X-Cross ) are plotted above the corresponding bar for easy identification.
How to Use:
Spot High-Activity Areas:
Use this indicator to find points of unusually high trading activity, which can signify key levels or moments of interest in the market.
Adjust Settings for Sensitivity:
Length : Change the SMA period to match your trading timeframe.
Spike Multiplier : Lower values detect smaller spikes; higher values focus on extreme events.
Combine with Other Indicators:
This tool works best when combined with price action analysis, support/resistance levels, or trend indicators to confirm trading signals.
Customization Options:
Length: Number of bars for SMA calculation (default: 20).
Spike Multiplier: Threshold for defining volume spikes (default: 4).
This indicator is suitable for traders looking to enhance their analysis by identifying abnormal market activity.

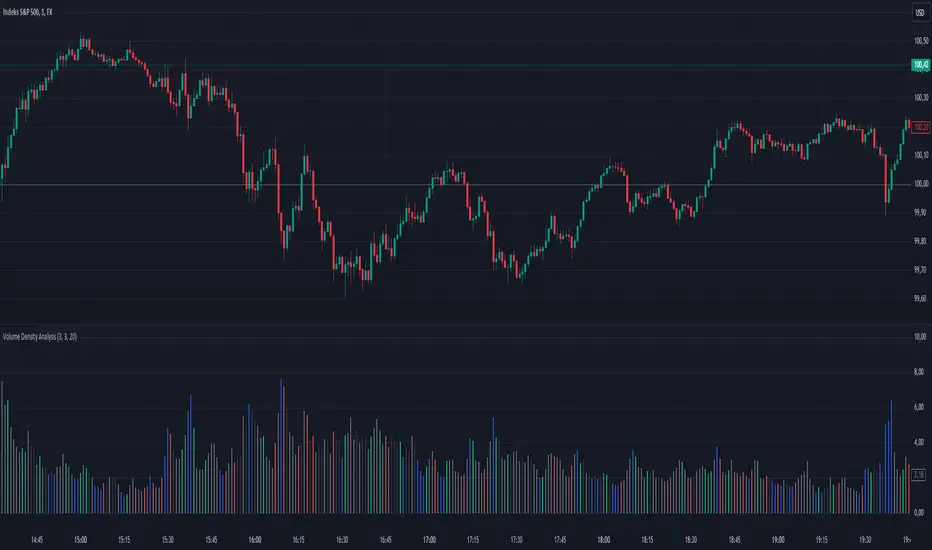
Volume Density AnalysisVolume Density Analysis
Overview
The "Volume Density Analysis" indicator is designed to provide traders with insights into volume dynamics relative to price movements. By analyzing the density of volume against price spread, this indicator helps identify potential reversal points and extreme volume conditions, enhancing decision-making in trading strategies.
Key Features
Volume Density Calculation: The indicator computes the density of volume by dividing the total volume by the price spread (high - low) for each bar. This allows for a more nuanced understanding of volume activity in relation to price movements.
Extremum Detection: Users can specify the number of bars to consider when identifying extreme volume conditions, allowing for tailored analysis based on market behavior.
Reversal Bar Conditions: The indicator includes options to determine if low or high volume bars must coincide with reversal patterns, providing additional context for potential trade signals.
Dynamic Coloring*: The histogram displays colored bars based on specific conditions:
Blue Bars: Indicate the lowest and highest volume density within a specified range, highlighting significant volume extremes.
Gray Bars: Represent lower or higher volume density that meets reversal criteria.
Green and Red Bars: Indicate bullish or bearish reversal signals based on historical density patterns.
User Inputs
nl: Number of previous lower bars to consider for comparison (default is 8).
nh: Number of previous higher bars to consider for comparison (default is 8).
ext: Number of bars for detecting extremum volume (default is 30).
LReversalBar: Boolean option to determine if low volume bar spread must indicate a reversal.
HReversalBar: Boolean option to determine if high volume bar spread must indicate a reversal.
Suggested Timeframes
M15: Without reversal considerations, use `nl=3`, `nh=3`, and `ext=20`.
M5: Without reversal considerations, use `nl=4`, `nh=4`, and `ext=35`.
M1: Use `nl=8`, `nh=8`, and `ext=58` for more detailed analysis.
Volume OscillatorThe Volume Oscillator is a powerful tool for analyzing volume dynamics and identifying potential divergences and trend confirmations. This indicator combines multiple volume analysis techniques to provide a comprehensive view of market participation and potential turning points.
At its core, the Volume Oscillator calculates a custom volume delta, taking into account the true range of each candle. The volume delta is adjusted based on the relationship between the open and close prices, assigning a higher weight to the candle body when the close is higher than the open. This approach captures the nuances of buying and selling pressure within each candle.
The cumulative volume delta is then calculated using one of three user-selectable methods: On-Balance Volume (OBV), Cumulative Volume Delta (CVD), or Price-Volume Trend (PVT). These options allow traders to choose the volume accumulation method that best suits their analysis style.
The Volume Oscillator plots the difference between two exponential moving averages (EMAs) of the selected cumulative volume. The short-term EMA length and long-term EMA length can be customized by the user, providing flexibility to adapt to different trading timeframes and market conditions.
A key feature of this indicator is the divergence detection. It identifies bullish and bearish divergences between the Volume Oscillator and price action. Bullish divergence occurs when the oscillator forms a higher low while the price forms a lower low, suggesting potential buying pressure. Conversely, bearish divergence occurs when the oscillator forms a lower high while the price forms a higher high, indicating potential selling pressure. The divergence detection algorithm uses a configurable lookback range and pivot point detection to improve the accuracy of divergence signals.
The indicator also incorporates a signal line, which is an EMA of the Volume Oscillator. Crossovers between the Volume Oscillator and the signal line provide additional confirmation of potential trend changes. Bullish crossovers occur when the oscillator crosses above the signal line, while bearish crossovers occur when the oscillator crosses below the signal line.
To enhance the reliability of crossover signals, the indicator utilizes deviation bands based on the average volume delta. Bullish crossovers are confirmed when the signal line is below the lower deviation band, and the Volume Oscillator is negative. Bearish crossovers are confirmed when the signal line is above the upper deviation band, and the Volume Oscillator is positive.
The Volume Oscillator employs a dynamic color scheme to visually represent the strength and direction of the oscillator. The color gradually changes based on the normalized gradient between two colors, providing an intuitive view of the oscillator's momentum.
Customization options include:
- Short and long EMA lengths for the Volume Oscillator calculation
- Cumulative volume type (OBV, CVD, or PVT)
- Signal line length
- Divergence detection parameters (lookback range and pivot point settings)
This indicator is designed to be used in conjunction with other technical analysis tools and should not be relied upon as a standalone trading system. It is intended to provide insights into volume dynamics and potential trend changes, aiding in the decision-making process for professional traders.
Please note that this indicator is a complex tool that requires a solid understanding of volume analysis and technical analysis concepts. It is recommended to thoroughly test and validate the indicator's performance in different market conditions and timeframes before incorporating it into a live trading strategy.

Volume Grid [SS Premium]Hey everyone!
This is the Volume Grid indicator. It is essentially very similar to the Volume Profile Histogram indicator I released, but this premium version overlays on the chart and provides you with the tradeable ranges and the volume composition in each range. So let's get into it!
What it does:
This indicator cumulates buy and sell volume over a user defined lookback period in addition to calculating the average ranges that the stock trades in and the volume composition in each respective range.
It then paints these ranges based on the volume composition. Red means selling and green means buying. However, the brighter the red or green, the higher the buying or selling (essentially a heatmap).
The indicator will also provide you alerts when there are buying or selling volume spikes and circle the candle in which that has happened on (see example in main chart).
These alerts can of course be toggled on or off.
Trading with it:
This indicator can be used as a stand alone trading indicator, and here is how:
The ranges act as support and resistance. Within each range you can see whether the composition is buying or selling.
If we are in a green zone, it means there is buying and it is essentially a buy the dip situation (see below example):
When we are in a heavy selling zone, its essentially a short the rip situation:
You can also see when a zone transfers from a bearish or bullish zone, to the inverse:
The indicator also will plot a POC (point of control). Because we are not only pulling from daily volume data, we will already have a well established POC going into open:
This was SPY on Friday. The POC marked the current point of control from a volume perspective, which was at 482.
And here is what happened:
The POC will change colours between Red and Green, if its a bearish POC it will turn Red, bullish green. For the most part, both the bearish and bullish POCs remain within the same range but sometimes they will diverge and the indicator will alert you when this happens.
Additional options:
In addition to toggling off and on the alerts, you can also change the text colour and size.
As well, there is an option to "Condense Range". What that will do is reduce the range by a factor of 2 (in half). This will give you more aggressive support and resistance levels that you can play.
Condensed Range:
Uncondensed Range:
Personally, I prefer the condensed range, especially when trading leveraged shares, because I treat them as support and resistance levels and play breaks of them in either direction.
And last but not least, you can adjust the ranges to the daily, hourly, monthly or any timeframe you want, you simply select your desired timeframe and it will plot the ranges for that specific period:
SOXL on the week:
The yellow line represents the current period open. It is your reference line and frequently will act as support and resistance, depending on the market sentiment at the time.
That is the indicator in a nut shell, as always, please let me know your questions and suggestions below!
Safe trades and enjoy!
For access, please review the instructions below.

Volume Pressure Based Buy and Sell SignalsThis script uses a volume pressure indicator to generate buy and sell signals. The volume pressure indicator is calculated by taking the sum of the product of volume and price change over a specified period of time, and then dividing that sum by the total volume over the same period. This gives a measure of the amount of buying pressure or selling pressure in the market.
The script then compares the volume pressure indicator to a moving average of the volume pressure indicator. When the volume pressure indicator crosses above the moving average, a buy signal is generated. When the volume pressure indicator crosses below the moving average, a sell signal is generated.
This script is beneficial to traders because it can help them to identify potential trend reversals. When the volume pressure indicator crosses above the moving average, it indicates that there is a growing amount of buying pressure in the market. This could be a sign that the trend is about to reverse from a downtrend to an uptrend. Conversely, when the volume pressure indicator crosses below the moving average, it indicates that there is a growing amount of selling pressure in the market. This could be a sign that the trend is about to reverse from an uptrend to a downtrend.

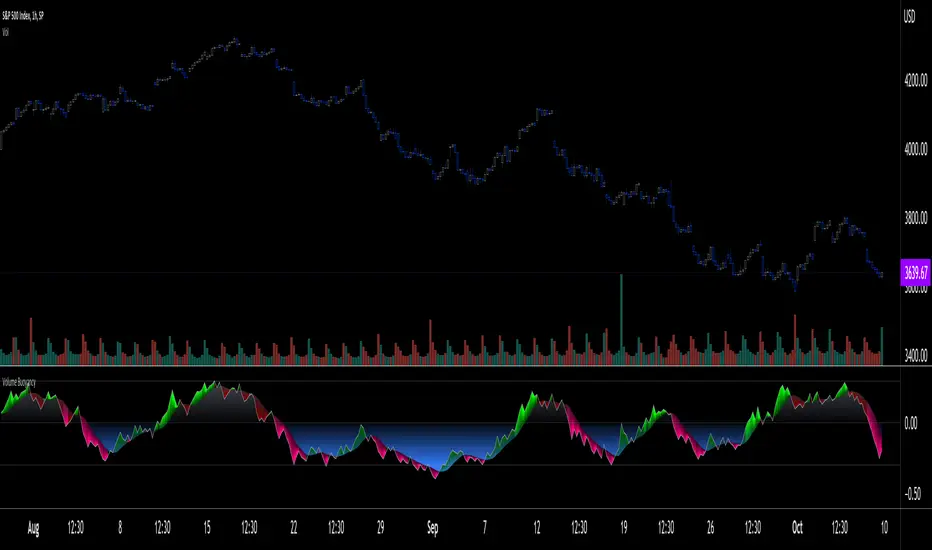
Volume Buoyancy [LucF]█ OVERVIEW
This indicator uses simple analysis of past volume to determine how well it supports recent market activity. What I call Volume buoyancy measures the strength and direction of that support.
█ CONCEPTS
Buoyancy
In physics, buoyancy is the force described in Archemedes' principle :
Any object, wholly or partially immersed in a fluid, is buoyed up by a force equal to the weight of the fluid displaced by the object.
I use the term loosely in this indicator's context, as "Volume buoyancy" here can be directed either up or down, indicating that past volume displays a bullish or bearish bias.
The calculation of buoyancy begins from a target quantity of volume summed over n bars. We then search chart bars backward, adding the volume of up and down bars in two different slots until each slot reaches the target. We then calculate two average distances: one each for the up and down bars whose volume was summed to reach the target. These average distances are then subtracted and the difference is divided by the farthest distance we had to go to find the target in either up or down bars. The last part of the calculations looks like this:
(avgDistanceDn - avgDistanceUp) / barsAnalyzed
When the average distance of down bars is greater than that of up bars, buoyancy will be positive, indicating that past activity favors the upside and vice versa. The force's strength, which in the case of actual buoyancy is the weight of the displaced fluid, in our case is measured by the size of the gap between the average distance of up vs down bars in relation to the farthest distance we had to go in the past. Buoyancy is always between +1 and -1, with values higher/lower than 0.3/-0.3 typically being unsustainable.
█ HOW TO USE THE INDICATOR
Load the indicator on an active chart (see here if you don't know how).
The default configuration displays:
• Buoyancy as a monochrome gray line.
• A channel between buoyancy and its MA, colored in one of four colors. The MA is not plotted by default, but you can see where it is with the channel.
The default settings use an Arnaud Legoux moving average over 20 bars.
• A fill between the MA and the centerline, which can be one of two colors.
• A high level at 0.30, a low level at -0.30 and the centerline at zero.
The default target is the sum of volume in the last 20 bars.
█ FEATURES
The indicator's settings allow you to define:
• A higher timeframe you want the calculations to be made on. Note that you should then ensure your chart's timeframe is always lower than the higher timeframe you specified,
as calculating on a timeframe lower than the chart's does not make much sense because the indicator is then displaying only the value of the last intrabar in the chart bar.
• The number of bars for which to add volume to obtain the target value that will be searched for in past up and down bars.
• The display of the buoyancy and MA lines, the channel between them and the fill between the MA line and the centerline.
• The type and length of the MA.
Using the "Style" tab of the indicator's settings, you can change the type and width of the lines, and the level values.
█ INTERPRETATION
Buoyancy shares the properties and shortcomings of many oscillators:
• It tends to be noisy, which is why the MA line can be helpful.
• The safest way to use it may be as a rough sentiment indicator, i.e., by paying more attention to its bull/bear state above/below the centerline.
• The more intrepid traders will want to use the channel between the main line and the MA, as it will provide earlier information than main line crosses of the centerline.
Decreasing the number of bars for which the source is added to calculate the target value will increase the noise level, somewhat like decreasing an MA's length would, but keep in mind that the number of bars is not the length of an MA.
█ LIMITATIONS
Under some circumstances, the indicator will display zero values because it cannot find the target in past bars. This will happen at the beginning of the dataset when not enough past bars have elapsed, or in the rarer cases anywhere in the dataset, when the target cannot be found in the `MAX_BARS_BACK` number of bars defined in the first line of the indicator's code (the default is 1000).
The calculations use a very primitive interpretation of volume similar to that of OBV , where all the volume of a bar is attributed to either the up or down slot. The indicator nonetheless produces results I think can be useful because we are not so much calculating precise buying/selling pressure as trying to build a big picture of where past activity over many bars appears to be taking price.
Volume data is notoriously high-variance; large values that come into or exit the calculations' scope can produce sudden variations in results, somewhat like the drop-off effect in moving averages.
█ NOTES
• The script can be used with any chart timeframe, including seconds.
• Historical values will always produce the same results. In real time, values will change until the bar closes.
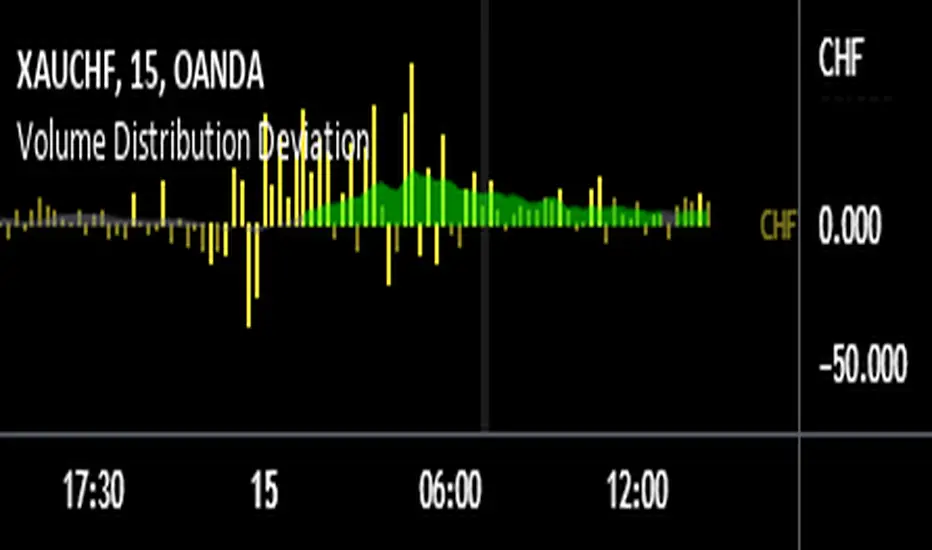
Volume Distribution DeviationThis indicator explores the question - "Does a currency's PERCENTAGE of trading volume verses other currencies show an insight into market sentiment?"
Specifically, it calculates the average market share based on the same time of day for a given number of days back (10 days by default) for trades involving the selected currency then presents fluctuations from that average as a percentage.
For example, assume that currencies involving EUR (EURUSD, EURAUD, EURCAD etc…) on average account for 20% of trading volume at 8am GMT (London open) however today at London open EUR crosses account for 30% at London open – 50% higher than usual. Does this information give us a heads up for market sentiment for the next few hours? And what if EUR volume was 50% higher than average and USD was 30% lower than average – should we focus on EUR and pass on USD that session?
Note that the indicator is not presenting information regarding volume quantity – it is showing you interest in that currency within the volume occurring that day. I already have an indicator that compares volume quantity to average volume quantity for that time of day, this takes the concept a little further and shows the normalised deviations from that average. So if USD volume was up 50% and NZD was up 50% they will show as equal on the indicator even though the actual traded volume of USD is probably x10 higher.
I find the 15 minute timeframe gives the most meaningful data. I use an 8 window chart and display the deviations for each currency (NZD, AUD, JPY, CHF, EUR, GBP, CAD, USD). If you set to 'Automatic' the indicator will automatically chose the currency based on the currency you crossed with gold (OANDA:XAUNZD, OANDA:XAUAUD, OANDA:XAUJPY, OANDA:XAUCHF, OANDA:XAUEUR, OANDA:XAUGBP, OANDA:XAUCAD, OANDA:XAUUSD). I tend to look at the average deviation rather than an isolated spike.
There are features in the indicator to try to summarise and highlight impactful data - highlighted deviations over a set tolerance (10% by default) and the SMA of the deviations.
Good luck
GTS Volume Behavior IndicatorVolume is an important part of understanding the behavior of instruments. This Indicators colours the candles/bars according to whether the volume for that time period of the candle is an Accumulation or Distribution candle or in fact if it has less volume that the previous candle. This simple tool can help traders of any instrument that involves volume to instantly visualise this volume behavior to help confirm trade directions and more importantly to identify when a move is running out of juice and will aid in making trade management decisions.
Colour coding for the candles are as follows:
Green Candle - UP candle with increased volume compared to previous candle. A grey candle - UP candle but has less volume than the candle before. A Red candle is a DOWN candle that has increased volume compared to previous candle. A Cyan Candle is a DOWN candle but has less volume than the candle before.
Buying - So a green candle is an accumulation candle where more shares/contracts/coins are being bought than in the same candle (time period) previously. When you see this after low volume candles it can be said that the momentum (Juice) is increasing to the upside. And then when you get another green candle after the first, even more volume and even more juice to the upside. When the up candles turn grey then the juice is starting to run out to the upside and this is a great indication to tighten stops if you are long.
Selling - So a Red Candle is an distribution candle where more shares/contracts/coins are being sold than in the same candle (time period) previously. When you see this after low volume candles it can be said that the momentum (Juice) is increasing to the downside. And then when you get another red candle after the first, even more volume and even more juice to the downside. When the down candles turn cyan then the juice is starting to run out to the downside and this is a great indication to tighten stops if you are short.

Volume by MetalBeeThis is a modified volume indicator modeled on the standard indicator with some conditional formats applied:
* "Volume High" input allows the user to designate the number of periods to look backwards to find a value for the highest volume day
* Where the bar volume is greater than the value returned for the "volume high", the volume bar will be colored purple
* Where the bar volume is greater than the value returned for the "simple moving average", the volume bar will be colored blue
