Volume Profile With Buy & Sell Pressure LabelVOLUME PROFILE WITH BUY AND SELL PRESSURE LABEL
This volume profile indicator shows volume traded for each bar and is colored according to the difference in buy and sell pressure(DMI).
***HOW TO USE***
If the bar and background is colored green, there is more market buying than selling on that bar.
If the bar and background is colored red, there is more market selling than buying on that bar.
If the bar and background is colored blue, there is an equal amount of market buying and selling on that bar.
***BUY/SELL LABEL***
There is also a label on the right side that tells you whether there is more buying or selling on the current bar. This table updates in real time and changes colors so you can get an easy, quick interpretation of the current buy/sell pressure without having to look at the volume bars so you can make faster decisions on whether to enter or exit a trade. The table changes colors in sync with the volume bars and background. Green means more market buying than selling. Red means more market selling than buying. Blue means an equal amount of market buying and selling.
***MARKETS***
This indicator can be used as a signal on all markets, including stocks, crypto, futures and forex.
***TIMEFRAMES***
This volume profile indicator can be used on all timeframes.
***TIPS***
Try using numerous indicators of ours on your chart so you can instantly see the bullish or bearish trend of multiple indicators in real time without having to analyze the data. Some of our favorites are our Auto Fibonacci, DMI, Momentum, Auto Support And Resistance and Money Flow Index in combination with this Volume Profile. They all have real time Bullish and Bearish labels as well so you can immediately understand each indicator's trend.
Cari dalam skrip untuk "volume"

Volume PlusVolume plus provides volume insights to identify increase or decrease in relative volume or sudden volume expansion that exceeds the average. Based on the period selected the script displays the color code.
Features
1. Two different sensitivity levels can be selected for volumes and coloring.
2. Whenever the volume is higher than the selected SMA, volume bars will change color.
3. Can Plot 20 SMA (can be changed)

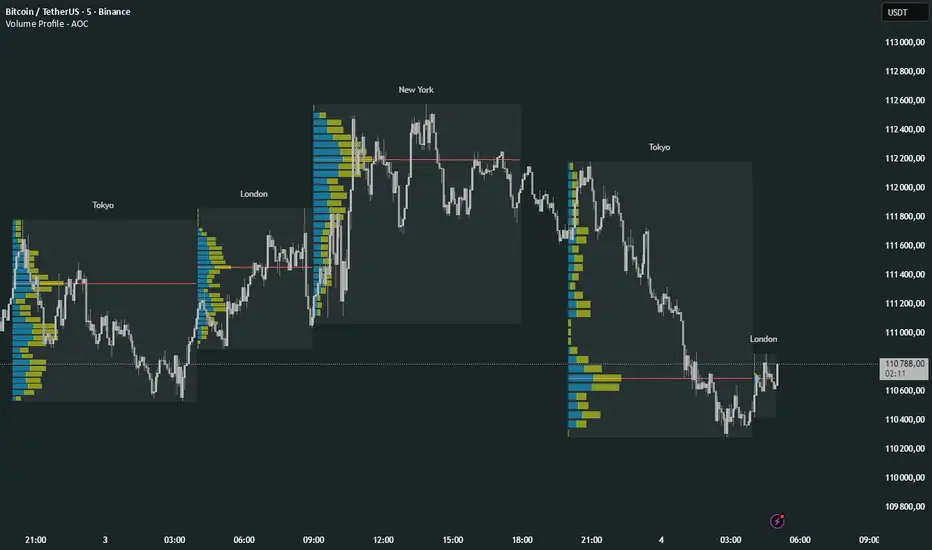
Volume Profile Multi periodVolume Profile - AOC 📈
Unlock market insights with this powerful volume profile indicator! Analyze trading activity across multiple sessions with customizable settings and clear visuals. Perfect for traders aiming to identify key price levels and market trends with precision. 🚀
Key Features:
Multi-Session Support: Visualize volume profiles for Tokyo, London, New York, Daily, Weekly, Monthly, Quarterly, and Semiannual sessions. 🌍
Customizable Display: Choose session types, resolution, and bar modes (Mode 1 or Mode 2) to match your strategy. 🎛️
Point of Control (POC): Highlights the most traded price levels for each session. 🎯
Color-Coded Profiles: Distinct up/down volume visualization for quick analysis. 📊
Session Labels: Optional labels for easy identification of session periods. 🏷️
High/Low Tracking: Tracks session-specific highs and lows for accurate profiling. 📏
Empower your trading decisions with clear, actionable volume data! 💡
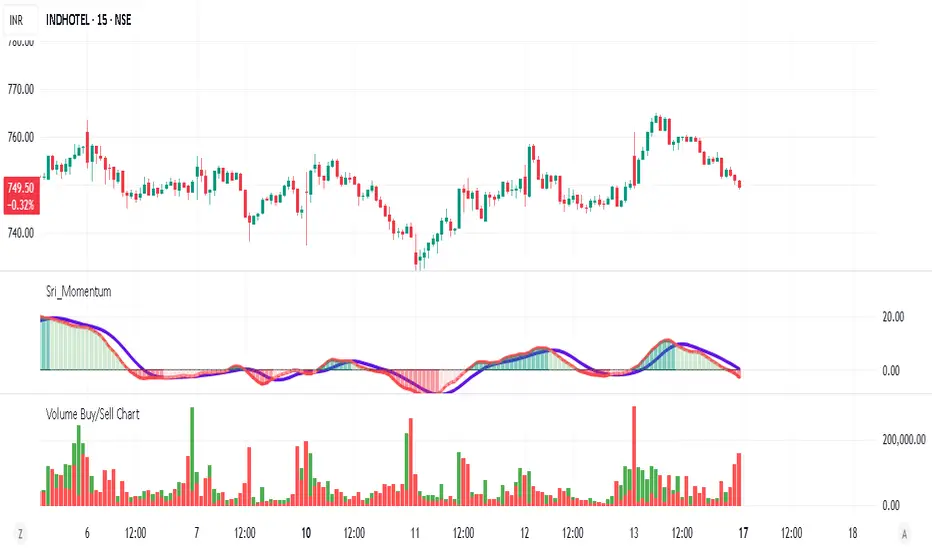
Volume Buy/Sell ChartVolume Buy/Sell Chart
This script visualizes the distribution of buying and selling volume within each candlestick, helping traders identify dominant market pressure at a glance. It separates volume into Buy Volume (Green) and Sell Volume (Red) using a unique calculation based on price movement within a candle.
Features:
✅ Customizable Bar Display: Choose to display 5, 10, or 100 bars using a simple dropdown selection.
✅ Buy & Sell Volume Calculation: The script determines buying and selling volume dynamically based on price action within the candle.
✅ Custom Volume Threshold for Alerts: Set a percentage threshold (0–100) to trigger alerts when buy or sell volume exceeds a predefined level.
✅ Color-Coded Histogram:
Green Bars: Represent the estimated buy volume.
Red Bars: Represent the estimated sell volume.
✅ Alerts Integration: Automatically detect strong buy or sell signals when the respective volume percentage exceeds your set threshold.
How It Works:
The script calculates total price movement within a candle.
It then estimates buying and selling volume ratios based on whether the price closes higher or lower than it opened.
Finally, it normalizes the buy/sell volume against the total volume and plots it as a column chart.
Usage Guide:
Add the script to your chart.
Select how many bars to display (5, 10, or 100).
Adjust the Custom Volume Percentage Threshold (default: 75%).
Watch for significant buy/sell volume imbalances that might indicate market turning points!
This tool is great for traders looking to analyze volume flow and market sentiment with a simple yet effective visualization. 🚀
Volume Color Bars with SMA MACD & Linear RegressionVolume Bars colored to make it easy to read with Volume Spread Analysis Indicator.
1. Red - Volume less than Simple Moving Average
2. Blue - Volume higher than Simple Moving Average
3. Black - Maximum volume of last Max_Count bar (default = 40 bars)
Additionally, you can plot Moving Average, Linear Regression and MACD of volume.

PROFESSIONAL LONG & SHORT VOLUMESThis script plots most important long/short volumes that identifies supports and resistances levels.
These levels are often turning points or at least they identifies BUY/SELL area and TAKE PROFIT zones, offering an advantage to setup initial small stop loss (to move into BREAK-EVEN LEVEL after the right direction is confirmed).
If these levels are broken they often evolve into long/short squeeze.
It works with stocks/etf, futures, FX and spreads too.
My advice is to apply it on 2-4 contemporary time frames and to trade observing/following volumes on different frames with a sequential ZOOM IN approach (with FX and 24h futures: weekly, daily, 8 hours, 4 hours).

Volumen Consolidado por DIVISAS contra BITCOIN #09/2019Volumen Consolidado de Bitcoin clasificado por divisas. Gracias a este indicador se podrá obtener la dominancia y participación en el mercado de las diferentes divisas o contratos. Actualmente el indicador incluye un aproximado de 40 pares de BTC contra diferentes divisas, en las cuales resaltan:
*USD
*USDT
*USDC
*XBT
*CNY
*KRW
*GBP
*EUR
Este indicador es un criterio utilizado para un indicador que estaré subiendo en proximamente, el cuál sí contará con el volumen total expresado en un solo panel. Es decir, este indicador, solo especifica una parte del indicador general, que será el volumen consolidado total, que este expresará la cantidad total de bitcoins negociados a nivel mundial. El USD es la moneda con la que el "Market Maker", respalda sus fondos para operar el mercado, cosa que sabemos, por lo tanto otras divisas serían solo un metodo de compra para el retailer(cosa que me motivó a la creación del indicador ya que se podría conocer el sentimiento y reacción de los mismos en lo que ocurre en el mercado).
Recordemos que el principal problema de los análisis que toman en cuenta el precio y volumen en bitcoin es que tradingview te da a conocer solo el "volumen del exchange", por lo tanto no obtienes una cifra exacta de los bitcoins comprados y/o vendidos en todos los sitios en los que se negocia, lo que dificulta tener una percepción objetiva de lo que sucede en el mercado, ya que te guiarías por el volumen que te da el exchange dónde operas y no el que es real.
Sin nada más que decir, espero que tome en cuenta este recurso para sus análisis, que será esencial para aquellos que operan con precio y volumen.
Si quiere realizar alguna colaboración y/o donación por mí obra, será muy bien bienvenida y agradecida:
BTC: 1TqvNSQs39pr2mLeDo3swcrkYvkK1YQAN
LTC: LKYYkJQHBvnEaJSatp53pg8C7iKp9Jp45B
ETH: 0x6e0902a16a0a0d6379cd8600c455a7ab335278cc

Volume/Price Movement Indicator## Volume/Price Movement Indicator (VPM)
The **Volume/Price Movement Indicator (VPM)** is a technical analysis tool designed to identify the strength and potential direction of a trend by combining price momentum with volume analysis. Unlike indicators that only look at price, VPM uses volume as a confirming factor to gauge the conviction behind a price move. This helps traders distinguish between strong, high-conviction trends and weak, low-conviction movements that may be prone to reversal.
***
### Key Concepts
* **Price Trend**: The indicator smooths out daily price changes to determine the underlying trend direction. A positive price trend suggests upward momentum, while a negative trend suggests downward momentum.
* **Volume Analysis**: The VPM calculates a **Volume Ratio**, which compares the current bar's volume to its moving average. A high volume ratio indicates that the current volume is significantly higher than recent average volume, suggesting strong market participation. The **Volume Threshold Multiplier** is used to define what constitutes "high volume."
* **Net Pressure**: This component measures the difference between buying pressure and selling pressure, providing an additional layer of confirmation. Positive net pressure indicates that buying activity is outpacing selling, and vice versa.
***
### How to Use the Indicator
The VPM plots its findings on a histogram below the main chart, using colors to clearly signal the market's state.
* **🟢 Strong Bull (Green)**: This is the most powerful bullish signal. It indicates a clear upward price trend that is confirmed by both high volume and positive net pressure. This is a strong signal of conviction and potential continuation of the uptrend.
* **🔵 Weak Bull (Lime)**: This signal indicates a clear upward price trend, but with low volume. The positive net pressure suggests buying is still dominant, but the lack of high volume means there may not be strong market conviction. This signal suggests caution and may precede a consolidation or reversal.
* **🔴 Strong Bear (Red)**: The strongest bearish signal. It indicates a clear downward price trend confirmed by high volume and negative net pressure. This suggests strong selling conviction and a high probability of the downtrend continuing.
* **🟠 Weak Bear (Orange)**: This indicates a clear downward price trend but with low volume. Negative net pressure confirms selling dominance, but the low volume suggests a lack of strong conviction. Like the "Weak Bull" signal, this suggests caution.
* **⚫ Neutral (Gray)**: This signal is displayed when there is no clear trend or when price and volume are diverging. It's a signal of market indecision and suggests waiting for a clearer signal.
***
### Indicator Settings
* **Trend Length**: This input controls the sensitivity of the price trend calculation. A smaller value will make the indicator more responsive to short-term price changes, while a larger value will filter out noise and focus on longer-term trends.
* **Volume MA Length**: This determines the length of the moving average used as a baseline for volume. A longer length will make the "high volume" condition harder to meet.
* **Volume Threshold Multiplier**: This is a key setting for tuning the indicator. It determines how much higher the current volume must be than its moving average to be considered "high volume." For example, a value of `1.2` means volume must be at least 20% higher than the moving average to trigger a high-volume signal.

Volume Surge AlertVolume is often the fuel behind meaningful price moves. The Volume Surge Alert indicator highlights bars where volume explodes above its recent average, helping you spot accumulation, distribution, and breakout attempts before the price fully reacts.
Calculates a configurable simple moving average of volume to establish “normal” activity.
Flags bars where the current volume exceeds the SMA by a user-defined multiple (default 2×).
Colors the column and background on surge bars for quick visual confirmation.
Provides an alert condition so you can receive notifications the moment activity spikes.
Use it on any timeframe or market to monitor for unusual participation, confirm breakouts, or filter entries. Adjust the SMA length and surge multiple to match your market’s typical liquidity profile.

Volume (standard) + Brightness by Intensity (Min–Max / MA)Volume Brightness Indicator
Quick Description
This indicator is an enhanced version of TradingView’s standard volume. The volume bars are colored just like the original (green/red or a single custom color), but with one key upgrade: brightness and transparency adjust automatically based on volume intensity.
High volume → bars appear more opaque and bright.
Low volume → bars appear more transparent and faded.
This makes it easier to spot which candles actually carry meaningful volume at a glance.
Features
Bar colors: by candle direction (green/red) or a single chosen color.
Volume moving average: optional, customizable (SMA or EMA).
Brightness methods:
Min–Max: compares volume against a historical window (with optional log scale).
MA-based: compares volume against its moving average, with an adjustable cap.
Custom transparency: define how opaque high-volume and low-volume bars appear.
How to Use
Copy the script into Pine Editor and save it.
Add it to your chart; it will display in its own panel, like the standard volume.
In Settings, choose your preferred brightness method and adjust transparency ranges.
Toggle the volume MA if you want a clear reference line.
Key Idea
The indicator does not add new data. It highlights volume intensity visually, making it easier to identify accumulation or spikes without losing the simplicity of the classic volume.

Volume Trend Swing Points | viResearchVolume Trend Swing Points | viResearch
Conceptual Foundation and Innovation
The "Volume Trend Swing Points" script is designed to identify pivotal swing points in market trends by leveraging the Price Volume Trend (PVT) indicator. This unique approach combines price and volume movements to highlight moments when a market may experience a significant trend reversal. By detecting the highest and lowest points of the PVT over customizable periods, this script aims to provide traders with valuable insights into potential bullish or bearish market behavior.
The simplicity of the script, combined with its use of the PVT, offers an effective way for traders to anticipate key market swings based on both price and volume momentum.
Technical Composition and Calculation
The core of the "Volume Trend Swing Points" script is built around the Price Volume Trend (PVT) indicator, which adjusts price changes according to trading volume. The script focuses on identifying the highest and lowest values of the PVT over user-defined lookback periods:
Price Volume Trend (PVT): The PVT is used to calculate the momentum of price movements, taking volume into account. By incorporating both price and volume, the PVT offers a more dynamic and responsive indicator of trend direction compared to price alone.
Swing Point Detection: The script identifies the highest and lowest PVT values over user-defined lookback periods (x for highs and y for lows). When the current PVT matches either the highest or lowest value, it signals a potential trend reversal or continuation, depending on whether the high or low is detected.
Entry and Exit Signals: A long signal (bullish) is generated when the current PVT matches the highest value over the lookback period, while a short signal (bearish) is generated when the current PVT matches the lowest value. These signals can be visualized with alerts and background colors.
Features and User Inputs
The "Volume Trend Swing Points" script allows traders to customize several parameters to better suit their trading strategies and market conditions:
Lookback Periods (x and y): The script allows for two customizable lookback periods—one for detecting the highest PVT and another for the lowest. Adjusting these values can help refine the sensitivity of the swing points.
Bar Coloring: The script includes an optional setting to color the bars based on detected bullish or bearish trends, making it easier to visualize potential market shifts.
Background Colors: The background color changes dynamically based on whether a high or low swing point is detected, providing traders with a clear visual indication of potential trend reversals.
Alerts: The script includes alert conditions for both long and short signals, enabling traders to set notifications for when potential swing points are detected.
Practical Applications
The "Volume Trend Swing Points" script is ideal for traders who focus on price and volume dynamics when making trading decisions. Its application is particularly useful in the following scenarios:
Detecting Trend Reversals: By identifying the highest and lowest PVT values over a given period, the script can help traders spot potential reversal points, allowing for more timely entries or exits.
Confirming Trend Continuations: When the PVT continues to match the highest or lowest values, it may indicate that the trend is likely to continue, helping traders maintain their positions with greater confidence.
Volume-Based Trend Analysis: Since the script uses the PVT, it is particularly effective in markets where volume plays a significant role in driving price movements, offering insights that go beyond simple price-based indicators.
Advantages and Strategic Value
This script enhances traditional trend analysis by incorporating both price and volume through the PVT, providing a more comprehensive view of market momentum. The customizable lookback periods allow traders to adapt the script to different assets and timeframes, making it a versatile tool for swing trading and trend-following strategies.
The visual cues provided by bar coloring and background shading help traders quickly identify potential market shifts, improving decision-making speed and accuracy.
Summary and Usage Tips
The "Volume Trend Swing Points" script is a straightforward yet powerful tool for identifying market reversals and trend continuations based on both price and volume. By adjusting the lookback periods, traders can fine-tune the script to better suit their trading style and the assets they are monitoring. The visual and alert features further enhance the script's usability, making it easy to incorporate into a trading strategy.
Remember to backtest the script across various market conditions to better understand its performance. Past performance is not necessarily indicative of future results, so using this script in conjunction with other technical tools is recommended for optimal decision-making.

Volume RatioVolume Ratio is to compare current Volume with previous volume
If Bullish candle with VR is > 1, it is indicating that Buying interest has increased.
If Bullish candle with VR is < 1, it is indicating that Buying momentum is weak.
If Bearish candle with VR is > 1, it is indicating that Selling Pressure has increased.
If Bearish candle with VR is < 1, it is indicating that Selling momentum is weak.
However, if VR is too big e.g above 4, it may indicated that Buying/Selling will climax soon
Volume Profile [Makit0]VOLUME PROFILE INDICATOR v0.5 beta
Volume Profile is suitable for day and swing trading on stock and futures markets, is a volume based indicator that gives you 6 key values for each session: POC, VAH, VAL, profile HIGH, LOW and MID levels. This project was born on the idea of plotting the RTH sessions Value Areas for /ES in an automated way, but you can select between 3 different sessions: RTH, GLOBEX and FULL sessions.
Some basic concepts:
- Volume Profile calculates the total volume for the session at each price level and give us market generated information about what price and range of prices are the most traded (where the value is)
- Value Area (VA): range of prices where 70% of the session volume is traded
- Value Area High (VAH): highest price within VA
- Value Area Low (VAL): lowest price within VA
- Point of Control (POC): the most traded price of the session (with the most volume)
- Session HIGH, LOW and MID levels are also important
There are a huge amount of things to know of Market Profile and Auction Theory like types of days, types of openings, relationships between value areas and openings... for those interested Jim Dalton's work is the way to come
I'm in my 2nd trading year and my goal for this year is learning to daytrade the futures markets thru the lens of Market Profile
For info on Volume Profile: TV Volume Profile wiki page at www.tradingview.com
For info on Market Profile and Market Auction Theory: Jim Dalton's book Mind over markets (this is a MUST)
BE AWARE: this indicator is based on the current chart's time interval and it only plots on 1, 2, 3, 5, 10, 15 and 30 minutes charts.
This is the correlation table TV uses in the Volume Profile Session Volume indicator (from the wiki above)
Chart Indicator
1 - 5 1
6 - 15 5
16 - 30 10
31 - 60 15
61 - 120 30
121 - 1D 60
This indicator doesn't follow that correlation, it doesn't get the volume data from a lower timeframe, it gets the data from the current chart resolution.
FEATURES
- 6 key values for each session: POC (solid yellow), VAH (solid red), VAL (solid green), profile HIGH (dashed silver), LOW (dashed silver) and MID (dotted silver) levels
- 3 sessions to choose for: RTH, GLOBEX and FULL
- select the numbers of sessions to plot by adding 12 hours periods back in time
- show/hide POC
- show/hide VAH & VAL
- show/hide session HIGH, LOW & MID levels
- highlight the periods of time out of the session (silver)
- extend the plotted lines all the way to the right, be careful this can turn the chart unreadable if there are a lot of sessions and lines plotted
SETTINGS
- Session: select between RTH (8:30 to 15:15 CT), GLOBEX (17:00 to 8:30 CT) and FULL (17:00 to 15:15 CT) sessions. RTH by default
- Last 12 hour periods to show: select the deph of the study by adding periods, for example, 60 periods are 30 natural days and around 22 trading days. 1 period by default
- Show POC (Point of Control): show/hide POC line. true by default
- Show VA (Value Area High & Low): show/hide VAH & VAL lines. true by default
- Show Range (Session High, Low & Mid): show/hide session HIGH, LOW & MID lines. true by default
- Highlight out of session: show/hide a silver shadow over the non session periods. true by default
- Extension: Extend all the plotted lines to the right. false by default
HOW TO SETUP
BE AWARE THIS INDICATOR PLOTS ONLY IN THE FOLLOWING CHART RESOLUTIONS: 1, 2, 3, 5, 10, 15 AND 30 MINUTES CHARTS. YOU MUST SELECT ONE OF THIS RESOLUTIONS TO THE INDICATOR BE ABLE TO PLOT
- By default this indicator plots all the levels for the last RTH session within the last 12 hours, if there is no plot try to adjust the 12 hours periods until the seesion and the periods match
- For Globex/Full sessions just select what you want from the dropdown menu and adjust the periods to plot the values
- Show or hide the levels you want with the 3 groups: POC line, VA lines and Session Range lines
- The highlight and extension options are for a better visibility of the levels as POC or VAH/VAL
THANKS TO
@watsonexchange for all the help, ideas and insights on this and the last two indicators (Market Delta & Market Internals) I'm working on my way to a 'clean chart' but for me it's not an easy path
@PineCoders for all the amazing stuff they do and all the help and tools they provide, in special the Script-Stopwatch at that was key in lowering this indicator's execution time
All the TV and Pine community, open source and shared knowledge are indeed the best way to help each other
IF YOU REALLY LIKE THIS WORK, please send me a comment or a private message and TELL ME WHAT you trade, HOW you trade it and your FAVOURITE SETUP for pulling out money from the market in a consistent basis, I'm learning to trade (this is my 2nd year) and I need all the help I can get
GOOD LUCK AND HAPPY TRADING


Volume Buyers-Sellers, by Ricardo Oliveira GonzagaVolume -Buyers & Sellers - use with Volume delta Indicator.

Volume AlertVolume increase alert: triggers an icon and alert when the current volume is X times greater than the previous one. The multiplier value can be adjusted as needed.
Português:
Alerta de aumento de volume: dispara um ícone e alerta quando o volume atual é X vezes maior que o anterior. O valor do multiplicador pode ser ajustado conforme sua necessidade.

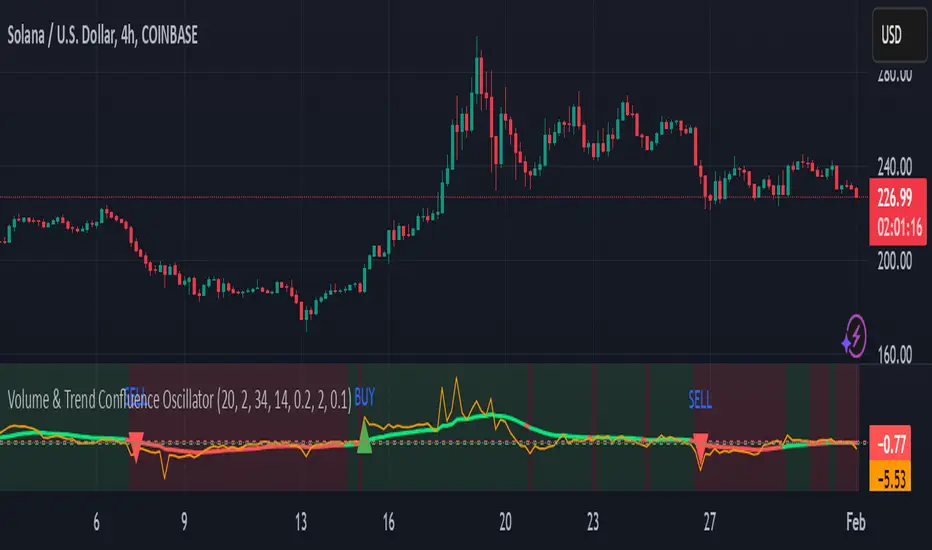
Volume & Trend Confluence OscillatorVolume & Trend Confluence Oscillator (VTCO)
Overview:
The Volume & Trend Confluence Oscillator (VTCO) is a technical analysis tool designed to help traders assess market conditions by integrating volume analysis, momentum, and trend direction into a single oscillator. This indicator provides traders with additional confirmation when evaluating potential trade entries and exits.
Key Features:
Volume Analysis: Calculates a Z-score to detect unusual trading activity.
Momentum Measurement: Evaluates the rate of price change to gauge market velocity.
Trend Confirmation: Utilizes an Exponential Moving Average (EMA) to assess overall market direction.
Signal Filtering: Incorporates minimum movement thresholds and a confirmation period to reduce false signals.
Visual Enhancements: Background shading indicates trend direction, and buy/sell markers highlight key signals.
How It Works:
The VTCO applies a volume multiplier to momentum readings when volume activity significantly deviates from its historical norm. Additionally, it prioritizes momentum moves that align with the prevailing market trend. A smoothing mechanism refines the oscillator’s signal line, ensuring a more stable and actionable output. The indicator generates alerts when key conditions are met, assisting traders in identifying potential trend shifts.
Signal Generation:
Buy Signal: Triggered when the oscillator crosses above zero after an oversold condition, ideally within an uptrend.
Sell Signal: Triggered when the oscillator crosses below zero after an overbought condition, ideally within a downtrend.
Alerts: Configurable alerts notify traders when key market conditions are met.
Usage Considerations:
Works effectively across various timeframes but may provide more reliable signals on higher timeframes.
Best utilized in conjunction with additional technical indicators and risk management strategies.
No indicator guarantees future performance; proper analysis and trade management remain essential.
Disclaimer:
This indicator is provided for educational purposes only and should not be considered financial advice. Trading involves risk, and past performance is not indicative of future results. Always conduct independent analysis before making trading decisions.
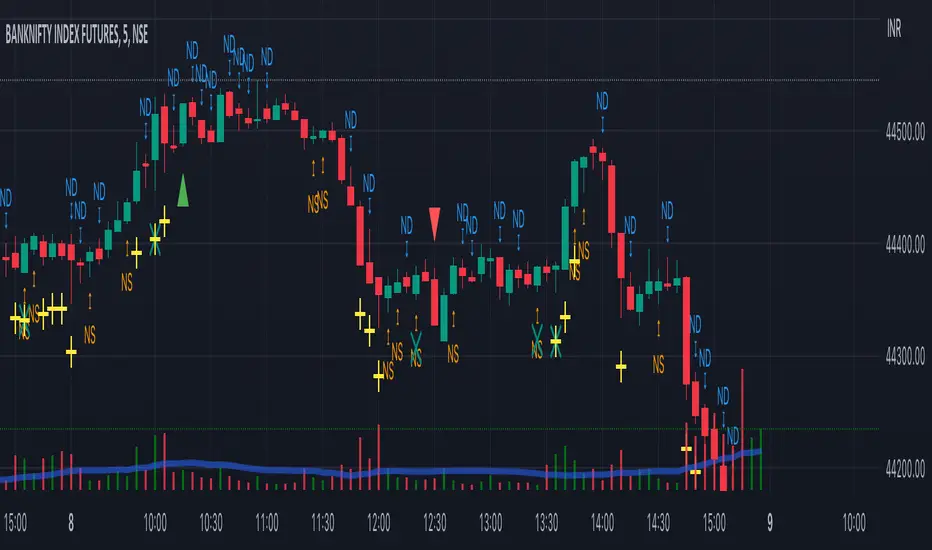
Volume Spread Analysis Candle PatternsVolume Spread Analysis (VSA) is a methodology used in trading and investing to analyze the relationship between volume, price spread, and price movement in financial markets. It was developed by Richard Wyckoff, a prominent trader and market observer.
The core principle of VSA is that changes in volume can provide insights into the strength or weakness of price movements and indicate the intentions of market participants. By examining the interplay between volume and price, traders aim to identify the behavior of smart money (informed institutional investors) versus less-informed market participants.
Key concepts in Volume Spread Analysis include:
1. Volume: VSA places significant emphasis on volume as a leading indicator. It suggests that changes in volume precede price movements and can provide clues about the market's sentiment.
2. Spread: The spread refers to the price range between the high and low of a given trading period (e.g., a candlestick or bar). VSA considers the relationship between volume and spread to gauge the strength of price action.
3. Upthrust and Springs: These are VSA candle patterns that indicate potential market reversals. An upthrust occurs when prices briefly move above a resistance level but fail to sustain the upward momentum. Springs, on the other hand, happen when prices briefly dip below a support level but quickly rebound.
4. No Demand and No Supply: These patterns suggest a lack of interest or participation from buyers (no demand) or sellers (no supply) at a particular price level. These conditions may foreshadow a potential price reversal or consolidation.
5. Hidden Buying and Selling: Hidden buying occurs when prices close near the high of a bar, indicating the presence of buyers even though the market appears weak. Hidden selling is the opposite, where prices close near the low of a bar, suggesting the presence of sellers despite apparent strength.
By combining these VSA concepts with other technical analysis tools, traders seek to identify potential trading opportunities with favorable risk-reward ratios. VSA can be applied to various financial markets, including stocks, futures, forex, and cryptocurrencies.
It's important to note that while VSA provides a framework for analyzing volume and price, its interpretation and application require experience, skill, and subjective judgment. Traders often use VSA in conjunction with other technical indicators and chart patterns to make well-informed trading decisions.
Volume ClusterVolume Cluster aggregates one-minute-based volume information over a specified arbitrary price range as a cluster. In delta mode, the accumulated volume is displayed based on the buy volume/sell volume information.

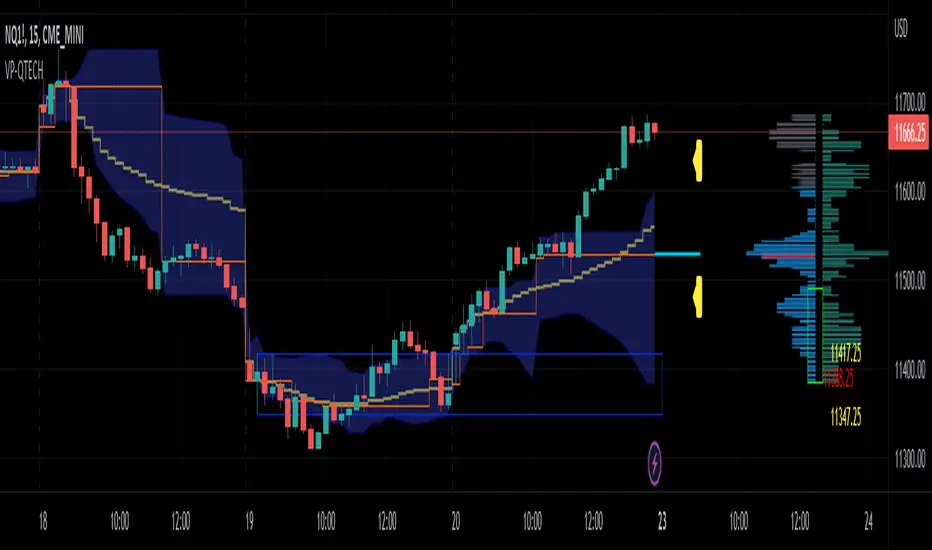
Volume Profile by QTECHtradingVolume Profile by QTECHtrading for the new year 2023
This is a simple version of Volume profile
Features:
- Volume Profile for day trading lower time frame, swing trading or investing with higher time frame
- POC, Developing POC Levels, Previous Levels
- Developing Value Area, VAH/VAL dynamic levels and Previous Levels
- Buy/Sell/Total volume modes
- Auto VWAP for day trading, swing trading, or investing
- Show/Hide all levels
- Custom Initial Balance with BOX
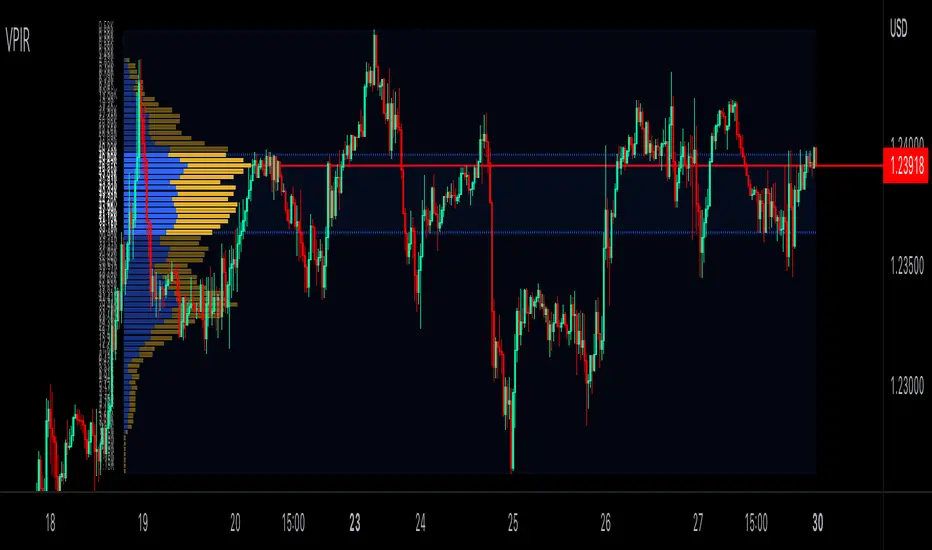
Volume Profile Interactive RangeVolume Profile Interactive Range (VPIR) is a brand new interactive VP enables you to analyze the market in depth.
Interactive mode lets you to set the duration(source) of VP intuitively.
PoC, VA(VAH&VAL) are fully supported.
Volume Profile, Pivot Anchored by DGT - reviewedVolume Profile, Pivot Anchored by DGT - reviewed
This indicator, “Volume Profile, Pivot Anchored”, builds a volume profile between swing highs and lows (pivot points) to show where trading activity is concentrated.
It highlights:
Value Area (VAH / VAL) and Point of Control (POC)
Volume distribution by price level
Pivot-based labels showing price, % change, and volume
Optional colored candles based on volume strength relative to the average
Essentially, it visualizes how volume is distributed between market pivots to reveal key price zones and volume imbalances.

Volume Pressure Arrows[Blk0ut]Volume Pressure Arrows are an innovative (I think) market pressure tool designed to cut through noise and provide traders with a realistic, but quick insight into buying vs selling pressure and which has real control. Rather than relying on any single classic indicator, this script blends five complementary measures of price–volume dynamics—Cumulative Volume Delta (CVD), VWAP distance, OBV slope, ATR expansion, and the DMI ratio—into a unified “pressure score.”
Each component is normalized, weighted, and combined into a single metric that can be read at a glance through intuitive up and down arrows plotted directly on the chart. By transforming multiple complex data streams into a single aggregated signal, Volume Pressure Arrows help traders answer some of the hardest questions we can face: is the current move backed by conviction? is there true momentum? Is price action about to reverse?
Why It’s Different
Traditional oscillators often create conflicting signals, forcing traders to guess which one to trust. This indicator integrates five perspectives on volume and momentum pressure into a single framework, balancing raw flow (CVD), relative positioning (VWAP), trend conviction (OBV slope), volatility expansion (ATR), and directional bias (DMI). The result is a weighted, probability-minded score capped between -100 and +100 for consistency and clarity.
Important note : Inspiration for the use of directly plotted arrows came from dgtrd "https://www.tradingview.com/u/dgtrd/" and their brilliant work on LazyBear's Squeeze Indicator "https://www.tradingview.com/script/Dsr7B2xE-Squeeze-Momentum-Indicator-LazyBear-vX-by-DGT/"
How to Read It
Bullish Arrows appear below the candles when the pressure score pushes above the neutral threshold, signaling meaningful buyer dominance.
Bearish Arrows appear above the candles when pressure drops below the negative threshold, indicating strong selling pressure.
Neutral Arrows (smaller, faded) mark conditions where pressure exists but is not decisive—useful for spotting early rotations or fading momentum.
Color Gradients dynamically adjust with score intensity, making stronger signals visually brighter and weaker ones softer.
How to Use It Effectively
This tool is best applied as a confirmation and timing layer. It is not meant to replace your core strategy, but to validate whether momentum pressure supports your trade thesis.
Combine with trendlines, chart patterns, or breakouts to gauge conviction.
Use bullish or bearish arrows as filters, only take trades when price action aligns with strong directional pressure.
Watch neutral arrows near key levels; they often foreshadow balance breaking into directional moves.
Adjust the weightings to emphasize the components that matter most to your style (e.g., more weight on CVD for scalpers, or ATR expansion for volatility traders).
As with any indicator, this is not a magic ball and does not guarantee success. But it does allow you to increase the probability odds to your favor if you align it with your edge. Happy trading!
