Cari dalam skrip untuk "volume"

Volume Color Bar (KETT)Highlights important bars with increased volume during the selected period. It is convenient to use for building a trend line or strong levels.

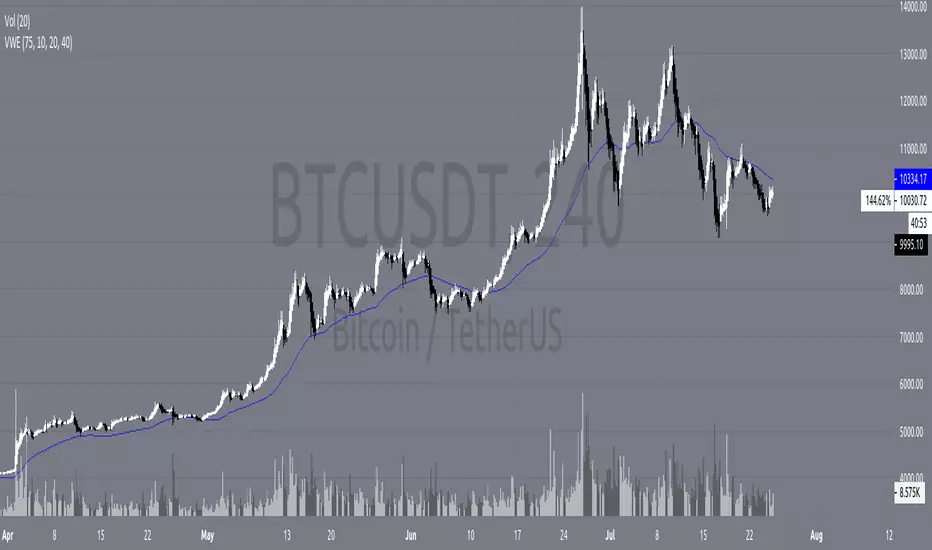
Volume-Weighted Indicators VWMA/VWAP/EMA_by WWAs traders and investors now urge to console volume factors into their price action analysis. This script is an attempt to combine volume-weighted moving average (VWMA), volume-weighted average price (VWAP), along with the exponential moving average (EMA). I have found that this indicator works quite well with the stock market.
How to use the indicator:
Buy when the VWAP and EMA lines crossing up VWMA.
Sell when the VWAP and EMA crossing down each other OR both VWAP and EMA crossing down VWAP
Any modificatio is welcomed, but please let me know.
Volume, Simple Relative Volume HighlightThis script plots volume bars and highlight bars that have an unusual activity, compare to the average (Standard: Simple Moving Average, 50 periods).
The script is useful for checking daily volume levels on equities. Where there is high volume, there is likely volatility, wich is good for day trading and swing trading entries.

Volume Moving Average - evoThis script shows regular volume bars with two separate moving averages using only bullish and only bearish candles. The moving average uses the last known value of its calculation.
Using the Heikin Ashi function will smooth the colors and moving averages (good for trends):
The crossovers are a good way to see what the dominant direction of a trend is, if you test them on your time frame and instrument they might be good to trade on their own, I have not tested this and the default settings are not tuned for that.
As always, let me know if you like it or found a good way to use it :)

Volume xSMA ModSimple Volume indicator. showing rounded ratio of Current volume and simple moving average as xSMA (read as times SMA).
Quick metric to understand the impact of volume in trends, etc.
Example:
if Vol = 50 and SMA = 5
xSMA = 50/5 = 10
Indicated as the Third Number in Volume label.

Volume AccumulationA simple tool that accumulates the trading volume of an instrument for a specified period of time.
Available modes:
Minutely
Hourly
Session
Daily
Monthly
Quarterly
Yearly

volume low standard deviation stystemOn the basis of moving average, add moving average and standard deviation line of volume to filter the entry and exit time.
Filter entries and/or exits based on low volume
options = 1, no not enter on low volume
options = 2, exit on low volume
options = 3, both 1 and 2
For others, please refer to the code and notes。

volume high standard deviation stystemOn the basis of moving average, add moving average and standard deviation line of volume to filter the entry and exit time.
Do not enter trades on high volume and price in trend direction.
Exit on high volume and price in profitable direction.
Option 0 = No entry or exit filter
Option 1 = Entry filter only
Option 2 = Exit filter only
Option 3 = Both entry and exit filters

Volume Body CandlesEnglish description:
This script sets the transparency of candles body according to volume, using two metohds:
- Exact Volume of certain candle
- EMA of Volume from given candles back
Default setting are 'EMA of Volume' with 14 candles back.
If you have other scripts changing colors of candles, please turn them off to see the effect of this one.
This script is invite-only for the members of our trading group (info in signature).
---------------------------------------------------------------------------------------------------
Polish description:
Niniejszy skrypt ustawia przezroczystość korpusów świec zależnie od wolumenu, przy użyciu dwóch metod do wyboru:
- 'Exact Volume' czyli dokładnie ten sam wolumen jaki wystąpił na danej świecy
- 'EMA of Volume' czyli średnia EMA z wolumenu z ustalonej ilości świec wstecz.
Domyślnymi ustawieniamim są 'EMA of Volume' z okresu 14stu świec wstecz.
Jeśli masz włączone jakieś inne skrypty zmieniające kolory świec, proszę wyłącz je, lub wyłącz w nich ustawienia kolorujące świece, aby zobaczyć efekty tego skryptu.
Skrypt jest publikowany na zasadzie invite-only(konieczność przydzielenia dostępu na TradingView), a zatem dostępny jest tylko dla aktywnych użytkowników naszej grupy traderskiej, do której link można znaleść w mojej sygnaturze poniżej.

Volume LogA comfortable Volume Indicator with the following features:
Darker colors indicate positive changes
Light colors indicate negative changes
There are separate colors for changes above a configurable threshold
The threshold can look at percentages changes in either volume (directly) or the volume at log scale.
The graph itself is always displayed in regular format so the numbers indicate real value.
All the colors, log scale as well as the threshold are configurable through the visual interface.

Volume ComparisonThis script shows the volume of the current chart relative to the volume of another selected ticker.
For meaningful information you should compare coins with the same base pair (for example BTCUSD against LTCUSD).
Volume bars will be plotted green if the other security's volume is higher, red otherwise.
You may use this script go generate alerts and automate your trading with a bot such as WolfBot.org

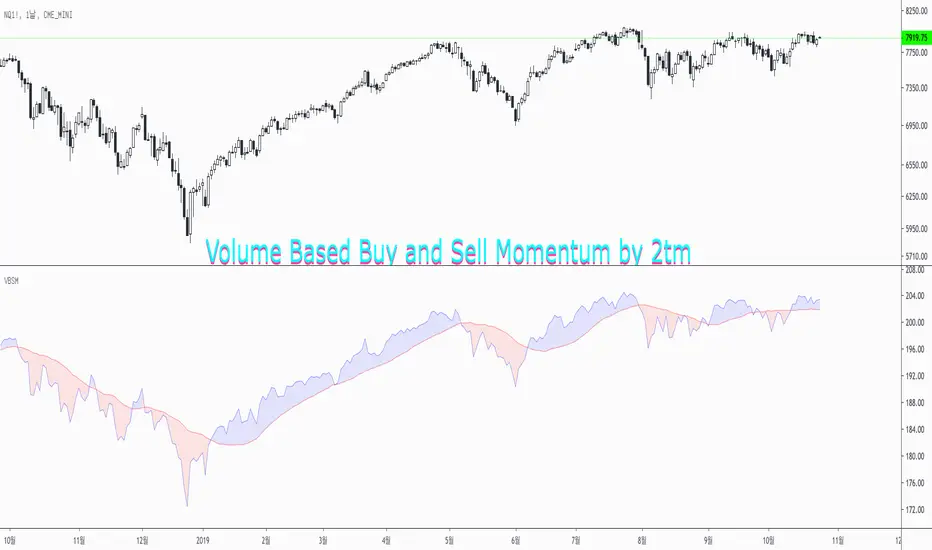
Volume Based Buy and Sell Momentum by 2tmThis is Volume based Buy and Sell Momentum script.
Basically I'd just adjusted PVI and NVI
But It's easy to understand current Volume trends and Momentums
Thank you and Wish your successful investment.
Volume ⨃ αMomentum 🦝🦾First attempt playing around with mixing volume and momentum... I find it to be nonsense, but putting it up for the moment.

Volume with directionOscillator plots cumulative volume with direction defined by price (positive price change = positive volume and vice versa) divided by volume sma.
It is good for divergence indication and can be used for trend change prediction.
It is faster then stoch with the same length.

Volume SpikeDetect current bar's volume is at least Ratio times than average volume of previous "Look back" bars.

Volume ValueInstead of the Volume this plots the closure price times volume, hence the Value.
Useful in study of long term phenomenons.
Volume @PuppyTherapyWell, you know what its Volume but I don't color it based on price but it just stays grey the moment it reaches a critical threshold level it is orange and spikes are very much red.
You can also set alerts on those spikes to make sure you are not missing the action.

Volume Flow v3DepthHouse Volume Flow indicator is used to help determine trend direction strictly based on Negative and Positive volume data.
How to Read:
- Moving Average crossovers are used to help determine a possible trend change or retracement.
- The area cloud on the bottom is calculated by the difference of the moving averages. This could be used to help determine the trending volume strength.
- Bright colored volume bars are large volume spikes calculated by the x factor in the options.
Other changes:
- DepthHouse is going open source with numerous of its indicators. This is only one of many!
- Volume is now displayed without being altered for calculations.


Volume moving indicatorHi guys,
This is a multiple Volume MA script. Editing is free for use.
You can use several ma lines by adding one indicator only, and I put 10,20,30,60,100,200 as a threshold which I frequently use.
It is made as an open source at any time possible, so that you are free for playing with it. Even you can add more if you are keen to do so.
Cheers,
JB
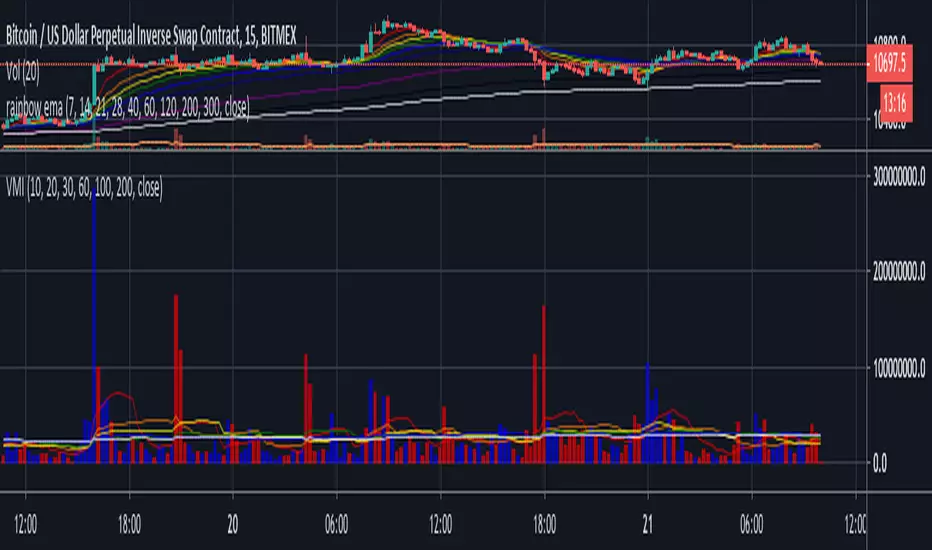
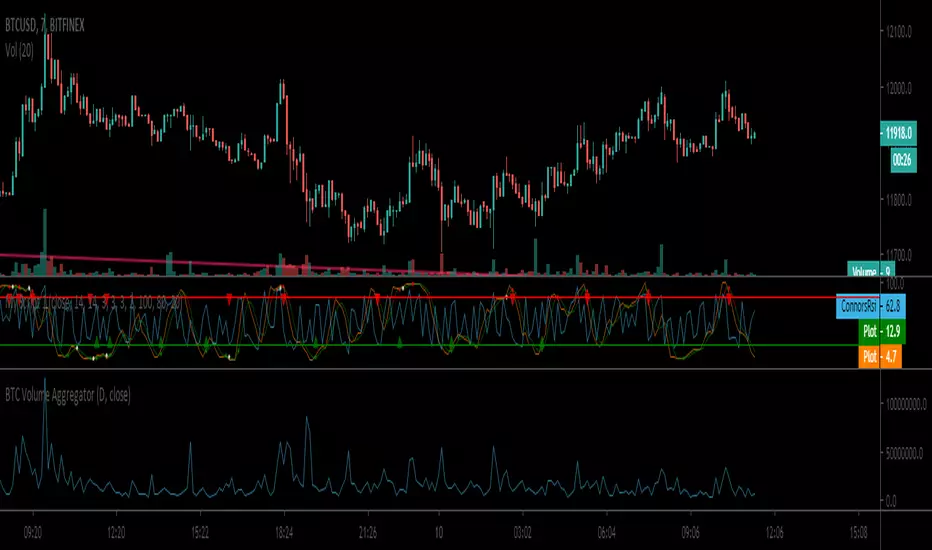
BTC Volume Aggregator"Volume Aggregator" indicator gathering the volume data from usd markets usdt markets and contracts. I will expand is euro, Korean and china pairs.
Volume Weighted EMAAn EMA using the Volume Oscillator to integrate volume fluctuations into the EMA calculations.
Especially useful for Crypto and Forex